
Abstract
The importance of walking, the most basic form of transportation, is growing. Climate change and the associated warmer temperatures could reduce comfortable walking distances drastically. There is a clear need to better understand how outdoor thermal comfort (OTC) and walking interact. In this work, thermoregulation of the human body is modeled with the two-node model to determine the influence of the microclimate on pedestrians’ OTC. First, the impact of the current microclimate in Zurich on the route choice of pedestrians is analyzed. No significant correlation is found between simulated OTC of walking a particular route and route choices for all trips, but results for longer trips indicate a possible influence of OTC. It is pointed out that the same assessment could be done for other regions, and the results could contribute to more accurate pedestrian modeling. Second, a tool is developed that can estimate OTC-corrected walking distances from any location. The tool is applied to the current climate and future climate scenarios. The results show that, in the future, OTC of pedestrians in Zurich will be severely decreased. Further, the tool can detect where there is potential for and, through its accessibility approach, quantify improvements to the built environment citywide. Future work should focus on enhancing physiological input parameters to the model. This work provides a novel use of the two-node model for walking subjects in a citywide assessment.
Keywords
With the revival and reurbanization of inner cities around the globe, walking, the most basic form of transportation, has become a topic of growing interest over the last decade. For certain use cases, walking can be considered superior to other modes, as it does not come with negative externalities of emissions, landscape aesthetics, and space consumption ( 1 ). It further includes positive externalities on the individual level, such as physical and mental health ( 2 ), and can provide recreational value. For urban and transport planners, it is essential to know how to assess whether cities are walkable and where improvements should be targeted. Following Sim ( 3 ), walkability can be defined as being “about accommodating walking, making it easy, efficient, and enjoyable.” The topic of walkability has been extensively addressed by the literature ( 4 – 9 ). For instance, walkability is enhanced by land-use diversity and density, nearby green areas, and less traffic. Reflecting on the existing research, one aspect which is often neglected when measuring walkability is the OTC of the pedestrian. Walkability comprises the influence of quality; in contrast, the term “accessibility” stands for the quantitative number of opportunities ( 10 ). Low OTC can restrict both walkability and accessibility. Evaluating OTC becomes of growing importance in the face of the global climate crisis. Public health is threatened by more frequently occurring, longer lasting, and fiercer heatwaves, especially in urban areas where the urban heat island effect (UHI) occurs ( 11 , 12 ). UHI describes the phenomenon of difference in air temperature between urban and rural areas caused by greater absorption of solar radiation from multiple reflections in the built environment, as well as greater uptake and delayed release of heat by buildings and paved surfaces, among others ( 13 ). Older people, with their reduced capacity for thermoregulation, and people with cardiovascular diseases are especially at risk ( 11 , 14 ). The official Swiss Climate Change Scenarios ( 15 ) indicate potential temperature increases in the summer months of 6°C for 2060 under the RCP8.5 scenario. Many studies have modeled OTC for a steady state of walking activities and environmental conditions (e.g., Mahmoud [ 16 ]). The results are typically maps that indicate which places are comfortable and which are not ( 17 ). However, none of the existing research has connected OTC, measured with dynamic environmental states that are mapped to the spatio-temporal dimension of a given pedestrian trajectory, to the concept of walkability or accessibility.
This paper focuses on the dynamics of OTC for pedestrians in the city of Zurich, Switzerland. It aims to answer the following questions:
How does OTC affect pedestrians’ route choice on warm days in Zurich?
How does OTC restrict pedestrians’ accessibility in Zurich today and in the future?
To do so, in a first step, we set up a data processing pipeline allowing us to estimate OTC by employing the implementation of the two-node model from Melnikov et al. ( 18 ). The relevant microclimate data for the city of Zurich is then calculated. We then conduct a descriptive analysis using real-world GPS pedestrian tracks to investigate how OTC affects the route choice in an urban environment. Finally, we present an OTC-corrected accessibility planning tool that uses an OTC-corrected routing engine to predict how far pedestrians can walk comfortably facing current and predicted temperature conditions.
The remaining paper is structured as follows. The next section, “Related Work,” provides the theoretical foundation of the human thermoregulatory system, OTC assessment, and findings on pedestrian route choice. We then present the methodology. The results of the descriptive route choice analysis and the OTC-corrected accessibility planning are presented in successive sections. The final section discusses the results and concludes the paper.
Related Work
Human Thermoregulation and the Two-Node Model
In this work, we model the human thermoregulatory system (HTS) with the implementation by Melnikov et al. (
18
) of Gagge’s two-node model (TNM) (
19
). In the TNM, the human body is divided into two concentric shells: the interior core with uniform core temperature

Both the produced

Heat loss is achieved by convection

Skin Wettedness
The existing literature reveals that, in cold environments, thermal discomfort has a high correlation with skin surface temperature. In hot environments or while exercising, it is more related to sweating (
21
,
22
). Sweat is produced to keep the HTS in balance by evaporation. The share of skin surface needed to evaporate the produced sweat is called skin wettedness

with
Pedestrian OTC Assessment
OTC can be defined as “the condition of mind that expresses satisfaction with the outdoor thermal environment” ( 25 ). There are several metrics to assess OTC, which are based on the TNM. The most widely used is that of physiologically equivalent temperature (PET) ( 26 ). An important feature of this index is that it provides a “feels-like” temperature, allowing the effect of the microclimate to be compared with the thermophysiological state of a person. Further, it considers a steady physiological state, which is reasonable for indoor conditions but barely the case for outdoor environments because of the significant variation of microclimate conditions and the diverse activities people perform outdoors. This is why thermal history, dynamic exposure, and the activity of a person are critically important to assess instantaneous and dynamic thermophysiological states. Existing studies using PET differ significantly in their results on comfortable temperature ranges because they lack these aspects ( 27 ). Some scientists have extended the TNM to overcome these fundamental limitations. Lai et al. ( 27 ) “developed a human heat transfer model that considers outdoor radiative heat exchange and transient heat transfer in clothing.” Their overall results were satisfactory, but during hot conditions the error in prediction of skin temperature was as much as 6°C. An extension of Gagge’s TNM that is validated for a wide range of warm thermal environments is provided by Melnikov et al. ( 18 ). With their modified model for skin blood flow, they accurately predicted skin temperature in unsteady conditions for measured data on 15 subjects.
Pedestrian Route Choice
Pedestrian route choice has been studied by scholars from different sectors like public health ( 2 ), real estate ( 28 ), pedestrian interaction modeling ( 29 ), and pedestrian infrastructure design ( 30 ). From a perspective of urban and transport planning, this paper aims to understand how the micro-built environment affects walking route choice, since this is the prerequisite for improvement. Existing studies are based on stated preference (SP) and revealed preference (RP) data, where the latter is considered to provide a better representation of real-world behavior ( 6 ). Numerous studies show that trip length is the primary determinant for choosing a particular route ( 4 , 6 , 31 ). Broach and Dill ( 5 ) used 1,167 GPS tracks realized by 283 adults (average trip length = 875 m) and compared several route attributes with those of possible alternatives. They found that higher traffic (+14%), lack of crossing infrastructure (+73% for major roads), and primarily steep uphill gradients (+99%) increase perceived walking time. Neighborhood having commercial land use reduced the perceived walking time by 28%. Guo ( 4 ) observed subway egress trips and found that steepness and parks have a large effect on utility, while sidewalk width, intersection density, and neighborhood businesses only have a minor influence. Erath et al. ( 8 ) estimated elasticities for walking time based on SP and RP data. Among other variables, they found that active window frontages and relevant greenery reduced perceived walking time by 17.5% and 23%, respectively. A recent study from Salazar Miranda et al. ( 9 ) using GPS tracks found that pedestrians systematically deviate from their shortest path. They do so to walk on streets that are close to parks, with more business establishments, and with urban furniture.
If humans cannot cope with the stress caused by the microclimate and their physiological responses, they must adapt their behavior (
32
). Several studies confirm that pedestrians incorporate behavioral adjustments to maintain their HTS in balance. Lee (
33
) found that it was not air temperature
Methodology
Estimation of the Microclimate Conditions
According to various studies,
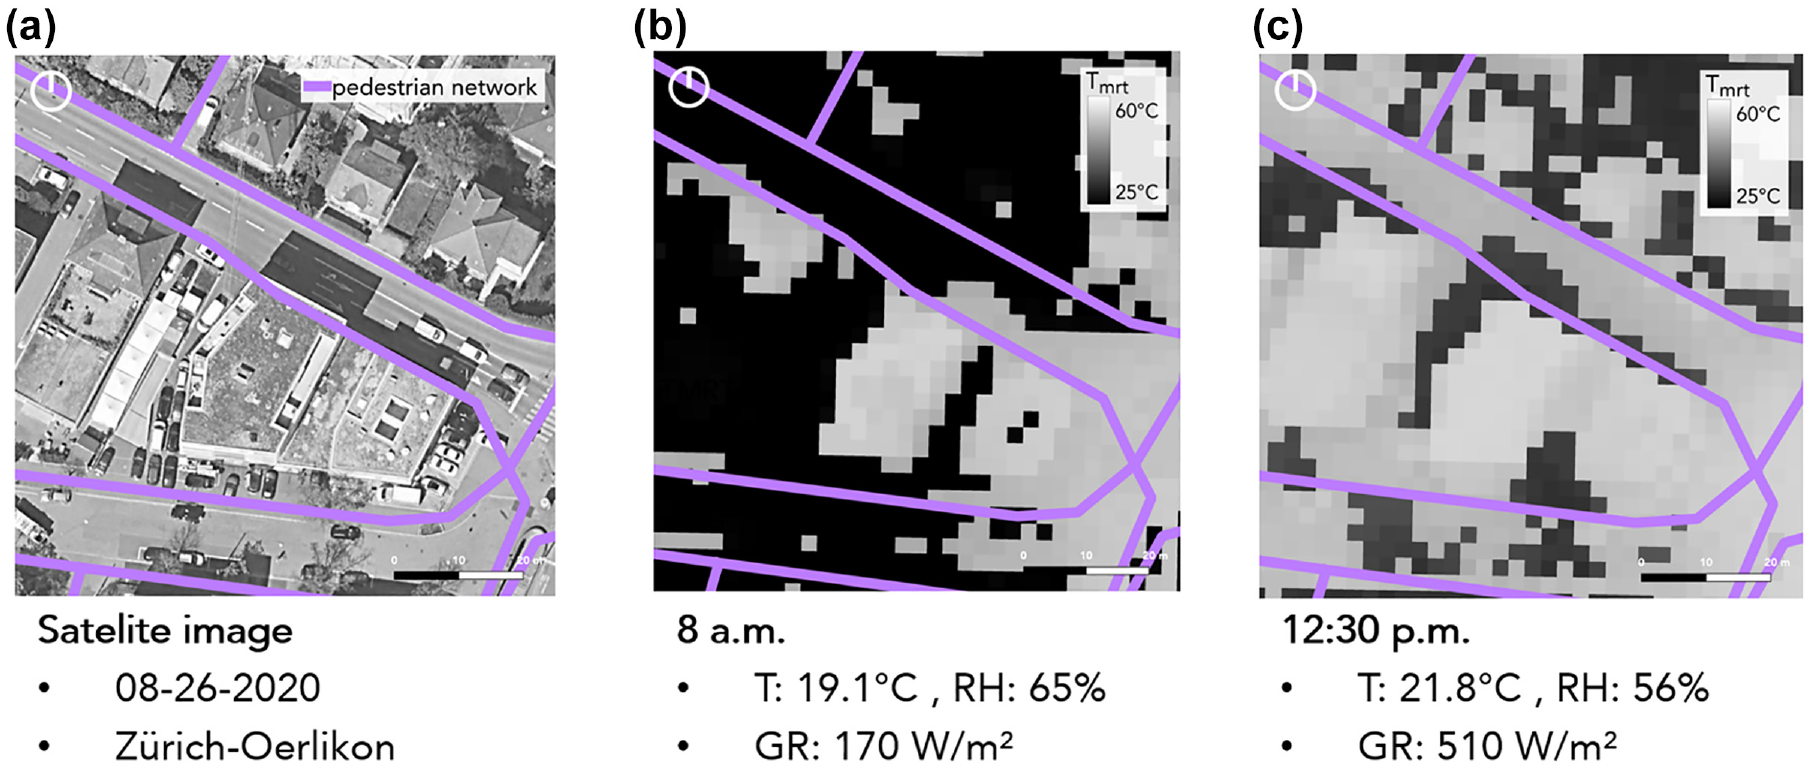
Mean radiant temperature on a 2.5 × 2.5 m resolution for a sample location in Zurich: (a) satellite view, (b) at 8:00 a.m. and (c) at 12:30 p.m.
Model for Metabolic and Mechanical Work Rate
Metabolic
where

where
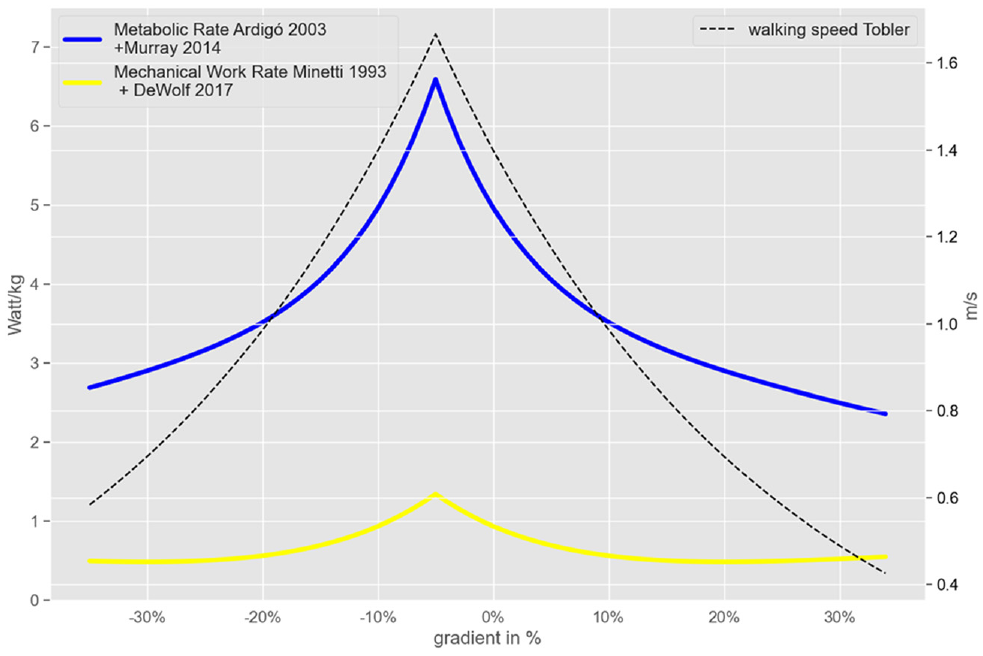
Estimated model of metabolic rate and mechanical work rate for different walking-speed/gradient pairs.
Descriptive Pedestrian Route Choice Analysis
OSMnx is used to create a routable network from the pedestrian network provided by the City of Zurich. The pedestrian network utilized is composed of 54,608 edges and 17,582 nodes. With elevation data sourced from the Google API (
39
), the gradient of each edge is calculated. The network is enriched with several (built environment) attributes which have been identified as relevant from the literature. The attributes are sourced from OpenStreetMap (OSM) and the City of Zurich. They include 4,639 business establishments (containing shops and food and beverage facilities), 7,867 urban furniture elements (including benches, trash bins, drinking water fountains, and public toilets), 73,042 trees (registered in the public cadaster), and neighboring parks and urban forests (see Figure 3). Business establishments are assigned to the corresponding edges of the pedestrian network if they are within a range of 20 m. This means that for two-lane streets the establishments on the other side of the street are also considered, which makes sense because of the ease of crossing such streets. The other features are assigned in a 10 m range because it is assumed that they only contribute to the attractiveness if they are close to the pedestrian. Furthermore, the network is enriched with the average weekday traffic (AAWT, in the following, “traffic”), provided by the Federal Department of the Environment, Transport, Energy and Communications (
45
) with around 60% network coverage. The traffic data contains the street’s centerline and is assigned to the edges using a 20 m range. This considers a maximum of three lanes per direction which occurs at intersections, for example (streets with higher hierarchy have one centerline per direction, so 20 m is adequate). Finally, the share of conveniently walkable gradients, that is, defined as −5% to 1% because of the ratio between
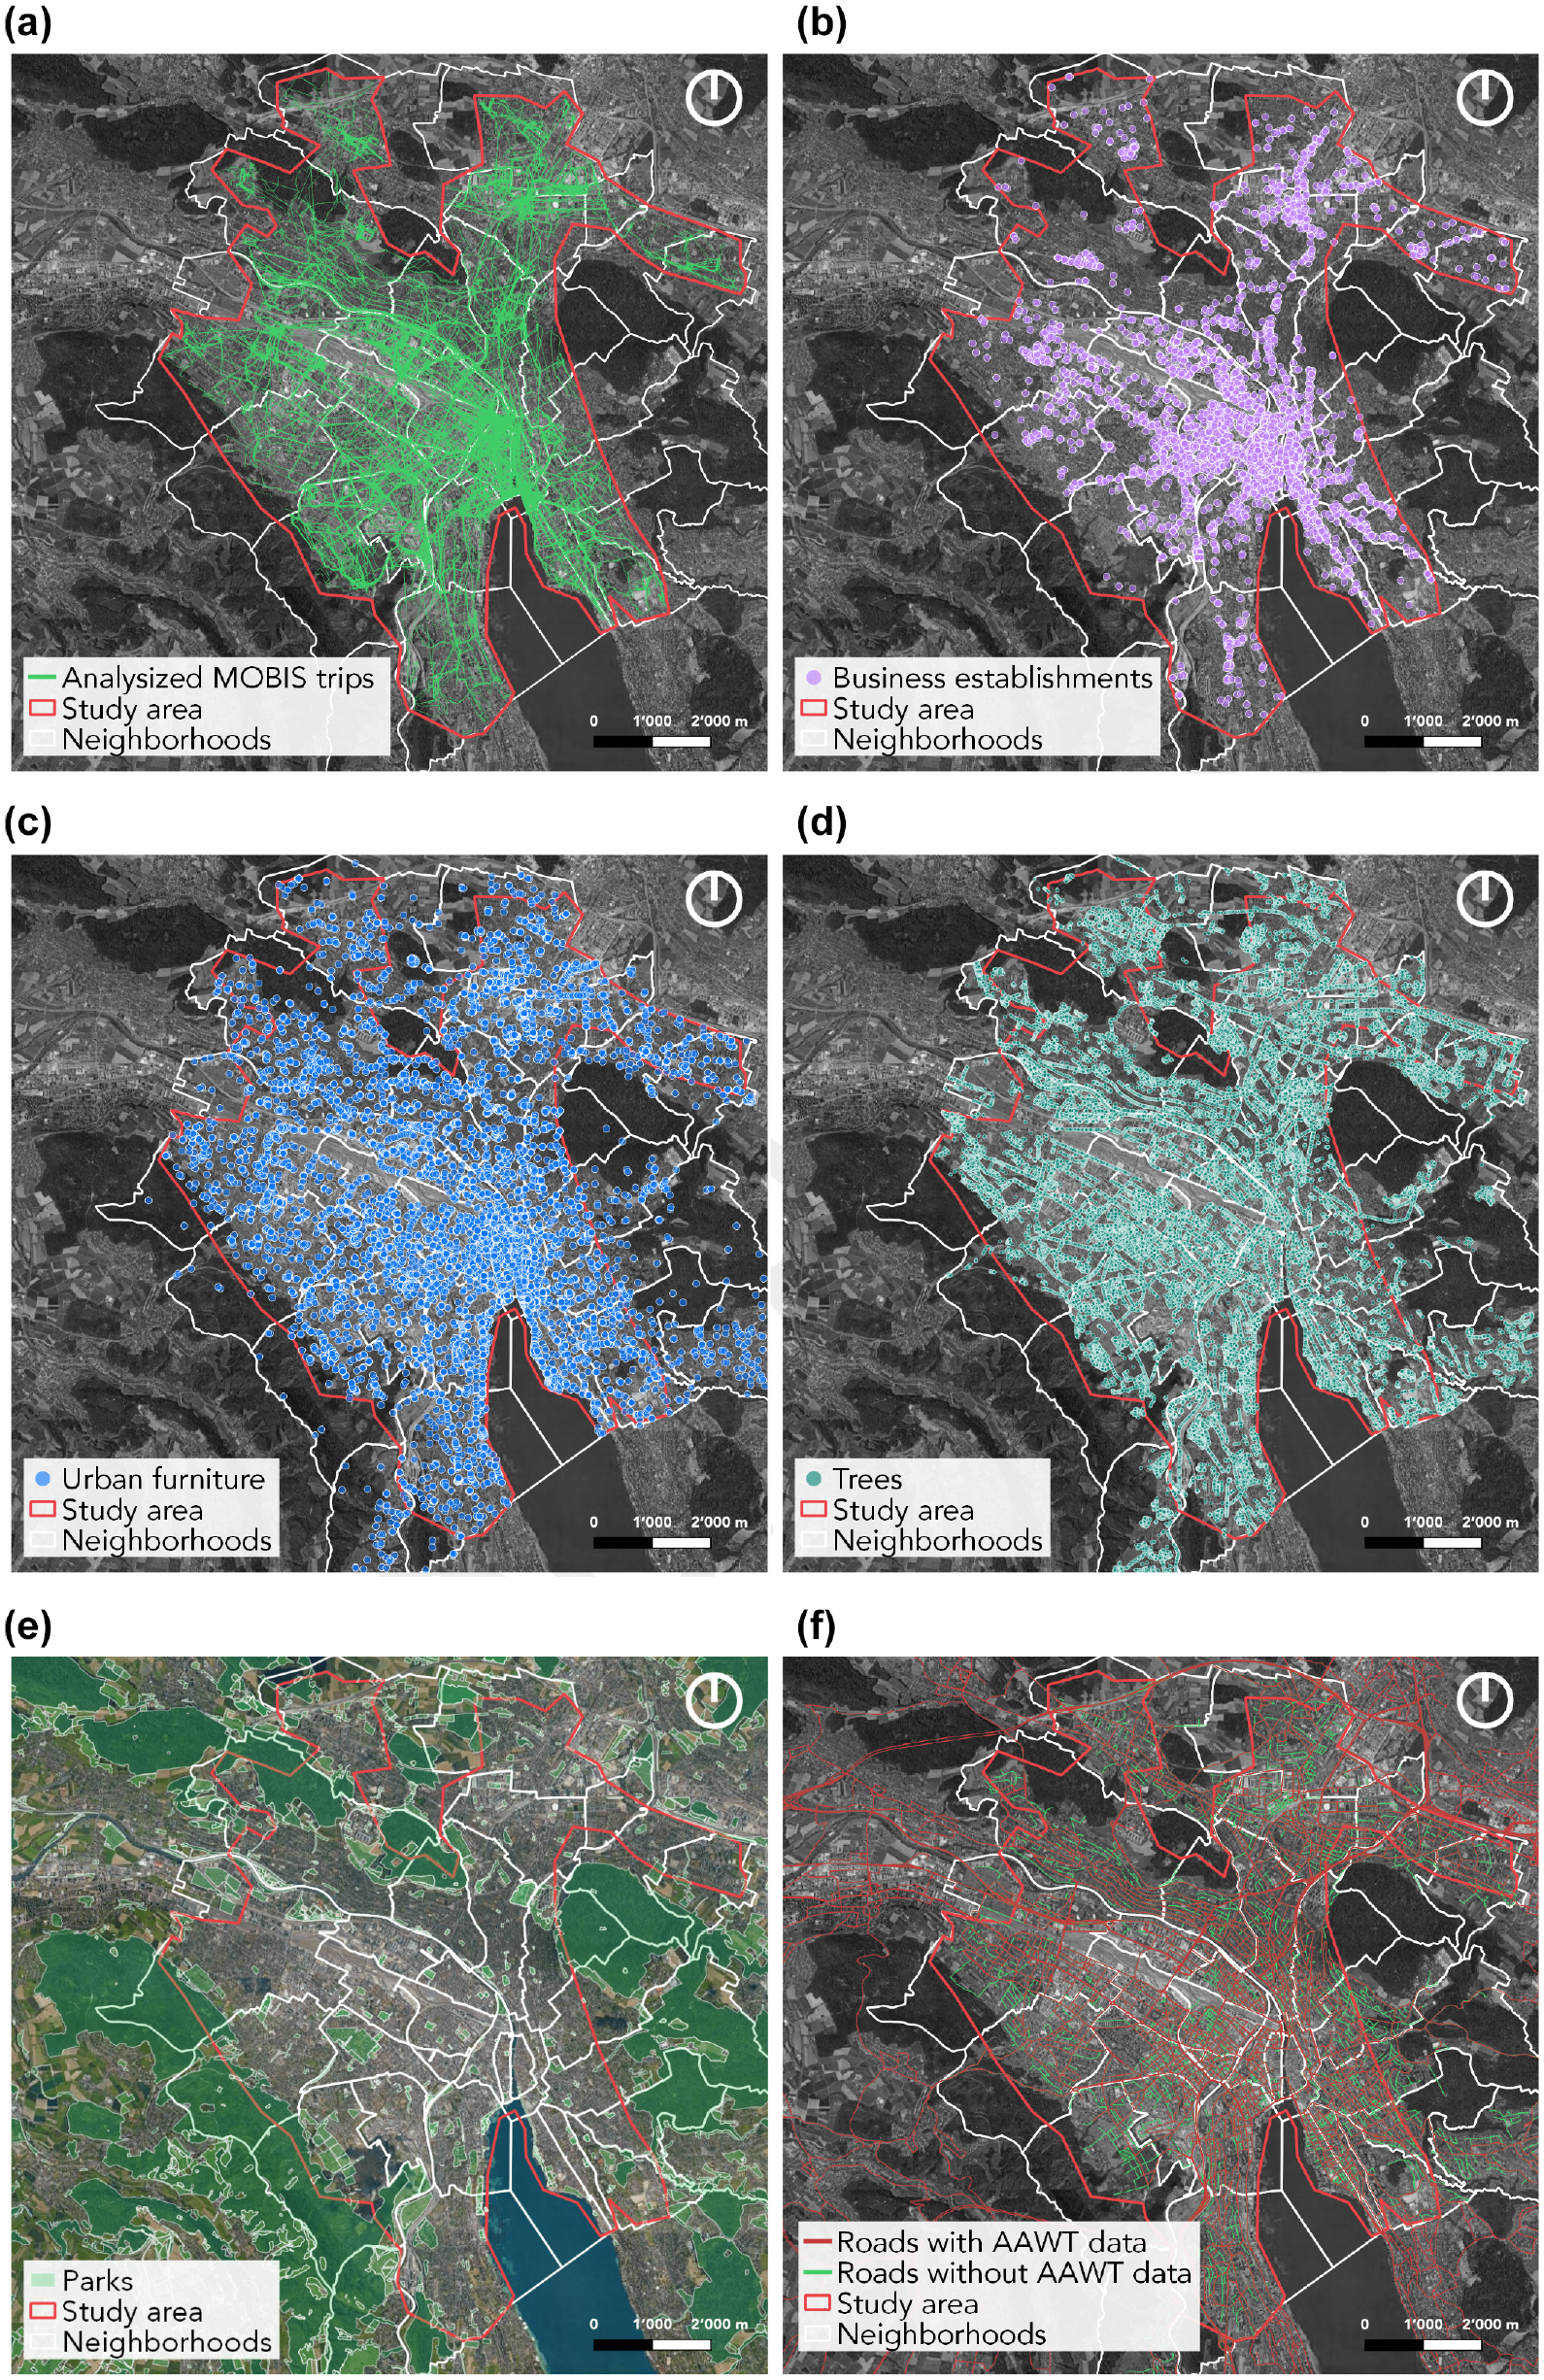
Study area, part of the city of Zurich: (a) analyzed trips within study area, (b) built environment attributes: business establishments, (c) urban furniture, (d) trees, (e) parks and urban forests, and (f) average weekday traffic (AAWT).
The trajectory data used for this work comes from the MOBIS-COVID project, an app-based GPS-tracking travel diary study (
46
). The built environment and OTC-related attributes of these trajectories are compared with the same attributes of the shortest path of the respective origin–destination pair. The study area does not contain the whole city of Zurich (see Figure 3) but only the parts that contain the majority (94%) of the trajectories because of computational constraints. The 70 warmest days in 2020 are selected for the analysis. These days fall into the time after the “soft lockdown” in Switzerland, when no differences to pre-pandemic travel patterns for walking can be observed (
47
). For the 70 days, the microclimate is calculated between 8:00 a.m. and 8:00 p.m. in 90 min steps because of the computational capacity of the
OTC-Corrected Accessibility Planning
The developed tool enables users to calculate the OTC-corrected maximum walking area from every given point in the city. The pedestrian network of the city of Zurich is also used here, but the maximum edge length is set to 30 m to obtain more accurate results. To calculate the isochrones from each point of interest, the shortest paths are calculated to all other nodes in the network, reachable in a defined walking time. The walking speed is assumed to be gradient-dependent, defined by Tobler’s (
50
) hiking function. The assignment of the microclimate to the network and the clothing are done in the same way as in the descriptive pedestrian route choice analysis. Additionally, it is assumed that
The tool’s usefulness is demonstrated by evaluating two of the municipality’s community centers for different climate scenarios. One community center (CC) is that of Bäckeranlage, a dense urban district with relatively narrow street canyons. The other is Oerlikon, selected because new developments on former industrial production sites representing contemporary common building practice are within a 20 min walking radius of the CC. The area enclosing all comfortably reachable edges and the number of persons living in this area within 20 min walking time of the CC are assessed.
The tool draws on estimating the thermoregulatory model and derivation of microclimate zones from the previous route choice analysis. Median and hottest scenarios are based on the already computed microclimate for the 70 warmest days in 2020. As mentioned earlier, the average daily maximum temperatures are expected to increase drastically in the future. Therefore, the RCP4.5 and RCP8.5 for 2060 are additionally evaluated from the official Swiss Climate Change Scenarios National Centre for Climate Services (
15
). The mean daily maximum temperature increase in August from these scenarios (3.5°C for RCP4.5 and 5.6°C for RCP8.5) is added to the hottest temperature measured in 2020. The represented quantitative and qualitative evaluation focuses on the time of day with the highest solar radiation and thus highest
Discussion of Results on Descriptive Pedestrian Route Choice Analysis
Thermal Comfort
Table 1 shows the comparison between the statistics of the chosen and shortest path. Mean
Overall Results for Chosen Path Versus Shortest Path
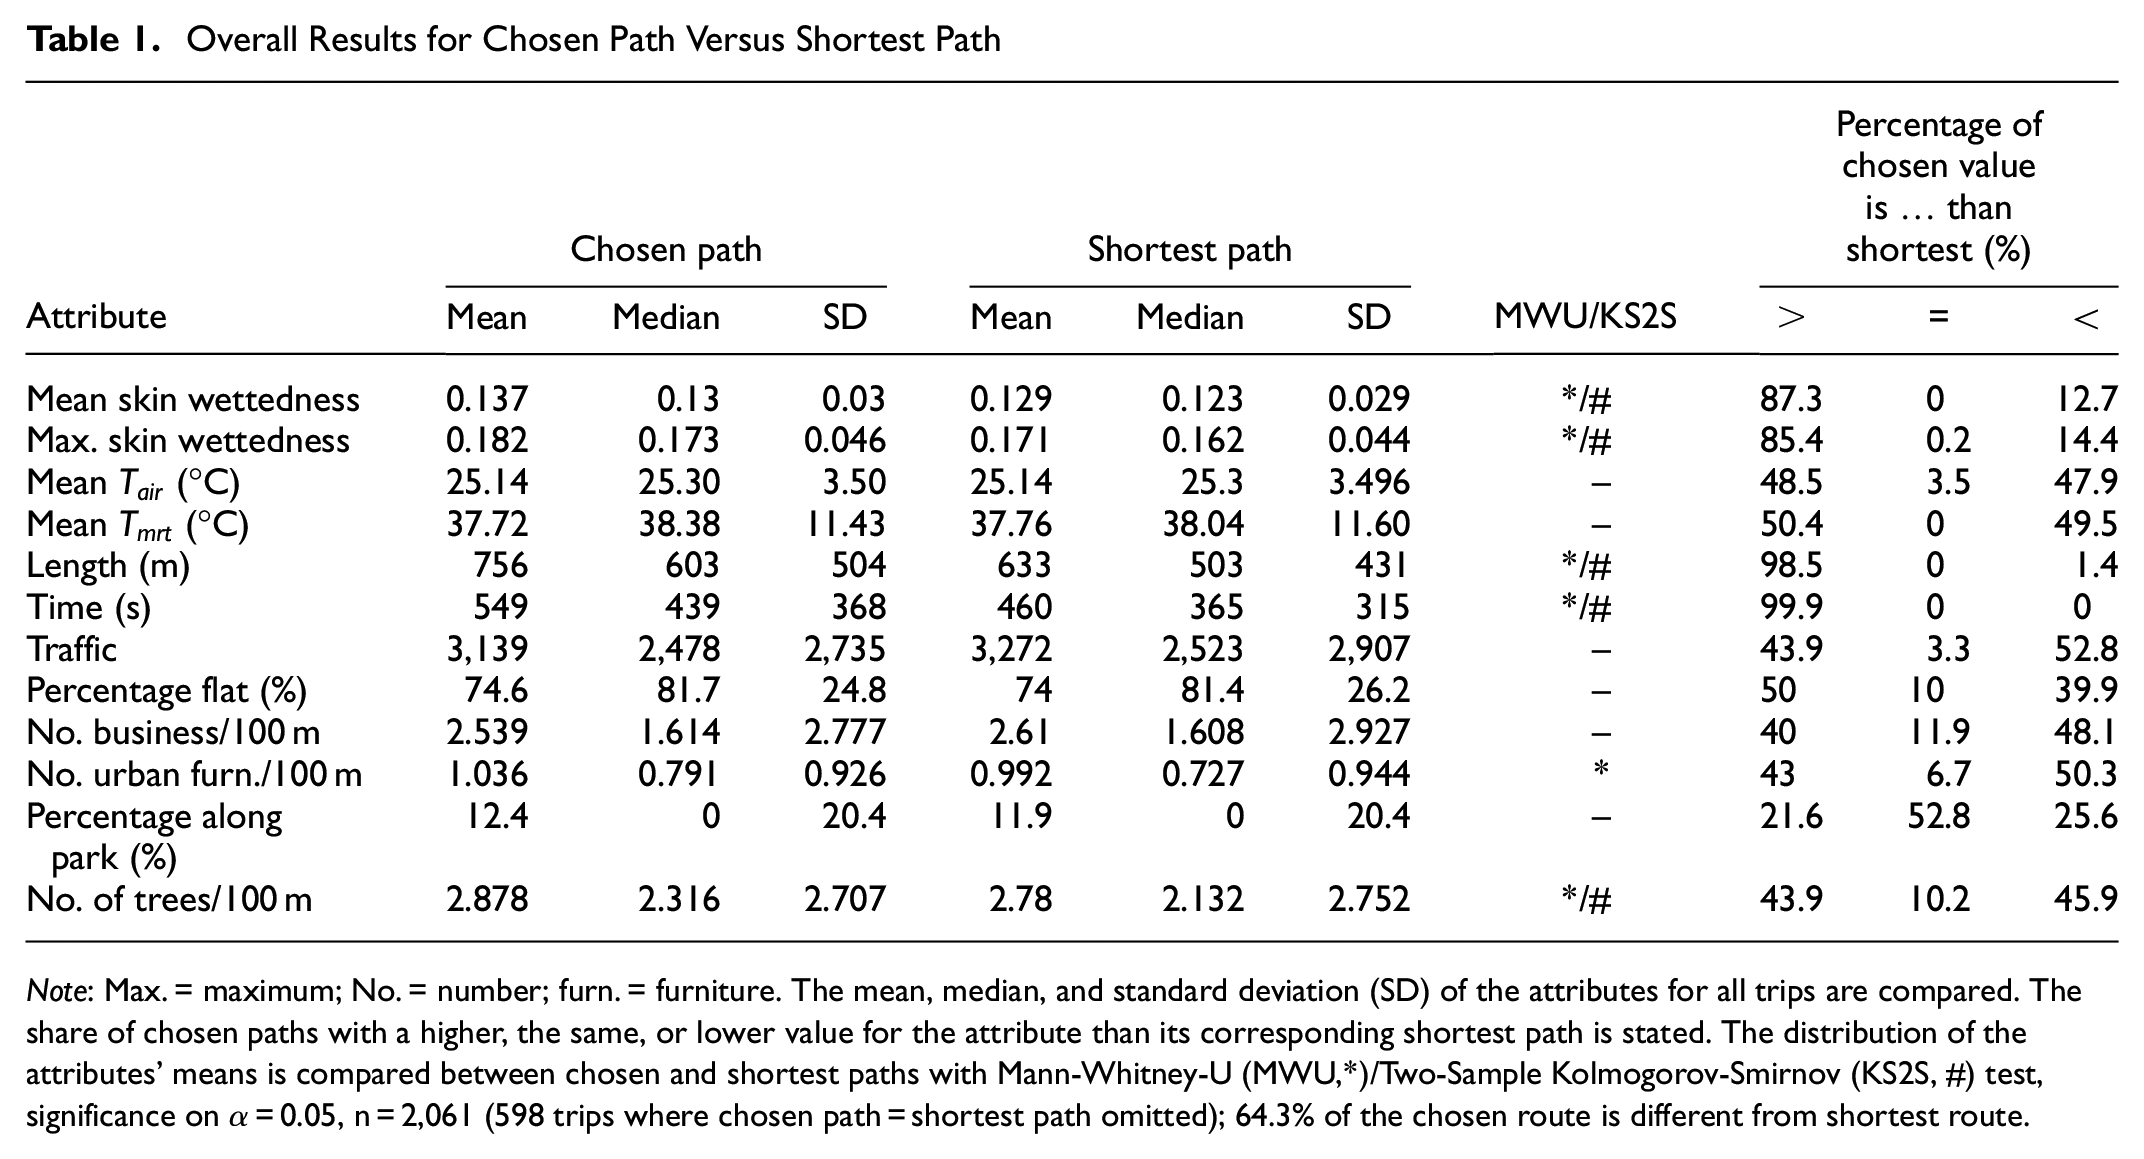
Note: Max. = maximum; No. = number; furn. = furniture. The mean, median, and standard deviation (SD) of the attributes for all trips are compared. The share of chosen paths with a higher, the same, or lower value for the attribute than its corresponding shortest path is stated. The distribution of the attributes’ means is compared between chosen and shortest paths with Mann-Whitney-U (MWU,*)/Two-Sample Kolmogorov-Smirnov (KS2S, #) test, significance on
Results for Longer Trips
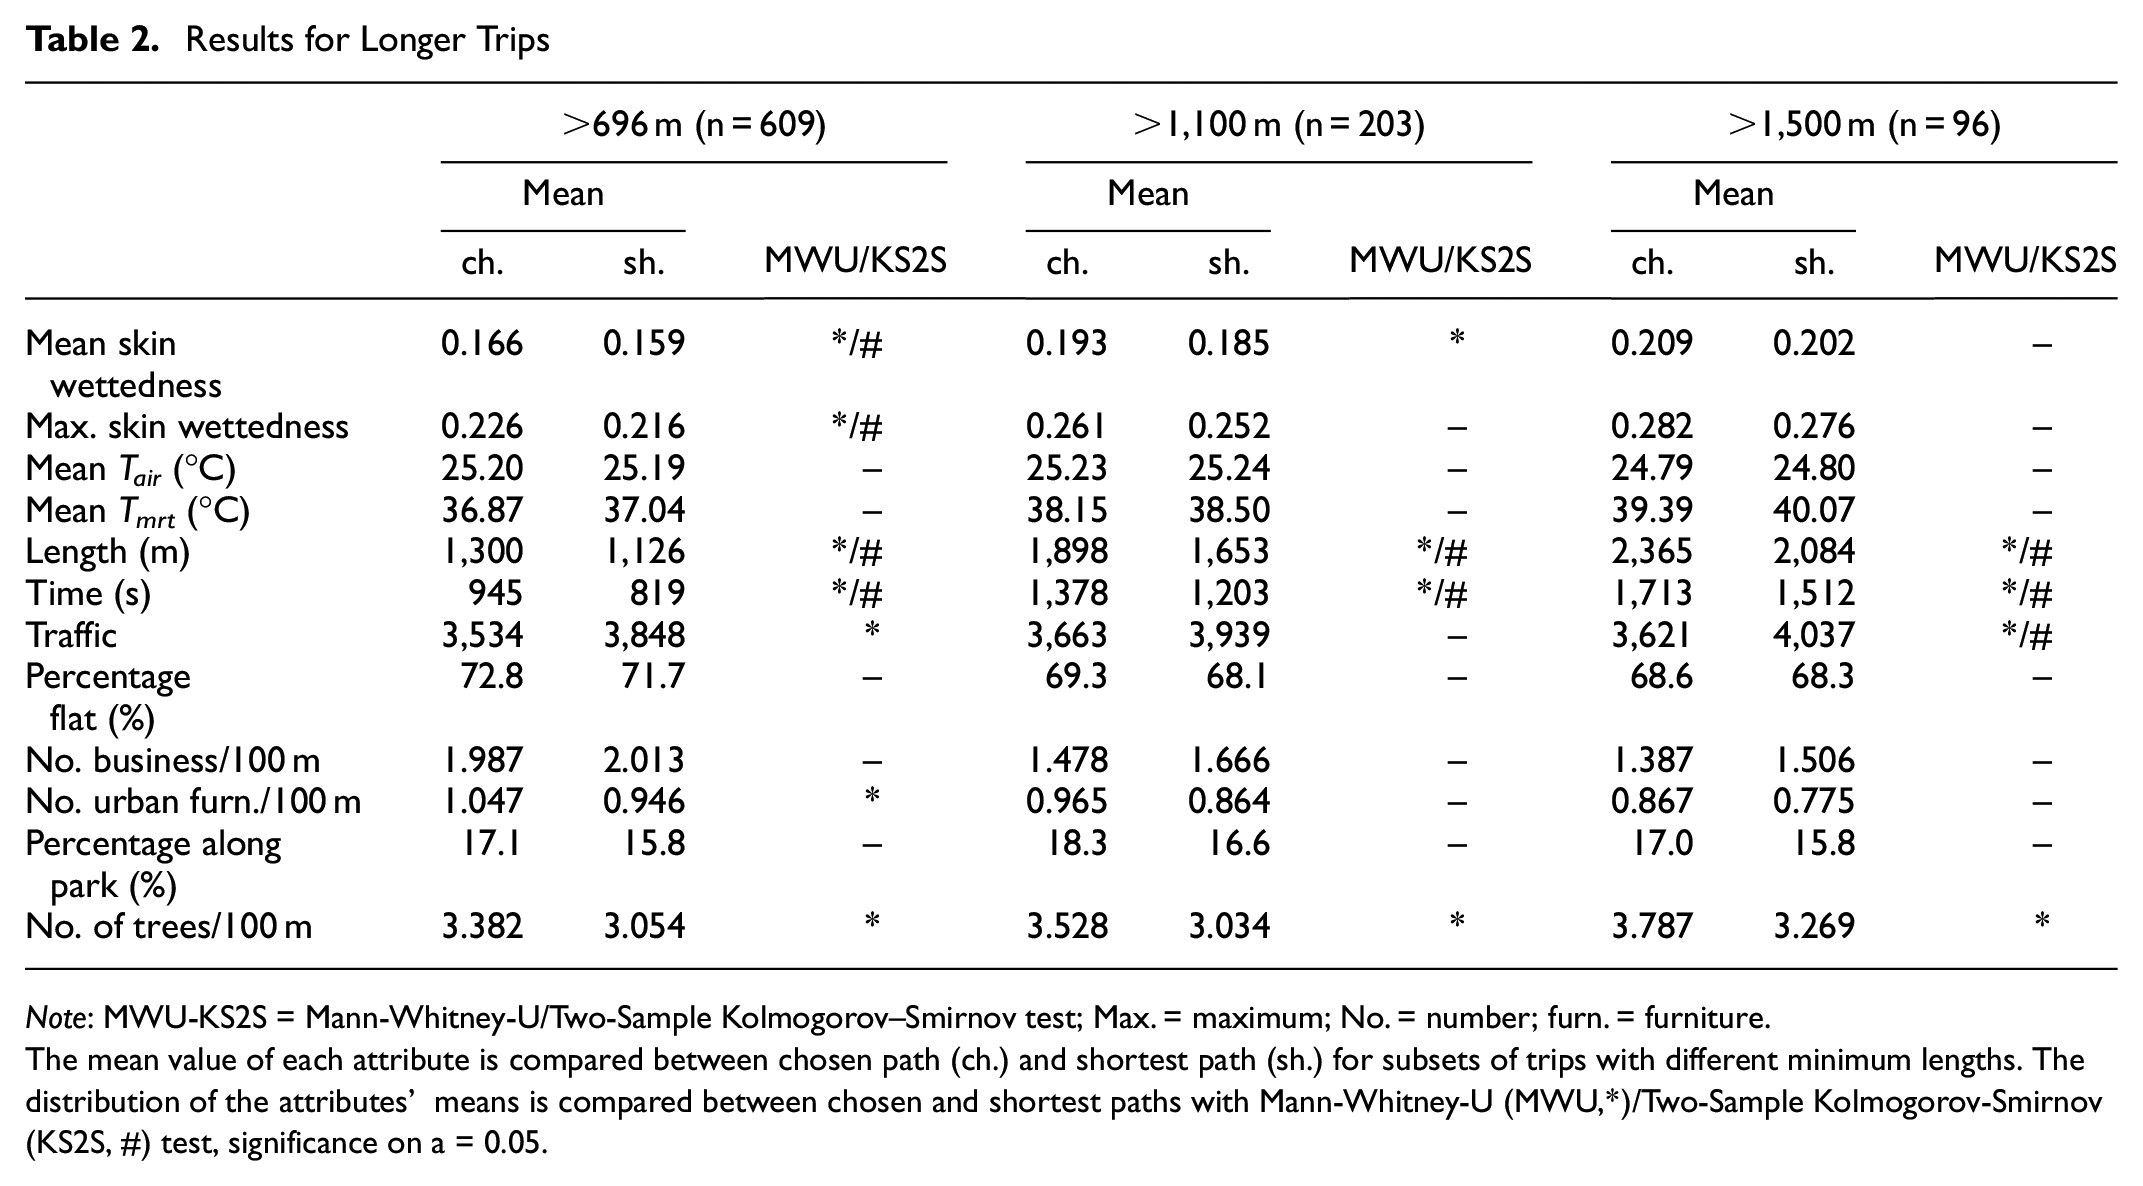
Note: MWU-KS2S = Mann-Whitney-U/Two-Sample Kolmogorov–Smirnov test; Max. = maximum; No. = number; furn. = furniture.
The mean value of each attribute is compared between chosen path (ch.) and shortest path (sh.) for subsets of trips with different minimum lengths. The distribution of the attributes' means is compared between chosen and shortest paths with Mann-Whitney-U (MWU,*)/Two-Sample Kolmogorov-Smirnov (KS2S, #) test, significance on a = 0.05.
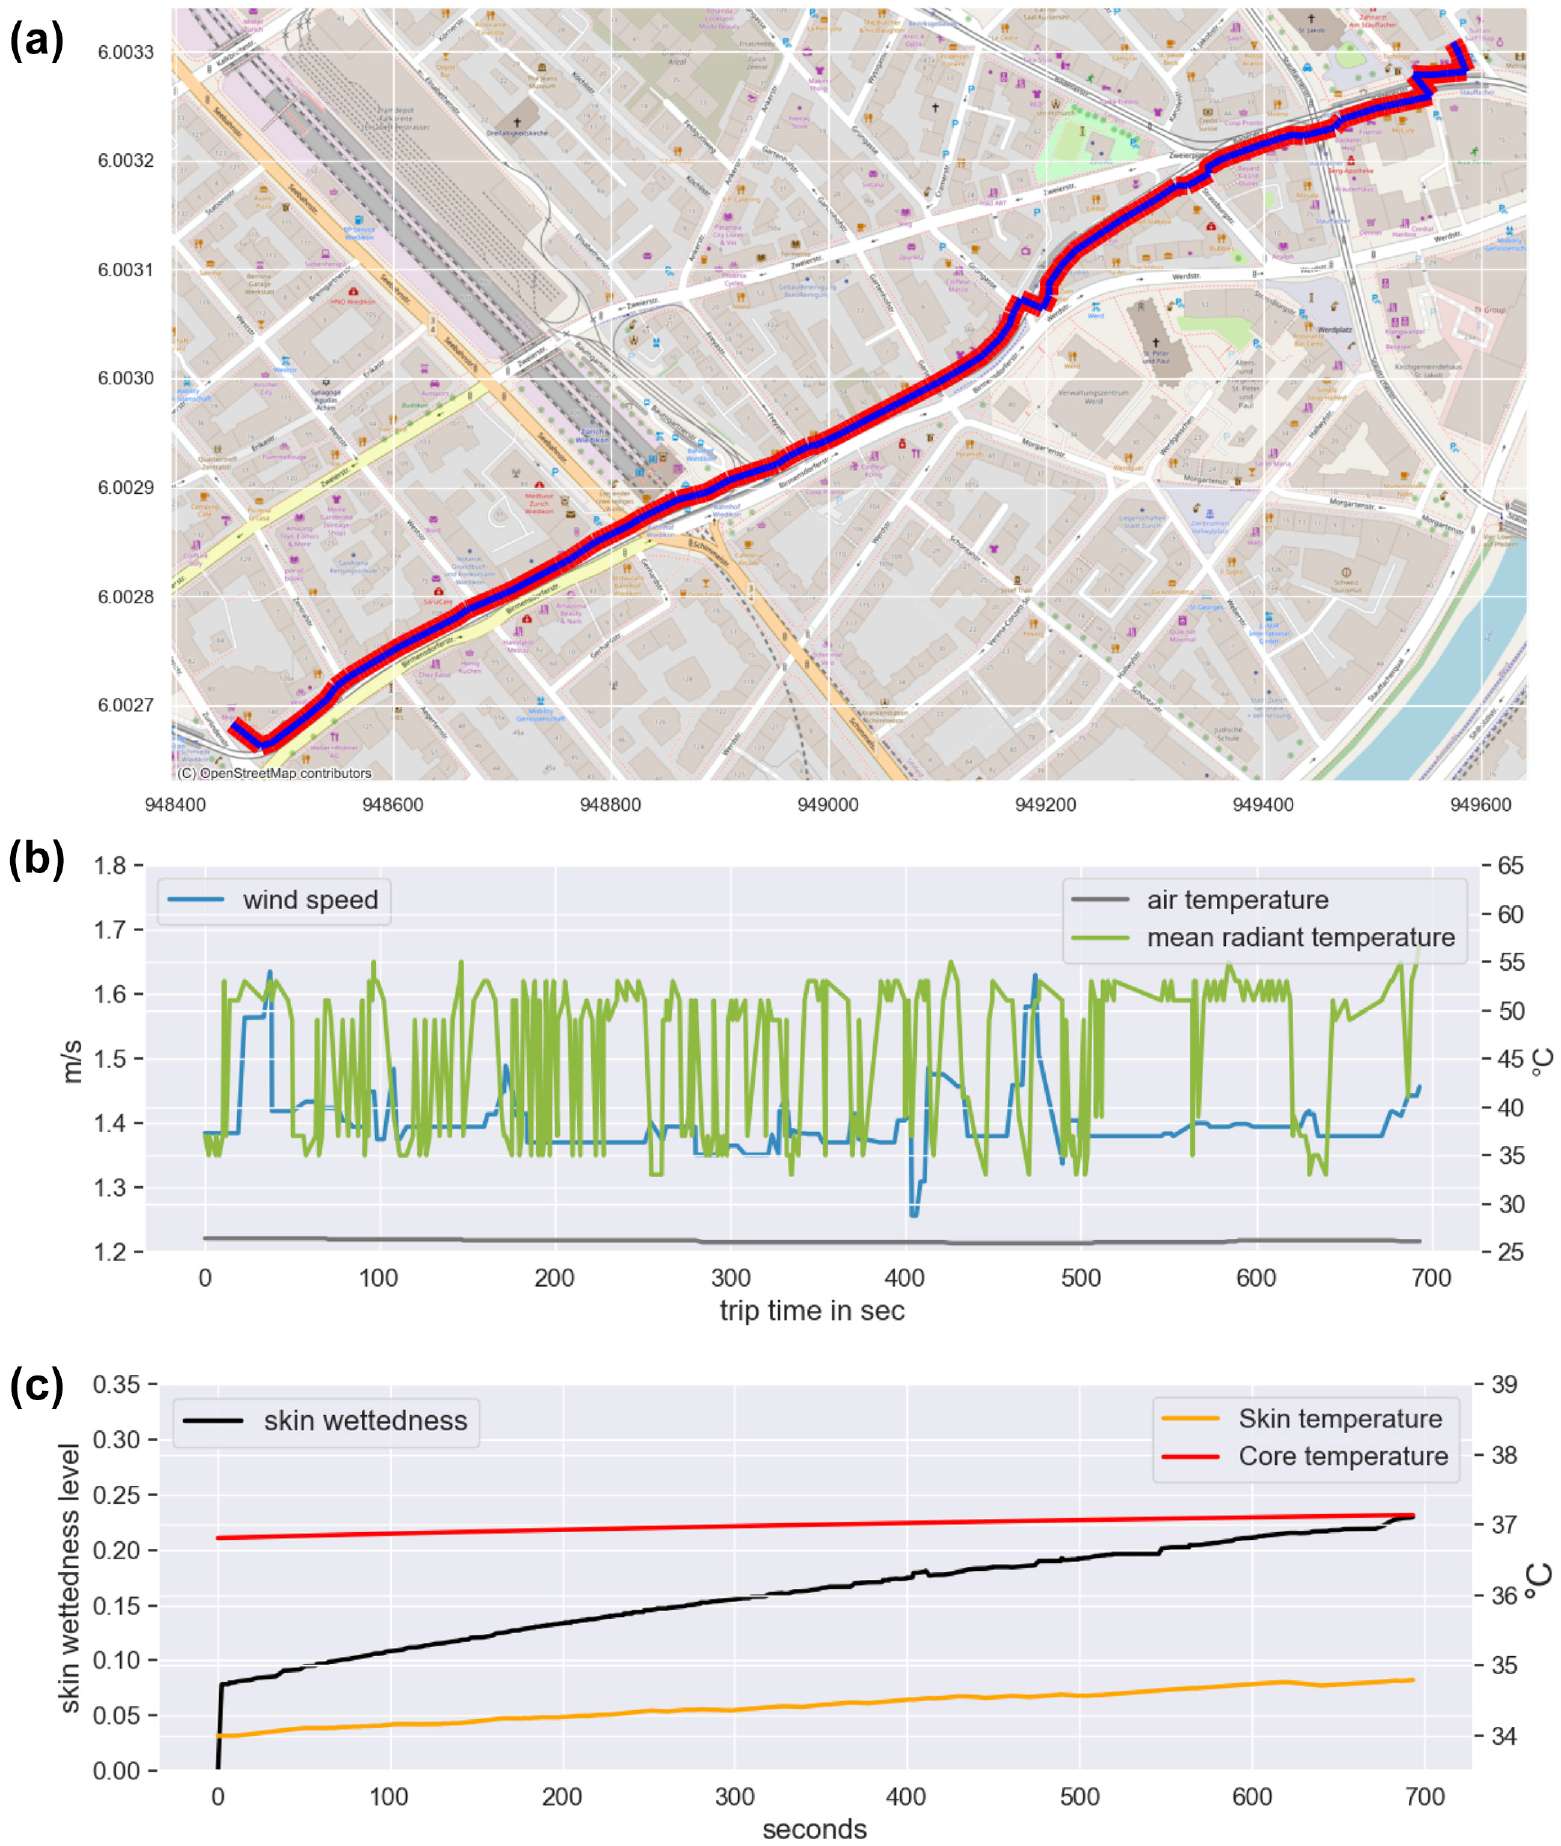
Sample path: (a) trajectory, (b) air temperature, mean radiant temperature, and wind speed, (c) skin wettedness, core and skin temperature.
Built Environment and General Observations
In general, participants of the MOBIS-COVID study preferred longer paths for their trips, in both distance and travel time. They chose the shortest path for only 22.5% of their trips. For the trips where the chosen path was different from the shortest path, 64.3% of the chosen route’s length differed from the shortest route, meaning chosen paths are substantially different. In the overall results (see Table 1),all attributes of the built environment except business establishments have higher (or, for traffic, lower) mean values for chosen paths when compared with shortest paths, which mostly confirms the studies ( 5 , 6 , 8 , 9 ) that found that people anticipate these attributes in their route choices. For presence of urban furniture (WMN) and trees (WMN&KS2S), the distribution of the mean is significantly different. Nevertheless, the last three columns of Table 1 show that chosen paths have a greater share of higher values only for the percentage of flat gradients, or lower values for traffic. This reveals that there are some trips where chosen paths have significantly better statistics on the built environment. Otherwise the difference in the mean would not be possible.
It was found that the built environment gains importance for longer trips, as was also found by Guo and Loo ( 6 ) and Miranda et al. ( 9 ). In Table 2 it can be seen that the difference between the values of the attributes for chosen and shortest path becomes more pronounced for longer trips. For example, the traffic for chosen paths considering the overall results is approximately 100 vehicles per hour fewer than for the shortest paths. At the same time, there are around 300 fewer vehicles per hour for the subset of trips where the shortest path is longer than 696 m. The same pattern can be observed for the other attributes, except for business establishments which are consistently higher for shortest paths, contrary to the findings of previous studies. Also here the share of chosen paths that have greater, equal, or lower values than their corresponding shortest paths are compared (not depicted in Table 2). The share of chosen paths that have higher (for traffic lower) values is greater for traffic, the percentage of flat gradients, the number of trees, and urban furniture, when considering longer trips. For the percentage of trips along a park, the share of chosen paths with higher values is slightly lower. The mean number of trees, percentage of the trip along parks, percentage of flat gradients, and traffic volume are higher than the overall results for longer trips. This can be explained by the probability of passing by green areas and busier roads on longer trips being higher, and the likelihood of steeper gradients also being higher for longer trips. The 40% increase in share of route along parks can be assumed to be a conscious decision, confirming the finding of Erath et al. ( 8 ). The numbers of urban furniture and business establishments could be lower because there are fewer businesses and less urban furniture along green areas.
The analysis of the MOBIS-COVID data showed that, currently, OTC has a limited influence on route choice in Zurich. This is partly because an insufficient number of trips were done under temperatures that noticeably negatively affected OTC, and the length of the trips was short. This is confirmed by the results on the OTC-corrected accessibility, where it was found that the current climate has a weak influence on the OTC-corrected walking distance for trips up to 20 min. Nevertheless, longer trips showed that OTC could potentially play a role in the route choice, but the low sample size (96) impedes secure conclusions. The methodology designed to assess OTC for the travel diary trips is novel, supporting that such estimation can be done with existing models and data, even on a citywide level. For the built environment attributes, it was shown that these become more important for longer trips.
Discussion of Results on OTC-Corrected Accessibility
Table 3 shows the statistics for the different scenarios for the two community centers. For the median scenario, the area and population for both CCs are not affected at all (see Figure 5 for a spatial representation). CC Bäckeranlage is almost unaffected by the hottest scenario. In contrast, CC Oerlikon shows 3.5% reduction for the area resulting in 3.8% less population inside this area. Also, for the more moderate RCP4.5 scenario, reductions for Oerlikon are more pronounced: the area is reduced by about 15%, and population inside the area decreases by 13.4%. The losses are all located at the fringes of the walkable radius, which is intuitive because
OTC-Corrected Accessibility Scenarios (After) on CC Bäckeranlage and CC Oerlikon Compared With Non-OTC-Corrected Statistics (Before)
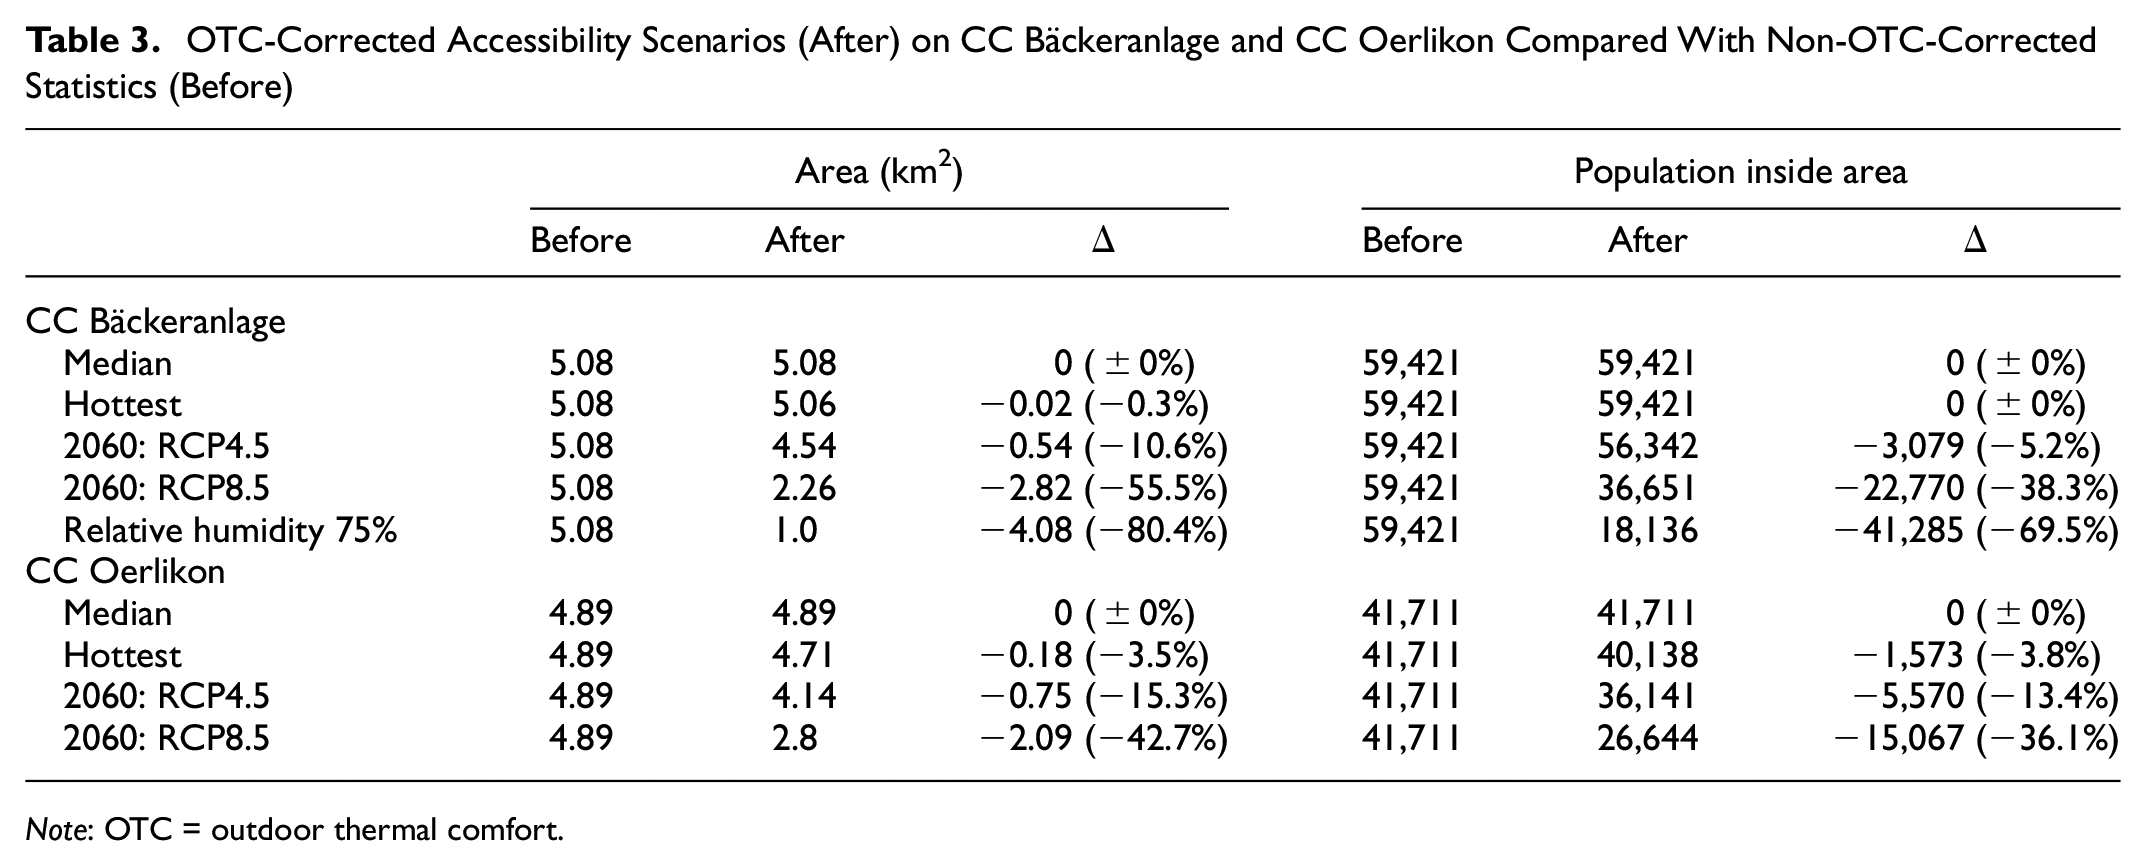
Note: OTC = outdoor thermal comfort.
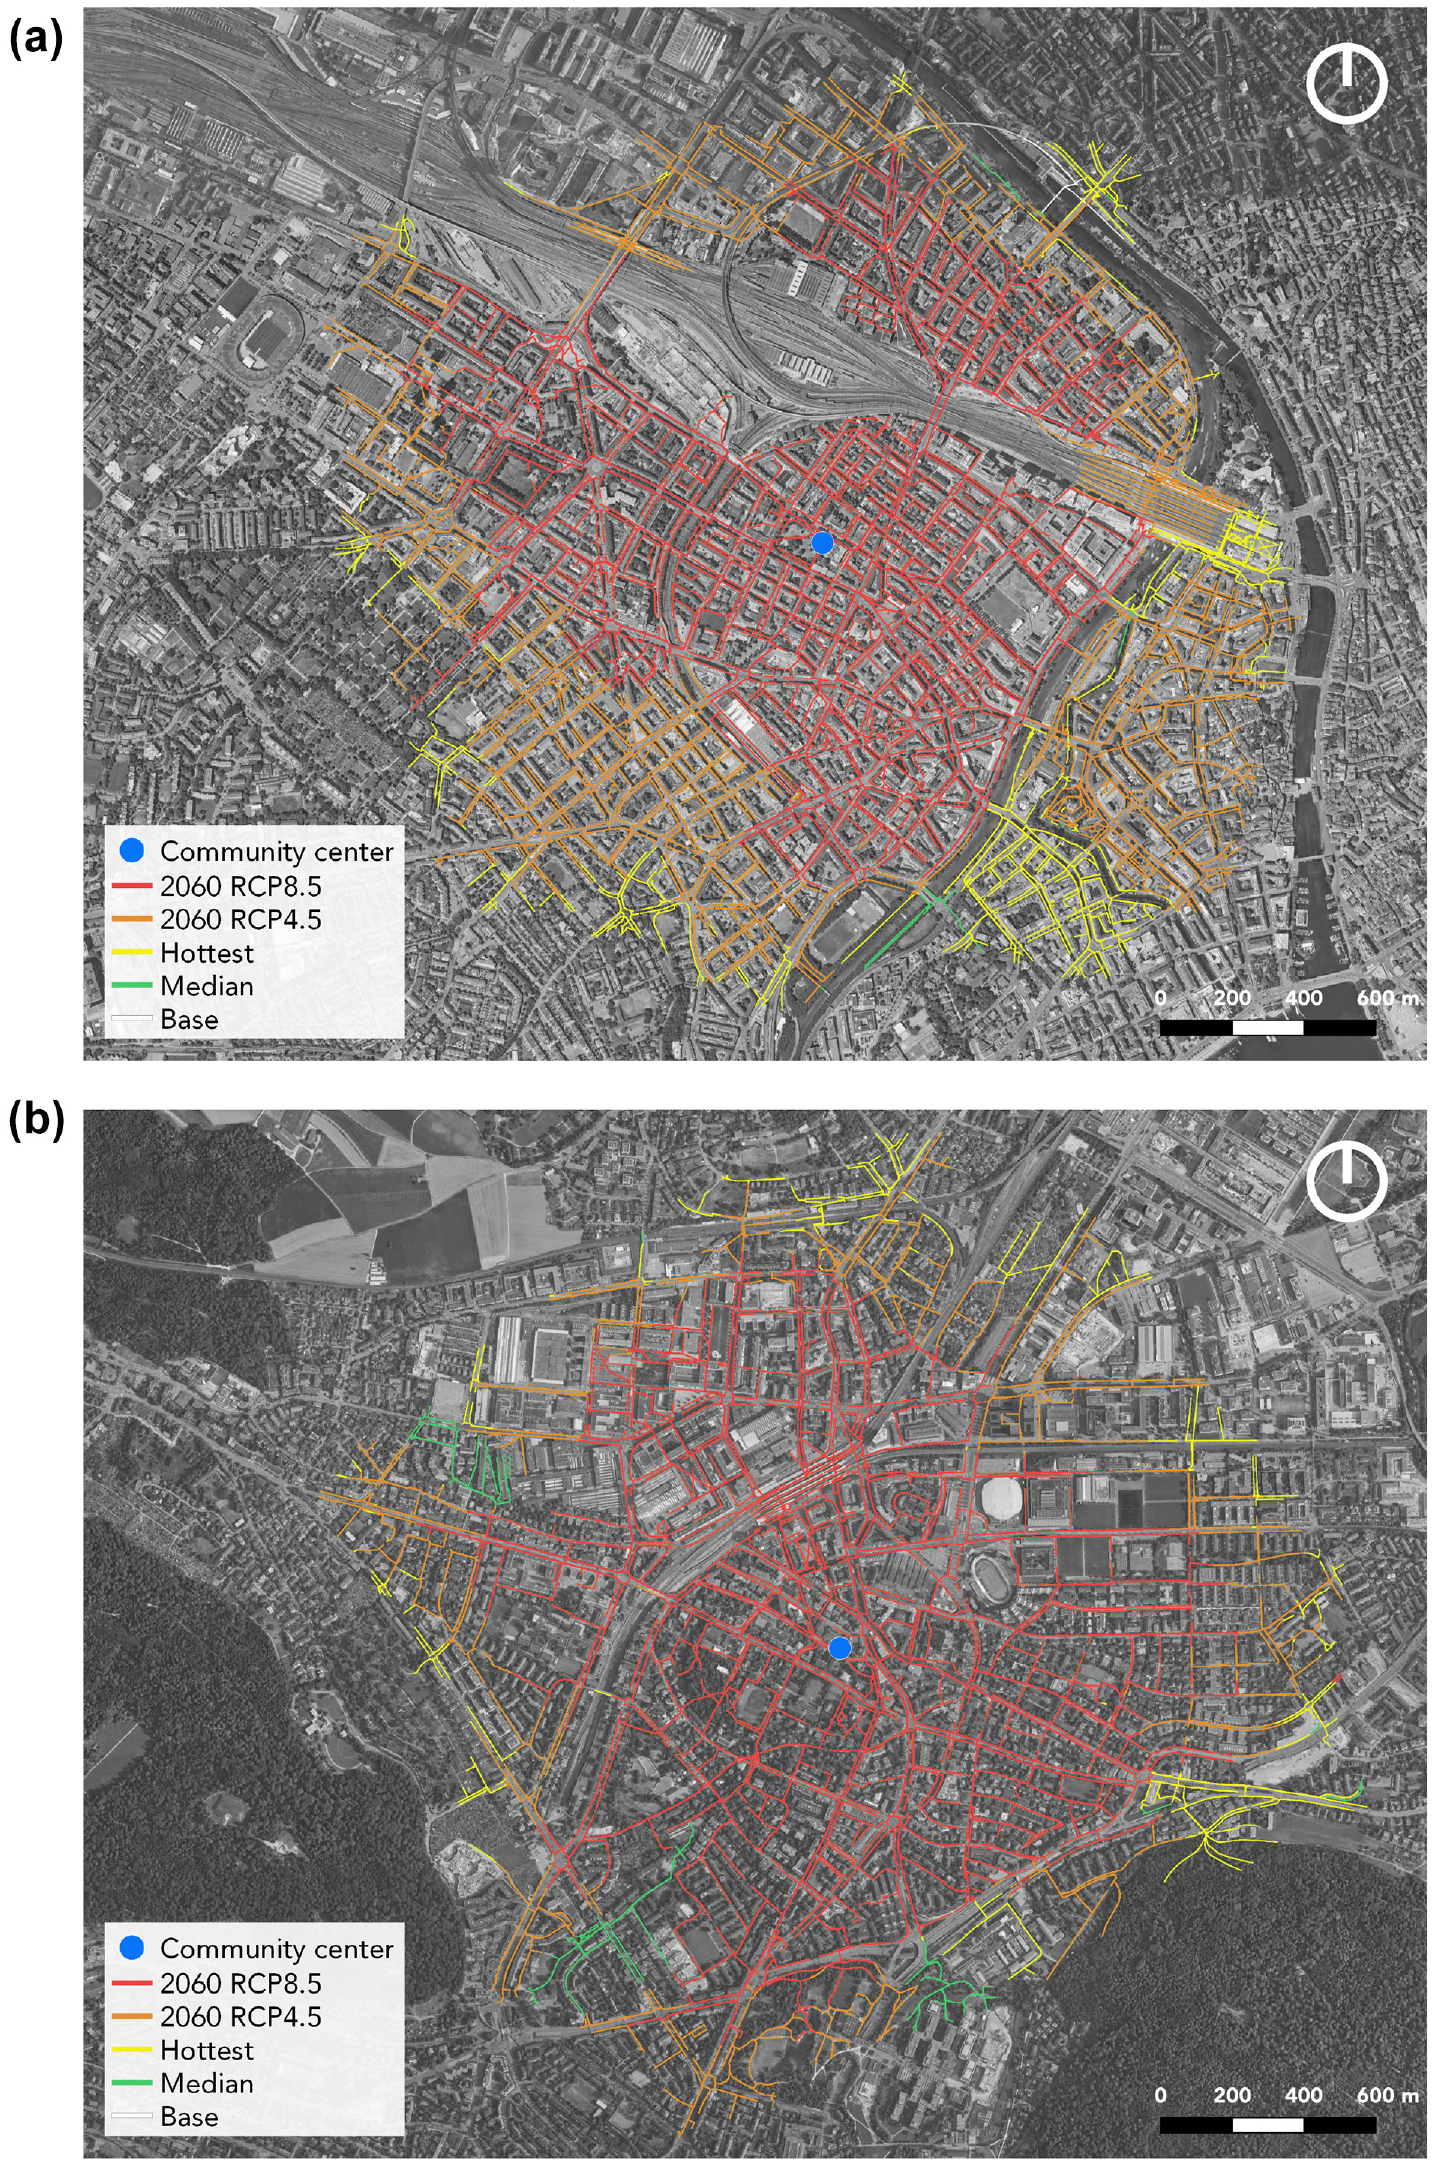
Streets comfortably reachable for different scenarios: (a) from CC Bäckeranlage, (b) from CC Oerlikon.
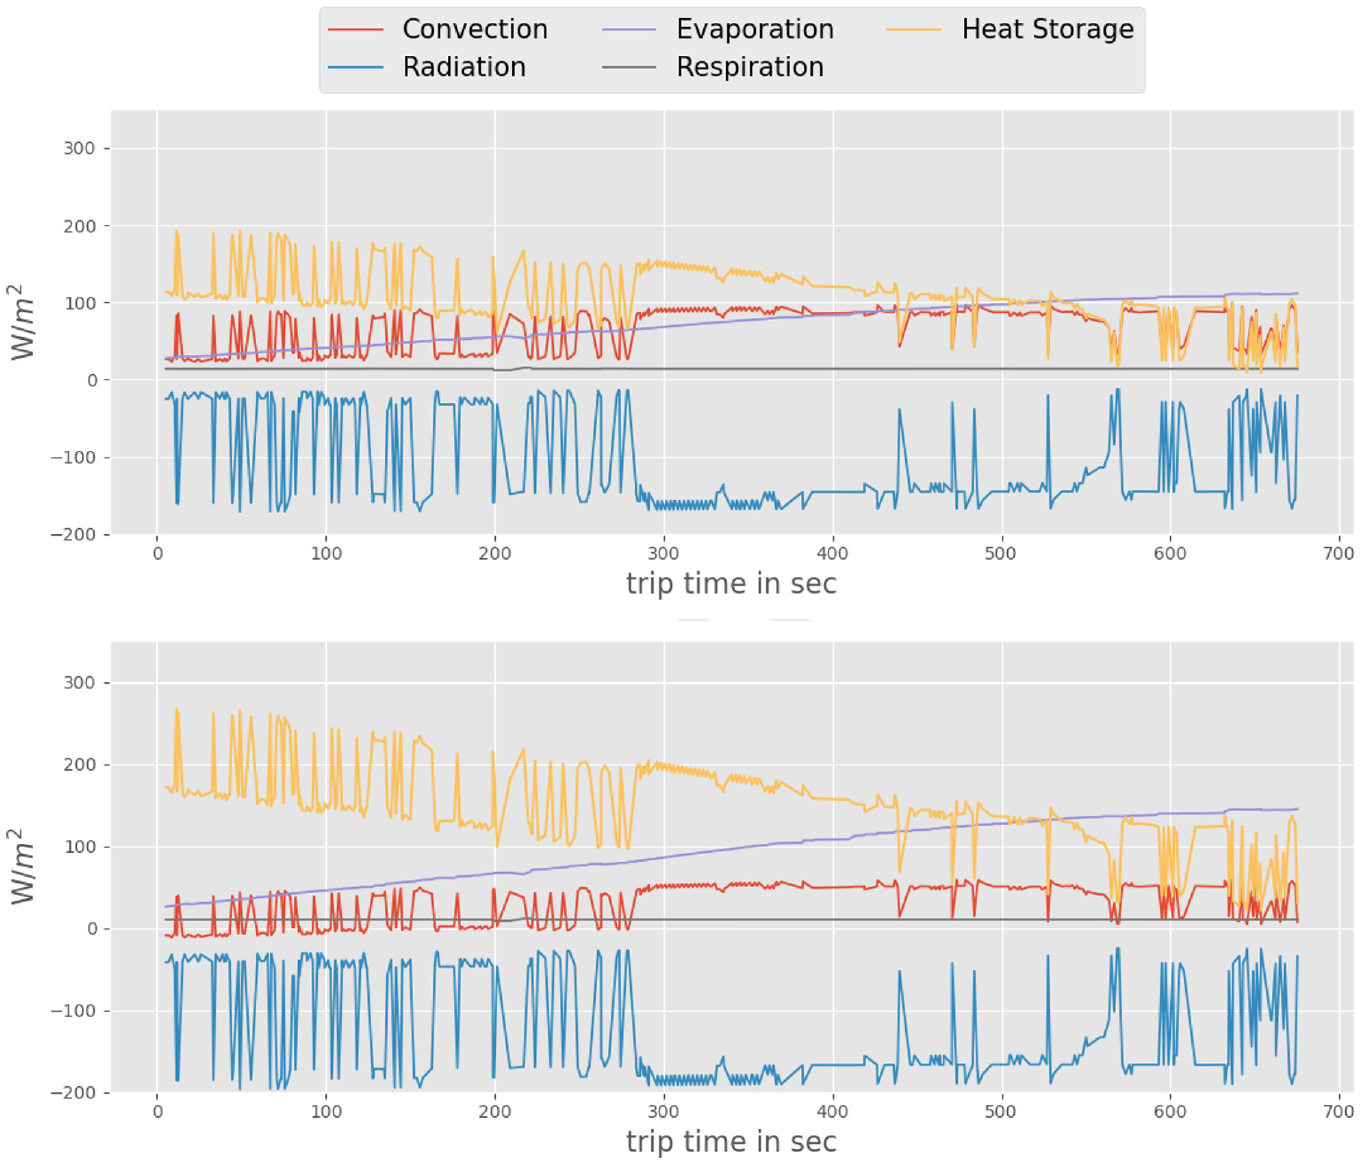
Human heat balance for a sample path (without
Our analysis demonstrates that OTC is not harmed under the current climate conditions, but will be reduced enough in the context of future climate change that comfortable walking areas will be diminished. The incorporation of shading in bridge design could significantly increase the range of thermally comfortable walks. The low
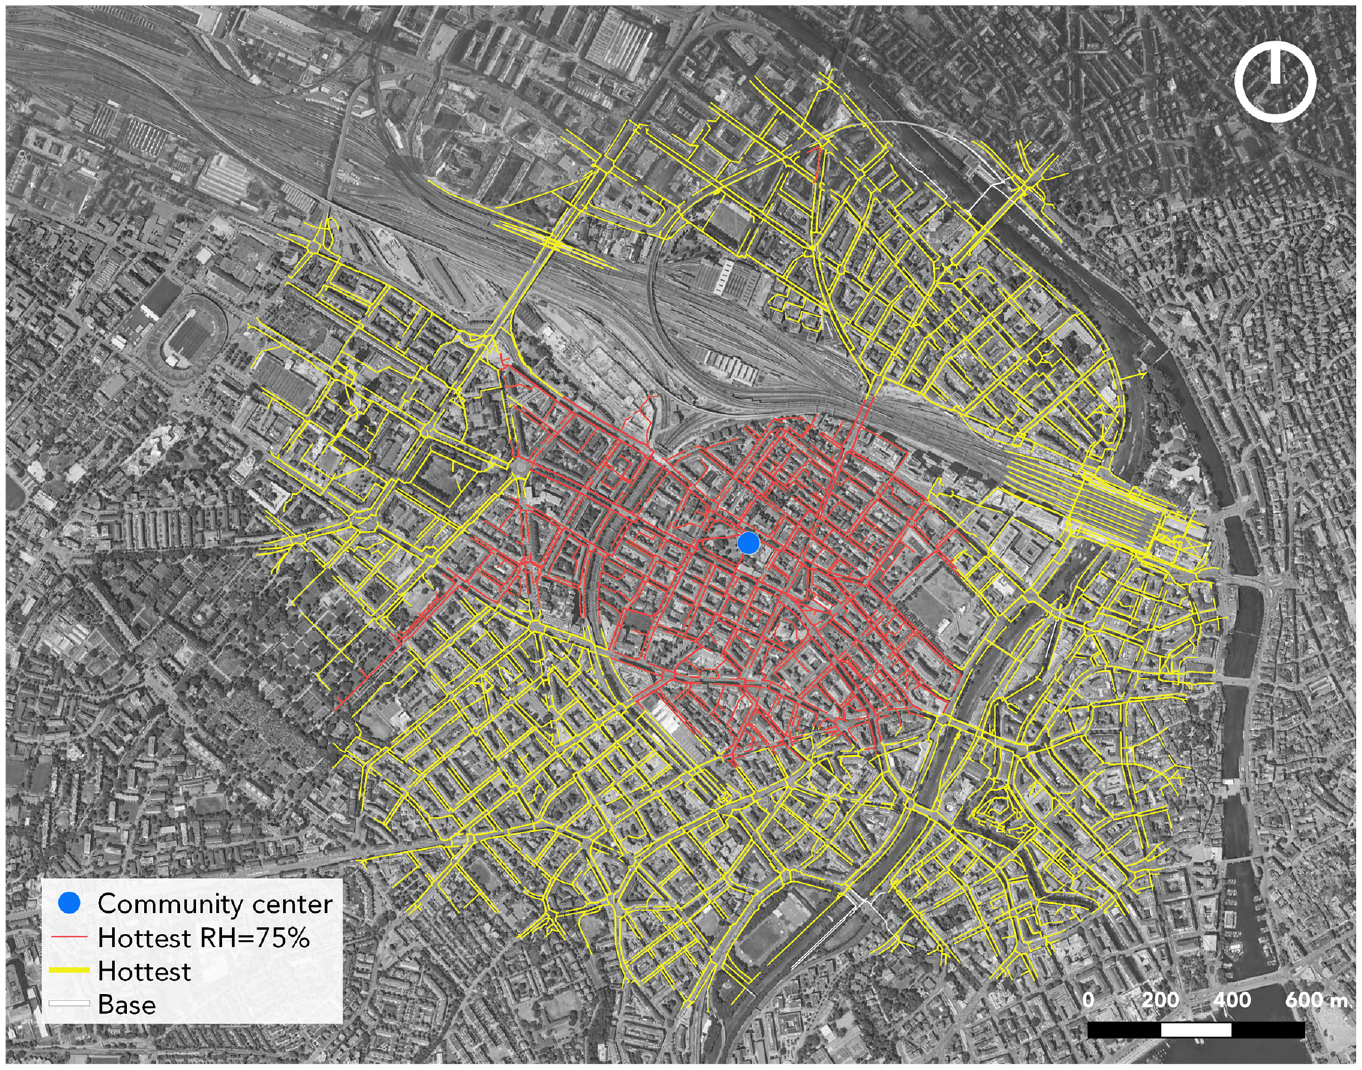
Streets comfortably reachable from CC Bäckeranlage, with sensitivity on relative humidity.
Limitations
Despite the demonstrated contributions, some limitations of this study have to be mentioned. The biggest one is that, for the modeling, it is assumed that pedestrians walk precisely on the centerlines of the coded pedestrian network. In reality, pedestrians almost always have a margin of where they walk on the sidewalk. This can drastically affect the pedestrian’s OTC. The same issue also affects behavior on public squares, where not all possible crossing possibilities are represented in the network. Furthermore, the threshold
Conclusion
This research applied a human thermoregulation model to comprehensive real-world data. First, we assessed OTC for the trips from a travel diary study and found that the pedestrian path choices in the current climate of Zurich do not suggest that pedestrians integrate anticipated heat stress in their path planning. There are indications that they do for longer trips, but the sample size is too small to draw robust conclusions. Nevertheless, the developed methodology can be used for other study cases where climate might significantly influence route choice. Most important, it was shown that this is possible with existing, mainly publicly available data. Extending this work by modeling the route choice using discrete choice models would provide additional valuable findings. These insights could be implemented in software to model pedestrians more accurately in hot temperatures. Furthermore, the results could be used to incorporate OTC in navigation software such as Google Maps.
Further, we developed a tool to assess OTC-corrected accessibility based on an OTC-corrected routing engine. We evaluated its usefulness for two case study locations in Zurich. It could be shown that the current climate does not affect accessibility because of relatively low
The presented work is of interest not only for practitioners and researchers in regions with harsher climates but also, given the future increase of global temperatures, especially for places where there is still time to react and implement adaptation measures to ensure attractiveness of the most fundamental transport mode: walking.
Footnotes
Author Contributions
The authors confirm contribution to the paper as follows: study conception and design: J. Hess; data collection: J. Hess; analysis and interpretation of results: J. Hess, K. W. Axhausen, V. R. Melnikov, A. Meister; draft manuscript preparation: J. Hess; manuscript review: K. W. Axhausen, A. Meister, V. R. Melnikov. All authors reviewed the results and approved the final version of the manuscript.
Declaration of Conflicting Interests
The authors declared no potential conflicts of interest with respect to the research, authorship, and/or publication of this article.
Funding
The authors received no financial support for the research, authorship, and/or publication of this article.
Data Accessibility Statement
The tool’s code will be made available to interested readers on request.