
Abstract
Short-term passenger flow prediction is critical to managing real-time bus networks, responding to emergencies quickly, making crowdedness-aware route recommendations, and adjusting service schedules over time. Some recent studies have attempted to predict passenger flow using deep learning models. The complexity of transportation networks, coupled with emerging real-time data collection and information dissemination systems, has increased the popularity of these approaches. There has also been a growing interest in using a new deep learning approach, the graph neural network that captures graph dependence by passing messages between its nodes. Researchers in various transportation domains have used such tools for modeling and predicting transportation networks, as many of these networks consist of nodes and links and can be naturally categorized as graphs. This paper develops a bus network graph convolutional long short-term memory (BNG-ConvLSTM) neural network model to forecast short-term passenger flows in bus networks. Validating the proposed model is done using real-world data collected from the Laval bus network in Canada. Based on a set of comparisons between the proposed model and some other popular deep learning approaches, it clearly indicates that the BNG-ConvLSTM model is more scalable and robust than other baselines in making network-wide predictions for short-term passenger flows.
Public transport, especially bus transport, can reduce private car usage and fuel consumption and alleviate traffic congestion. However, when traveling by bus, travelers care not only about waiting and travel time, but also about crowdedness in the bus itself. Excessively overcrowded buses may drive away travelers and make them reluctant to take buses ( 1 ). Therefore, predicting passenger flows on public transportation networks is of great importance and has always been one of the most challenging problems in intelligent transportation system applications ( 2 ). Expected passenger counts in transit systems help managers and urban planners manage travel behavior, diminish passenger congestion, and improve the quality of service in public transportation systems.
Accordingly, and owing to its importance, passenger flow prediction for public transport systems has been widely studied in the literature. With regard to time horizons, passenger flow forecasting studies can be categorized into short-term and long-term studies. Although long-term predictions are essential, especially for planning and development purposes, short-term predictions are also important because they play an important role in the real-time monitoring and management of transit systems. Moreover, short-term variations in travel demand or system performance may cause unacceptable waiting times and congestion, which reduce the attractiveness of public transportation systems for users in the long term. Accordingly, and especially in recent years, short-term prediction of passenger flows has become increasingly popular among researchers. In this study, we are going to predict passenger flow or the number of passengers on buses when they are leaving stops (which, in other words, is the number of passengers when the bus arrives at the next stop). Based on Luo et al. ( 3 ), this kind of passenger flow prediction is called service-level passenger flow which means the total number of on-board passengers for each service of each bus line passing through each stop. As the focus of this study is the short-term prediction of passenger flow at bus stops, we briefly review studies on short-term prediction of passenger flows in public transportation systems, including bus and Metro systems. In the paper we build on the work of Cui et al. ( 4 ) who developed a graph neural network (GNN) network for link traffic states prediction. We use this framework in the context of transit ridership.
The rest of the paper is structured as follows: In the next section, we survey the literature on passenger flow prediction. In the methodology section, we explain the architecture of the proposed model, as well as some background required for understanding the proposed model. We then describe the data set and present the results of the proposed model in conjunction with the results of a simple long short-term memory (LSTM) model. We then conclude the paper presenting some ideas on areas of future research.
Literature Review
Different sources of data and various methodologies have been employed to predict passenger flows in public transportation systems. New technologies such as automatic vehicle location (AVL) and automatic passenger counters (APC) make large amounts of data available to transit planners and operators for this purpose ( 5 ). Automated fare collection (AFC) data, APC data, and AVL data have been among the most popular data sources used by researchers. The methodological attempts, however, have been even more diverse, ranging from statistical and mathematical models to simulation tools, to data-driven, and deep learning approaches ( 6 ). Existing methods can be divided into two main categories: linear and nonlinear methods. In the following, we briefly discuss the existing literature in these two categories.
Linear Methods
Initial attempts at passenger flow prediction have been mainly focused on linear models. Among classic linear methods, linear regression models and Kalman filter-based methods have been among the methods most frequently used in the passenger flow prediction literature. To name a few, Yang et al. ( 7 ) employed a general linear regression for passenger flow volume forecasting, using public transit smart card data. Zhang et al. ( 8 ) developed a Kalman filter-based method for short-term prediction of passenger flow at individual bus stops. Jiao et al. ( 9 ) also used three revised Kalman filtering models for short-term rail transit passenger flow prediction.
However, since most of the data used in passenger flow prediction, especially AFC and APC data, have a spatial-temporal nature, among different linear models, autoregressive moving average (ARMA), and autoregressive integrated moving average (ARIMA) have attracted the main attention of researchers in this field. Ma et al. ( 10 ) and Xue et al. ( 11 ) developed interactive, multiple models for passenger flow prediction. Milenković et al. ( 12 ) tested several SARIMA (seasonal ARIMA) models to choose the most appropriate one for predicting rail passenger flows on Serbian Railways. Zhou et al. ( 13 ) also predicted passenger demand on bus services using three predictive models: a time-varying Poisson model, a weighted time-varying Poisson model, and an ARIMA model. Gong et al. ( 14 ) proposed a framework consisting of three sequential stages, combining a seasonal ARIMA-based method, an event-based model, and a Kalman filter-based method to predict the waiting passenger counts at stops.
Nonlinear Methods
In recent years, nonlinear prediction methods, especially machine learning techniques, have been widely used by researchers in the field of short-term passenger flow prediction. Chen et al. ( 15 ) built a transit flow prediction model based on a least squares support vector machine (LS-SVM) to predict passenger flows on a bus route. Bhattacharya et al. ( 16 ) also proposed a Gaussian process-based approach for modeling and predicting bus ridership. Samaras et al. ( 17 ) developed predictive models using random forests and bagging of regression trees for predicting passenger demand using AVL and APC data from a bus fleet. Sun et al. ( 18 ) developed a hybrid model combining Wavelet and SVM models. Li et al. ( 19 ) employed random forest regression for the short-term prediction of passenger flow for a railway transit system. However, among different machine learning techniques, artificial neural networks (ANNs) have received particular attention from researchers, and various versions of these models, such as radial basis function (RBF) neural networks ( 20 , 21 ), multiple temporal unit neural networks (MTUNN), the parallel ensemble neural networks ( 22 ), and the combination of ANNs with other linear and nonlinear methods have been employed in the literature ( 23 , 24 ).
Deep Learning Methods
As members of the nonlinear modeling family, deep learning methods have become popular for short-term forecasting of passenger-flow prediction in recent years. The advent of real-time data collection and information diffusion systems, on the one hand, and the ever-increasing complexity of transportation networks, on the other, have accelerated the popularity of these modeling tools. Liu et al. proposed a passenger flow prediction model using deep learning methods based on the passenger flows collected from AFC systems. Their model contained temporal features as well as real-time and historical passenger flows and was able to predict hourly passenger flows using a three-stage deep learning architecture for any specified hour at Xiamen BRT stations. Although the experimental results for some scenarios show room for improvement, their study showed that it is possible to develop a robust and universal prediction model by combining rich data with deep learning methods ( 25 ). Since then, various structures of deep learning have been employed by researchers for short-term prediction of passenger flows. These methods include fully connected deep neural networks ( 26 , 27 ), convolutional neural networks ( 28 ), and LSTM-based models ( 29 – 33 ). Also, to take different affecting factors and complex interdependencies into account, special attention has been drawn to combinations of different machine learning and deep learning models, such as the combination of convolutional neural networks and long-short-term-memory models ( 3 , 34 , 35 ).
In recent years, the graph family of neural networks has become very popular in different fields ( 4 , 36 , 37 ) and ( 39 ). Graph neural networks (GNN) are neural models that capture the dependence of graphs via message passing between the nodes of graphs ( 36 ). Since many transportation networks consist of nodes and links, they can naturally be considered as directed or undirected graphs. Accordingly, researchers in different areas of transportation have used such tools for mimicking transportation networks for modeling and prediction purposes ( 4 , 39–41). That said, most such studies have been conducted by researchers in the area of automobile traffic flow prediction and travel demand modeling ( 41 ), and studies on passenger flow prediction have been mostly concerned with Metro and urban railway, that is, relatively sparse transit systems. To name a few, Li et al. developed a graph redconvolutional neural network (G-CNN) for urban traffic passenger flow prediction. They evaluated their model with Beijing subway data and compared its performance with other traditional models on short-term passenger flow prediction tasks ( 42 ). Han et al. ( 43 ) proposed a deep-learning-based approach, named STGCNNmetro (spatio-temporal graph convolutional neural networks for Metro), to collectively predict two types of passenger flow volumes—inflow and outflow—in each Metro station of a city. Wang et al. developed a dynamic hypergraph convolution network for Metro passenger flow prediction. To consider the higher-order relationships between stations and travel patterns of passengers, they employed a dynamic hypergraph neural network instead of a graph convolutional neural network. In the prediction framework, the primary hypergraph is constructed from Metro system topology and then extended with advanced hyperedges discovered from pedestrian travel patterns of multiple time spans. Furthermore, hypergraph convolution and spatio-temporal blocks are proposed to extract spatial and temporal features to achieve node-level prediction ( 44 ). Other studies using graph neural networks for predicting passenger flow at rail transportation networks can be found in ( 41 , 42 , 45 , 46 ).
To summarize, most short-term passenger flow prediction attempts, especially when it comes to using graph-based neural networks, have been focused on railway and Metro transportation systems. Although it might be inferred that there are no notable differences between Metro/railway and bus public transportation systems, there are significant operational and design distinctions between these two classes of transit systems. For instance, Metro/rail transit systems are generally fixed to pre-planned timetables as they usually operate underground or in dedicated infrastructure. In contrast, most bus transport systems share many of their routes with private vehicle traffic. This causes such systems to deviate from the expected timetables, especially during peak hours. These disruptions cause significant delays and have a direct impact on passenger flows at bus stops, which makes prediction in bus transport systems more complicated. In addition, bus transportation networks are usually more interconnected than Metro/railway systems as they are sometimes designed as feeders or complementary systems for higher-level transit systems like Metro systems. Besides, they also have more stops and more transfer points, and this is specially important in Laval’s bus transportation network as it is a city that is highly dependent on bus transportation given its low number of Metro stations (three for the whole city).
Considering the above, the appropriateness and effectiveness of GNNs in the context of buses needs to be tested and established. Accordingly, in this study, a graph convolutional LSTM recurrent neural network based on work in traffic states prediction from Cui et al. ( 4 ) is proposed for the short-term prediction of passenger flows at 929 bus stops in Laval, Canada. Instead of representing bus stops by grids and employing conventional redCNNs to capture spatio-temporal dependencies, we transform the bus network into a graph to take the spatio-temporal correlations between different stops and lines into account. To the best of our knowledge, this is the first time that a graph-based neural network has been used for network-based prediction of passenger flows in a bus transit system.
Methodology
Considering the complex interactions and uncertainties in bus transportation networks, choosing an appropriate modeling structure is of great importance. For the purpose of this study, and considering different structures used by previous researchers, we found the one developed by Cui et al. ( 4 ), which was originally used in the context of traffic state estimation, well-suited for application in bus network passenger flow prediction. This modeling structure enjoys a network-based graph convolution operator that allows more realistical modeling of the transportation network compared with transitionally used convolutional neural networks (CNNs). Conventional CNNs are appropriate when dealing with spatial relationships in Euclidean space, while in a real transportation network, these spatial relationships are not necessarily distributed in Euclidean space ( 4 ). For instance, two bus stops might be physically close but not connected to each other, and therefore have low spatial dependencies. Accordingly, conventional CNN-based methods cannot deal with the topological structure and the physical attributes of the transportation networks, especially in bus transportation networks that are not fully connected networks. The graph-based convolution operator solves this issue by extracting features from the graph-structured network. Moreover, the employed modeling structure includes an LSTM component to dynamically capture the temporal dependencies in passenger flow observations. The combination of the graph-based convolution operator and the LSTM model is a unique structure that was not found in the relevant literature and therefore inspired us to use this modeling framework for the purposes of this study. This integration enables the resulting model to capture both spatial and temporal dependencies among network-wide passenger flows at a station level.
Model Input Definitions
Before the model itself is presented, we define our bus network graph and its adjacency and nodes bus network proximity matrices which are the model’s inputs.
The Bus Network Graph and its Adjacency Matrix
In general, a graph
Connectivity between nodes in the graph is described with its adjacency matrix, which is a
Bus Network Proximity Matrix
In a real bus network, the influences of all stops on each other are not equal. For example, the stops that are closer to each other have more impact on themselves than the stops that are far from each other. To consider this characteristic of the bus network, the bus network proximity (BNP) matrix is defined, whose cells represent the possibility of reaching a given destination node from a given origin node in a given period of time. Thus, first, based on the distance between stops in the bus network, we define a distance matrix
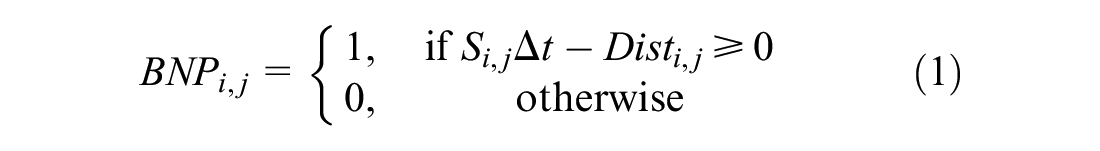
where
Short-Term Passenger Flow Prediction Problem
The model which is defined in this paper is used to predict short-term passenger flows. For this prediction, the temporal feature, the passenger flow situation of the network before the target time for which we want to predict the passenger flow, is considered. Also, the spatial features, for example, the environmental characteristics of the network, have been used for this prediction.
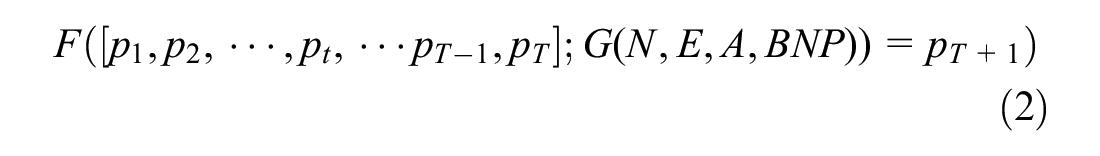
In this formula,
Bus Network Graph Convolution
The convolution layer in a neural network is defined as a tool for extracting spatial features from the input data, which can have a two- or three-dimensional matrix structure. Based on this definition, a graph convolution layer is defined, and is used to extract the spatial features from the input data in a graph structure ( 4 , 48 , 49 ). The graph convolution operation to extract features from the neighborhood in our model is defined as the product of input data, the adjacency matrix, the BNP matrix, and a trainable weight matrix as a graph convolution operation to extract features from the neighborhood. The formula for the bus network graph convolution (BNGC) operation is as follows:

where
BNP is the BNP matrix, and
In this equation, the element-wise matrix multiplication (Hadamard product operator) is represented
Bus Network Graph Convolution LSTM Neural Network Model
We use a bus network graph convolutional LSTM (BNG-ConvLSTM) neural network model for short-term passenger flow forecasting. This model learns both the spatial and temporal dependencies presented in the bus network. A basic LSTM is used and the BNGC features are its inputs. However, the gate structure and the hidden state in the basic LSTM model are not changed (
50
). The input gate


In these equations,
As mentioned before, in a bus network, each node is affected by previous states of itself and neighboring stops; therefore, the states of neighboring cells of each node in the graph should affect its LSTM cell state. Accordingly, a cell state gate is defined as follows and is added to the LSTM cell:

In this equation, the impacts of neighboring cell states are measured by


Eventually, at the last time step T, the hidden state

In Equation 11,
Experiments
This section describes the data used and the results produced by our proposed model as well as three other previously and commonly used models in passenger flow prediction.
Data Used
The data set used in this study includes information of the passenger flow from the Société de transport de Laval (STL) in Laval, Canada, for one month (April 2020). The STL is the transit operator for Laval, Canada. Laval is the second largest city in the province of Quebec, but it is in the region of Greater Montreal. Montreal is Canada’s second largest city with a population of around 4 million according to Statistics Canada. While Laval has three stops of the Montreal Metro, its services are primarily bus-based. In this study, to test and verify many assumptions and scenarios, we decided to focus on a subnetwork of the Laval bus transportation network; nonetheless, we have chosen a relatively complex subset of the network including route 17-Northbound, as one of the busiest express routes in Laval, and all of its feeder lines. Thus, while this makes it easier for us to train and run our model for different scenarios, it also leaves us with a subnetwork that covers a significant portion of the city’s public transport demand and enables us to evaluate our proposed framework on a real network. It is worth mentioning that previous work had focused on one stop or one route, so the advantages of a graph approach could not be truly evaluated.
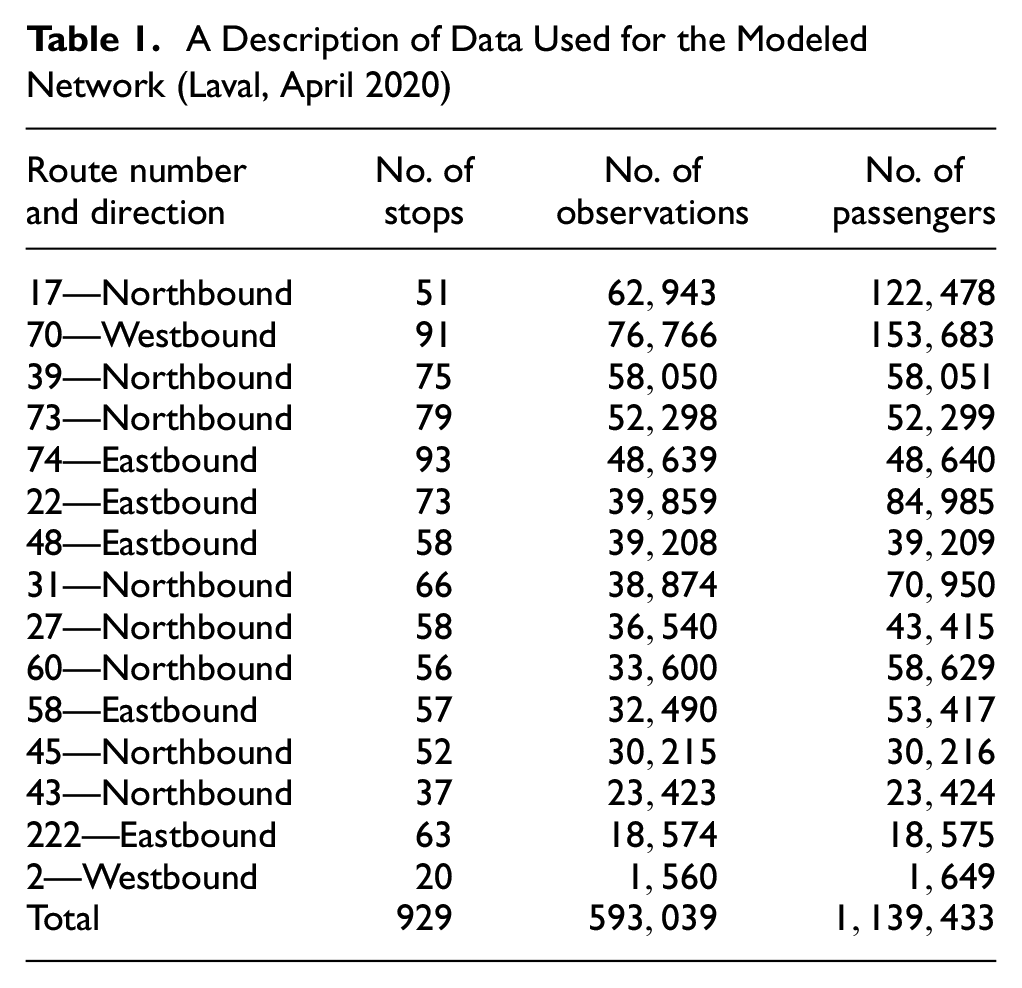
The data used in this study are from the automatic passenger counters (APC) of the Laval bus transportation system. Table 1 provides information about the route numbers, number of stops on each route, and number of observations per route for all routes in the modeled network of Laval. Each observation includes the number of passengers on board the bus when it leaves the stop (passenger flow). The “No. of Observations” column is the total number of times the buses appeared at the stops for each route, and the “No. of Passengers” column is the total number of passengers in the buses when they left the stops for each route. As can be seen, a total number of 929 stops from 15 routes have been studied. The studied network can be seen in Figure 1. The distance matrix
A Description of Data Used for the Modeled Network (Laval, April 2020)
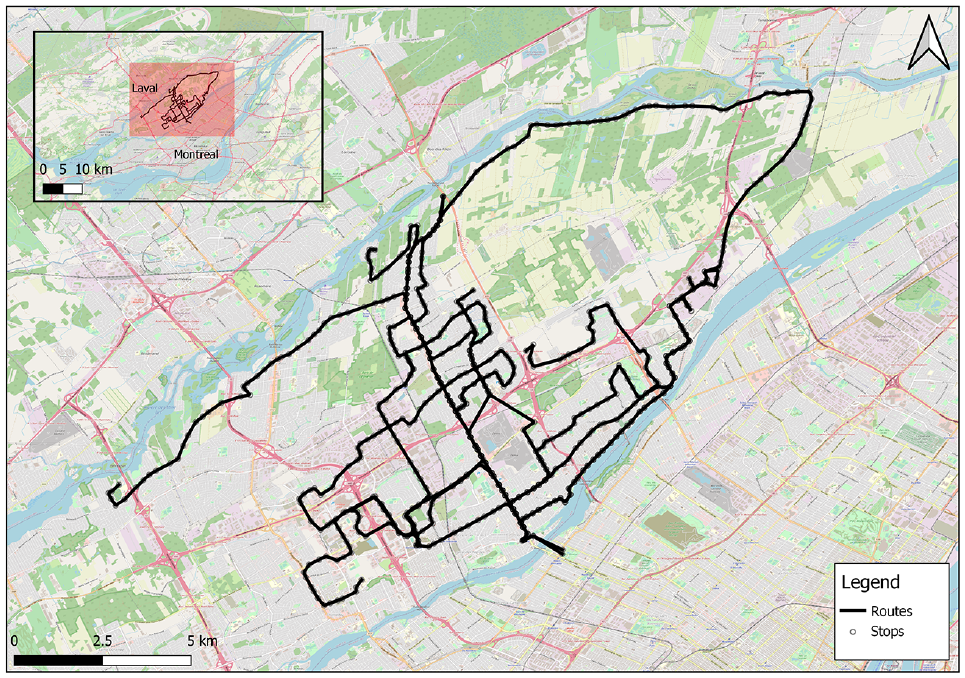
The modeled network of bus stations and routes, including route 17-Northbound and all routes intersecting it: Laval, Canada.
Experimental Setting
To evaluate the performance of the proposed model, in addition to comparing the predicted values with real observations, the model’s performance is compared with three other deep learning models. These are the multi-layer perceptron (MLP) model, the convolutional neural network (CNN) model, and the long short-term memory (LSTM) model. These models have been frequently used for passenger flow prediction in the literature in the past. For the BNG-ConvLSTM model, the dimensions of the hidden states are set as the number of nodes in the bus transportation network graph. The model is trained by minimizing the mean square error with a batch size of 32 and the initial learning rate of
Evaluation
To predict the passenger flows at each time interval, the historical data for 10 previous intervals are used as the input time series. All intervals are set equally to 10 min. The performance of the BNG-ConvLSTM model and three other deep learning models in this study are evaluated by two commonly used metrics: (1) mean absolute error (MAE); and (2) root mean squared error (RMSE). In addition, as our problem is predicting passenger flows we are also going to calculate the percent accuracy of predictions as Equation 14 shows.


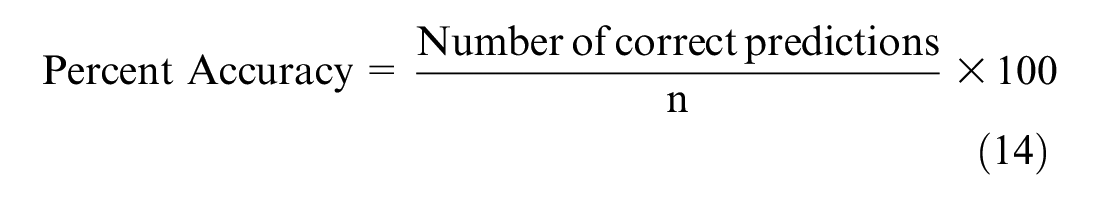
where
n is the number of observations for all stops in the test data set.
The estimation of MAE, RMSE, and percent accuracy is based on a stop-level prediction and real-world values. To clarify, for each time span of the test data set, the model will predict the value for each stop; therefore, if
Experimental Results
Moreover, the performance results, shown in Table 2, indicate that the BNGCal LSTM model outperforms other models with all four evaluation metrics. The values in Table 2 are calculated for all test observations based on the real and predicted values. As can be seen, the MAE and RMSE values for the BNG-ConvLSTM model are respectively
Performance Comparison between Different Models
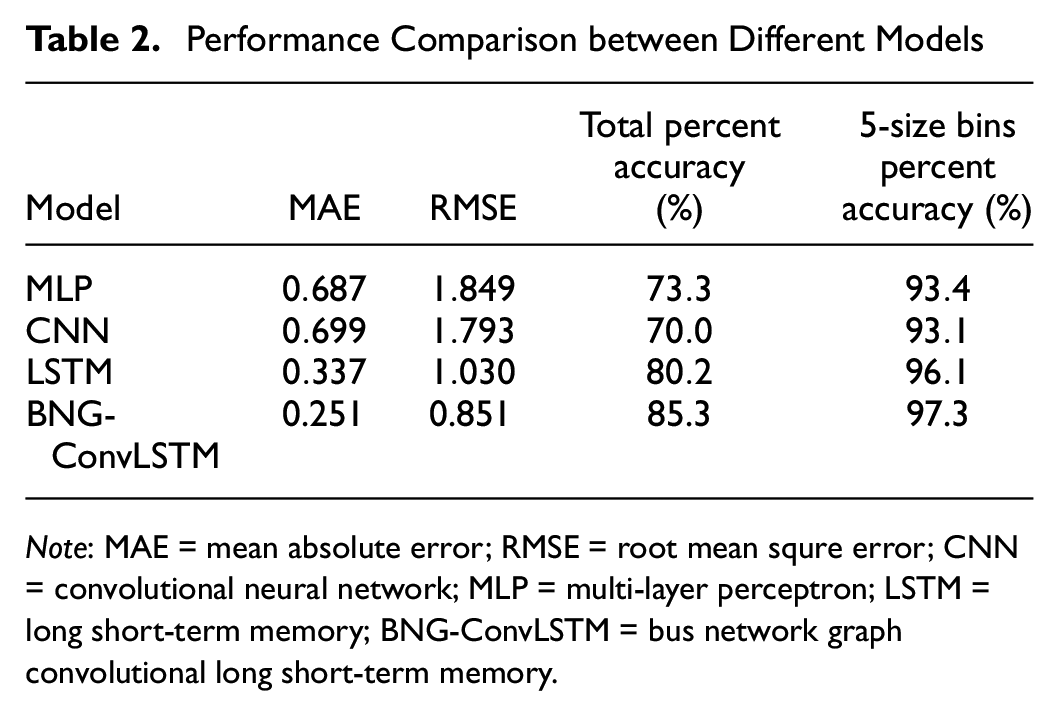
Note: MAE = mean absolute error; RMSE = root mean squre error; CNN = convolutional neural network; MLP = multi-layer perceptron; LSTM = long short-term memory; BNG-ConvLSTM = bus network graph convolutional long short-term memory.
Performance Comparison Between Different Models in Peak Hours on Weekdays
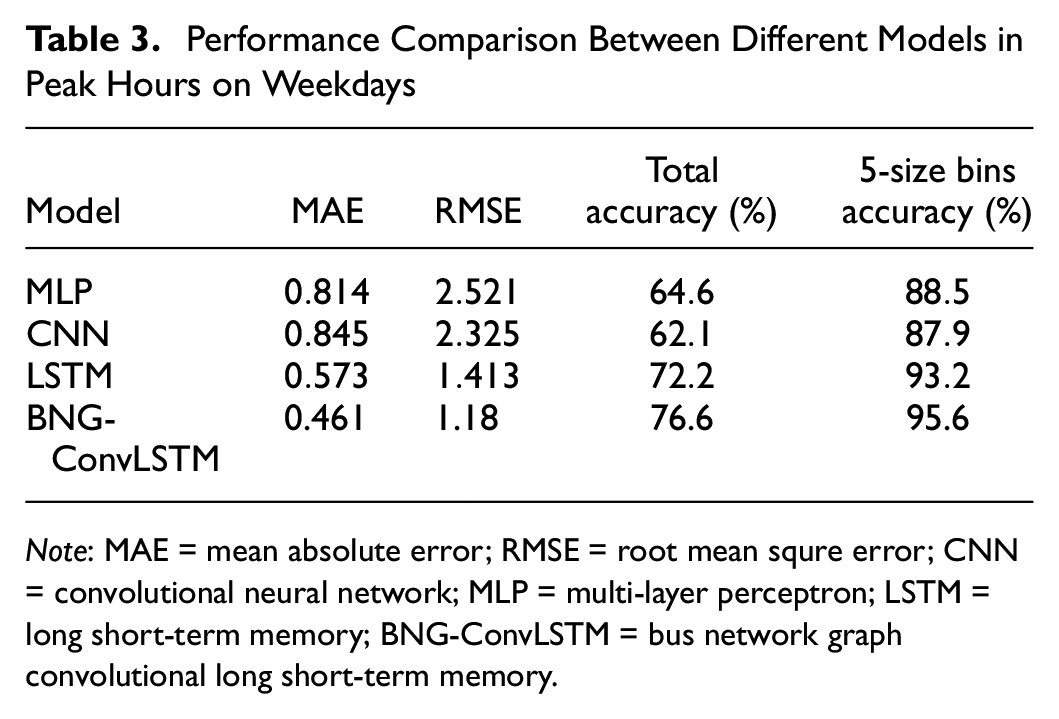
Note: MAE = mean absolute error; RMSE = root mean squre error; CNN = convolutional neural network; MLP = multi-layer perceptron; LSTM = long short-term memory; BNG-ConvLSTM = bus network graph convolutional long short-term memory.
The training efficiency of the BNG-ConvLSTM model and other deep learning models in this study is examined. Figure 2 shows the validation loss curves versus the training epoch for all models. In the training process, the early stopping mechanism is used, so that each model can have a different number of training epochs. As Figure 2 indicates, the loss function of the BNG-ConvLSTM model decreases faster than the other models. This model needs fewer epochs than LSTM to coverage. However, the MLP and CNN models converged in fewer epochs than the BNG-ConvLSTM model.
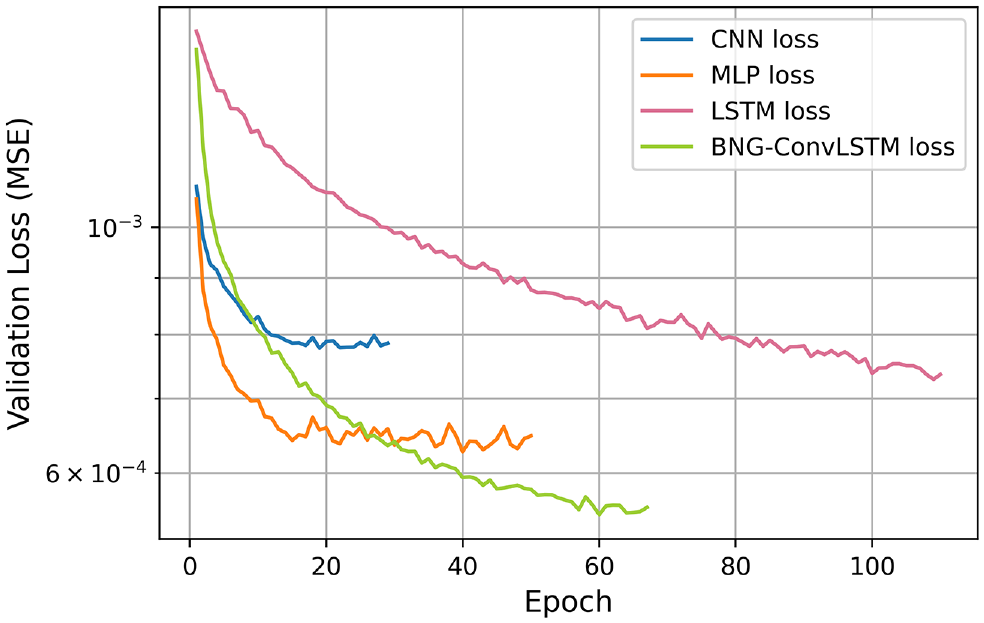
Validation loss versus training epoch.
Also, the comparison of computation time for all models is shown in Figure 3. As can be seen, the running time of each epoch for the BNG-ConvLSTM model is more than the other models. The difference between the running times of each epoch for the BNG-ConvLSTM model are far greater than that of MLP and CNN models, and since these two models also converged in a smaller number of epochs than the BNG-ConvLSTM model, the total running time of these two models is much less than the BNG-ConvLSTM model. However, because the BNG-ConvLSTM model converged in fewer epochs than the LSTM model, the total running time of this model is almost equal to LSTM model. All of the models were implemented on the OMEN GT13-0090 30L Gaming PC with characteristics of NVIDIA® GeForce RTXTM 3090, Intel Core i9-10850K, and HyperX® 32 GB DDR4-3200 XMP MHz RAM (2 × 16 GB).
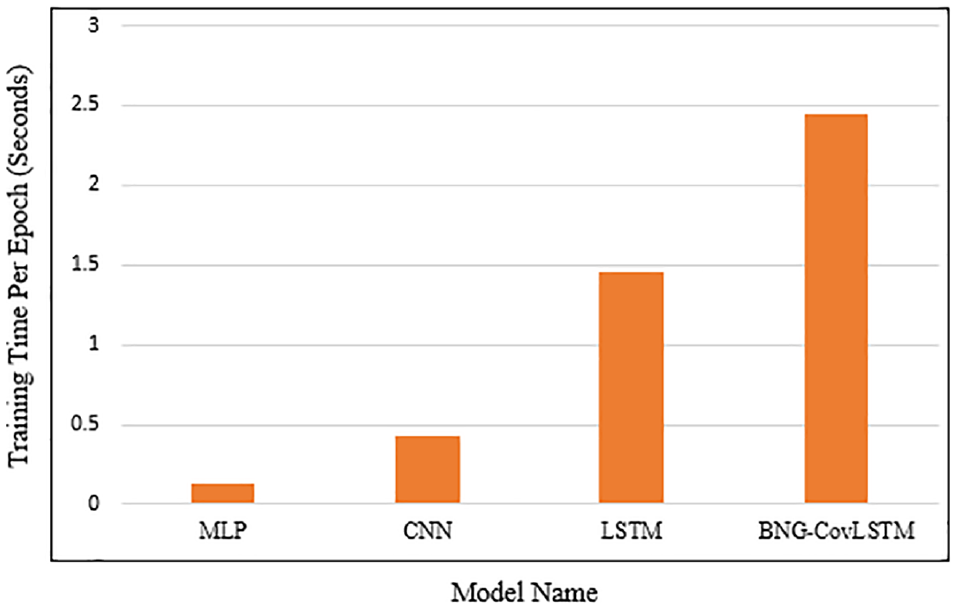
Comparing computation time between LSTM and BNG-ConvLSTM models.
Conclusion
This paper develops a novel graph-based deep learning approach based on the GNN traffic forecasting framework of Cui et al. ( 4 ) for short-term prediction of passenger flows in a bus network. To do so, we define a BNGC operation that incorporates the adjacency and bus network proximity matrices to extract the spatial features of the network. We propose a BNGCal LSTM (BNG-ConvLSTM) neural network to forecast network-wide passenger flow. Therefore, in the formulation of the model, both the spatial and temporal aspects of the passenger flow are considered.
Moreover, based on actual data of the bus network of Laval, Canada, a case study is carried out to compare the proposed BNG-ConvLSTM with other prediction methods, that is, multi-layer perceptron (MLP) model, the convolutional neural network (CNN) model, and the general long short-term memory (LSTM) model. The proposed model performs better than the other candidate models on the measurement of mean absolute error (MAE) and root mean square error (RMSE). In addition, we compare the percent accuracy of the models’ results. We also calculated the percent accuracy for a scenario where passenger flow is classified into bins of size 5. The BNG-ConvLSTM model shows more accurate results than other models, even when the bin size is relatively small, meaning it can accurately predict many passenger flow variations.
Although the proposed framework has demonstrated its ability to make robust predictions for the short-term passenger flows at the network level, it is not yet complete. Further research is required. Firstly, to improve the proposed model further, other factors, such as weather, construction, festivals, weekday, or weekend could be considered. Secondly, the origin destination matrix in different periods could also be considered in future research to assess the spatial correlation of each stop in each time period. Furthermore, GTFS data, bus frequency, and bus capacity could be considered in calculating network proximity so that it is more realistic.
Footnotes
Acknowledgements
Our appreciation goes out to BusPas Inc and Mitacs Accelerate Program for supporting this research. We would also like to show our gratitude to Société de transport de Laval (STL) for providing the data.
Author Contributions
The authors confirm contribution to the paper as follows: study conception and design: Asiye Baghbani, Nizar Bouguila, and Zachary Patterson; data collection: Nizar Bouguila, and Zachary Patterson; analysis and interpretation of results: Asiye Baghbani, Nizar Bouguila, and Zachary Patterson; draft manuscript preparation: Asiye Baghbani, Nizar Bouguila, and Zachary Patterson. All authors reviewed the results and approved the final version of the manuscript.
Declaration of Conflicting Interests
The author(s) declared no potential conflicts of interest with respect to the research, authorship, and/or publication of this article.
Funding
The author(s) received no financial support for the research, authorship, and/or publication of this article.