
Abstract
As part of a long-term monitoring project, a two-span continuous steel I-girder bridge (skewed 41° with seat-type abutments) was instrumented and evaluated in the field during construction and after the bridge was in service. This paper discusses data from when the first stage (of a three-stage sequence) was constructed and initially opened to traffic. Girders and cross-frames were instrumented with strain gauges using a data acquisition system with a high sampling frequency (up to 20 Hz). Data collection began just before deck placement, and a series of live load tests was then conducted on the completed Stage I (half of the bridge) using a loaded truck. Three-dimensional finite element analyses were carried out to provide enhanced understanding of bridge behavior. Good agreement was observed between the numerical simulation results and the field monitoring data for both deck placement and live load testing. A slight inconsistency between numerical simulation and field measurement data at one girder section and an adjacent cross-frame indicated an unexpected local site condition, which was confirmed through a targeted field inspection. Live load distribution factors used during design conservatively overestimate bridge girder strong-axis bending response under live load (by around 50%). Maximum flange lateral bending stresses of 6.3 MPa (0.9 kips per square inch [ksi]) and 2.5 MPa (0.4 ksi) were observed during deck placement and truck tests, respectively. In addition, out-of-plane response of 10.6 MPa (1.5 ksi) was observed at girder web plates under concrete dead load.
Spatial distribution of construction and in-service loads for skewed steel I-girder bridges is complex—skew effects may lead to lateral bending, web out-of-plane bending, and flange local bending. The AASHTO LRFD (load and resistance factor design) Bridge Design Specification, 8th Edition, requires bridge skew to be considered when determining live load distribution, and additional lateral bending stress should be considered when a bridge is skewed more than 20° ( 1 ). However, field data to support the current design approach is sparse. In addition, a recent survey of state bridge engineers identified a range of common practices across the United States and illuminated knowledge gaps and opportunities for research contributions related to skewed steel I-girder bridges ( 2 ).
Bridge superstructure behavior is complicated by skew effects caused by additional load paths introduced via the skewed supports and through load transfer at cross-frames. In prior research, skewed steel I-girder bridge live load response was sometimes not well predicted by current analysis procedures and design requirements, including unexpectedly large stress variations in the bottom flanges of I-girders during long-term field data collection ( 3 ), as well as steel I-girder web out-of-plane response (also referred to as web warping) and biaxial bending of cross-frames during live load testing ( 4 ). Large torsional rotations and locked-in web plate initial imperfections that are not considered in design have been reported at bridge exterior girders during deck placement ( 5 ), and such rotations were found to increase with greater bridge skew ( 6 ). Lateral bending and web plate out-of-plane behavior should be further investigated for all girders, especially for bridges employing staged construction where a more slender half-bridge—compared with the eventual full designed bridge—is first loaded.
Systematic large-scale testing, with a focus on skewed steel I-girder bridge superstructures during construction and shortly after a bridge goes into service, can contribute to further understanding of girder and cross-frame behavior at the early stages of a bridge’s lifespan. As part of a long-term monitoring project, a continuous steel I-girder bridge (skewed 41°) was instrumented and tested in the field during the early phases of construction and through the in-service phase of Stage I (approximately half of the bridge). Girder and cross-frame strain variations were recorded during deck placement and truck testing using a data acquisition system with a high sampling frequency, and bridge superstructure behavior under construction dead load and live load was analyzed.
Although 3-D finite element analysis (FEA) is now a more common and efficient tool for predicting and understanding the behavior of large and complicated bridge structures, the accuracy of numerical simulations largely depends on refined modeling of bridge component and connection details, sufficient representation of boundary conditions at supports, and correctly capturing site conditions unique to specific projects. Incorporating modeling techniques and experience from previous research ( 7 , 8 ), this study has implemented a robust numerical simulation framework through refinements in: 3-D modeling of cross-frame elements; connection of superstructure components; representation of girder-deck composite behavior and the girder-formwork connection; and boundary conditions. The current research investigates a newly-constructed bridge, so field inspections were arranged to thoroughly understand actual bridge conditions. 3-D FEA was conducted to provide enhanced understanding of bridge behavior, with numerical simulation methods validated against field measurements (including a few inconsistencies explored during field inspection). Specific differences between design and actual scenarios of the bridge were considered in numerical simulations, which improved the accuracy of the analysis.
Bridge superstructure response from field monitoring and numerical simulation was compared with and evaluated against current analysis procedures and design requirements. Design-level—using line girder analysis (LGA)—strong-axis bending stress demand accurately captures the behavior of the bridge under concrete dead load, while the live load distribution factor conservatively overestimates bridge girder strong-axis bending response when subjected to live load (by around 50%). Flange lateral bending stress was observed at instrumented girder cross-sections that were between cross-frames, but the lateral bending stress values were within the expected range associated with skew effects when a refined method of analysis is not used, according to the current AASHTO Specification ( 1 ). Some web plate out-of-plane bending behavior was also observed during deck placement.
Field Monitoring Set-up
Overview of Bridge and Instrumentation Configuration
The bridge described here—Mattis Avenue over I-74 (Mattis-74)—is one of two bridges in Champaign, Illinois that was instrumented during construction for a long-term field monitoring campaign. Mattis-74 is a two-span continuous stub abutment bridge with skew angle of 41° and 12 1.8-m (70-in.) deep plate I-girders; X-shaped cross-frames are arranged perpendicular to the girder lines in a staggered configuration. The bridge was constructed in three stages (Figure 1a), where Stage I (approximately half of the bridge) was built and in service while Stage II was under construction. Stage III was then a closure pour between Stages I and II toward the end of the construction period. Instrumentation was primarily placed on the Stage I portion of the bridge, and this paper presents behavior and analysis of that stage under construction loading and live load. Strain gauges for instrumentation at selected girder cross-sections, as well as on critical cross-frames and in key concrete locations, were installed early enough to start data collection during Stage I construction. Global geometry and strain gauge layouts for the Mattis-74 bridge are shown in Figure 1a. (Mattis-74 instrumentation for the overall project also includes tiltmeters for girder end rotation and displacement transducers for bridge superstructure–substructure relative movement, but those measurements were not ready until after the timeline of interest for this paper.) The concrete deck slab was placed in two phases (Phase 1 in the positive moment regions and Phase 2 in the negative moment region), as shown in Figure 1b. Phases 1 and 2 were separated by six days. Phase 1 deck placement was conducted in two parts—Phase 1.1 in the south span and Phase 1.2 in the north span—during the same day.
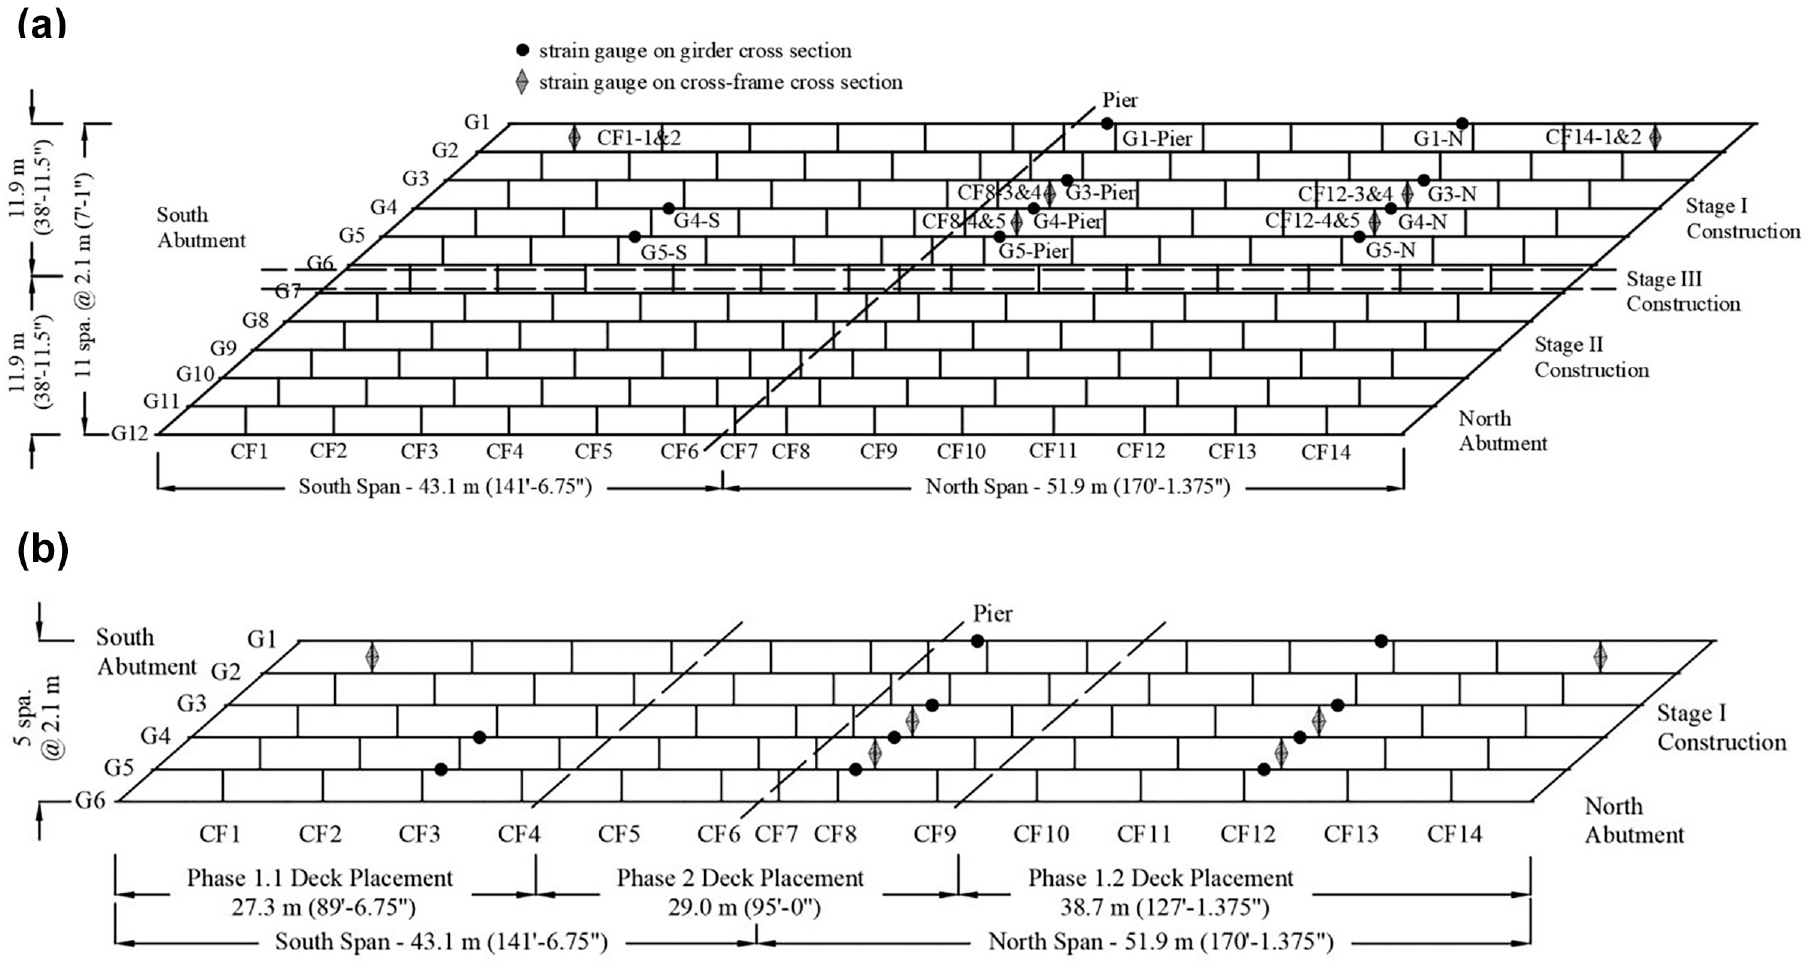
Plan view of: (a) full Mattis-74 bridge with strain gauge locations; and (b) Stage I for Mattis-74 with deck placement plan.
Ten girder sections and six cross-frames were instrumented for field monitoring, as shown in Figure 1, where the girders are labeled as G1 through G12 and the cross-frames are labeled as CF1 through CF14. Most girder strain gauges were placed midway between two adjacent transverse stiffener locations, where cross-frames also attach, to avoid localized effects from girder-stiffener connections. Strain gauges were installed along the bridge longitudinal direction to measure normal strain at girder cross-sections, and the strain gauges on cross-frames were also oriented along the length of angle members for measurement of normal strain. Figure 2 presents the strain gauge locations and naming convention for typical girder and cross-frame installations. Gauge names are added to a girder cross section or cross-frame name. For example, “G1-Pier-TE” represents the
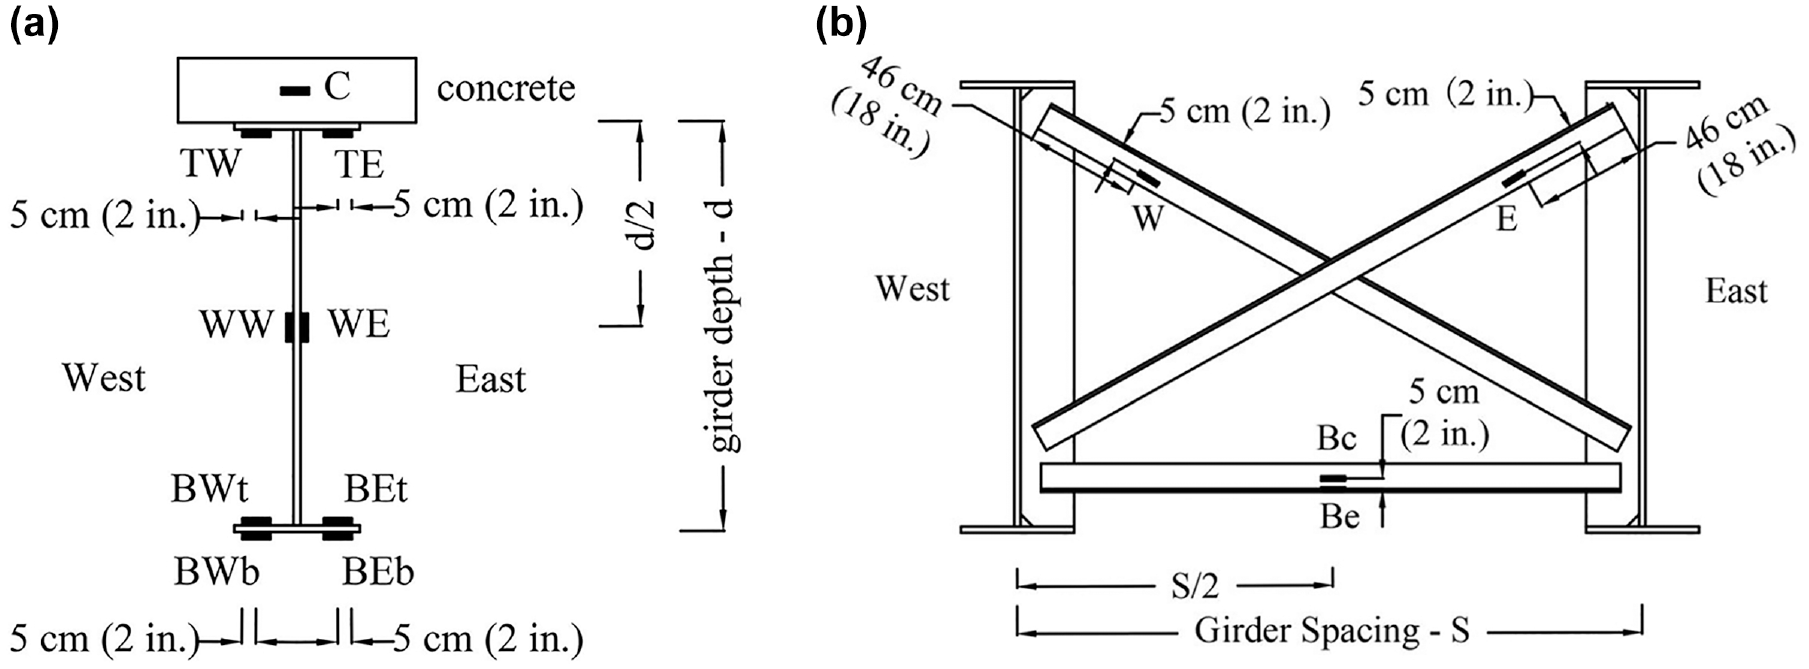
Strain gauge locations and naming convention for: (a) girder cross section; and (b) cross-frame.
As indicated in Table 1, girder cross-sectional strain gauge locations were either heavily instrumented, with nine total gauges (Figure 2a), or lightly instrumented with just four gauges—two on the top flange and two on the bottom flange. Four girder cross-sections of Mattis-74 were heavily instrumented, and the other six were lightly instrumented. Vibrating wire strain gauges ( 9 ) were used, along with a data logger that accommodates synchronized acquisition up to a sampling rate of 20 Hz ( 10 ). Longer-term monitoring is being conducted at a lower sampling rate of 1 Hz, including for data measurement and collection during deck placement; short-term live load truck testing employed the 20-Hz sampling rate. The model 4150 strain gauge has a 51-mm (2.0-in.) gauge length (with 3000-µε range, 0.4-µε sensitivity) and is designed to measure strains in steel structures where space may be limited. These gauges can be installed quickly and easily by means of a capacitive discharge spot welder for long-term durable field monitoring. The model 4200 gauge (3000-µε range, 1-µε sensitivity) can be secured to reinforcement and embedded to measure strain variation in concrete. Each vibrating wire gauge has a built-in thermistor that provides a temperature reading simultaneously with the strain measurement.
Strain Gauge Locations (X) for Each Instrumented Girder Cross Section
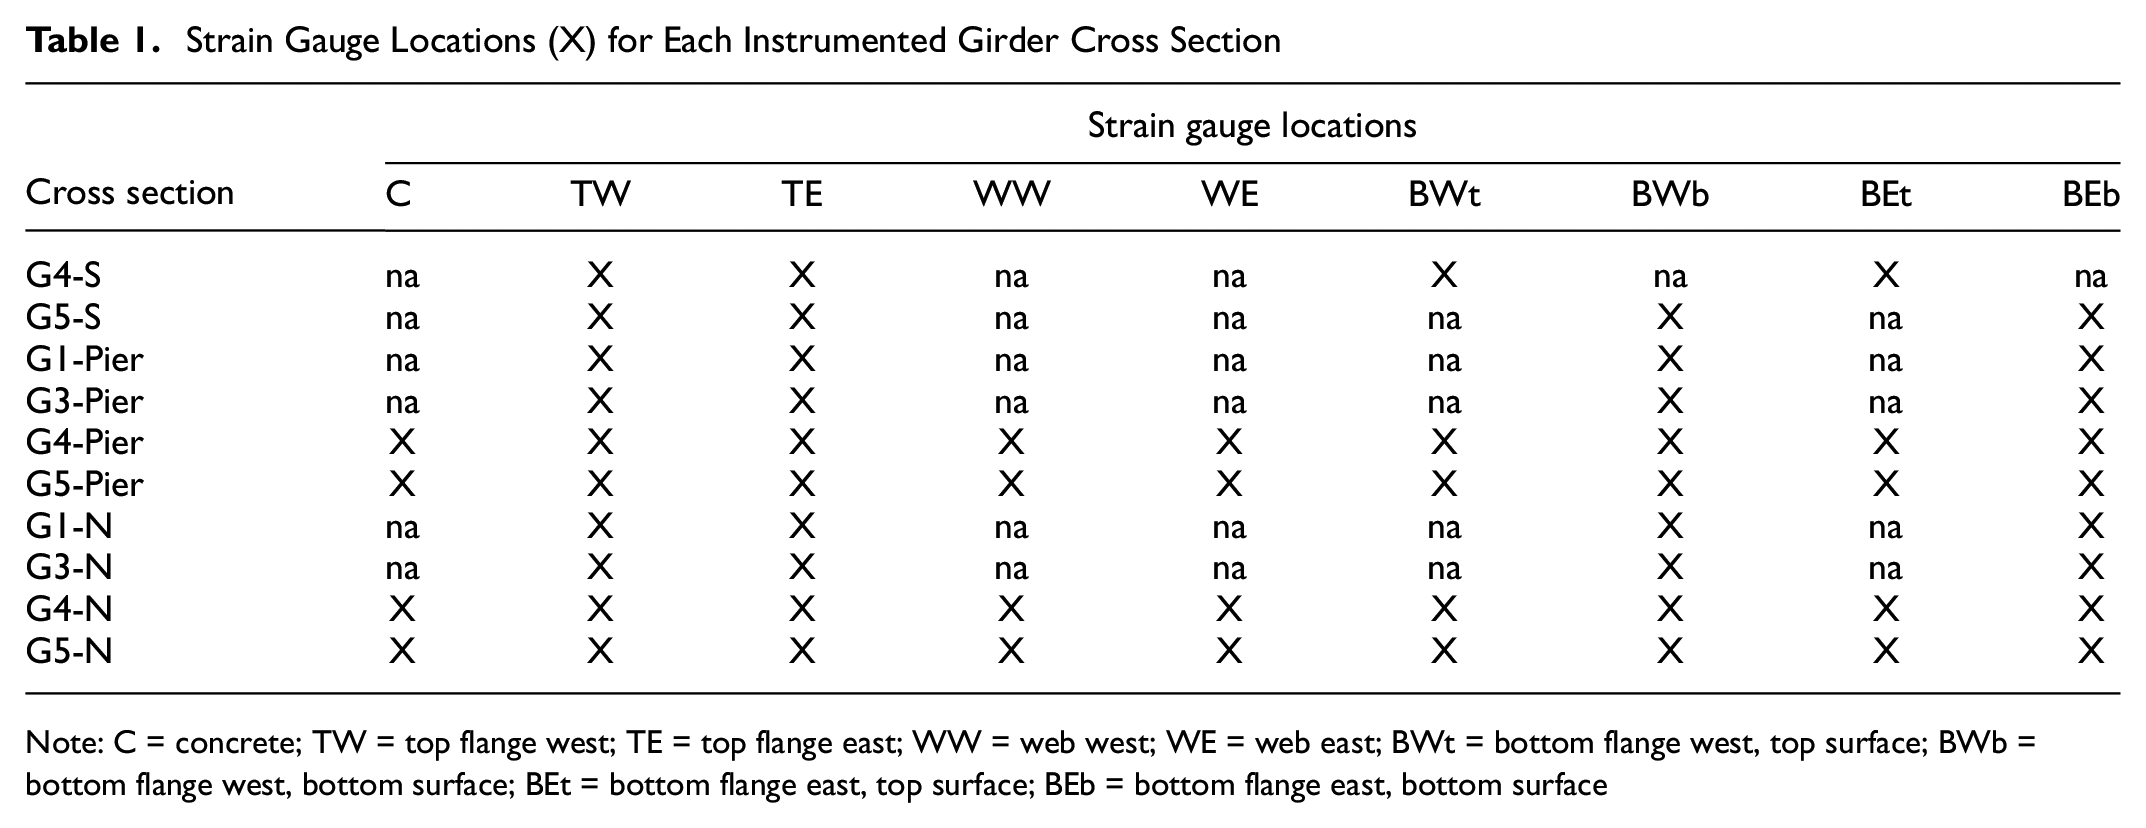
Note: C = concrete; TW = top flange west; TE = top flange east; WW = web west; WE = web east; BWt = bottom flange west, top surface; BWb = bottom flange west, bottom surface; BEt = bottom flange east, top surface; BEb = bottom flange east, bottom surface
Isolated Truck Loading for Mattis-74 Bridge
Isolated truck testing was conducted shortly after Stage I construction was complete, so the test results reflect behavior of a more flexible structure than the full bridge. Testing took place over the course of just 1 h, before the Stage I half of the bridge was open to traffic, so any effects from thermal or adjacent traffic loading were considered to be negligible. A truck owned by the Illinois Department of Transportation (DOT) ( 11 ) was used as a test vehicle, with the total vehicle weight of 192 kN (43,040 lb) distributed between a front axle weight of 54 kN (12,120 lb) and a rear tandem axle weight of 138 kN (30,920 lb) (Figure 3).
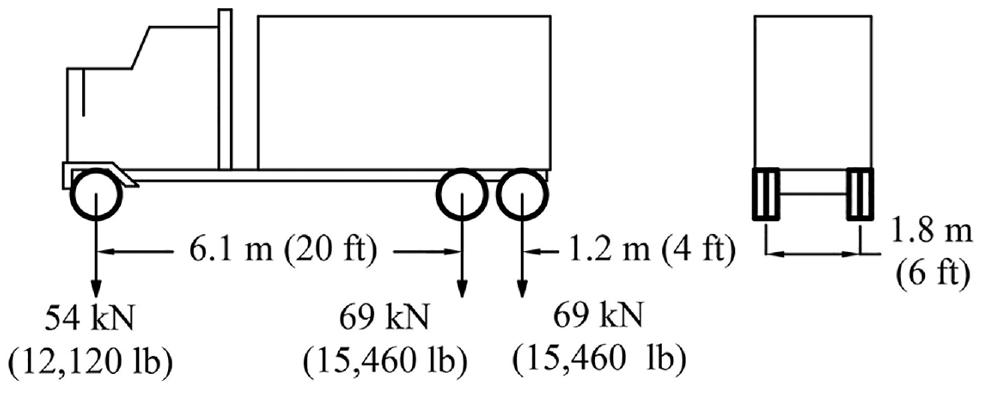
Test truck configuration and loading.
Five truck paths were used during the 1-h truck testing period, as illustrated on the completed Stage I bridge cross-sectional and plan views in Figures 4 and 5, respectively. The paths shown in these figures represent centerlines of the truck during the tests, and the truck was driven at a crawl speed (of less than 3 km/h [2 mph]) to minimize dynamic effects. Paths were selected to load the bridge along its width in 1.5-m (5-ft) increments from the sidewalk to the median. Testing started with the truck along Path 1, driven from the south to north end of the bridge. The truck was then backed up from north to south along the same path. This process was repeated for each of the designated paths—Tests 1, 3, 5, 7, and 9 were the truck driving from south to north, and Tests 2, 4, 6, 8, and 10 were the truck backing from north to south. The tests are numbered chronologically, and the average time for each test was around 200 s.
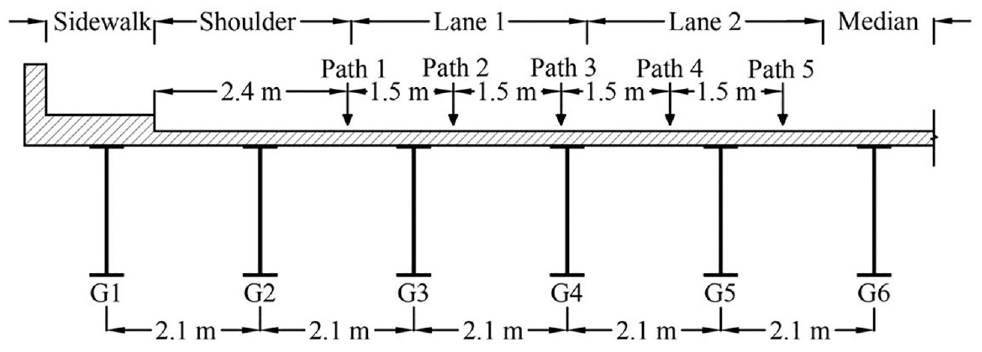
Illustration of truck paths on Stage I Mattis-74 cross-sectional view.
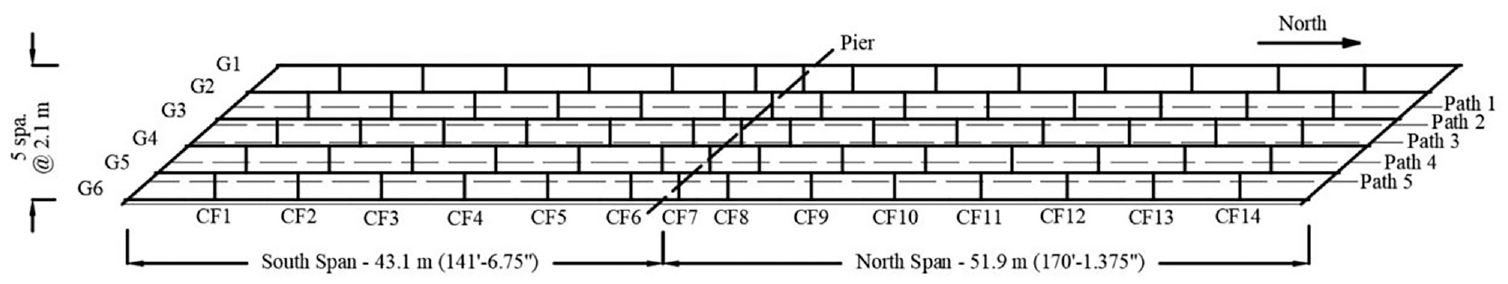
Illustration of truck paths on Stage I Mattis-74 plan view.
Field Data Processing Scheme
Normal strain induced at a gauge location (

I-Girder Strain and Stress Decomposition
Axial force (

Normal strain induced by lateral bending of the girder top flange


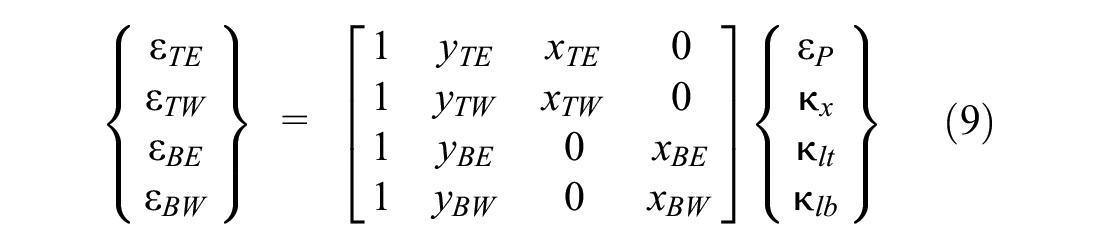
Elaborating on Equation 1, the normal strain at each bottom flange gauge location of a heavily instrumented girder cross section can be expressed in Equations 5 and 6. These equations correspond to the east side; similar equations for the west side are not shown for brevity, but equations for both the east and west sides are shown together in matrix form in Equation 9. With symmetric placement of bottom flange gauges about the y-axis, averaging Equations 5 and 6 yields Equation 7, which corresponds to the strain at mid-thickness of the girder bottom flange on the east side (without considering responses caused by flange plate local bending). Similarly, Equation 8 illustrates the normal strain component at the bottom face of the girder top flange on the east side. Equations 7 and 8 (for the east side) can then be formalized into matrix form, along with the similar equations for the west side, as shown in Equation 9, where the left-side vector contains measured strains and the right-side vector contains unknown axial strain and curvature values associated with the decomposed effects on the section.
With a set of measured strains and the inverted coefficient matrix, which contains known geometric parameters associated with gauge locations, the unknown axial strain and curvatures can be calculated. For a lightly instrumented girder cross section, only four gauges are installed (TE, TW, BEb and BWb), and so in this case Equation 7 is directly associated with a gauge location on the flange surface (Equations 5 or 6) and not the flange mid-thickness strain. In all cases, decomposed strain caused by strong-axis and weak-axis bending moment at each strain gauge location can then be calculated according to the linear relationships indicated in Equations 2 through 4. A previous research project that conducted large-scale field testing on curved I-girder bridges used a similar approach to decompose girder cross-sectional behavior ( 12 ).


For heavily instrumented girder locations, subtracting Equation 6 from Equation 5 evaluates strain caused by flange plate local bending at the east side (Equation 10), and a similar expression can be derived for the west side (Equation 11). Strain components at girder web gauges can be expressed as Equations 12 and 13, where strain caused by out-of-plane behavior of a girder web (


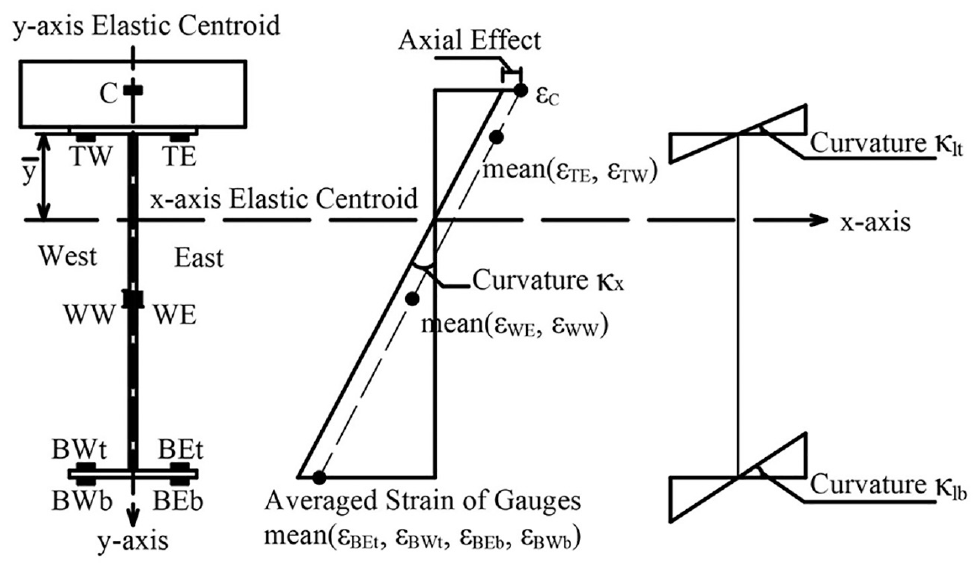
Strong-axis and weak-axis flexure of an I-girder.
Illustration of I-Girder Cross-Sectional Behavior
The average of normal strain readings from two gauges symmetrically placed about the y-axis provides normal strain at the y-axis without effects from lateral bending, as shown in Figure 6. In addition to the decomposition calculation shown in Equation 9, curvature of a girder cross section under strong-axis bending (
Figure 7a presents the girder cross-sectional strain distribution at G4-N when the largest
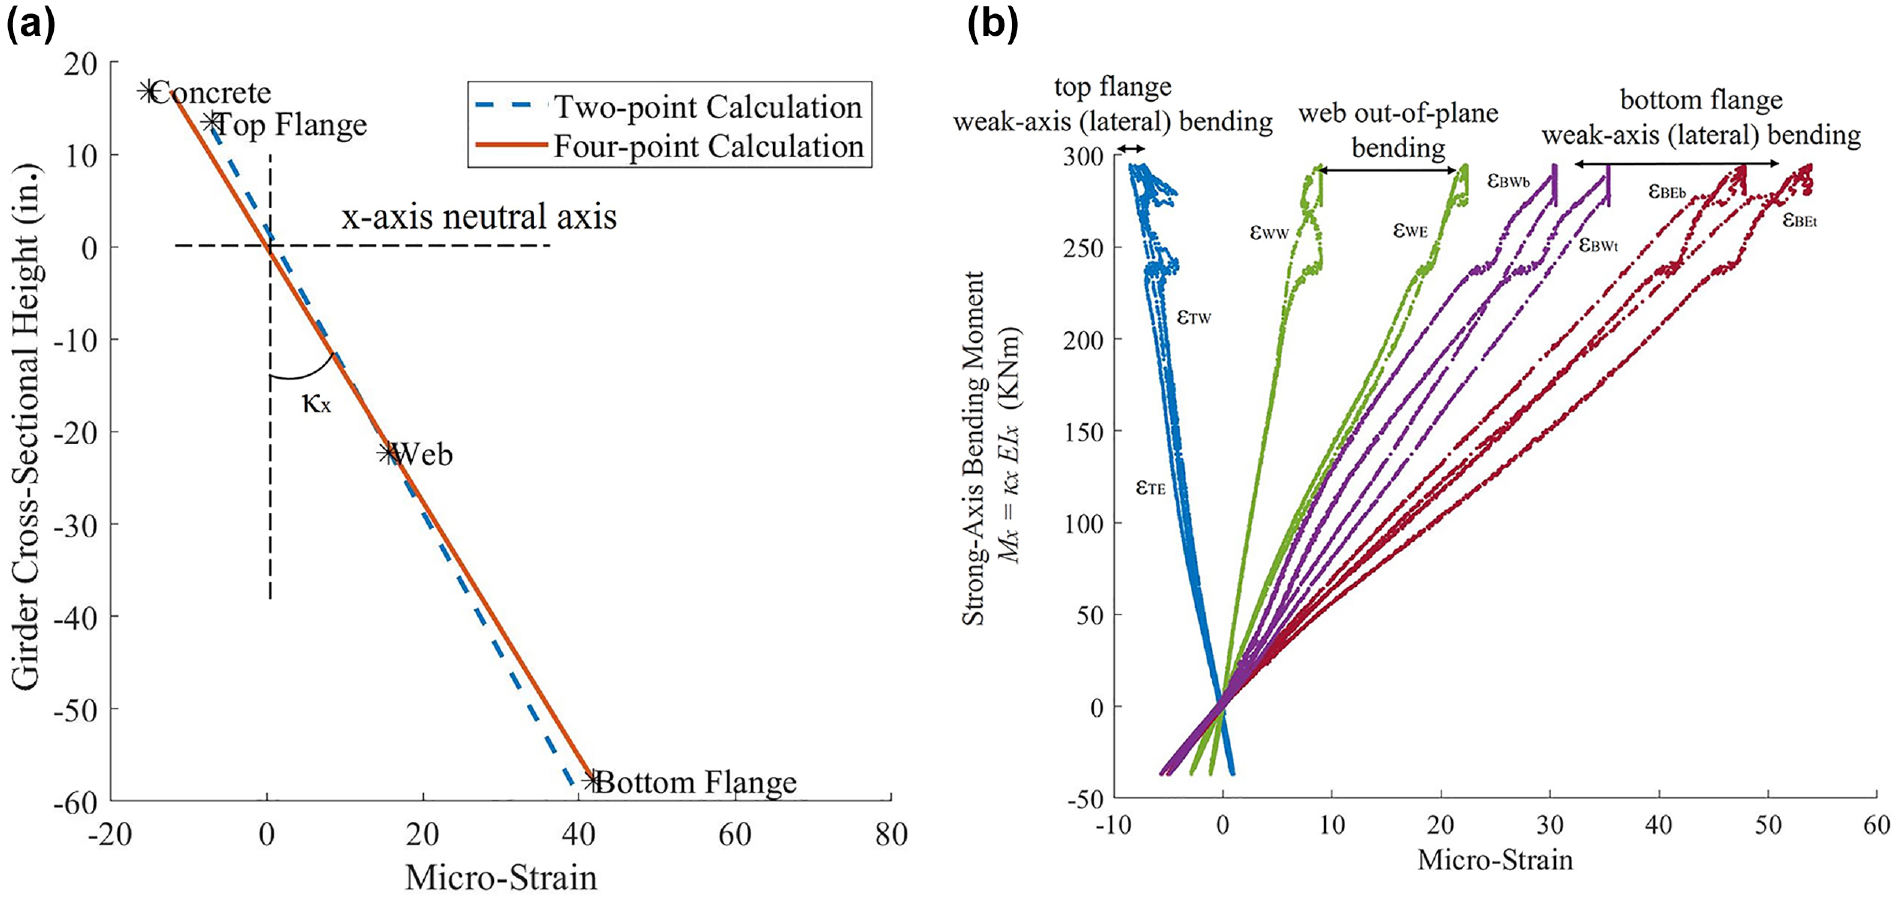
Cross-sectional behavior of G4-N: (a) strong-axis bending curvature evaluation (1 in. = 25.4 mm); and (b) strain variation versus strong-axis bending moment during truck load Test 6.
Figure 7b shows moment versus strain at all gauge locations for cross section G4-N during truck Test 6. It can be seen that these moment versus strain relationships are predominantly linear, and separations between selected gauges indicate different types of localized behavior. Lateral bending of the girder top and bottom flanges can be observed by the difference between strain gauges on opposite (east and west) sides of the flanges, as indicated in Figure 7b. Similarly, web out-of-plane bending behavior can be observed by the difference between strain gauges on opposite (east and west) sides of the web. In the bottom flange, the primary strong-axis bending behavior causes a strain difference between gauges on the top and bottom, where the bottom gauges are more tensile than the top (Figure 7b
3-D Finite Element Numerical Simulation Method
3-D FEA was conducted using Abaqus 2017 ( 13 ) to enhance understanding of the field response for Stage I of the monitored Mattis-74 bridge under both deck placement and live load testing. Modeling methods are discussed in this section, with the results, comparisons, and other findings presented in subsequent sections of the paper.
Bridge Components and Connections
Figure 8 shows an overview of the Abaqus numerical model for Mattis-74 Stage I. Steel I-girders, a concrete slab, cross-frames, and stiffeners were all explicitly modeled with 3-D 4-node reduced integration shell elements (S4R), and end diaphragms were modeled with 3-D 2-node linear beam elements (B31). Global coordinates are defined (Figure 8), where X is along the girder line, Y is the vertical direction, and Z is perpendicular to the girder line. The corresponding displacement degrees of freedom (dofs) are
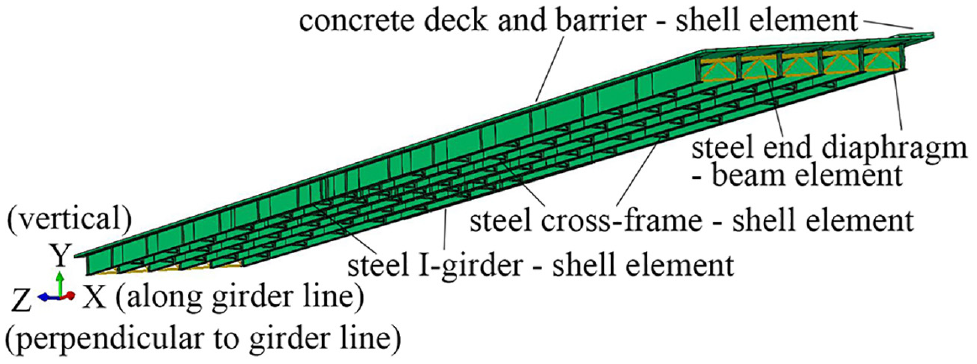
Overall view of Abaqus bridge model.
Girders were defined as continuous over their full length, with tie-constraints for all dofs at splices and changes in cross section. Bent plates, transverse stiffeners, and bearing stiffeners were all modeled as simple rectangular plates; they were connected to girder webs and flanges with tie-constraints in all dofs along all contacting edges. Connections between the two diagonal angle members of cross-frames were simplified as tie-constraints in all dofs at the region of the connection plate, and connections of cross-frames and transverse stiffeners were simplified as tie-constraints in all dofs over the bolted area. Cross-frame angle end connections were defined to the connected leg of the angle, accounting for realistic eccentric loading. All these simplifications related to connections were still adequate to reasonably capture global cross-frame behavior and load transfer between I-girders through the cross-frames.
Haunches were modeled to represent the concrete slab for the in-service bridge, and composite behavior was defined with tie-constraints connecting nodes of the haunches and steel girder top flanges in all six dofs. When considering the bridge during the deck placement process (when girder top flanges were connected with wooden formwork), the formwork was modeled with material having a small elastic modulus of 69 MPa (10 kips per square inch [ksi]) so that it did not function as bracing. As shown in Figure 9, interior formwork and girder top flanges were tied with all three displacement dofs, while the rotational dofs were released, and exterior formwork (where overhangs were supported during construction) were tied to the outside edge of exterior girders in all six dofs. These simplifications were compared with detailed modeling of overhang supports near exterior girders, and it was concluded that the tie-constraints (a cantilever simplification) were an efficient method to provide similar functionality as overhang brackets when considering global behavior. Dead load from wet concrete was then directly applied to the girder top flanges and formwork.
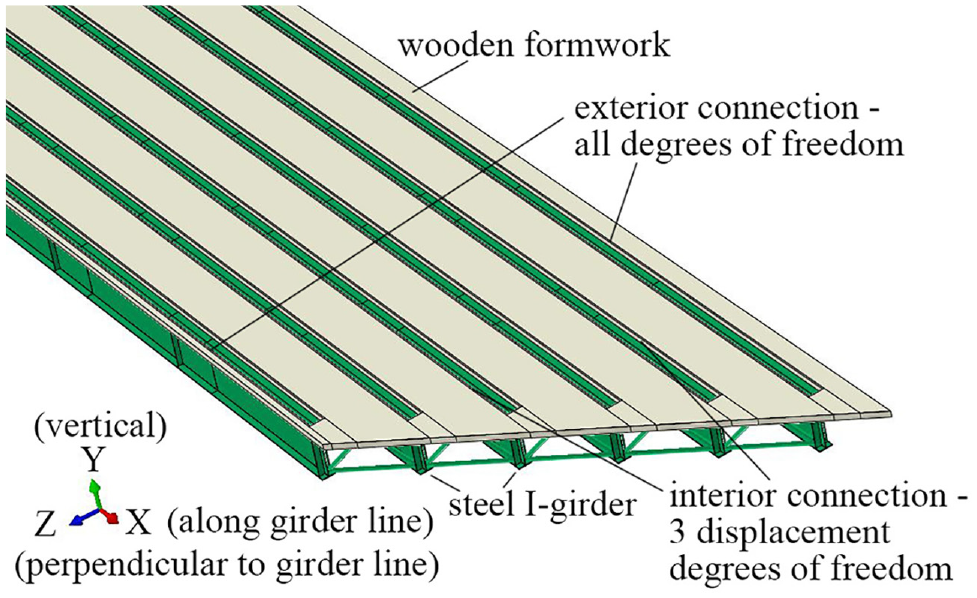
Modeling illustration of girders and formwork during construction.
Bridge Boundary Conditions, Loading, and Data Extraction
The bridge substructure was not explicitly modeled, so girder boundary conditions represent simplified bearing properties connected to a rigid substructure. Figure 10 shows the nodes across the girder bottom flange width at a bearing stiffener where the bearing properties are defined.
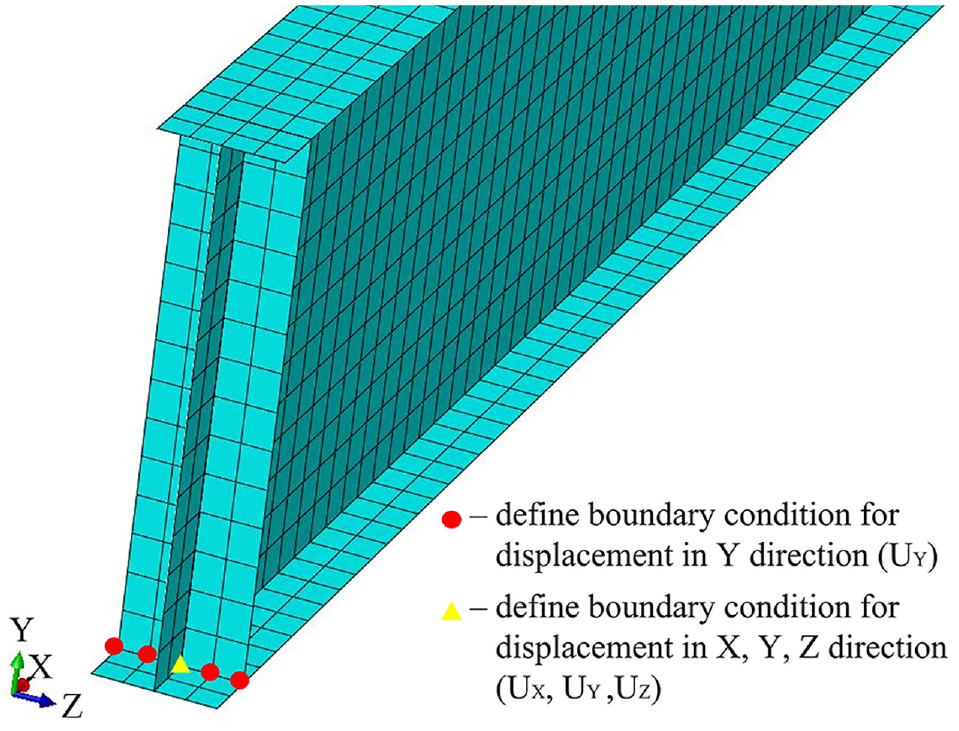
Location of bearing springs and boundary condition definitions.
Bearings at the two end supports of the Mattis-74 stub abutment bridge are Type I 13-d elastomeric bearings designed according to the Illinois DOT Bridge Manual ( 14 ); their spring stiffnesses in three dimensions were determined by recommendations from previous literature ( 15 – 17 ). At a bearing stiffener, an expansion bearing is represented with linear springs in the X, Y, and Z directions at the web-flange intersection node, and linear springs in the Y direction at other nodes across the bottom flange width (as shown in Figure 10).
The middle pier support can be treated predominantly as a restrained support. When studying bridge behavior during deck placement, the displacement dofs in the Y direction are restrained across the bottom flange width at the middle (pier) bearing stiffener, with the X and Z directions also restrained for the bottom flange-web intersection. When studying the in-service bridge behavior under live load, the vertical (Y direction) displacement dofs (
Live load truck testing and deck placement were simulated in Abaqus using a DLOAD user-subroutine, with static load steps representing slow speed truck testing and the concrete pour. Truck wheels were defined as 50 cm by 25 cm (20 in. by 10 in.) areas of pressure ( 1 ). Wet concrete was placed along the skew, and girder response from concrete dead load was studied for deck placement. All modeling instances were seeded with an element size of 13 cm (5 in.), using quadrature-dominated unstructured mesh, and local coordinates were adjusted to properly extract normal stress from elements of interest. A five-point through-thickness Simpson’s Rule integration was used for all S4R elements. Section points SP1 and SP5 were extracted for normal stresses representing the bottom and top surfaces of the shell elements, respectively.
Field Measurement and Numerical Simulation Results
Field measurements from deck placement and truck testing on Mattis-74 Stage I were studied together with numerical simulation results. Field data collected during truck tests were initialized at the beginning of each test, which means that the 10 truck tests shown in Figures 4 and 5 were initialized at 10 different time stamps. The monitored data during deck placement were initialized at the beginning of each phase of deck placement, where Phases 1.1 and 1.2 shown in Figure 1b were considered as a continuous process under Phase 1. As will be shown below, the numerical model generally agreed with field measurements with regard to bridge superstructure behavior, while a few field responses that were not well reproduced by numerical simulation were investigated in more detail. Field monitoring and numerical modeling results were then compared with design expectations for both dead and live load effects.
Girder Response Under Truck Test Loading
For a composite girder bridge under live load, response variation is more critical at the bottom flange than the continuously-braced top flange, particularly when considering flange lateral bending and plate local behavior. The maximum field-monitored bottom flange responses caused by girder strong-axis bending and flange lateral bending for each girder cross section were calculated from truck test data, and the maximum associated stresses among the 10 truck tests are shown in Figure 11. The particular truck test during which each maximum stress component was observed is also shown in Figure 11.
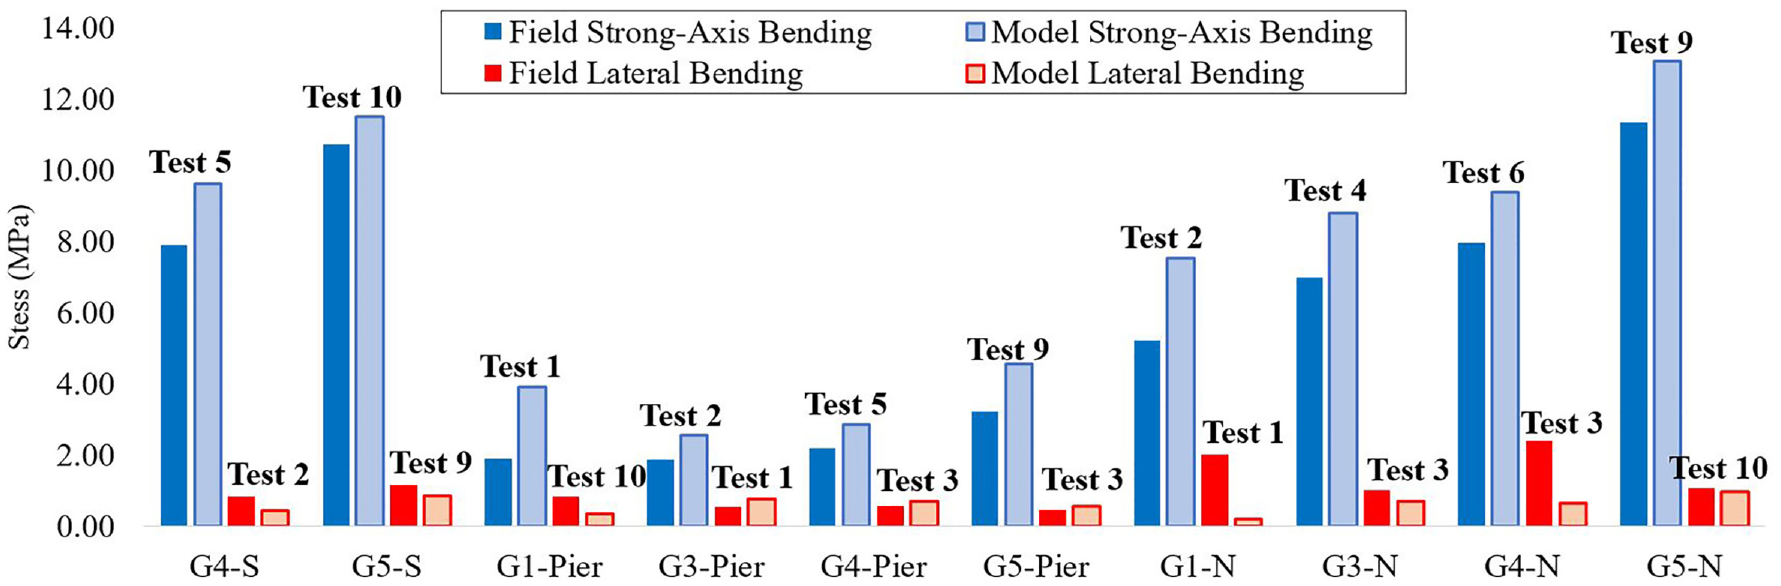
Maximum stress components at girder bottom flange caused by strong-axis bending and lateral bending during truck testing, from field measurement and numerical simulation.
Numerical simulation was conducted for the 10 truck tests, and maximum stress components from strong-axis bending and lateral bending were compared against those from field measurement during the same truck test. In general, the numerical simulations reasonably captured the response of the bridge under live load for both girder strong-axis bending and flange lateral bending. Modest overestimation of bottom flange stress caused by girder strong-axis bending could be because of modeling assumptions related to the concrete deck properties, no concrete cracking, and no explicit simulation of reinforcement in the model. Girder bottom flange lateral bending stresses from field measurement were close to those predicted by numerical simulation, with the exception of G1-N and G4-N that exhibited the largest differences between field and simulation. The significant difference at G1-N is attributed to fascia girder effects, where temporary barriers and diagonal braces influenced field response and were not included in the simulation. The large difference at G4-N is unexpected since it is an interior girder, and other interior girder locations show closer agreement between field and simulation. Behavior around G4 near the midspan is further investigated in the next section.
For a line girder analysis of a skewed bridge, the Illinois DOT Bridge Manual suggests unfactored lateral stress of 69 MPa (10 ksi) for all discretely braced girder flanges ( 14 ). AASHTO lowers this requirement to 14 MPa (2 ksi) for exterior girders where cross-frames are staggered perpendicular to girder lines throughout the entire bridge ( 1 ). Bottom flange lateral bending stress induced during truck testing for all instrumented girder cross-sections (Figure 11) was smaller than 2.5 MPa (0.4 ksi), which is within the suggested additional lateral bending stress considered for design using a simplified analysis.
Normal stresses induced by out-of-plane bending at girder webs and local bending at girder bottom flanges were evaluated for heavily instrumented girder cross-sections, and maximum magnitudes of these stresses at each cross section among all truck tests were recorded (Figure 12). Labels of the data indicate the test number when each corresponding maximum stress was observed. Cross section G4-N was observed with the largest stress caused by flange plate local bending of 0.9 MPa (0.1 ksi), and caused by web out-of-plane bending of 1.4 MPa (0.2 ksi), which are relatively small effects.
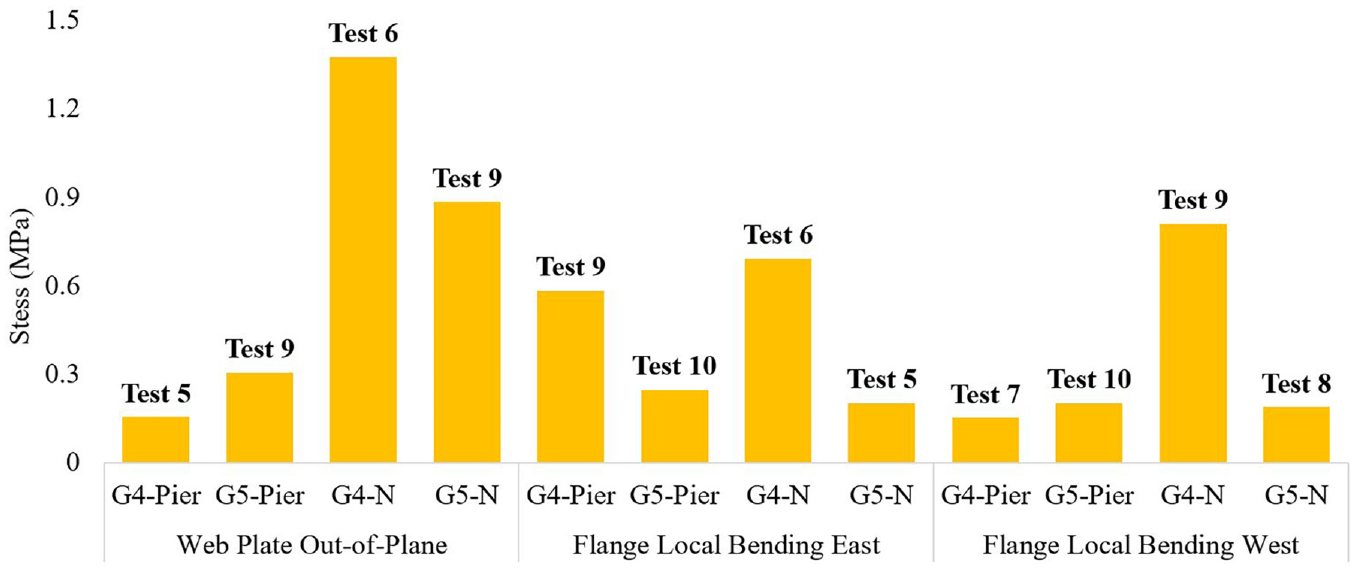
Maximum stress caused by girder bottom flange local plate bending and web out-of-plane bending during truck testing, from field measurement.
Cross-Frame Response Under Truck Test Loading
The maximum magnitudes of normal stress within each cross-frame member among all truck tests are presented in Figure 13; the truck test number when the maximum was recorded is labeled. Corresponding stresses extracted from numerical simulation are compared with those from field monitoring—it can be seen that modeling results reasonably follow the trends in field measurements in most cases. Maximum stresses observed in the field during truck tests at the bottom chord and in diagonal members of cross-frames were both around 8.5 MPa (1.2 ksi). However, diagonal members of cross-frame CF12-3&4 did not transfer significant stress, and the bottom chord gauge (CF12-3&4-B) location was also observed to have much smaller stress than predicted by numerical simulation.
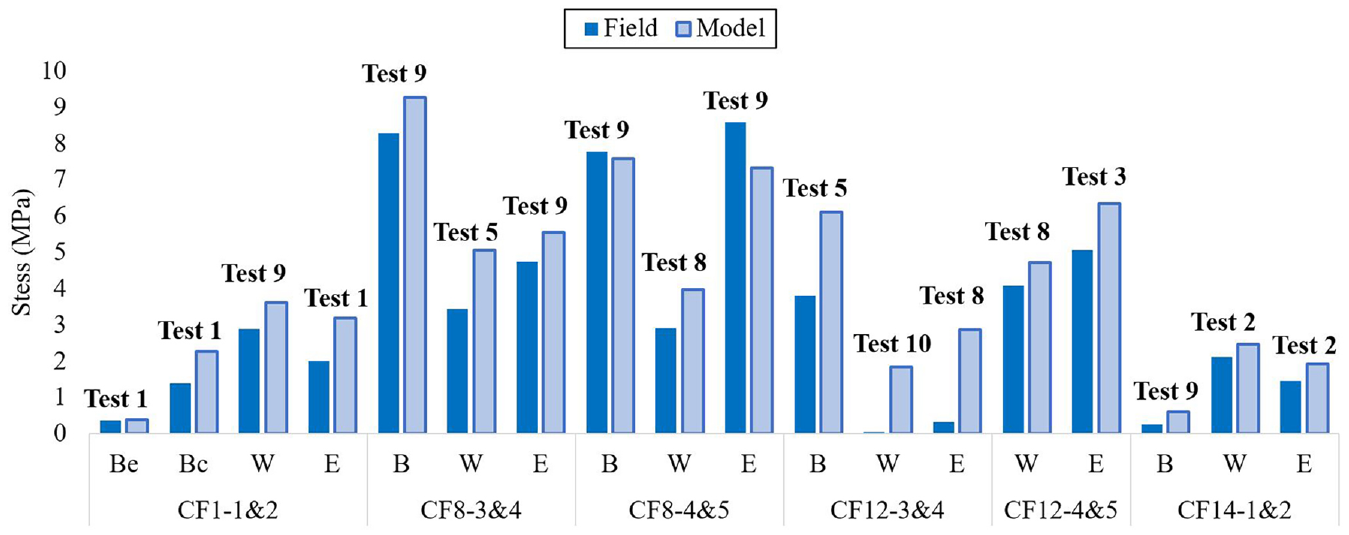
Maximum normal stress within cross-frame members during truck testing, from field measurement and numerical simulation.
CF12-3&4 is the cross-frame immediately adjacent to the G4-N girder cross section, so the unexpected responses motivated a targeted field inspection for further investigation. CF12-3&4 was observed with loose bolts (in oversized holes) between cross-frame angles and stiffener plates at several bolt locations (Figure 14); the “x” symbol at bolts represents locations that could easily be loosened by hand and were not in bearing. Thus, this partially unconnected cross-frame explains the unexpected behavior in the cross-frame and the adjacent girder. The field observations are further corroborated by a numerical model where CF12-3&4 is removed—the associated simulation results are then in much closer agreement with the field data.
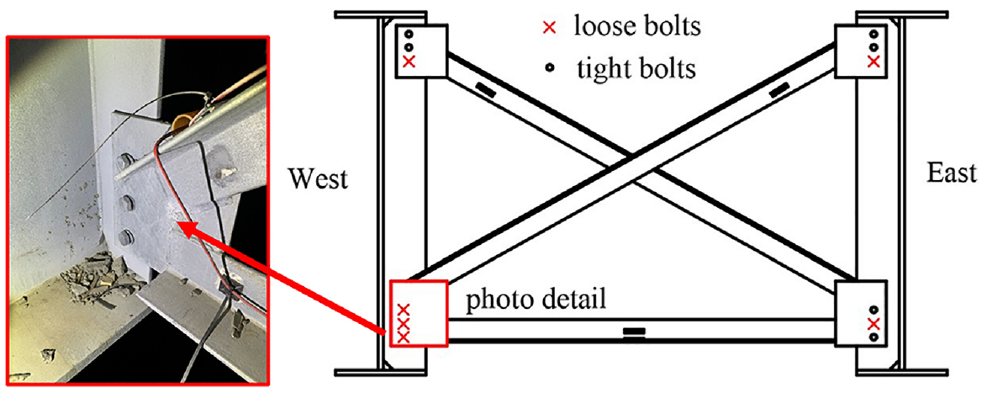
Condition at cross-frame location CF12-3&4.
Girder Response During Deck Placement
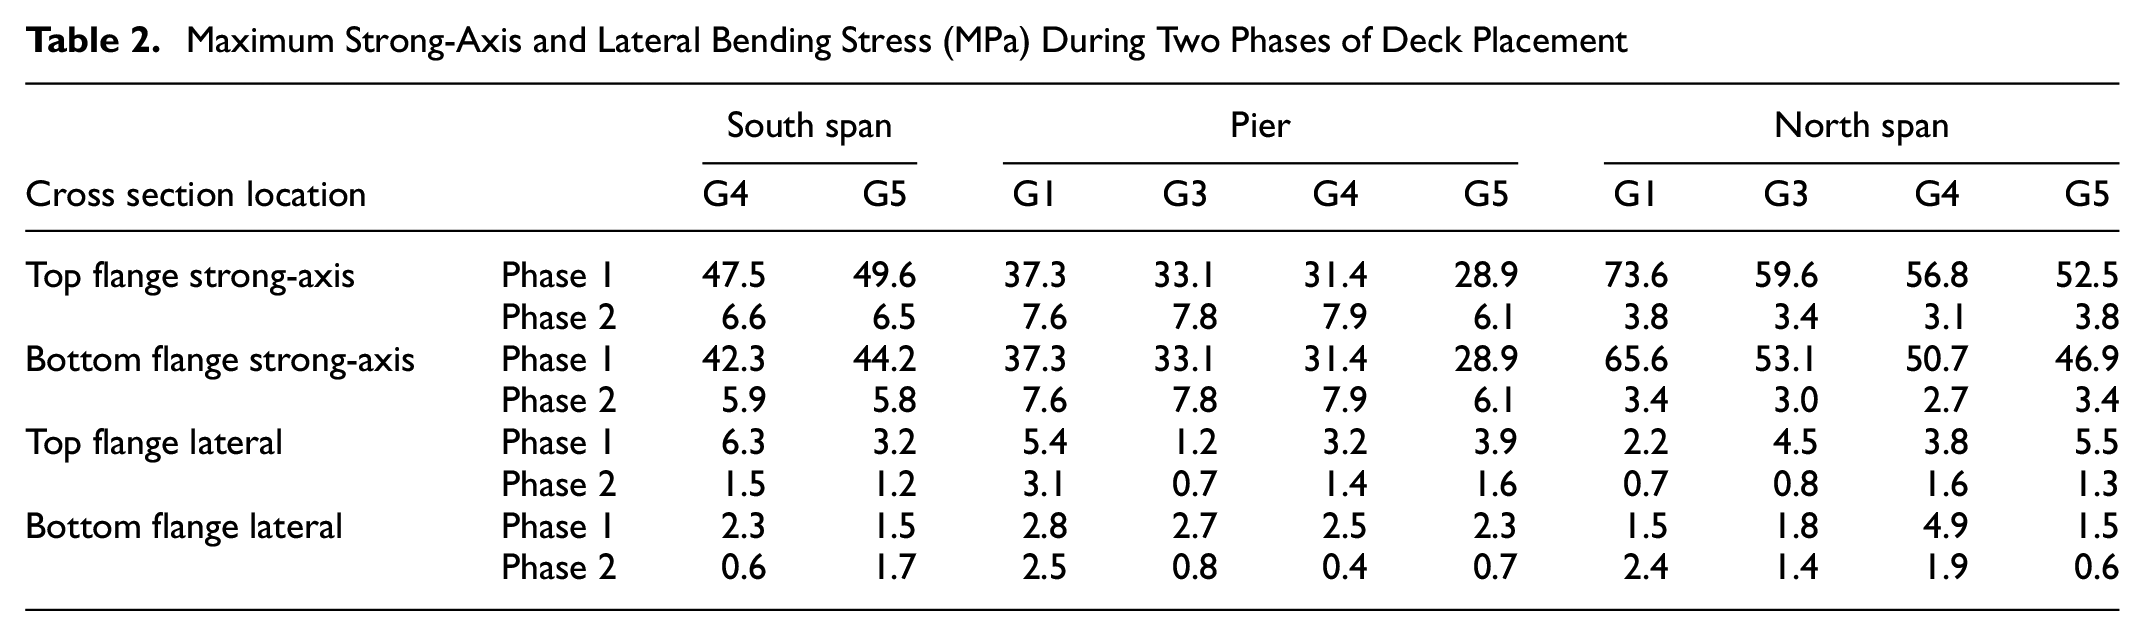
Deck slab placement for multi-span bridges of appreciable length is typically conducted in multiple phases—first the positive moment regions and then the negative moment region(s) after a few days of curing, as shown in Figure 1. Sequencing deck placement reduces the cost of construction by limiting the amount of concrete placement in any one day, and helps reduce concrete stress, early-age cracking, and uplift in the negative moment region during its subsequent deck placement (after a few days of concrete curing from the first phase) ( 18 , 19 ). Table 2 provides a comparison between stresses developed at instrumented girder cross-sections during the two phases of deck placement. The stresses presented in Table 2 were with respect to collected field measurements initialized at the beginning of each phase of concrete placement—that is, the initial state of Phases 1 and 2 are different, and any stress variation during the time between the two phases was not considered. Overall stresses developed during Phase 2 deck placement are only around 20% or less of those developed during Phase 1. Thus, bridge superstructure behavior under the Phase 1 concrete pour was considered representative for bridge behavior under deck placement, even though there were a few cross-sections where some lateral bending stress developed during Phase 2 deck placement.
Maximum Strong-Axis and Lateral Bending Stress (MPa) During Two Phases of Deck Placement
Numerical simulation was conducted for Phase 1 deck placement of Mattis-74 Stage I construction, with CF12-3&4 conservatively taken out of the model because of its loose connection. This represents the altered load path locally where a cross-frame is unable to sufficiently transfer lateral load, especially during the large demand of the concrete pour. Maximum stress components at the girder top flange and bottom flange during the concrete placement process are shown in Figures 15 and 16, respectively. It can be seen that the model (with the removed cross-frame to capture the effect of the loose bolts) reproduced bridge field response very well, including the lateral bending behavior at cross section G4-N. Flange strong-axis bending stresses from numerical simulation were generally slightly larger than data observed in the field, which could be a result of more lateral flexibility allowed at the expansion bearings in the field than was modeled. Some of the girder bottom flanges were not yet fully bolted to the elastomeric bearings in the field during deck placement, to allow for small extra girder movement during construction. End rotations of the girder then caused the bearings to lean on the retainers more than what is captured in the model. These decisions were largely based on contractor judgment at the site and were not incorporated in the numerical simulation.
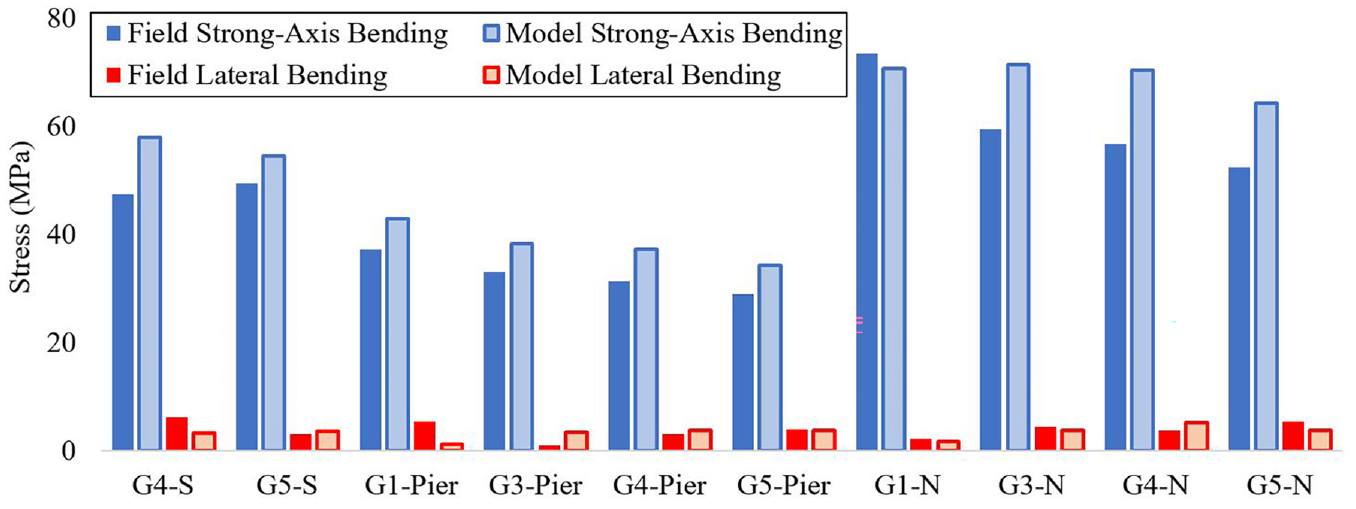
Stress developed during Phase 1 deck placement at girder top flange caused by strong-axis bending and lateral bending, from field measurement and numerical simulation.
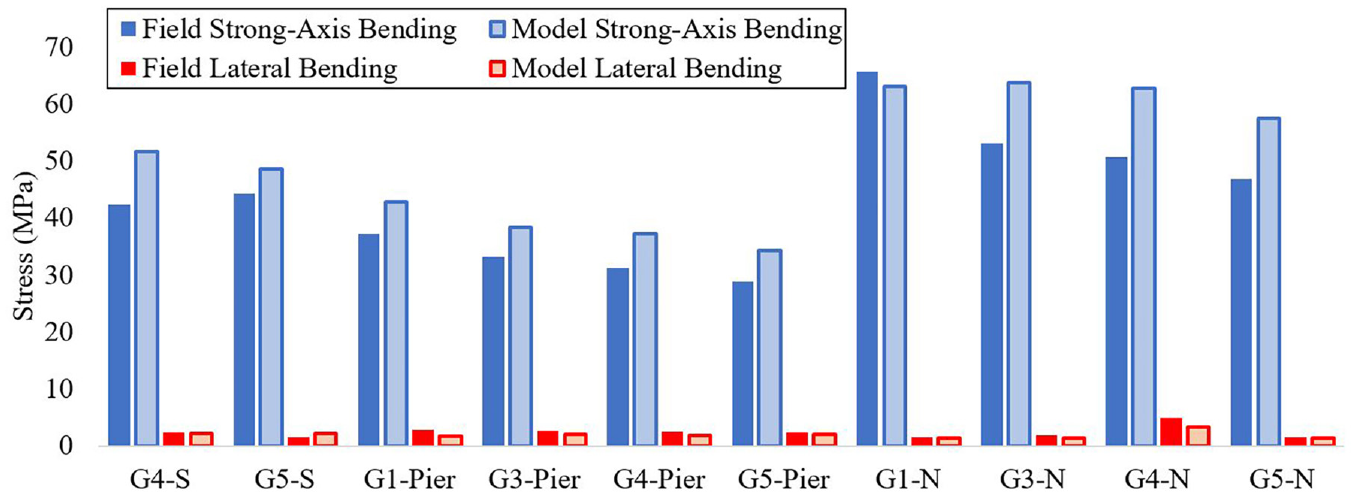
Stress developed during Phase 1 deck placement at girder bottom flange caused by strong-axis bending and lateral bending, from field measurement and numerical simulation.
Maximum field lateral bending stress for interior girders was 6.3 MPa (0.9 ksi) in the girder top flange and 4.9 MPa (0.7 ksi) in the girder bottom flange, which were both within the AASHTO suggestions for additional lateral bending stress. The maximum lateral bending stress at G1-Pier top flange was 5.4 MPa (0.8 ksi), which is also within the AASHTO suggestion of 14 MPa (2 ksi) for an exterior girder. However, it should be noted that the field stresses are measured between cross-frames, whereas the highest flange lateral bending stresses are expected to occur at the cross-frames.
Maximum stress caused by web plate out-of-plane bending behavior and flange plate local bending at heavily instrumented girder cross-sections during Phase 1 deck placement (from field measurement) is shown in Figure 17. Apart from cross section G4-N—where observed web out-of-plane bending stress was 10.6 MPa (1.5 ksi), mostly a result of effects from the loose cross-frame—the out-of-plane bending stress developed during deck placement was generally less than 5 MPa (0.7 ksi). Stresses caused by flange plate local bending were less than 2 MPa (0.3 ksi) for all cross-sections considered.
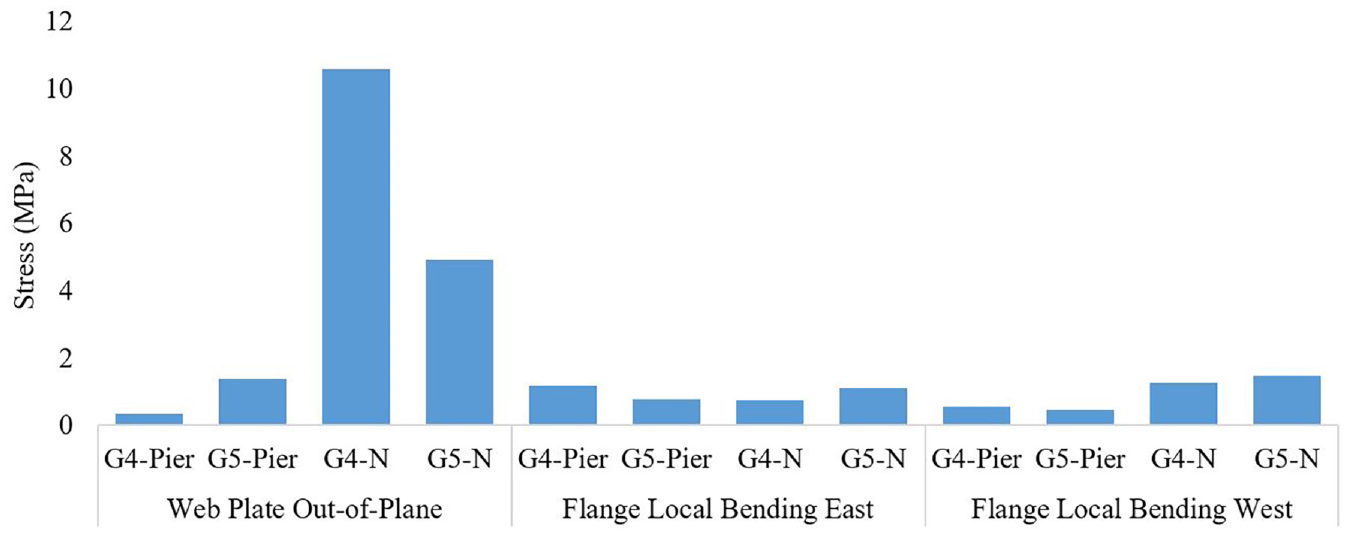
Field stress developed during Phase 1 deck placement at girder web caused by out-of-plane behavior and at girder bottom flange caused by plate local bending.
Bridge Superstructure Response—Comparison with Design
The design stress for girder strong-axis bending in the bottom flange considered two cases (self-weight from Phase 1 concrete dead load and live load of the test truck), which were calculated with line girder analysis (Table 3). Live load distribution factors were applied according to the design drawings—0.571 for the south span, 0.556 at the pier, and 0.543 for the north span. Maximum strong-axis bending stresses under Phase 1 concrete placement and truck tests, as recorded from field monitoring and extracted from 3-D finite element modeling, are also presented in the table. It can be seen that live load distribution factors used in design overestimate the stress from the test truck by around 50%. On the other hand, responses predicted by 3-D FEA were much closer to the field measurements. Concrete dead load effects measured in the field and predicted by 3-D FEA were both close to the design stresses for the Phase 1 concrete pour at bridge midspan locations; however, the design strong-axis bending stress near the pier more conservatively exceeded the maximum strong-axis bending stress from field measurements, by approximately 50%.
Comparison of Maximum Strong-Axis Bending Stress (MPa) from Field Measurement, Numerical Simulation (3-D FEA), and Line Girder Analysis (LGA) for Design
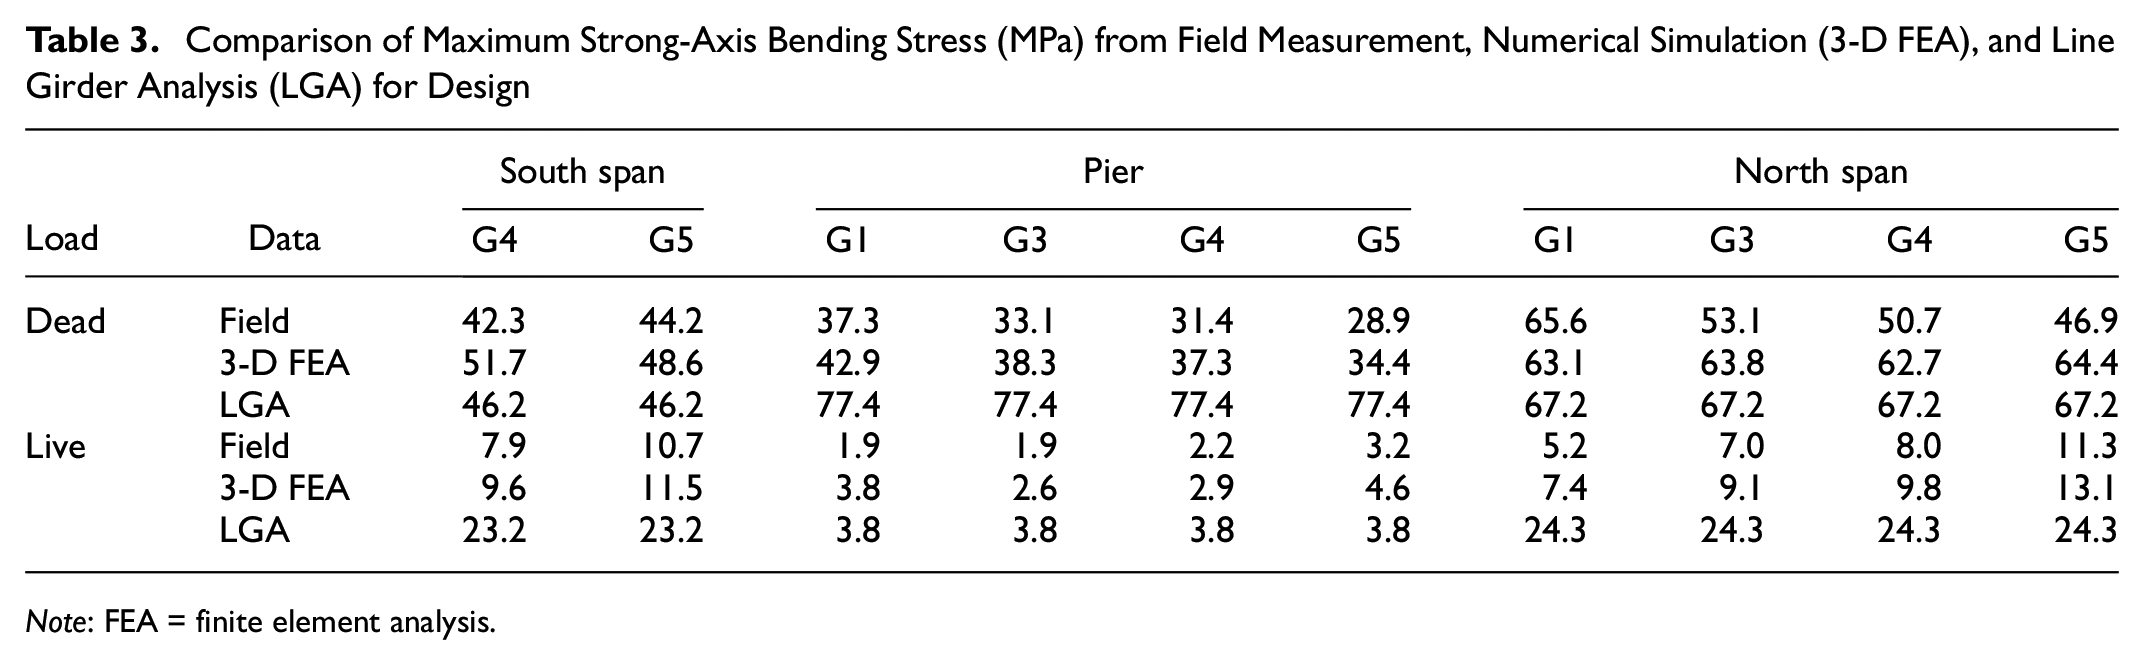
Note: FEA = finite element analysis.
Conclusions
As part of a long-term field monitoring campaign, a steel I-girder bridge with 41° skew was studied during the deck placement portion of Stage I construction (approximately half the bridge) and via a series of truck tests when construction of Stage I was complete. Numerical simulations were conducted using 3-D FEA (finite element analysis) for the cases studied in the field. For both deck placement and truck testing, good agreement between modeling results and field measurements were obtained for girder and cross-frame response.
Girder strain response was decomposed into components induced by strong-axis bending, lateral bending, and plate local bending—including out-of-plane behavior at the girder web and flanges. As expected, the behavior of the girders was related predominantly to strong-axis bending under both deck placement and truck testing. Strong-axis bending stresses at the girder bottom flange from field response and 3-D FEA results were compared with stresses calculated in the design process using LGA (line girder analysis). Live load distribution factors used in conjunction with LGA overestimated girder stress caused by the test truck by around 50%, while the response predicted by numerical simulations using 3-D FEA was closer to the field measurements. Peak strong-axis bending stresses (observed in positive moment regions) under concrete dead load as measured in the field and predicted by 3-D FEA are both close to stresses calculated in the design process using LGA. Peak strong-axis negative bending stress during deck placement calculated in the design process using LGA exceeded the maximum measured stress from the field by around 50%.
Maximum lateral bending stresses observed at interior girder cross-sections were 6.3 MPa (0.9 ksi) under concrete dead load and 2.4 MPa (0.3 ksi) during truck testing, which are smaller than the AASHTO suggestion for additional unfactored flange lateral bending stress—69 MPa (10 ksi)—used in girder design when a refined analysis is not employed ( 1 ). The maximum lateral bending stress at exterior girder cross-sections was 2 MPa (0.3 ksi) during truck testing and 5.4 MPa (0.8 ksi) during deck placement, which is also within the 14 MPa (2 ksi) suggested unfactored lateral bending stress from AASHTO for LGA. The lower requirement of lateral bending stress for exterior girders suggested by AASHTO has not been incorporated by some states (with the Illinois DOT as an example [14]), and its application requires further study.
Differences between field monitoring data and companion numerical simulations indicated a unique site condition, which was discovered through field investigation to be an untightened cross-frame. Larger than anticipated local response at an adjacent girder cross section (G4-N) was observed as a result of the cross-frame not functioning properly. Stress caused by web out-of-plane bending at cross section G4-N was as large as 10.6 MPa (1.5 ksi) during deck placement and 1.3 MPa (0.2 ksi) during truck testing.
Bridge superstructure response of a Stage I stub abutment bridge during deck placement and under live load was presented in this paper. Ongoing field monitoring is continuously capturing behavior of the same bridge under live load and thermal effects, including after the full bridge was constructed and placed into service. Future comparison of Stage I and full bridge live load response, further study of cross-frame effects on the bridge load path, and systematic analysis of bridge thermal behavior through long-term field monitoring are expected to result in better understanding of the behavior over time for skewed steel I-girder bridge superstructures.
Footnotes
Acknowledgements
The authors would like to thank the members of the project Technical Review Panel, chaired by Mark D. Shaffer of the Illinois Department of Transportation, for their valuable assistance with this research.
Author Contributions
The authors confirm contribution to the paper as follows: study conception and design: L. Fahnestock, J. LaFave, S. Zhou; data collection: S. Zhou, R. Dorado; numerical simulations: S. Zhou; analysis and interpretation of results: S. Zhou, L. Fahnestock, J. LaFave; draft manuscript preparation: S. Zhou, L. Fahnestock, J. LaFave. All authors reviewed the results and approved the final version of the manuscript.
Declaration of Conflicting Interests
The author(s) declared no potential conflicts of interest with respect to the research, authorship, and/or publication of this article.
Funding
The author(s) disclosed receipt of the following financial support for the research, authorship, and/or publication of this article: This paper documents a portion of the work done for project ICT R27-194 (“Evaluation of Spatial and Temporal Load Distribution in Steel Bridge Superstructures”). ICT R27-194 is being conducted in cooperation with the Illinois Center for Transportation (ICT); Illinois Department of Transportation (DOT), Division of Highways; and the U.S. Department of Transportation, Federal Highway Administration (FHWA).
Data Accessibility Statement
Some or all data, models, or code that support the findings of this study are available from the corresponding author on reasonable request. (This includes the numerical model and data processing files.)
The contents of this paper reflect the view of the authors, who are responsible for the facts and the accuracy of the data presented here. The contents do not necessarily reflect the official views of policies of the ICT, Illinois DOT, or FHWA.