
Abstract
Social distancing strategies and strict hygiene adherence during the pandemic have added an extra dimension to the safety requirements of transit usage. Thus, travelers’ altered safety perceptions, which can affect transit usage, need to be assessed for effective policy decisions for the post-pandemic period. This study examined the interaction between in-vehicle safety perception and transit usage using an integrated approach by jointly modeling them, considering the fear of virus infection. A multivariate ordered probit model was developed for the investigation using a dataset collected through a web-based travel survey conducted in the Greater Toronto Area, Canada. The results reveal that, along with socioeconomic attributes, many pandemic-related variables and latent attitudinal factors affect the propensity to use transit. It is observed that those having a better safety perception of the bus are more inclined to use transit more frequently than others. Apart from safety perception, those who were more cautious, over the age of 34, and shifted to working from home during the pandemic had an adverse propensity to use transit. However, a higher propensity toward transit usage was observed for pre-pandemic transit users and for those who had a higher level of satisfaction with transit attributes during the pandemic. A similar tendency was also observed for fully vaccinated residents.
Keywords
The arrival of the COVID-19 virus caused an abrupt and fundamental change to people’s everyday lives worldwide. From its declaration as a global pandemic on March 11, 2020 ( 1 ), governments implemented various social distancing measures to reduce person-to-person contact through lockdowns, travel restrictions, social distancing, and quarantines ( 2 ). As a result, people had to make significant changes to their daily lives. These alterations led them to rethink how they worked, traveled, shopped, interacted, and relaxed. In addition, telecommunication platforms (e.g., Microsoft Teams, Zoom) allowed people to work, study, and socialize from the safety of their homes without having to commute to work or school. Combined with peoples’ overall vigilance on hygiene, these factors have caused drastic changes to their travel patterns. However, it remains unclear how or if these factors will affect people’s travel decisions as the vaccine rollout continues and people become more accustomed to the virus. Therefore, an investigation into the pandemic-related variables that influence individuals’ travel decisions will help to form public policy and transport operations for the future.
Besides reducing overall travel demand, COVID-19 also influenced people’s modal preferences. Recent studies found significant ridership losses for shared transportation modes and suggest that these may result from the negative public perception of transit during the pandemic (3–7). As a result, many travelers turned to alternative modes of transportation that are perceived as less risky. This is illustrated by the significant increase in the modal share of private vehicles and active transportation (e.g., walking and biking) since the beginning of the pandemic (8–10).
The newfound negative perception of public transport is primarily rooted in it requiring people to share a space with other strangers, who are seen as a potential source of exposure ( 4 ). In addition, reminders from the media of the number of confirmed cases, hospitalizations, and deaths can cause feelings of fear, vulnerability, and uncertainty in people. Constant reminders to wash hands, maintain social distance, and other public health campaigns have led many to think about death much more than before the pandemic ( 3 ). In addition, it has been found that the virus can be transmitted asymptomatically, making people more wary of sharing a space with others, even if they do not exhibit symptoms ( 11 ). A natural response to these feelings is to avoid fear-inducing stimuli or situations ( 3 ). For example, instead of riding the subway, where riders are often tightly packed together and touch many of the same surfaces, one might instead walk or drive to minimize person-to-person contact.
This paper examines the factors that influence an individual’s safety perception of different transportation modes, especially public transportation, during the COVID-19 pandemic in the Greater Toronto Area (GTA), Canada. The study also investigates how such perceptions and other attributes affect their transit usage behavior during the pandemic. Several latent variables are investigated. These include satisfaction with transit services, characteristics of the pandemic (such as the rate of vaccine rollout), an individual’s behavior during the pandemic (e.g., willingness to wear a mask), and the potential effects of future pandemic policies (e.g., mandatory face coverings).
The remainder of this paper is organized into six sections. The following section reviews relevant prior studies. The data used for the investigation and its descriptive statistics are then outlined. Later, the econometric modeling framework utilized for the investigation is briefly stated, followed by a discussion on the model results and critical findings. Finally, the concluding remarks, along with the future scope of the study, are summarized.
Literature Review
To combat the spread of COVID-19 and “flatten the curve,” governments across the world implemented various forms of lockdowns, reducing people’s exposure to the virus by limiting person-to-person contact. By the end of April 2020, one-third of the world’s movement was restricted by governments through some sort of lockdown ( 12 ). In addition, other governments elected to undertake some form of a stay-at-home campaign encouraging residents to limit their travel to only essential trips. This has coincided with experts’ recommendations to work from home, physical distance, shop online, and avoid large gatherings to reduce the number of people infected ( 13 ).
As a result, the world’s transportation systems have seen a drastic reduction in demand. For example, Molloy et al. ( 9 ) reported a 60% drop in vehicle kilometers traveled by Swiss residents in the summer of 2020, while INRIX also found significant decreases in vehicle usage in megacities like New York, London, Madrid ( 14 ). A survey on Australian residents’ travel activity revealed that 78% of respondents had adjusted their travel activity, significantly decreasing the number of commuting trips and increasing the time spent at home ( 15 ). Additionally, it was found that shopping became the primary purpose of travel and that trips were becoming shorter and less frequent, a conclusion reinforced by INRIX’s recent data ( 16 , 17 ). Another study in Chicago, U.S.A., concluded that work from home practices bring notable benefits and can continue well beyond the pandemic’s end, making the future of travel demand unclear ( 4 ). More recently, there is evidence that car traffic has started to return. However, several studies have found that travel demand has still not fully recovered to what it was before the pandemic ( 9 , 15 , 18 , 19 ), and it is unclear if it ever will.
The most drastic decrease in demand can be seen in shared transportation modes, especially public transit. Moreover, the public perception of transit has become increasingly negative as concerns over hygiene and other pandemic-related factors grow, resulting in enormous ridership losses. For the year 2020, the American Public Transportation Association reported a 79% drop in ridership nationwide compared with 2019 levels ( 20 ). In addition, Italy, France, Germany, Spain, and the UK have reported declines in transit ridership ranging from 70% to 90% ( 21 ). Other studies in Budapest ( 22 ), Sweden ( 23 ), the Netherlands ( 24 ), India ( 25 ), Australia ( 15 ), and several international studies ( 16 , 26 ) have also reported significant travel behavior changes arising from the pandemic.
Given peoples’ new concerns with shared transportation modes, many transportation agencies are worried that many of the riders who shifted to alternative travel modes during the pandemic may never return. In a survey conducted in the summer of 2020, it was found that 90% of respondents had reduced their ridership or stopped riding altogether. Additionally, only three-quarters of those who limited their transit usage during the pandemic planned to return after the situation stabilized ( 6 ). Another study examined New York residents’ travel behavior under different reopening strategies, which showed that a full reopening with 100% transit capacity would only attract 73% of the ridership that it did before the pandemic. It also noted that the negative perception of transit and the increased popularity of work from home practices led many to switch to private vehicles, causing the number of car trips to increase to as much as 143% of pre-pandemic levels ( 27 ).
Similarly, Elias and Zatmeh-Kanj ( 28 ) found that more than half of their survey respondents viewed the train as a potential transmission source. Chicago residents also viewed shared modes, including transit, taxi, and ride-hailing, as high risk ( 4 ). Analogous concerns about travel modes were observed among Australian residents in 2020. Before the pandemic, only 5% of their respondents had concerns about hygiene on public transport, but this value skyrocketed to 58% after the pandemic ( 15 ). While a follow-up study did show an improvement in the public’s concern with transit, it had not recovered to anywhere near the level it was before the pandemic ( 18 ).
Within the literature, several studies investigate various factors that influence peoples’ decision to use public transport during the pandemic. Pandemic-related measures, such as crowd management, social distancing, cleanliness, and mask mandates, were all found to be important in improving peoples’ willingness to use transit, even more than comfort and security ( 5 , 8 , 28 ). Other notable pandemic-related factors include, but are not limited to, awareness of the disease, recent exposure to the virus, and an individual’s understanding of the current restrictions ( 29 , 30 ).
However, to the authors’ knowledge, only a few papers have examined people’s safety perceptions of available transportation modes during the pandemic and their potential to influence their decision to use transit. Loa et al. ( 31 ) used a latent class cluster analysis to compare people’s travel behavior for non-mandatory trips before and after the pandemic. The model classified survey respondents into different groups, or “modality profiles,” ranging from strict drivers to multimodal users, based on their typical travel behavior. It found that the share of people using private vehicles increased from 63.8% to 83.1%, while transit saw a decrease from 30.7% to 14.2% ( 31 ). Shelat et al. ( 32 ) used a latent class choice model in tandem with variations of a multinomial logit model to predict travel behavior and a respondent’s preferred ranking of different transport modes. The study found two subsets of the population: those that are “COVID conscious” and are willing to make significant changes to their travel to avoid exposure and those that are “infection indifferent” and are not as concerned about their exposure ( 32 ). Interestingly, two-thirds of people who fall into the “COVID conscious” group were unwilling to travel if they could not find an empty row to sit in. They were also willing to wait an additional 8.75 min to reduce the number of people in their vehicle by one ( 32 ). Hotle et al. ( 29 ) used a generalized ordered logit model to understand how people changed their travel behavior to mitigate risk and identify the factors that might affect this decision. The study concluded that people generally avoided areas seen as medium and high risk; however, wealthier and more educated people were less likely to reduce their travel and follow social distancing protocols. Abdullah et al. ( 16 ) meanwhile, used multinomial logistic regression to analyze data collected from an international survey and identified significant changes in peoples’ travel behavior during the pandemic. It also found that general travel concerns were perceived as less critical than other pandemic-related concerns when choosing a transportation mode. Pawar et al. ( 25 ) reported similar disruptions, with 41% of respondents avoiding travel altogether. However, somewhat counterintuitively, their decision tree model found that safety perception was not a significant factor in peoples’ mode choice, despite public transport being viewed as less safe than personal vehicles.
This paper intends to contribute to the literature by presenting the interplay between vehicle safety perception and transit usage during the pandemic considering the fear of virus infection. An integrated approach was applied by jointly modeling each travel mode using a multivariate ordered probit model. Thus, the interdependencies of each of the different transportation modes’ safety perceptions and how their perceptions might influence one’s transit-choice decision were explored. This will assist decision makers in better understanding the influence of factors, including vaccination status and attitudes toward several pandemic-related factors. To the best of the authors’ knowledge, this is the first study of this nature looking into the interrelation of safety perception and transit usage.
The Survey and Descriptive Statistics
The study used data collected through a project named “Stated Preference Experiment on Travel mode and especially Transit choice behavior” (SPETT) which investigates the impacts of COVID on the transit usage behavior of residents of the GTA. The project administered its first cycle of the survey (SPETT’20) in the summer of 2020, and a follow-up survey (SPETT’21) was conducted after one year of the pandemic in the following summer. The design and results of the first cycle of the survey can be found in the literature ( 33 ). At the time of SPETT’21 data collection, the Ontario region stepped into stage 3 of reopening which allowed indoor and outdoor gathering with no mask required for fully vaccinated people. At that time, almost 70% of the GTA residents above age 12 were fully vaccinated, with more than 80% being partially vaccinated ( 34 ). Nevertheless, for this study, only the data obtained from the second cycle were used to observe the effect of vaccination and other attributes. Henceforth, the term “survey” will refer to the second cycle of the survey in this paper. The additional terms “before,”“during,” and “post” the pandemic will refer to the respective periods, before the declaration of the state of emergency, at the time of data collection, and when COVID is not considered a threat.
The survey questionnaire was coded into a web-based survey tool. Before its administration, a pilot survey was conducted among the research groups and professionals from universities and transit agencies to ensure insightful results. A market research company which maintains a consumer panel of GTA residents was hired to collect the data. The market research company invited a random sample of members from the panel to complete the survey. The respondents were compensated with non-monetary incentives based on the time required to complete the survey. A residential location quota was imposed on the sample so that the sample distribution was consistent with the GTA population. The steps of the survey design are illustrated in Figure 1. The data were collected for two weeks, starting from 10 July 2021. The survey received 978 responses, of which 802 were complete. However, data from just 721 surveys were used for analysis after data cleaning based on inconsistent responses.
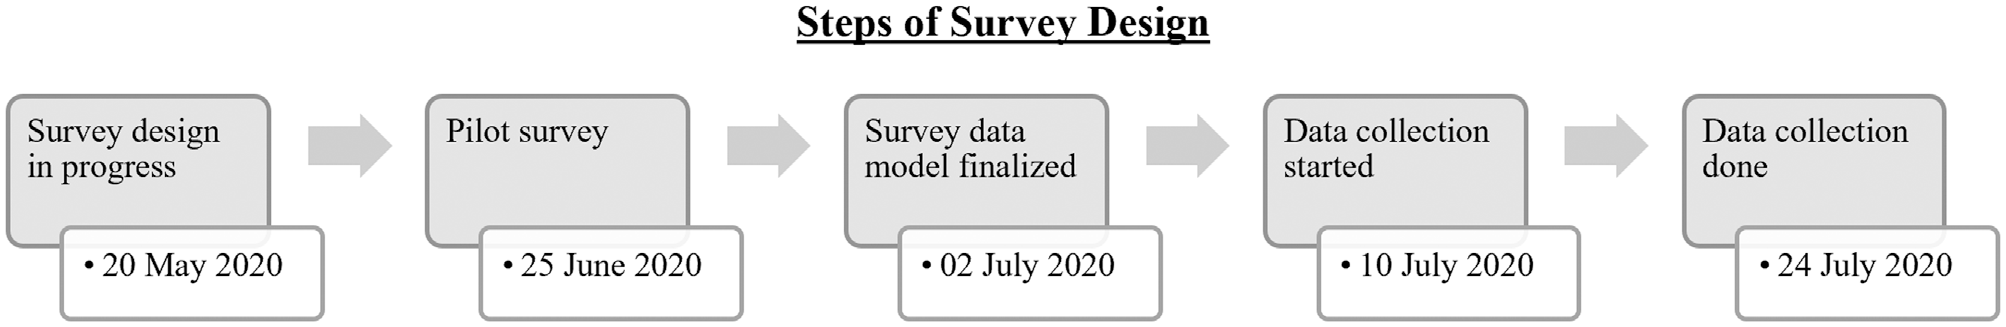
Schematic diagram of the survey design steps.
As the overall purpose of the survey was to investigate how the respondents’ current traveling pattern altered from the pre-COVID situation and from the previous stage of the pandemic (March 2020–June 2021), the survey questions elicited the following information:
Demographic information: for example age, gender, current employment status, access to private vehicles.
General pandemic behavior: frequency and time spent on daily activities, level of concern about pandemic, the extent of following preventive health and safety measures (i.e., wearing a mask, maintaining social distance, staying at home, etc.).
Travel behavior before and during a pandemic: primary modes for commuting and non-commuting trips, frequency of transit usage, telecommuting, online groceries, reasons for reducing transit usage.
Attitudinal questions: level of satisfaction with the public transit system during the pandemic, time of returning to transit considering vaccination status, potential concerns, subsequent travel behavior during the pandemic, and post the pandemic when COVID-19 is no longer considered a public health threat. Finally, the participants were asked to express their interest in using public transit in the post-pandemic period.
Summary statistics of the data are shown in Table 1. Overall, the distribution is consistent with the 2016 Canadian Census ( 35 ), with some over-representation of females residing in Toronto and having an income of $50,000 to $100,000, similar to SPETT’20. However, the survey data were further weight-adjusted to match distributions of age and household size attributes in the study area by adopting a bi-proportional iterative proportional fitting approach ( 36 ). Therefore, the descriptive statistics presented in the following sections are based on weighted data.
Summary Statistics of the Collected Data
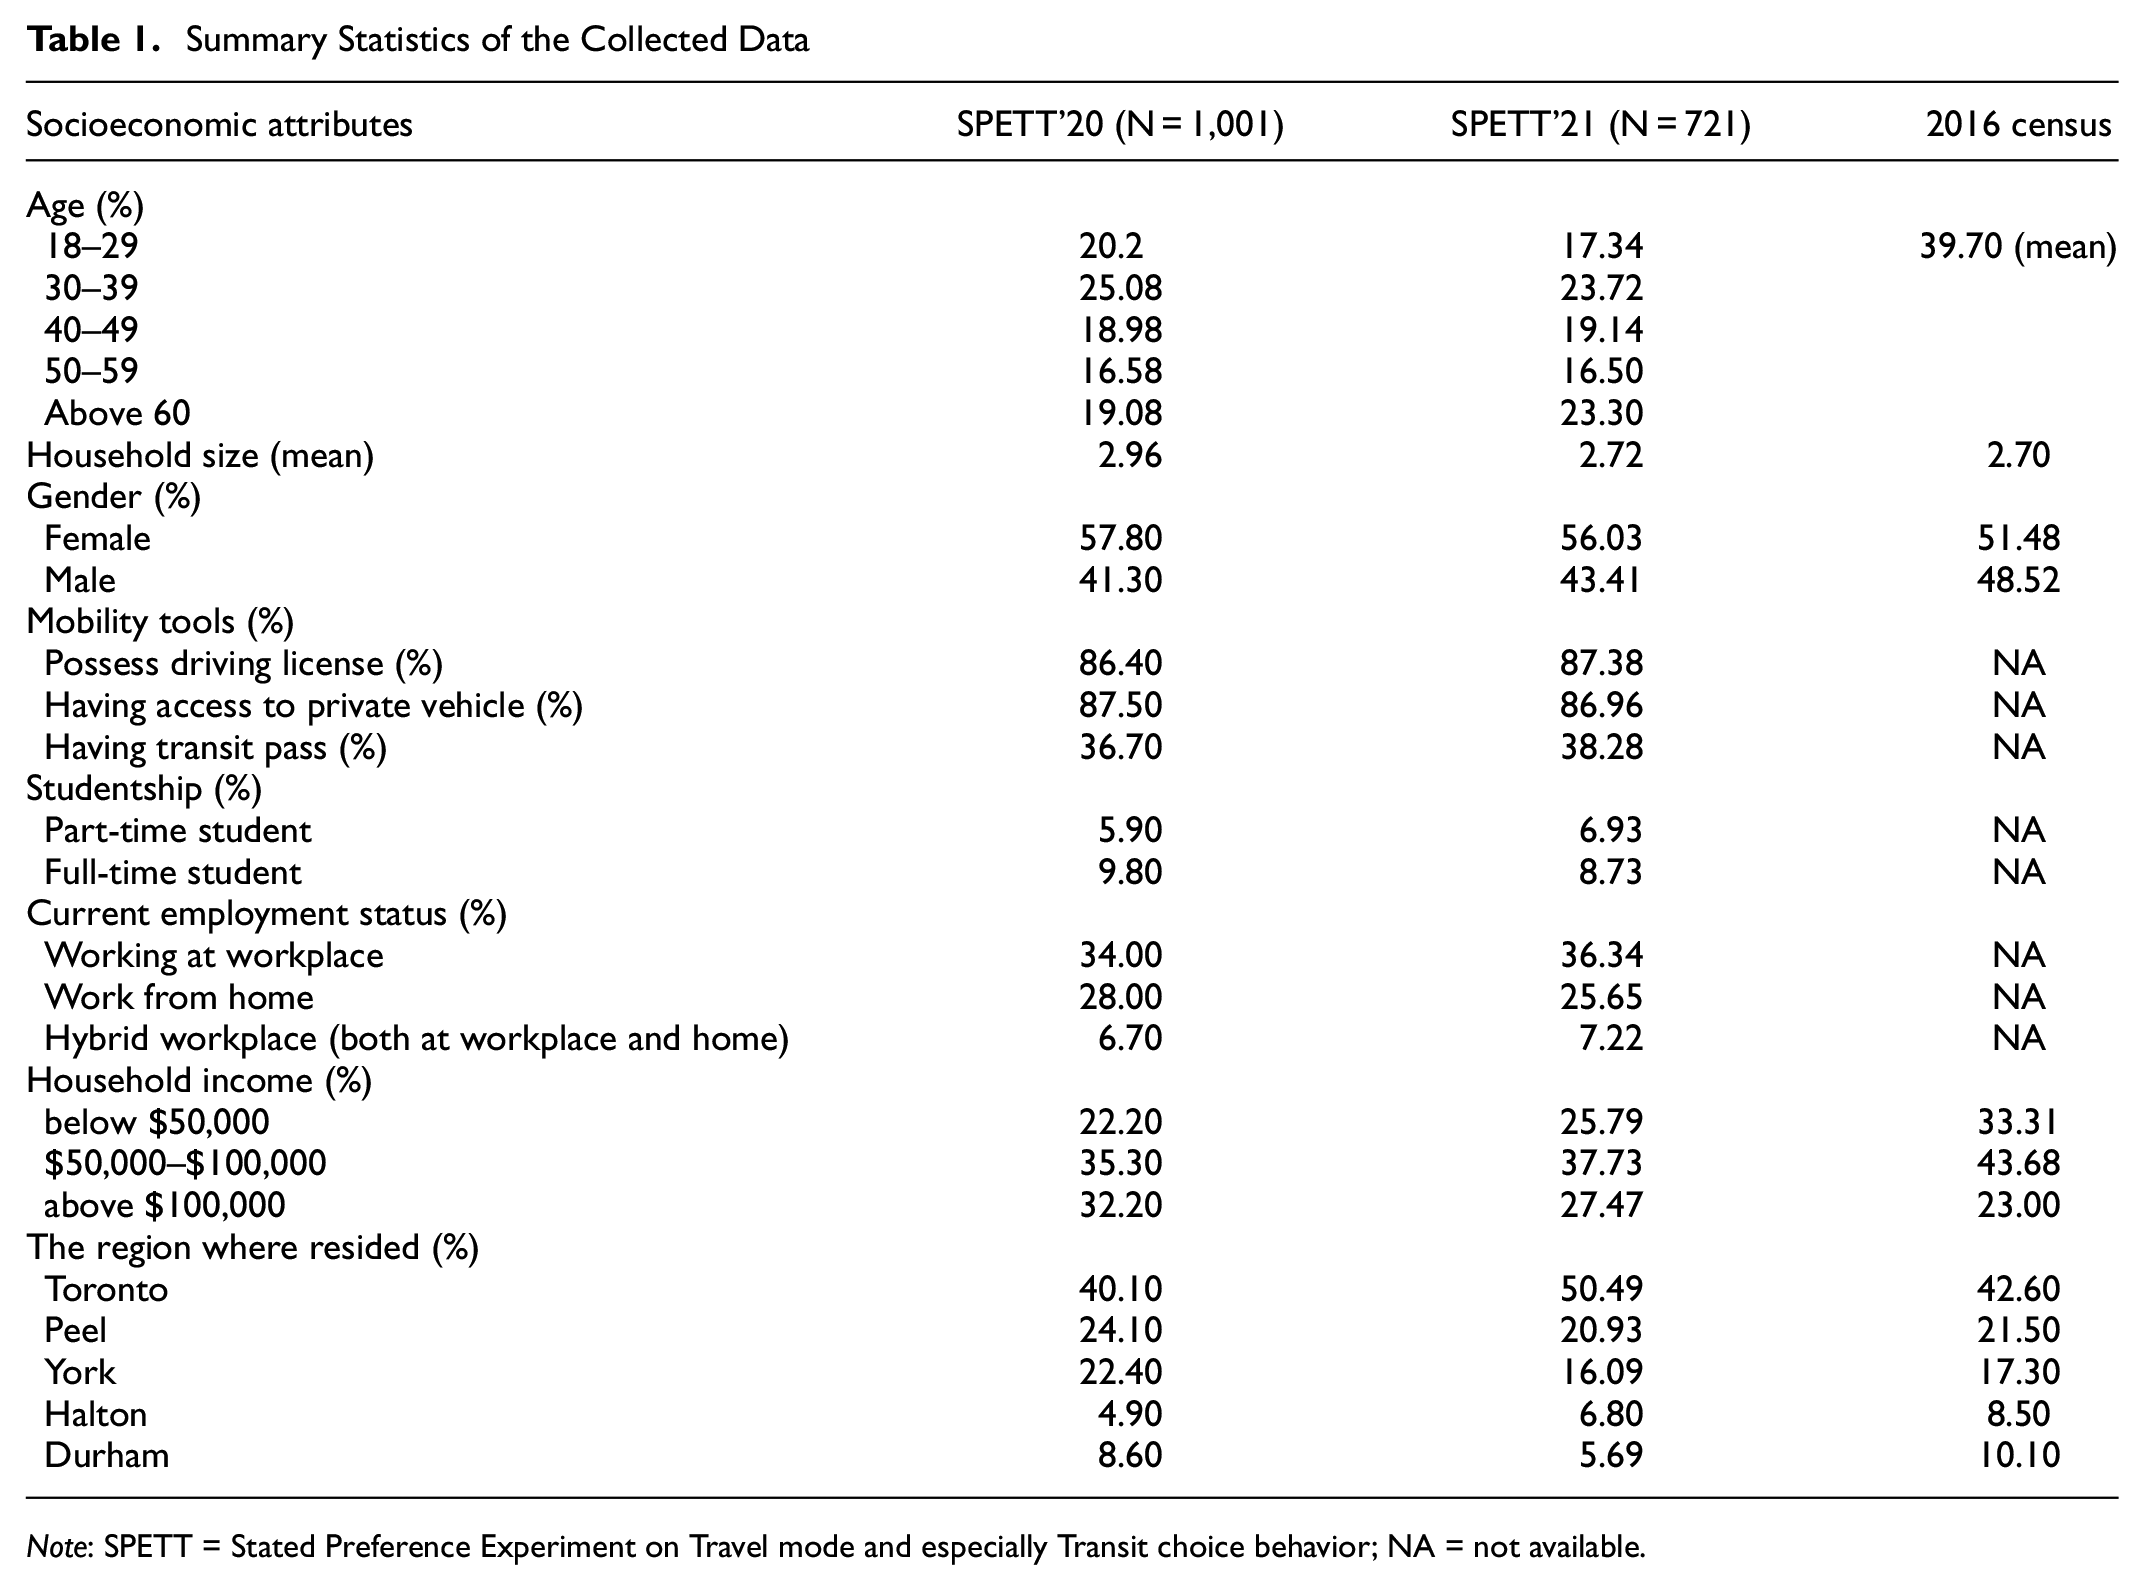
Note: SPETT = Stated Preference Experiment on Travel mode and especially Transit choice behavior; NA = not available.
Change in Transit Usage
Figure 2 shows respondents’ transit usage frequency before and during the pandemic. The response was recorded on a seven-level ordinal scale, ranging from “Never/did not take any trip during the pandemic” to “Multiple times a day.” Travelers have continued to avoid transit during the pandemic. During the pandemic, 54.8% of respondents did not take any trips by transit, half of whom used to take transit trips at varying frequencies before the pandemic. Also, frequent transit users (i.e., those who took transit daily) comprised 9.8% of all travelers. This value was 22.9% before the pandemic.
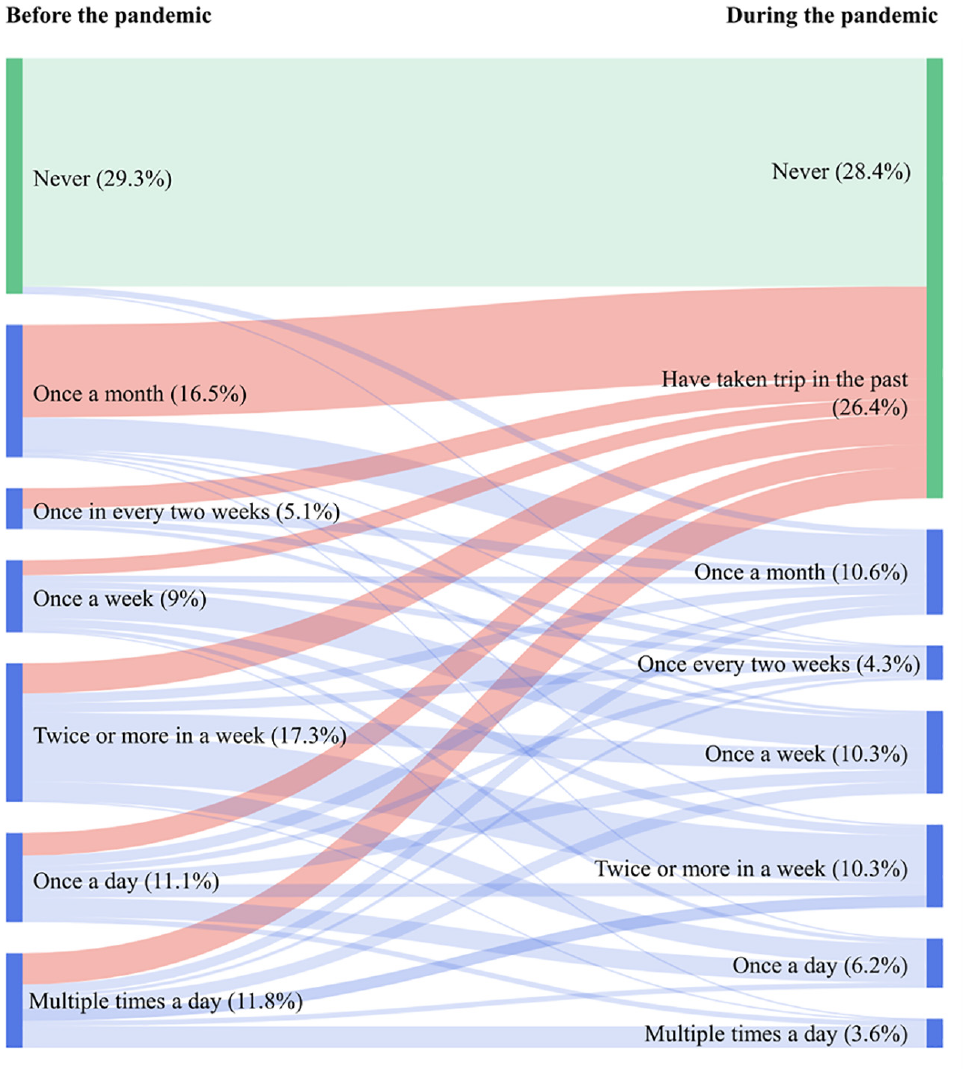
Transit usage frequency before and during the pandemic.
Transit usage frequency differences before and during the pandemic were also compared based on socioeconomic variables. Figure 3 presents the comparison in SPETT’20 and SPETT’21 cycles by age, gender, household income, mobility tools, and employment status. Overall, transit usage frequency decreased universally across all socioeconomic variables of interest. However, the 2021 cycle revealed a recovery of transit demand, which was indicated by a smaller transit frequency drop across all variables. The most significant declines in transit demand were observed among those over the age of 54, wealthy families, females, people with access to private vehicles, and workers who can work from home. Conversely, those who are younger than 34 and have income below $50,000 were seen to return to their prior transit usage frequency.
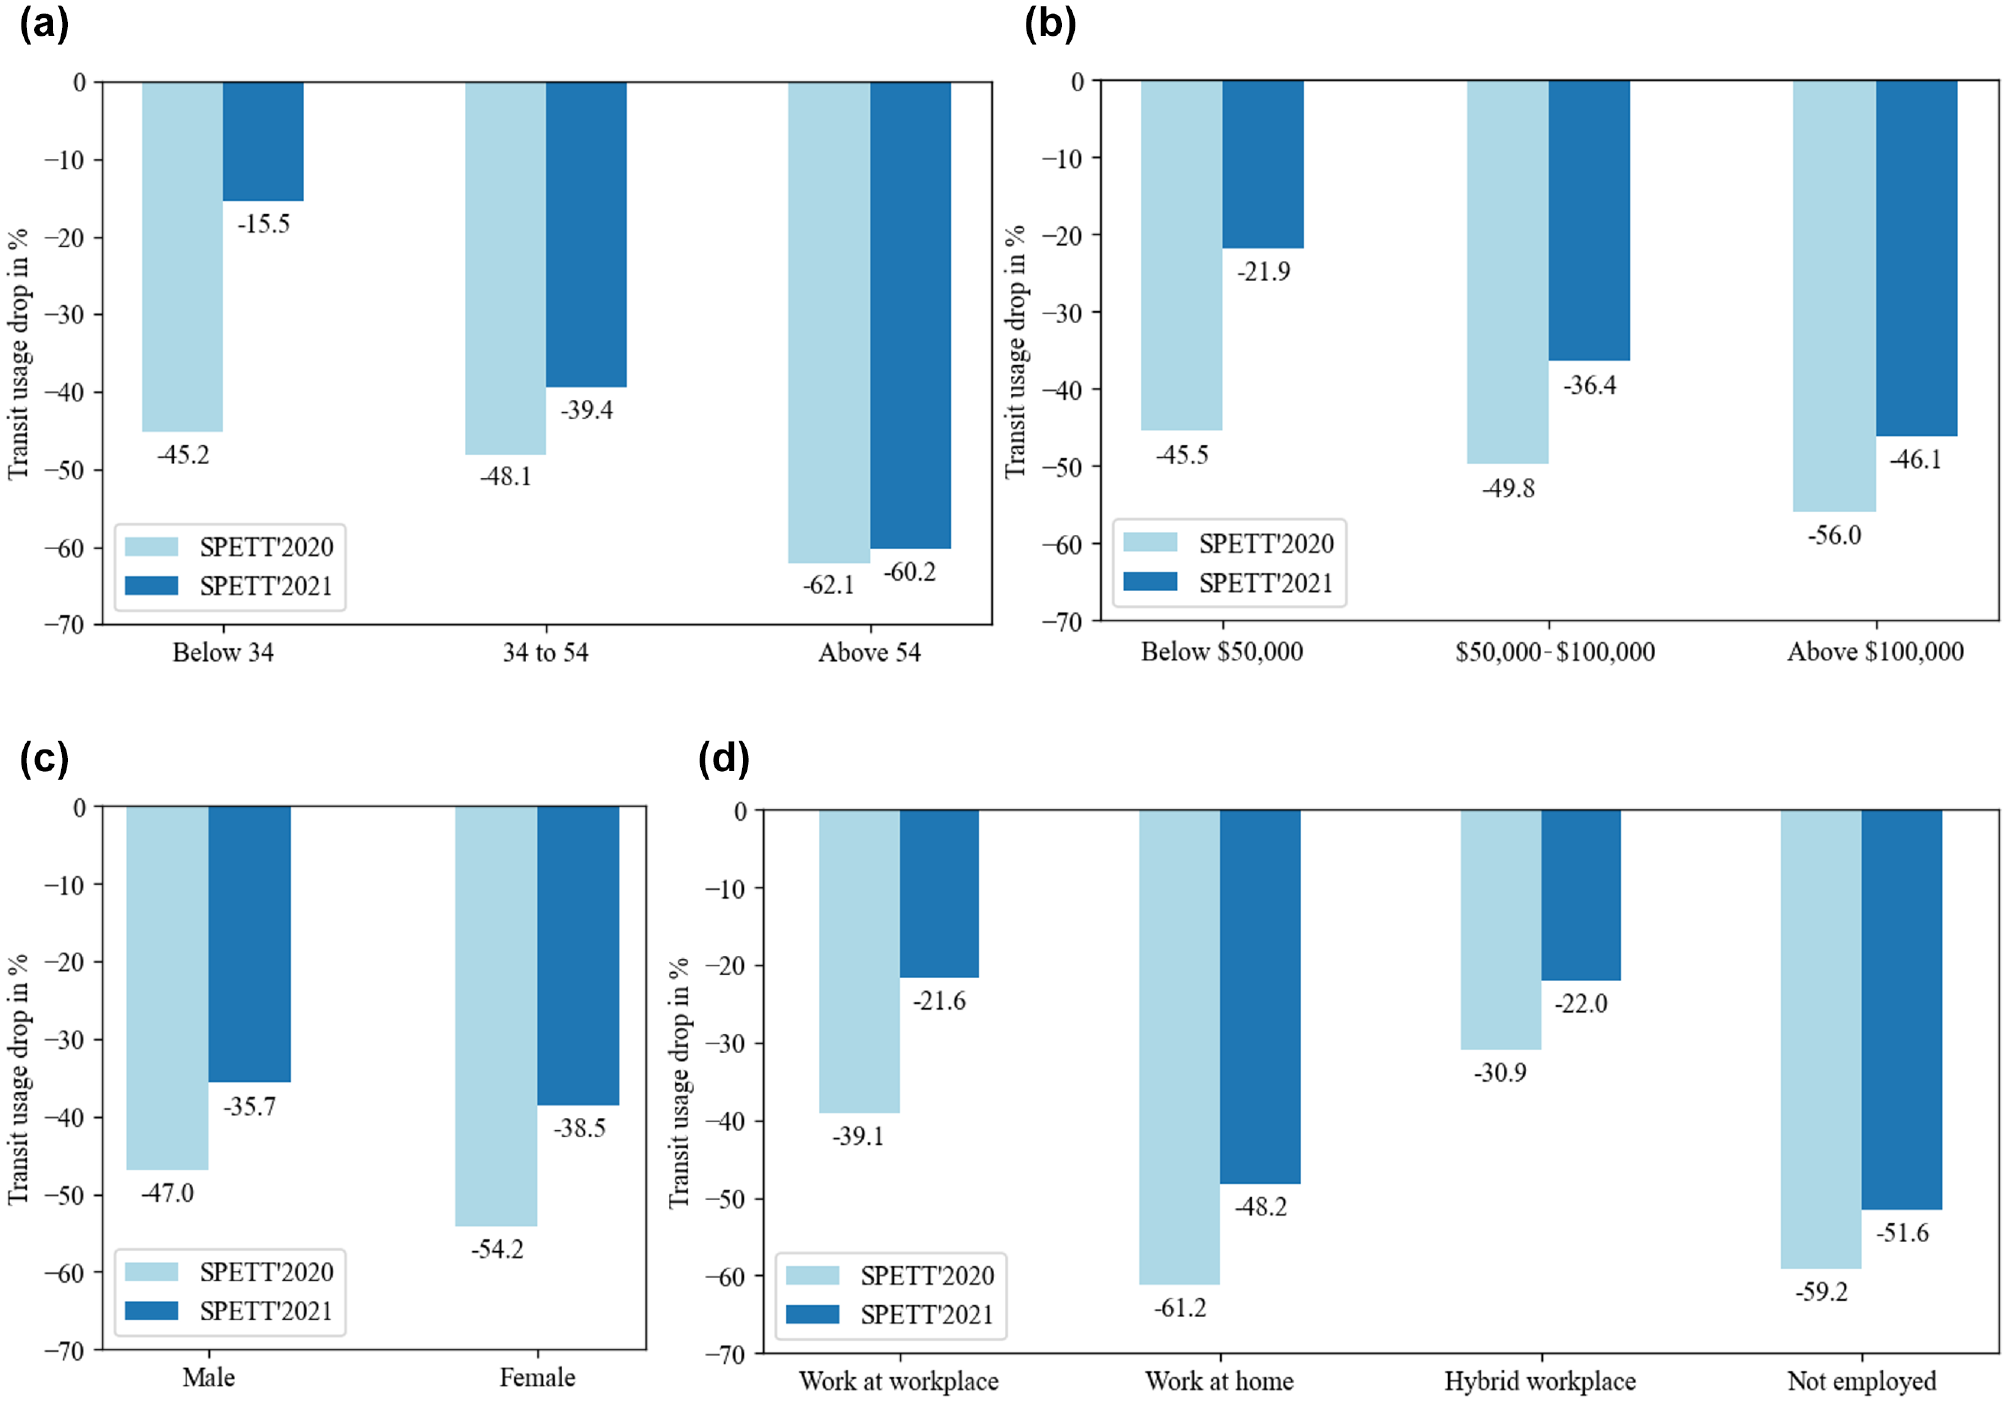
Transit usage frequency changes by socioeconomic status: (a) age, (b) household income, (c) gender, (d) current employment status.
Safety Perception by Travel Modes
The respondents were asked to rate their safety perception on a six-point scale ranging from 1 “least safe” to 6 “most safe” on six distinct modes: private vehicle, exclusive ride-hailing, shared ride-hailing (SRH), bus/streetcar, subway, regional transit. An even-point scale was used to omit the middle option of “neutral” in the odd-point scale (i.e., five- or seven-point scale). The approach encourages respondents to think actively during the survey ( 37 ). A mid-point could be selected when the respondent is undecided instead of neutral ( 38 ). However, this might introduce bias into the estimates. Therefore, the six-point scale was chosen to avoid the issue. All respondents were asked the same questions regardless of their private vehicle ownership. The consideration was that those who did not have access to automobiles could still have their own perceptions of traveling in private cars. The results are presented in Figure 4. Most of the respondents rated private cars as the safest travel mode, which is intuitive. Interestingly, exclusive ride-hailing is viewed as the safest among the shared modes, with almost 40% of respondents. Very few respondents perceived travel modes that shared space with strangers as the safest way to travel during the pandemic. A significant portion of people believed SRH, bus, subway, and regional transit are the least safe. Conversely, they had mixed perceptions of SRH. A significant portion of respondents believed it is the least safe; however, a similar portion of them rank it on the safer side of the spectrum. Also, it is worth noting that transit ratings were distributed equally across the spectrum, except on the safest scale.
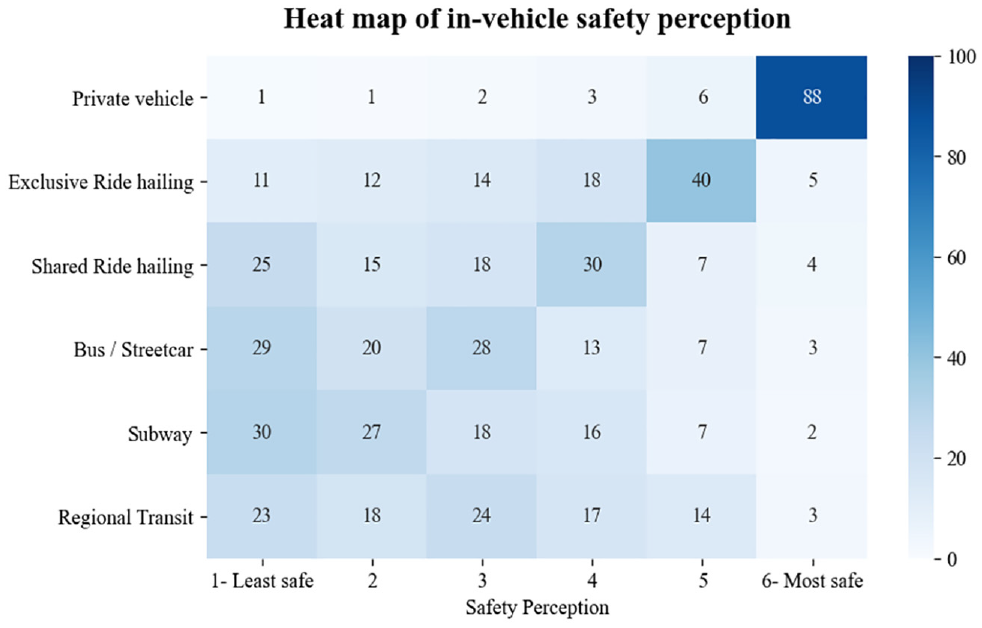
Safety perception of travel modes in percentage.
Attitudinal Factors
The 2021 SPETT survey also collected respondents’ attitudes toward the following aspects: (a) degree of concern about the pandemic; (b) extent of cautionary practices during the pandemic; (c) level of satisfaction toward public transit during the pandemic; (d) level of satisfaction toward certain aspects of transit agency; (e) degree of propensity toward continuing transit safety policies post-pandemic; (f) attitudes toward transit usage post the pandemic; and (g) attitudes toward reduced travel behavior post the pandemic. Results are presented in Figures 4 to 6, respectively.
On the pandemic-related factors, participants were asked to report the extent of their concerns toward certain COVID-19 characteristics, including but not limited to the number of daily new cases and the efficacy of the available vaccines. In addition, the following questions were asked to elicit the respondent’s degree of adherence to the health and safety measures that were in place during the pandemic. The questions in the former segment were coded in a five-point scale (1: not concerned, 5: concerned), whereas the questions in the latter utilized a different five-point scale (1: strongly disagree, 5: strongly agree). The attitudinal statements and scales in these segments were selected based on previous studies ( 39 ). Among the listed concerns (see Figure 5a), the emergence of a virus variant was rated the most, being of concern to almost 68% of respondents. Conversely, nearly 74% of respondents undertook all the enlisted measures, except for immobility during the pandemic, which was deemed negatively by almost one-third of participants (see Figure 5b).
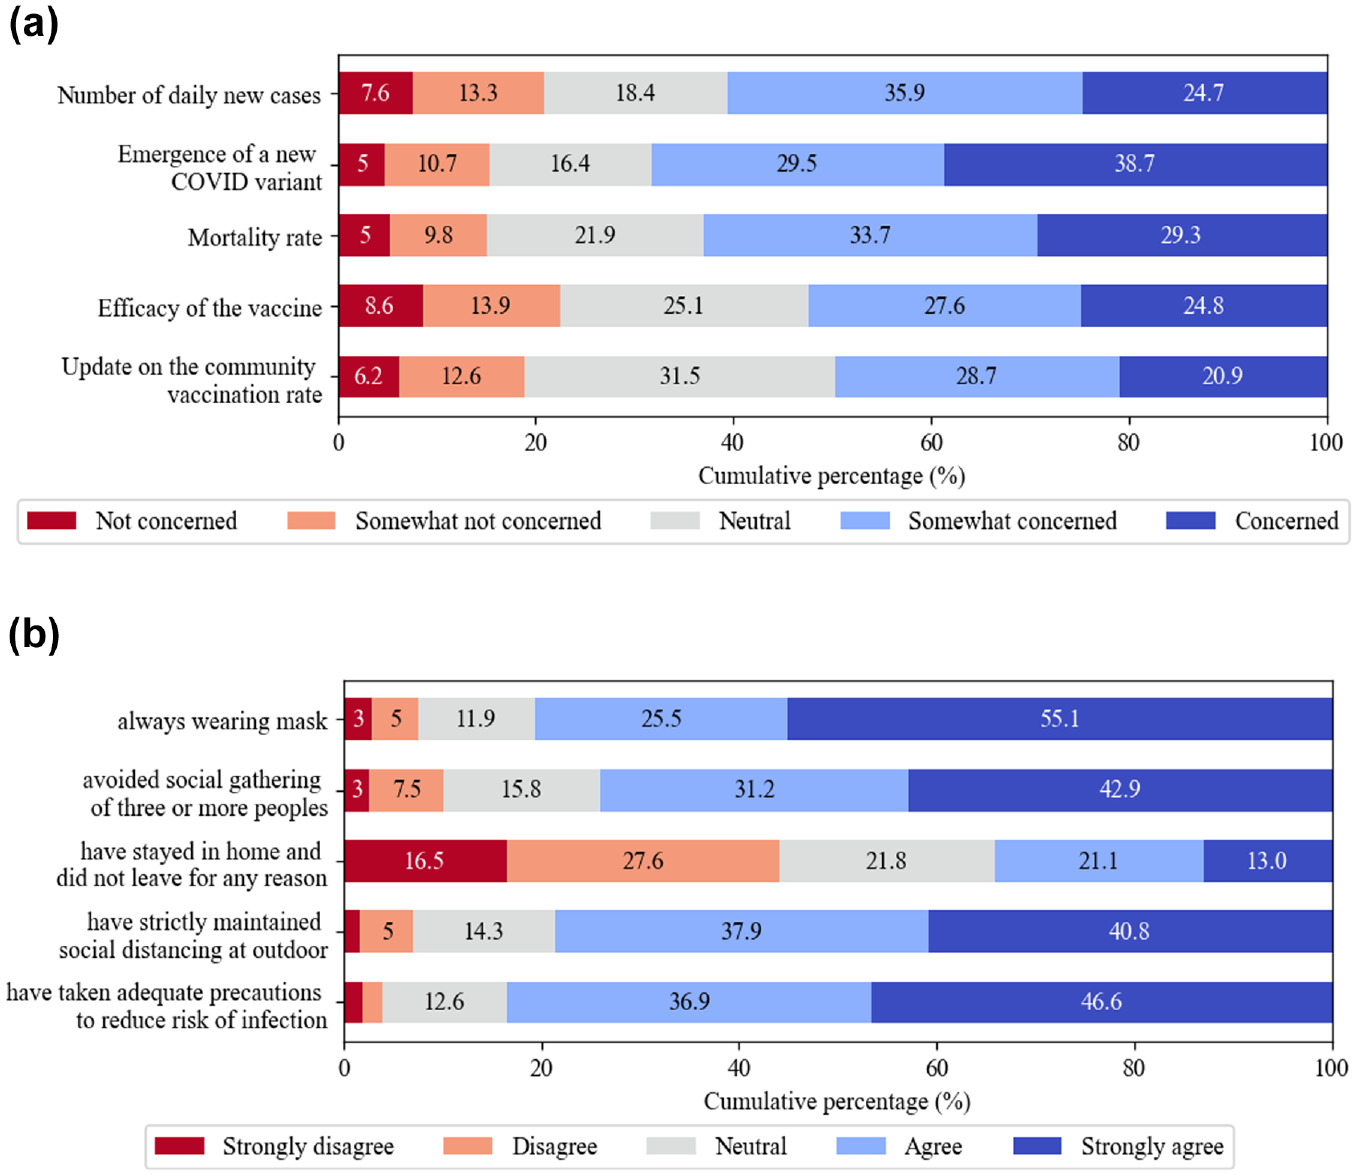
Attitudes toward pandemic concerns and protective behavior during the pandemic: (a) levels of concern toward pandemic attributes, (b) general behavior during the pandemic.
On public transit, the respondents were asked to provide their perceived satisfaction toward certain aspects of the transit system (i.e., on-time performance, overcrowding, overall hygiene safety) and transit agency (i.e., COVID-19 safety policy enforcement, addressing riders’ concerns during the pandemic). The responses were recorded on the five-point scale (1: highly dissatisfied, 5: highly satisfied) and are illustrated in Figure 6. The attributes and scale of these attributes were based on earlier literature on capturing perceived transit usage satisfaction ( 40 ). Most respondents held positive views toward most of the queries. The most substantial disagreement comes from overcrowding onboard transit vehicles. Nearly 30% of the respondents expressed their concerns about overcrowding on transit vehicles (see Figure 6a). This fits the expectation considering the transmissive nature of the COVID-19 virus. As for the satisfaction toward transit authorities, half of the respondents had a neutral view, whereas 70% of the other half were optimistic (see Figure 6b).
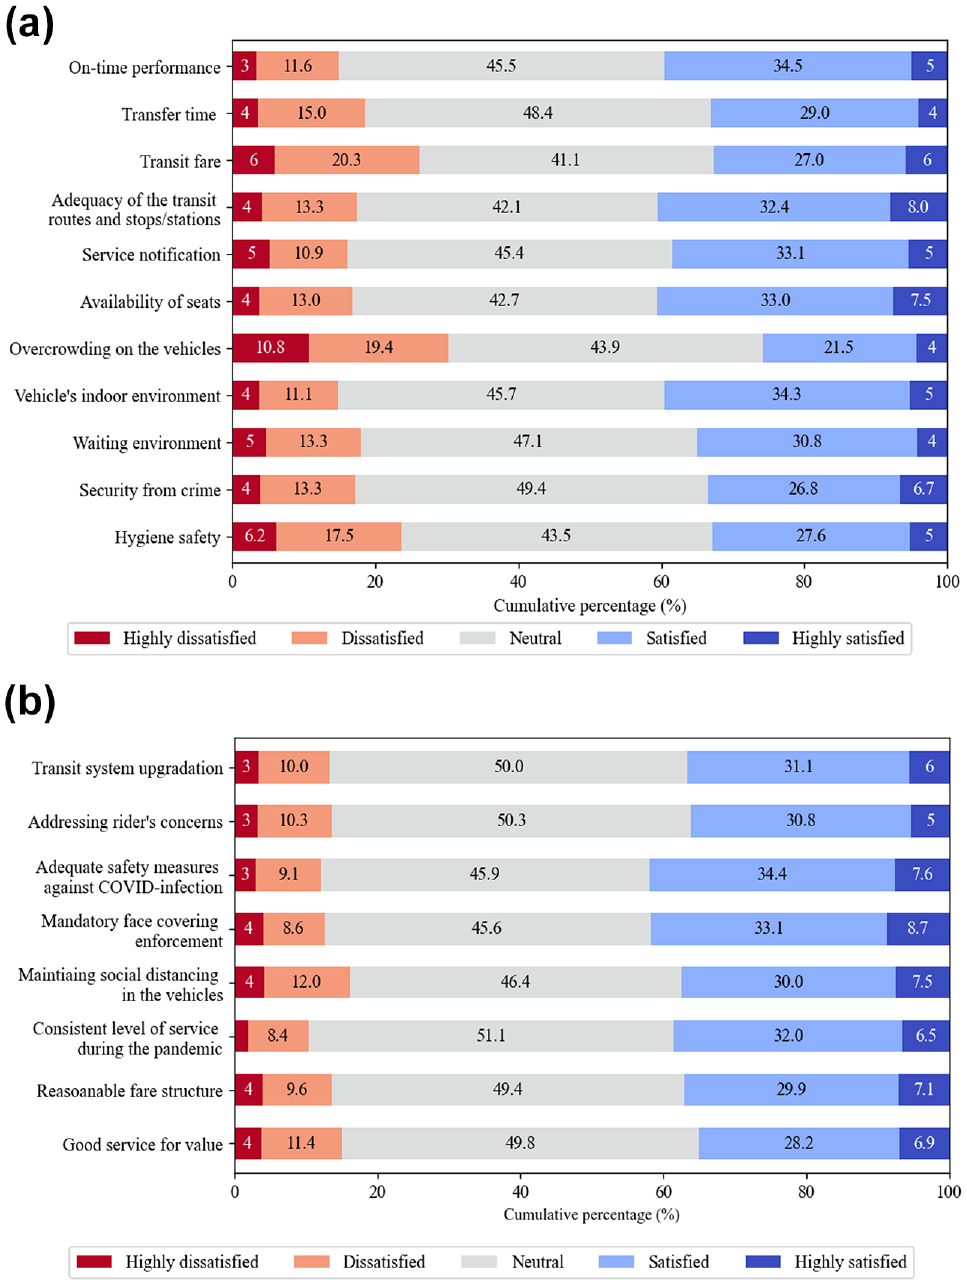
Levels of satisfaction toward public transit during the pandemic: (a) level of satisfaction toward public transit attributes, (b) level of satisfaction toward transit authority attributes.
The subsequent attitudinal segment was designed to capture the outlooks of GTA residents toward post-pandemic travel behavior, focusing on transit usage. These questions were also on a five-point scale. On transit usage in the future (see Figure 7a), more than 40% disagreed that they would avoid transit after the pandemic. However, at the same time, a similar proportion disagreed that they would use transit as their primary travel mode in the future. This indicates that transit demand might show some recovery after the pandemic, but it will also face serious competition from other travel modes. Respondents were also asked about their views on continuing the transit safety policies in the future (see Figure 7b). More than 61% of the participants preferred to keep the policies in place, suggesting their compliance with these measures. As for future travel behavior (see Figure 7c), at least 42% asserted their inclination toward reducing both short- and long-distance trips compared with the pre-pandemic period. Moreover, nearly 47% stated their positive attitude toward working from home if allowed. Conversely, almost 36% disagreed with the statement that they would be more inclined to buy their groceries and shop online than before the pandemic.
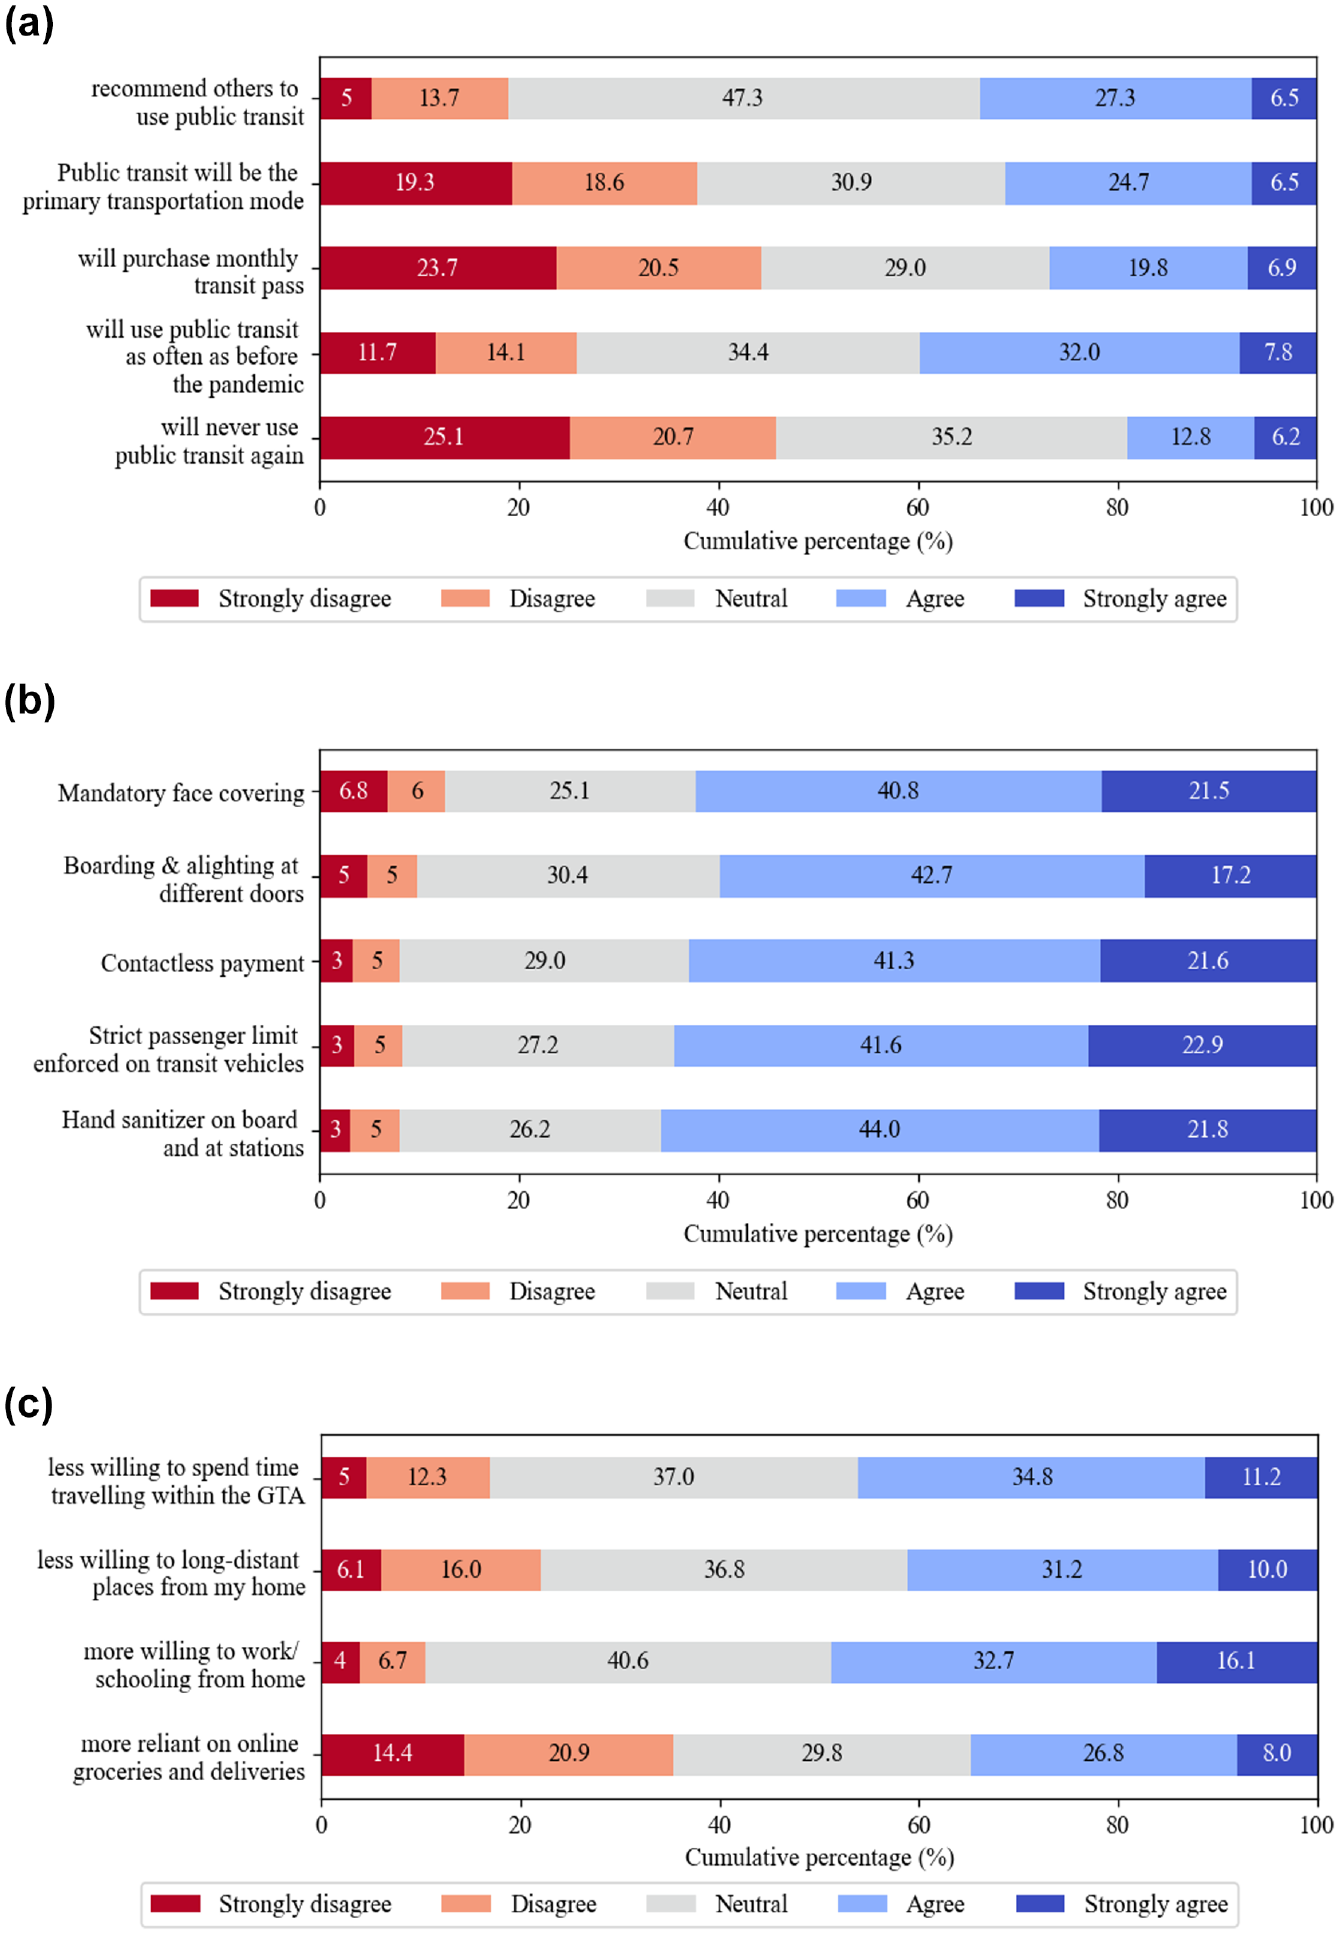
Attitudes toward future travel behavior: (a) attitude toward post-pandemic travel usage, (b) attitude toward implementation of transit safety policies post-COVID, (c) attitude toward post-pandemic travel behavior.
Methodology
The study adopted a sequential modeling approach for estimating a hybrid statistical model. First, factor analysis was conducted to define the factor structure based on observed indicators. A multiple indicators multiple causes (MIMIC) model was then used to estimate the expected values of the corresponding latent factors for all individuals. It enables latent factors to be considered as explanatory variables in subsequent analysis. Lastly, the multivariate ordered probit model was estimated considering the latent factors and other conventional variables.
Factor Analysis
Factor analysis was carried out to determine the relationship between latent attitudinal factors (i.e., latent factors) and observed indicators to incorporate these factors in the subsequent analysis. Two types of factor analysis were conducted: exploratory factor analysis (EFA) and confirmatory factor analysis (CFA). First, EFA is conducted to identify the number of latent factors required to explain the covariation among the observed variables. It also determines how these latent factors influence the observed indicators ( 41 ). The observed indicators considered for the EFA were discussed in the “Attitudinal Factors” section above. Based on the factor-eigen plot, factor analysis results, and latent-root criterion, eight factors with highly correlated observed indicators were retained ( 42 ). Cronbach’s alpha and composite reliability were further estimated to evaluate the internal consistencies in the observed indicators ( 43 ). The reliability index of all the factors was above the threshold value of 0.7, signifying a good level of internal consistency. The retained factors are defined as follows:
Factor 1: Concerns about pandemic characteristics
Factor 2: Adherence to protective measures during the pandemic
Factor 3: Satisfaction with public transit level of service attributes during the pandemic
Factor 4: Satisfaction with public transit infrastructures and hygiene safety attributes during the pandemic
Factor 5: Satisfaction with the measures undertaken by public transit authorities during the pandemic
Factor 6: Post-pandemic transit usage
Factor 7: Continuation of transit safety policies during the post-pandemic era
Factor 8: Reduced travel behavior during the post-pandemic era.
Once the factor was defined from the EFA, CFA was conducted to validate the latent factors. The final factor structure and the reliability index of the factors are shown in Table 2. All the factor loadings were significant at a 95% confidence level and above the cut-off value of 0.4. The factor structure had a comparative fit index (CFI) of 0.953, Tucker–Lewis index (TLI) of 0.946, a root mean square error of approximation (RMSEA) of 0.048, and a standardized root means square residual (SRMR) of 0.038. Each of the goodness of fit values were within the acceptable limit (CFI > 0.950, TLI > 0.900, RMSEA < 0.08, SRMR < 0.08), implying a good model fit ( 42 ). The EFA and CFA were conducted using the “psych” and “lavaan” packages, respectively, which are available in the statistical program RStudio ( 44 , 45 ).
Summary Statistics and Factor Loadings of the Observed Indicators in the Factors
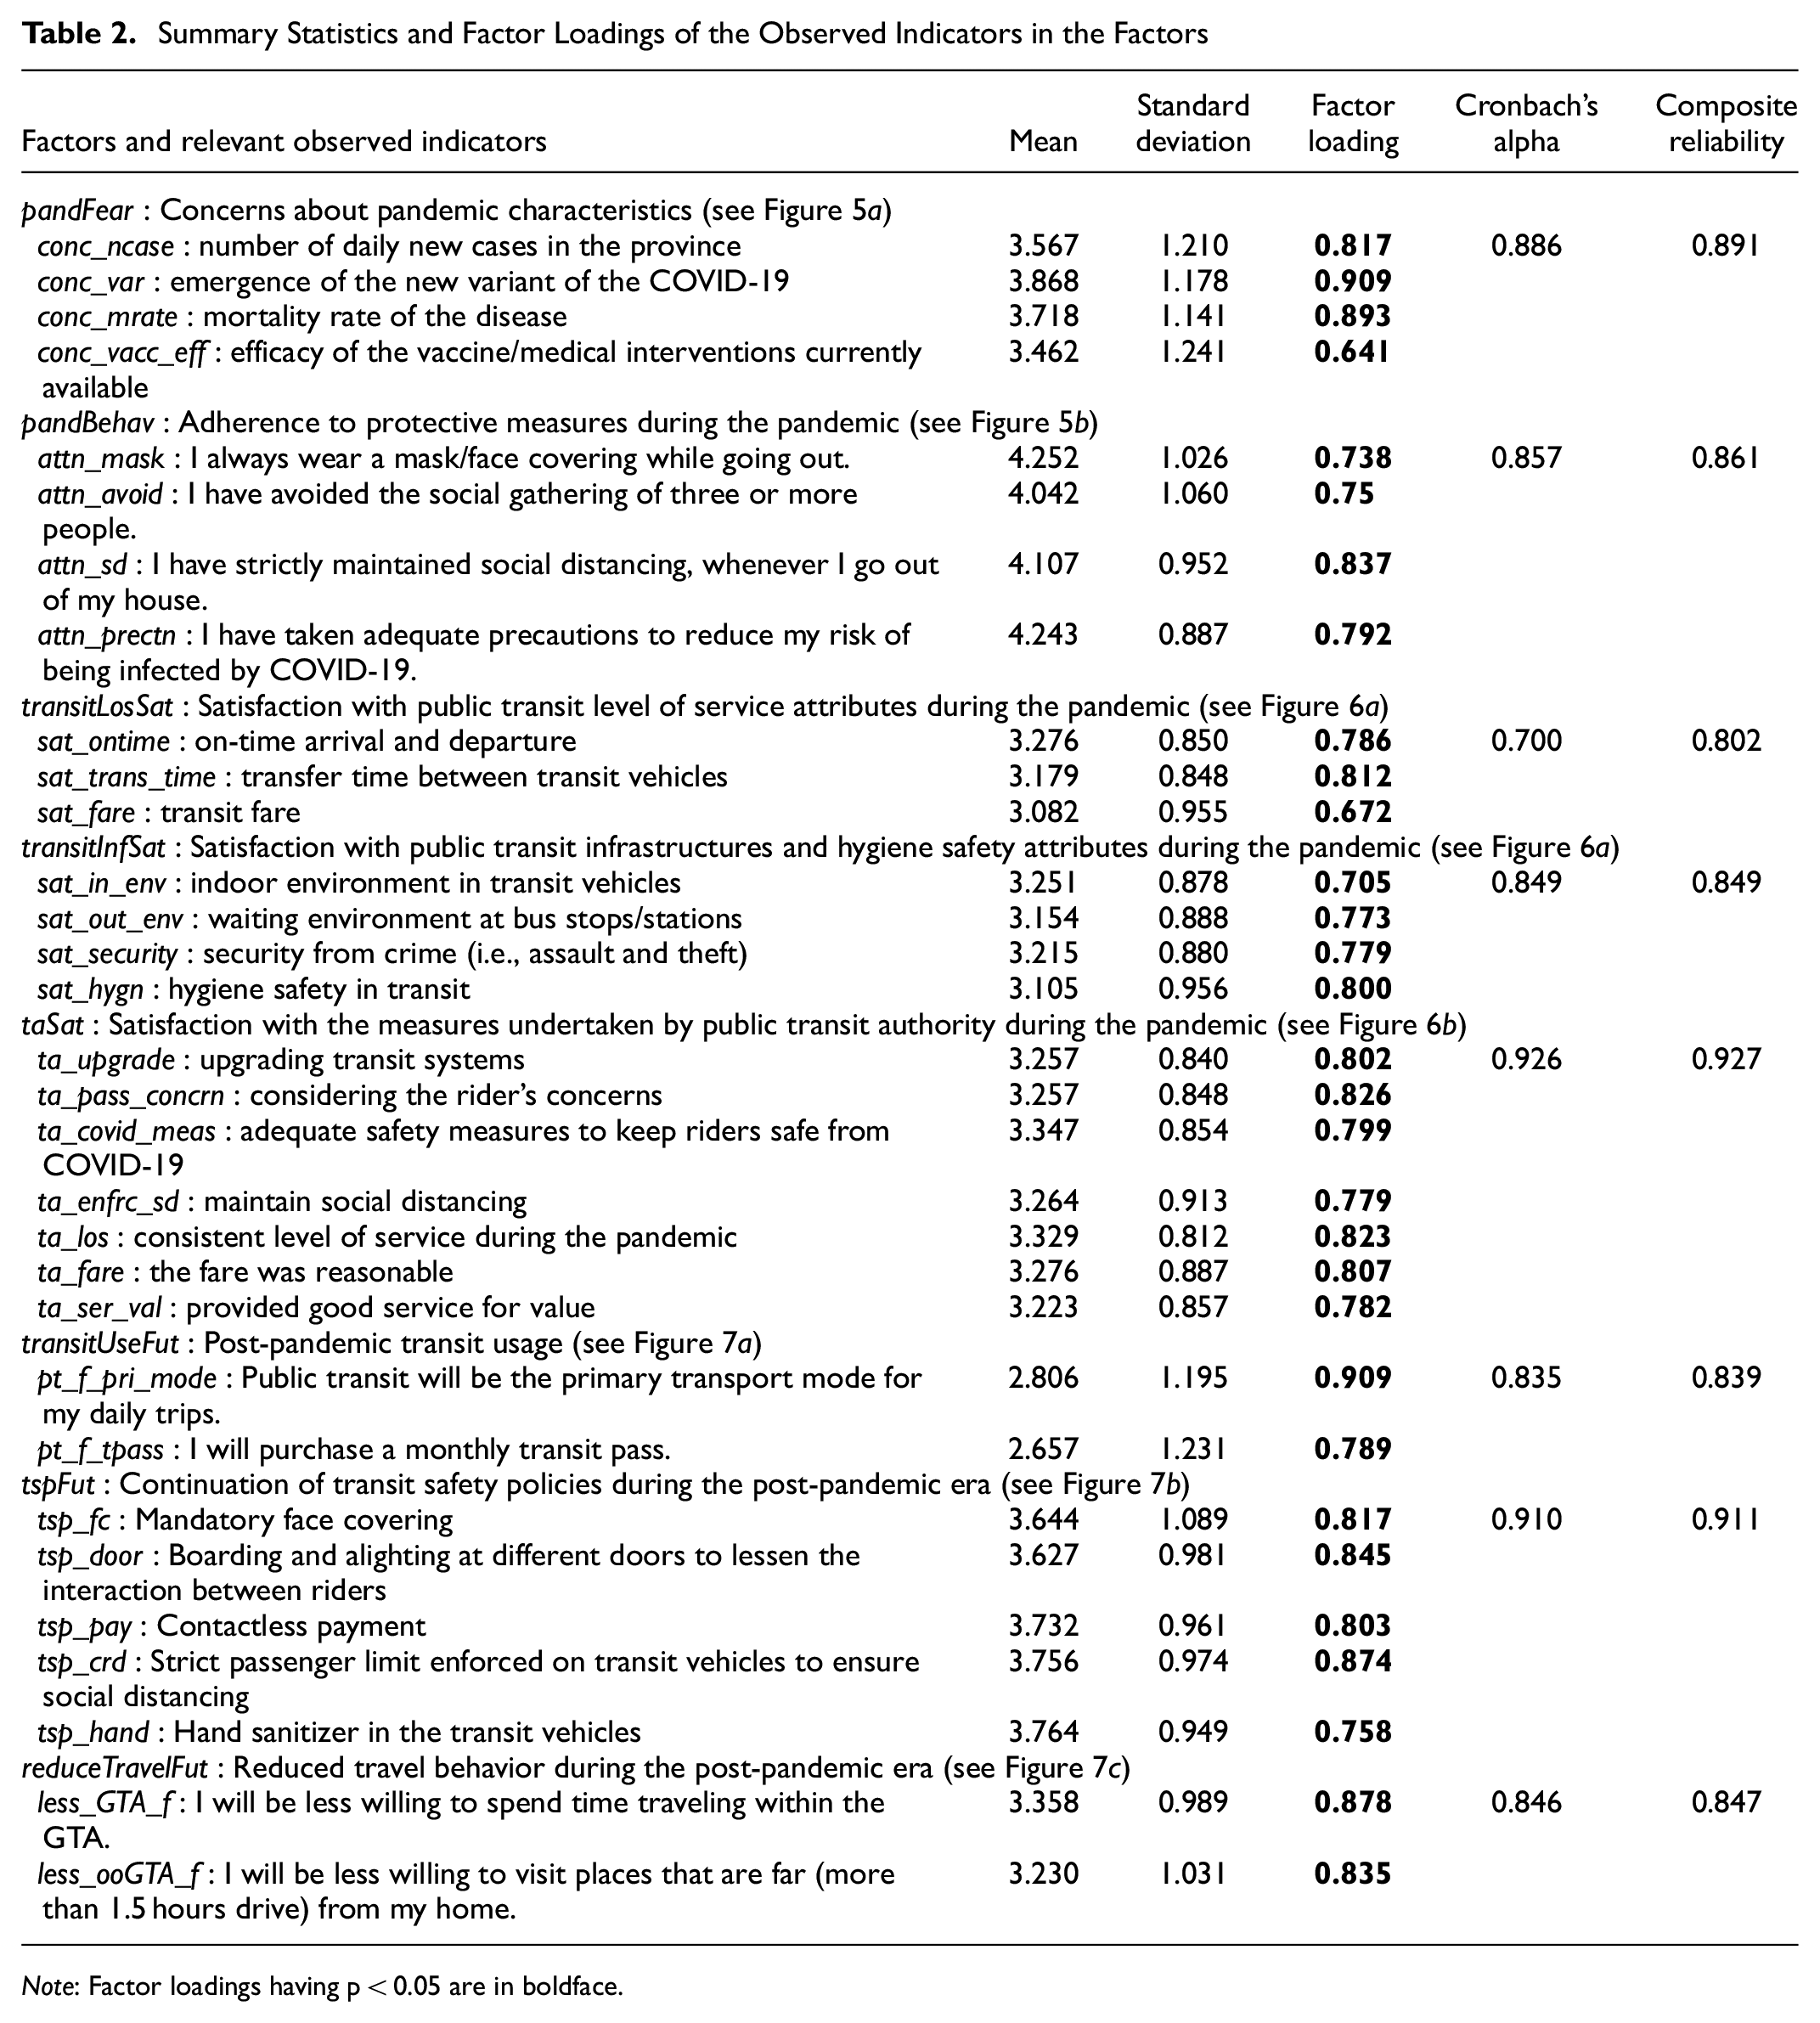
Note: Factor loadings having p < 0.05 are in boldface.
MIMIC Model
Having established the relationship between latent factors and observed indicators, the MIMIC model was estimated to allow latent factors to be incorporated into the statistical model discussed in the following section. MIMIC model is an extension of CFA with covariates. Therefore, the model simultaneously estimates the structural equation model (Equation 2), determining the relationship between “cause” variables (i.e., socioeconomic attributes) and the latent factors, and the measurement model (Equation 1) relating the observed indicator to the latent factors. As a result, the model is specified as follows ( 46 , 47 ):


where
The MIMIC model was estimated using the “lavaan” package available in the statistical software RStudio ( 44 ). The final structure of the model is illustrated in Figure 8. The estimates of the structural model are shown in Table 3. The coefficients of the measurement model were similar to the values represented in Table 2 and were significant at the 95% confidence level. The fit indices of the model (CFI: 0.945, TLI: 0.937, RMSEA: 0.044, SRMR: 0.038) were within acceptable limits (CFI > 0.950, TLI > 0.900, RMSEA < 0.08, SRMR < 0.08), indicating an overall good fit of the models to the data.
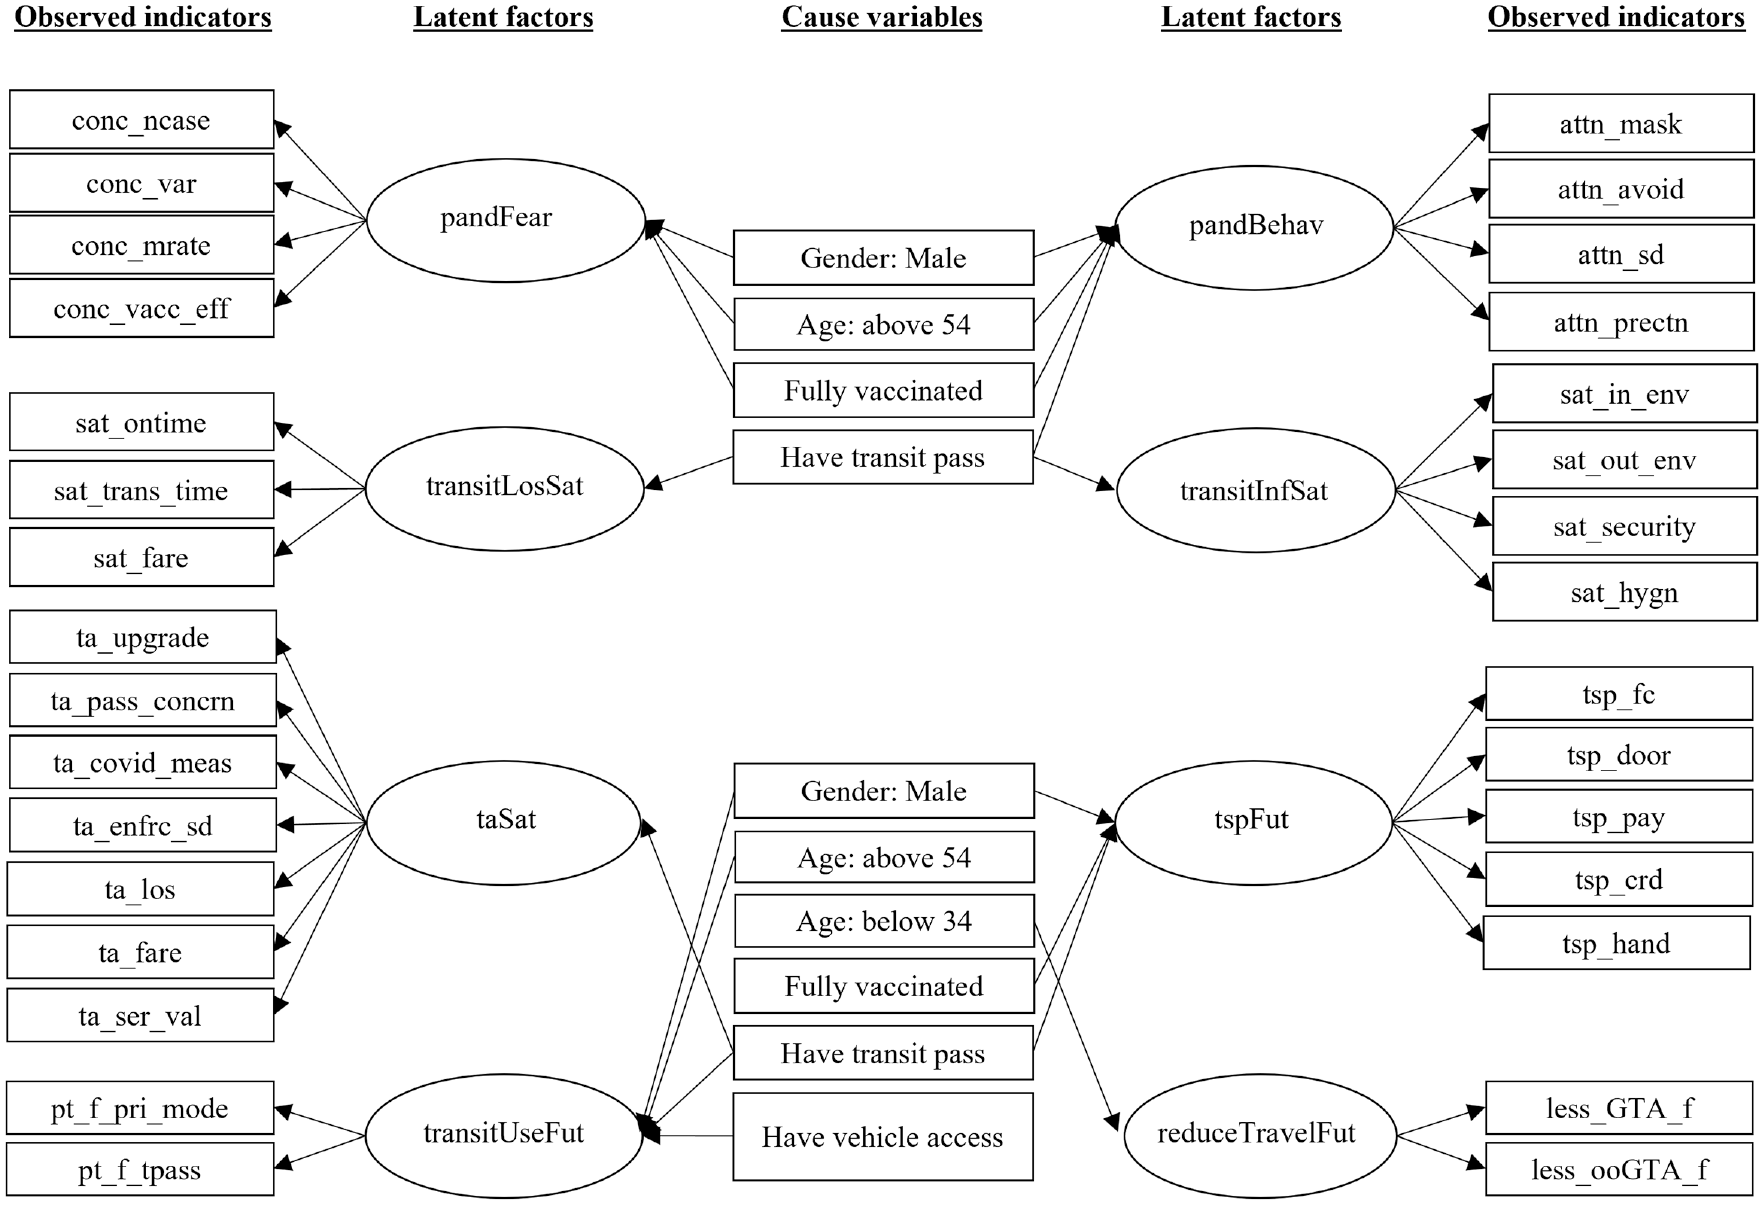
Path diagram of the multiple indicators multiple causes (MIMIC) model.
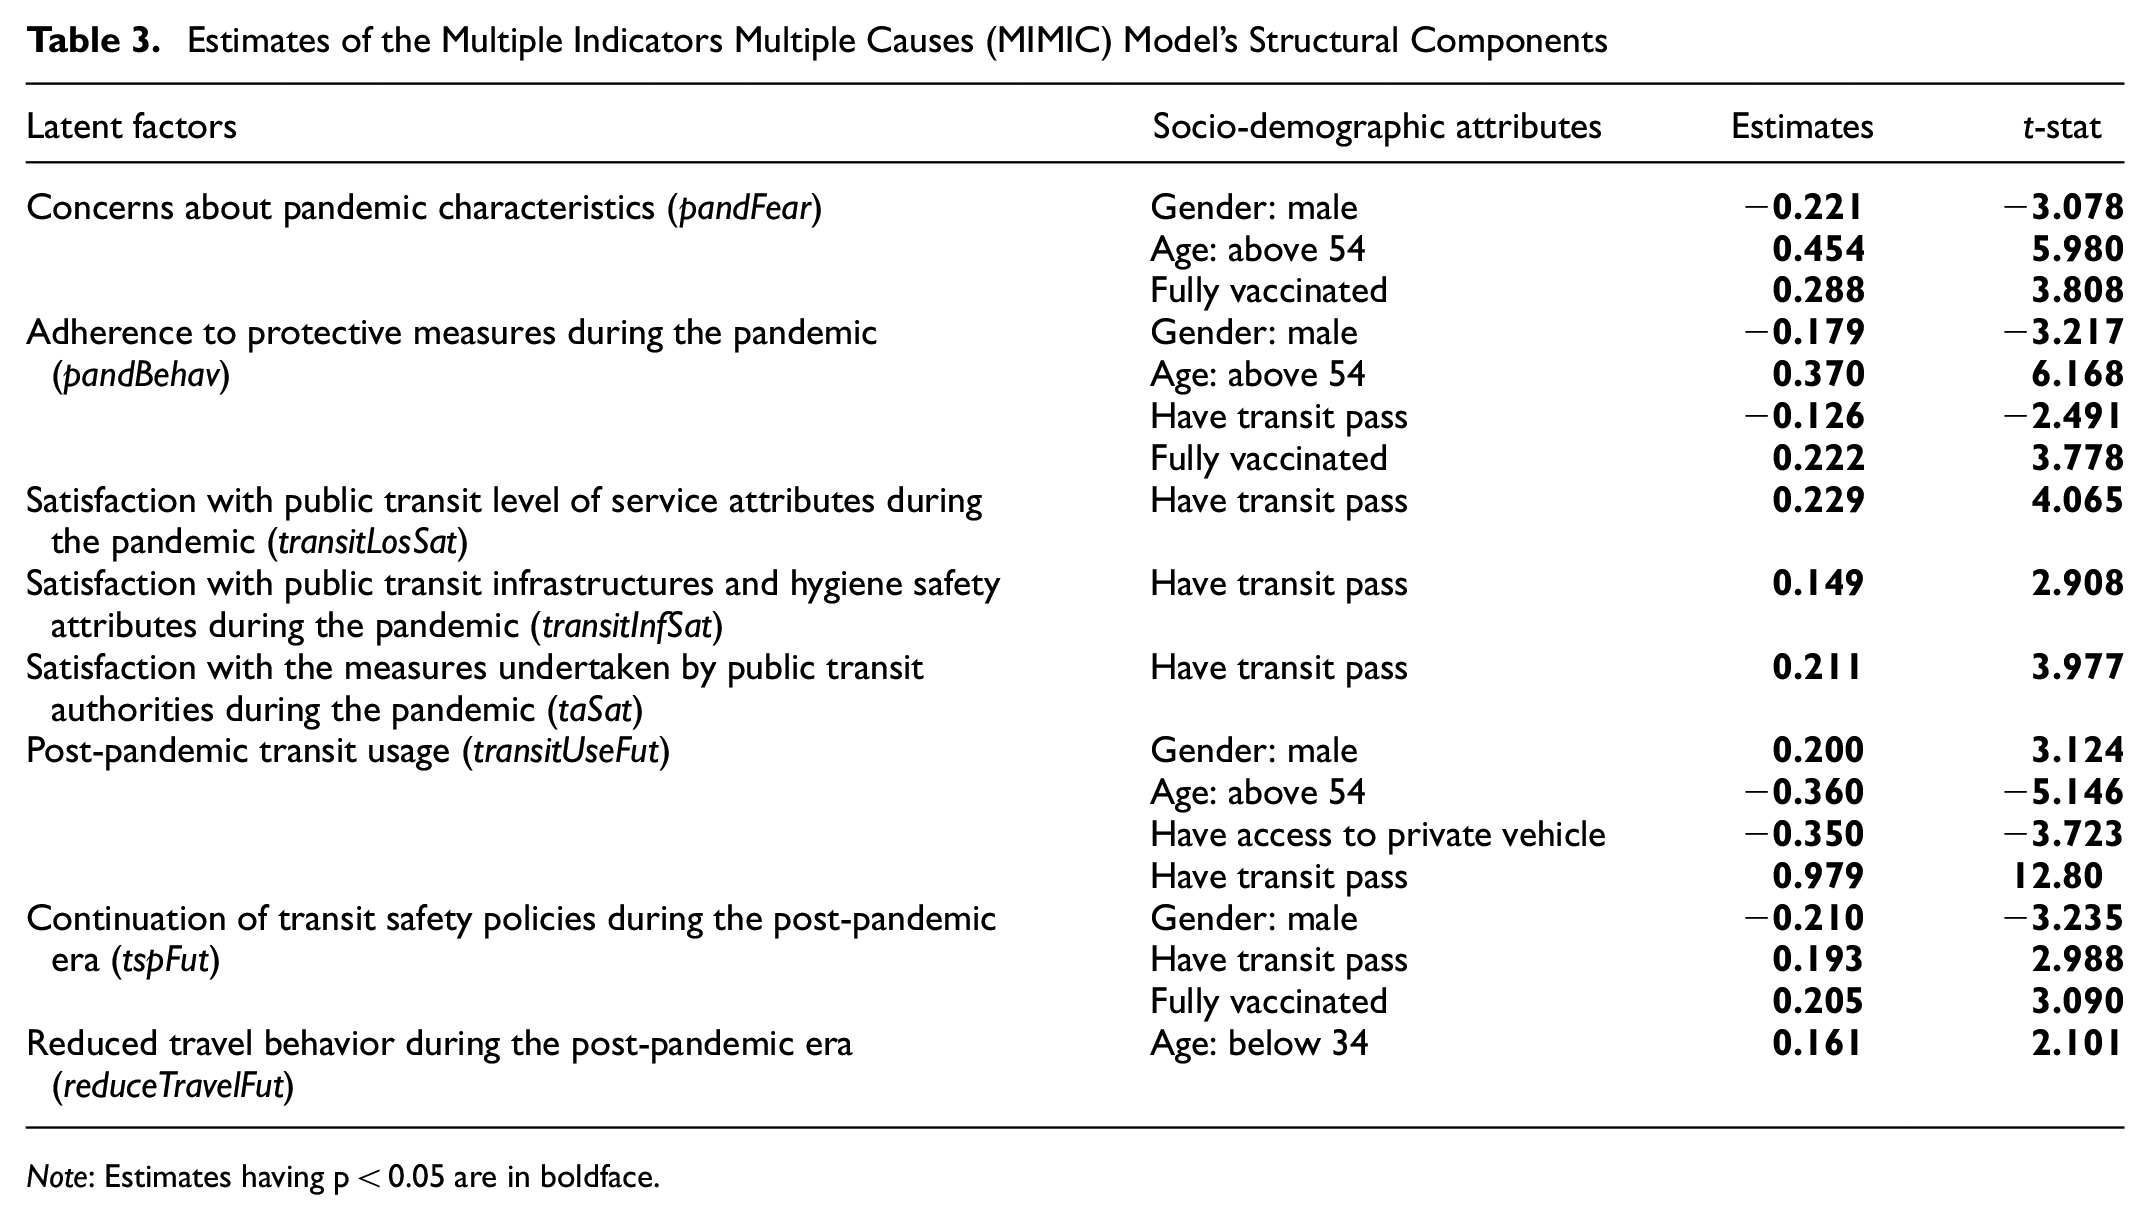
Estimates of the Multiple Indicators Multiple Causes (MIMIC) Model’s Structural Components
Note
The model revealed that older respondents and those who were fully vaccinated at the time of data collection had greater pandemic concerns and attitudes more toward taking protective measures, whereas the scenario was the opposite for male participants. These results align with the previous studies concluding that females and those who were vulnerable to COVID infection were more fearful of the infection ( 29 , 48 ). Conversely, those holding a transit pass at the time of data collection were observed to perceive higher satisfaction toward all the aspects of the transit system. This group also had a higher propensity toward using transit in the future, even with the continuation of in-place transit safety policies such as the mandatory mask mandate. Analogous results were observed for male participants, except that they had a negative attitude toward continuing the safety policies. On the contrary, older respondents and those with private vehicle access had attitudes showing a declining propensity toward post-pandemic transit usage. Interestingly, younger people aged 18 to 34 were inclined to have a reduced traveling attitude post the pandemic. This might be explained by their adaptation to trip-replacing practices during the pandemic, such as telecommuting and online shopping practices, based on their higher degree of tech-savviness than older people.
Multivariate Ordered Probit Model
The study adopted a multivariate ordered probit (MVP) model to investigate the attributes affecting the in-vehicle safety perception and how they, along with other pandemic-related factors, influence transit usage at the time of data collection (
49
,
50
). Respondents were asked to rate their perception of the safety of available transportation modes and report their transit usage frequency during the pandemic. The responses were recorded in the six-level and seven-level ordinal scales discussed in earlier sections, “Change in transit usage” and “Safety perception by travel modes.” Indeed, the reported safety perception can be modeled as continuous, nominal, or ordered dependent variables. However, modeling the dependent variables as continuous or nominal ignores the ordinal nature of safety perception. Consequently, they can be less efficient and lead to insignificant results. Therefore, the study selected the MVP model, which allows the seven ordinal outcomes to be estimated jointly and simultaneously captures possible correlations in unobserved error components. The latent variables,

where
The multivariate model extends the univariate model by allowing the error term,
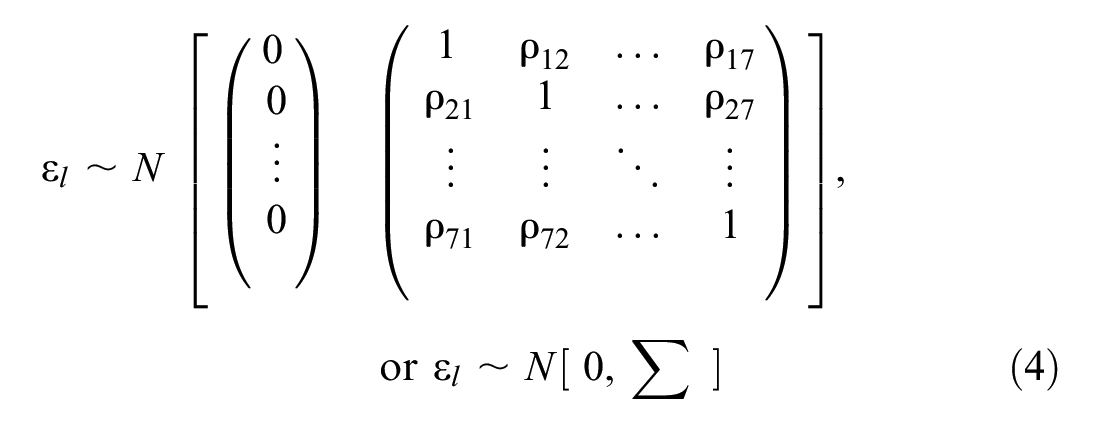
Thus, the models can capture the correlation among unobserved factors (captured through the error terms) across the underlying latent variables, which are also to be estimated. The model collapses to a univariate model when off-diagonal elements of the correlation matrix are set to zero. It implies that no significant correlation exists among the studied latent variables.
The likelihood function corresponding to the joint probability of all seven ordinal outcomes for individual,
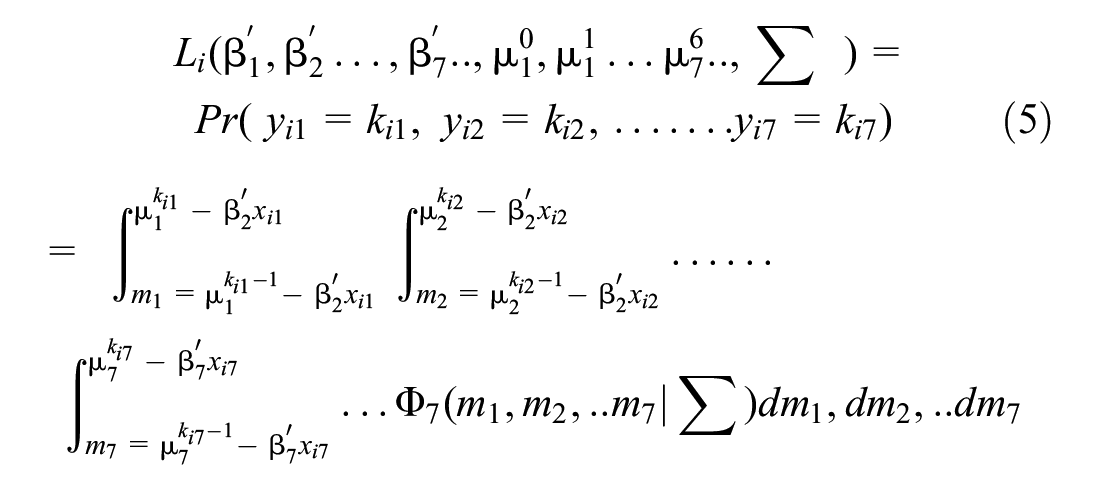
where
The sequential approach has limitations in that it does not jointly account for all the available information and is prone to underestimate the standard deviation of the parameters ( 47 ). However, prior literature revealed that sequential and simultaneous approaches render similar estimates ( 54 ). Even though the method to correct the variance of the corresponding latent factors was established ( 55 ), it was further noted that such a method becomes more complex with the increased number of parameters in the hybrid model. Moreover, correcting the variance was deemed “not fundamental of practical application” by earlier research ( 54 ). Therefore, the study did not apply the methodology.
Results and Discussion
The study jointly modeled the safety perception of available transportation modes in the study area and the frequency of transit usage during the reopening stage of the pandemic. The MVP model estimation initially considered exogenous variables, including the latent factors, socioeconomic attributes, and trip preferences before and during the pandemic. Therefore, the model is considered as the base model, M0. The analysis then tested two model structures considering the following relationship between the endogenous variables.
M1: Transit usage affecting the transit in-vehicle safety perception
M2: In-vehicle safety perception of all modes affecting the transit usage
The models for each context were specified after iterative trials with various combinations of covariates following the forward stepwise selection method. Therefore, the null model was estimated with no variables. Explanatory variables were then included sequentially based on their significance and the behavioral intuitiveness of the coefficient. Some insignificant covariates were retained as they provided insights into the corresponding outcomes. The fit indices of all the models are presented in Table 4. Once the models corresponding to Models M0 to M2 were estimated, the final model was selected based on its statistical power in explaining the data. Overall, Model M2 was observed to fit the data better considering all the fit indices. The corresponding Akaike information criterion (AIC) and Bayesian information criterion (BIC) of Model M2 were the lowest, even though the
Fit Indices of the Estimated Multivariate Ordered Probit Models
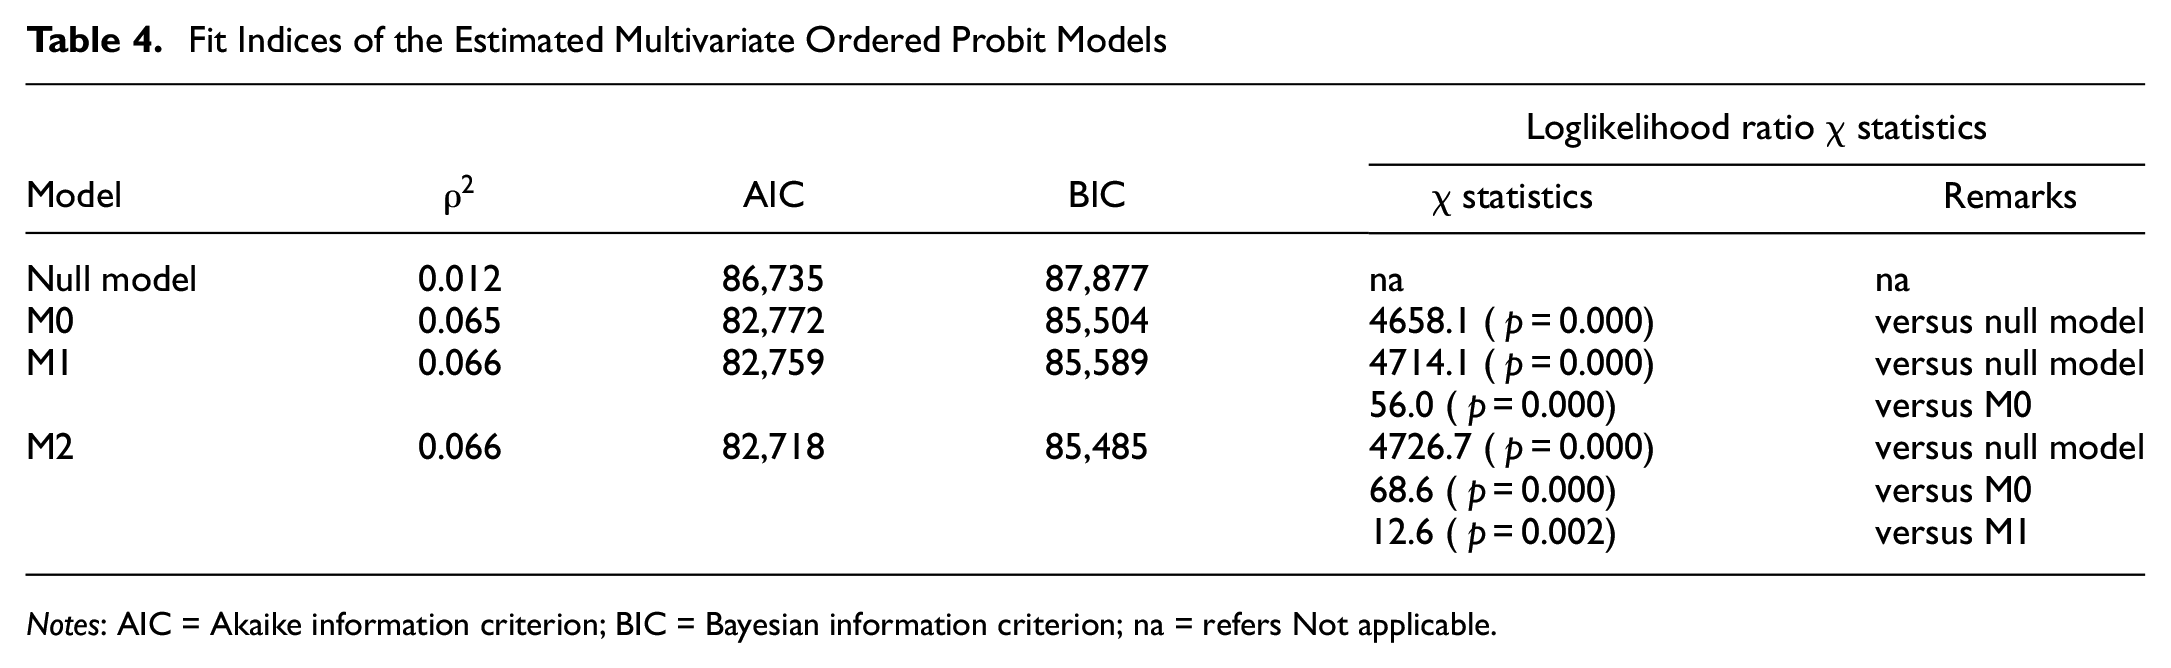
Notes: AIC = Akaike information criterion; BIC = Bayesian information criterion; na = refers Not applicable.
Model Estimates
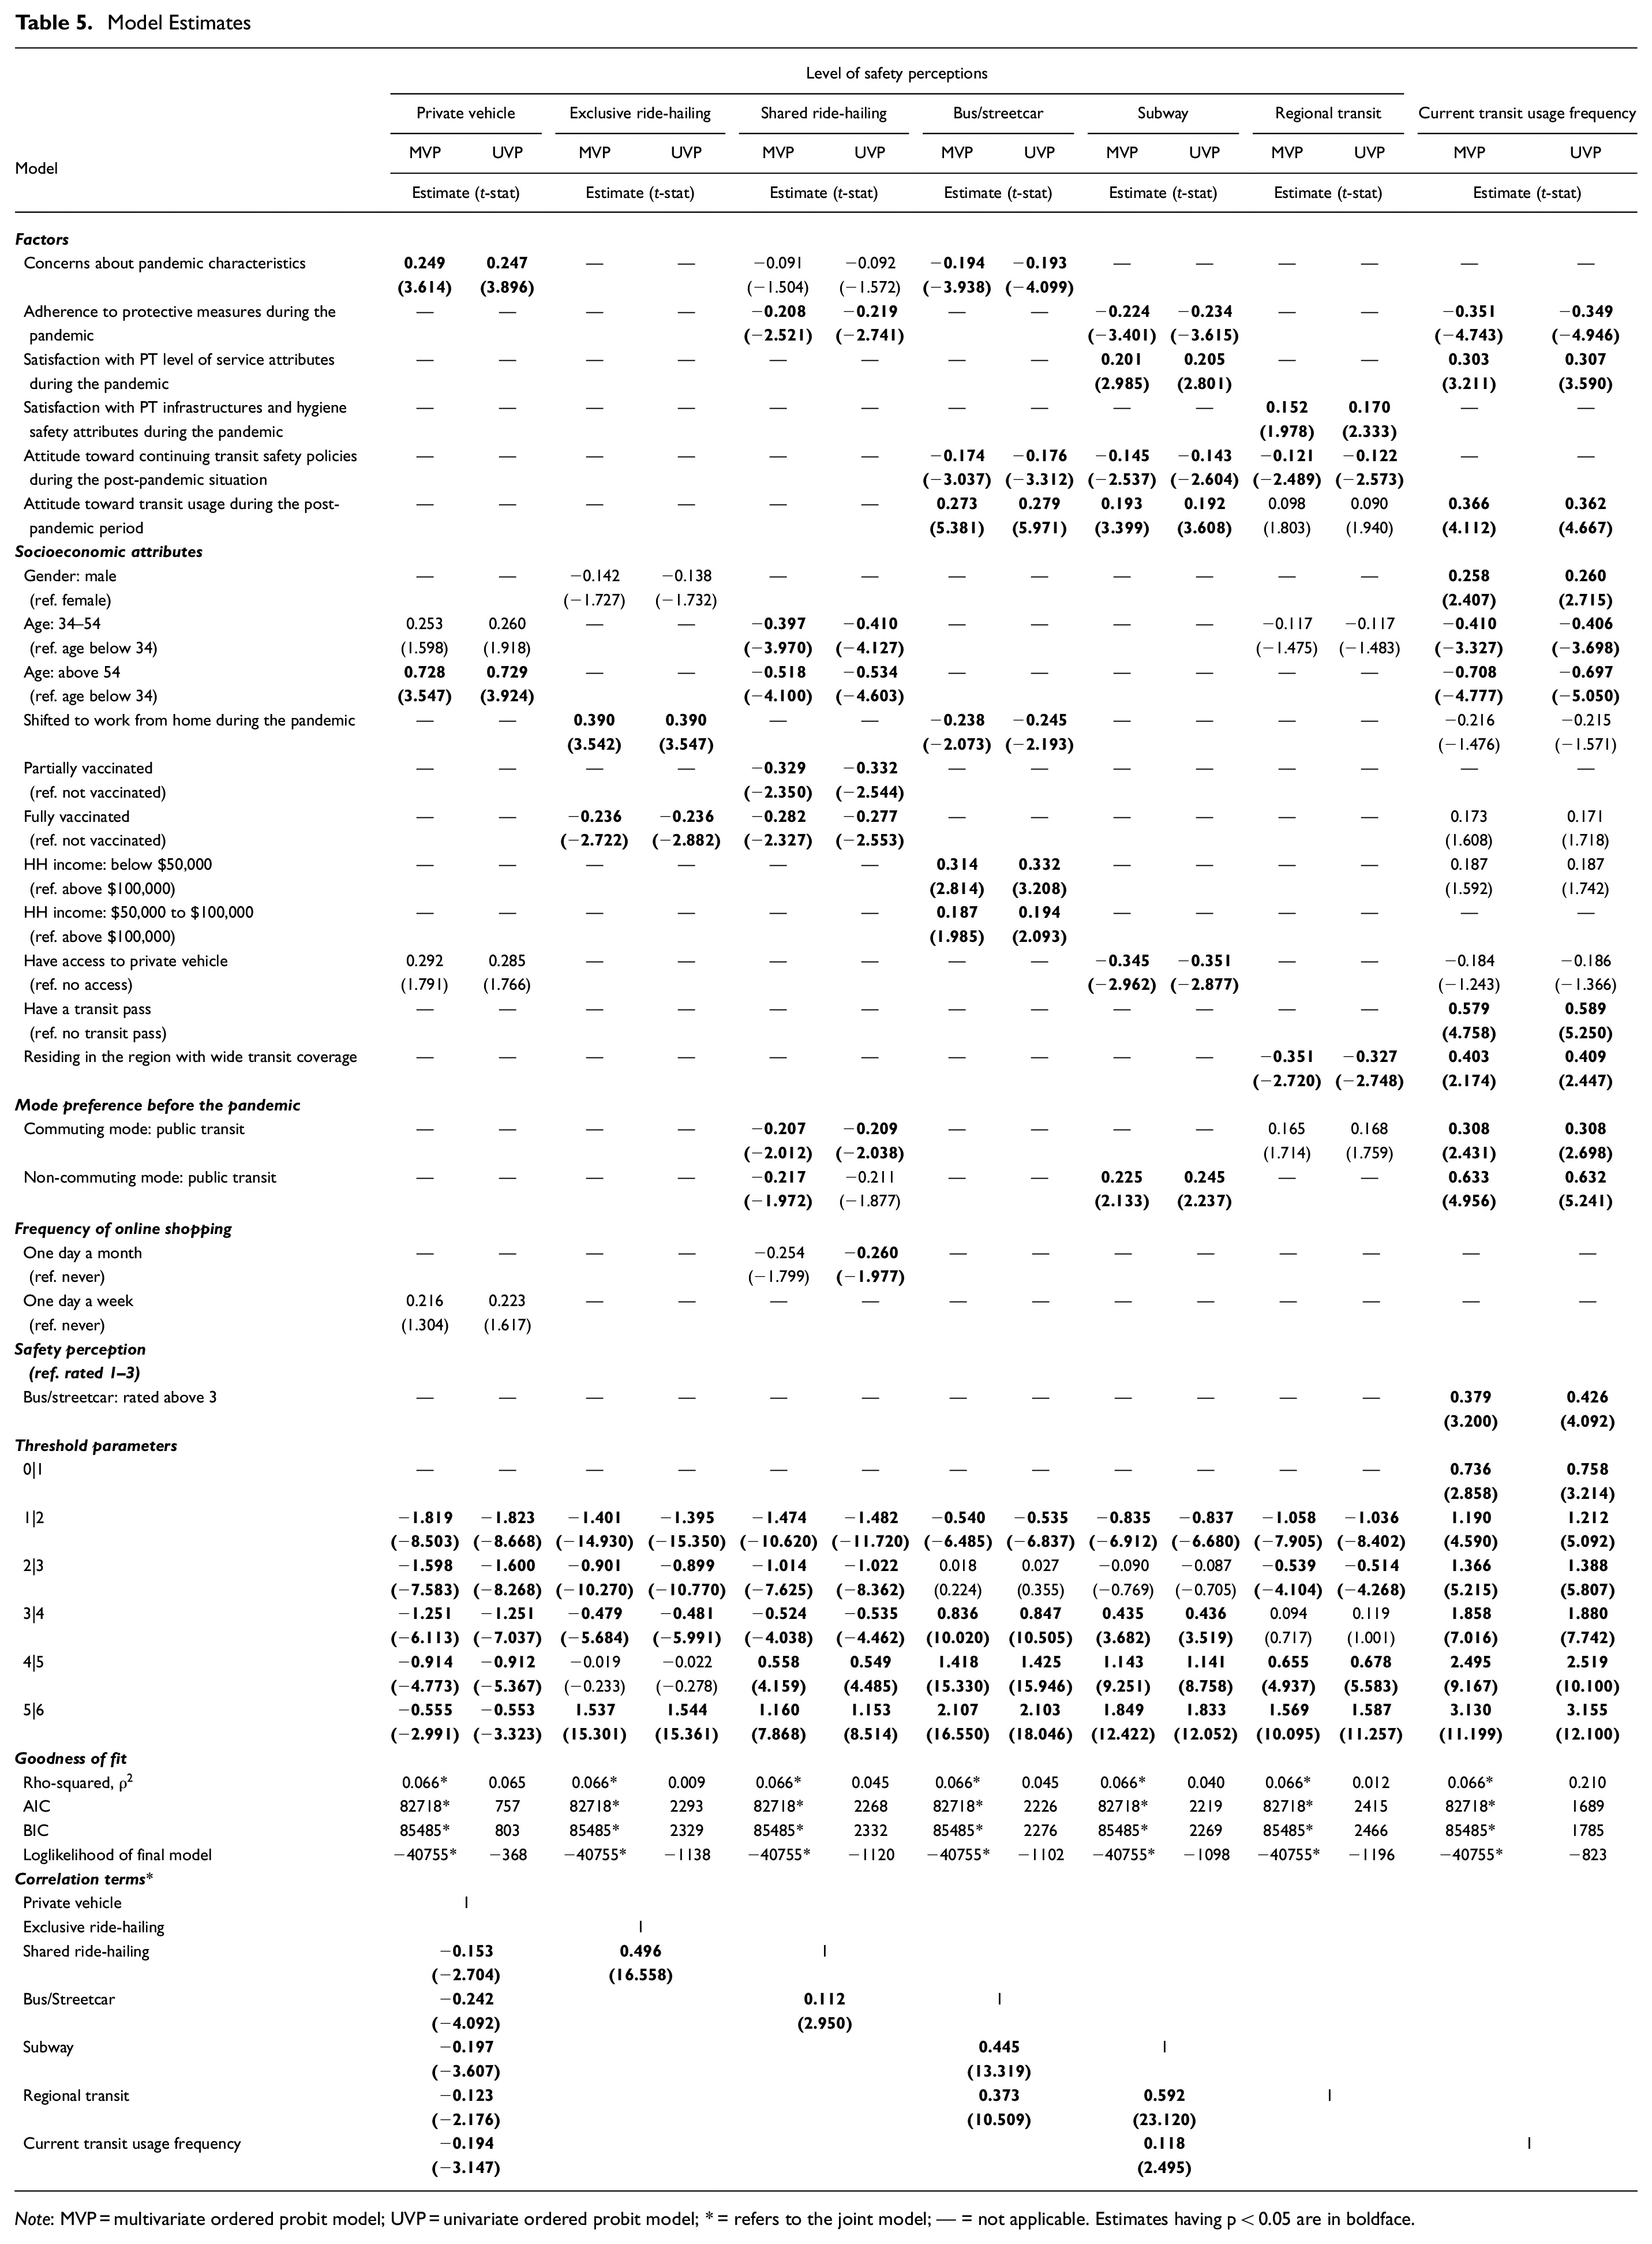
Note
On the pandemic-related factors, those with higher pandemic concerns tend to deem private vehicles safer than shared modes like SRH and buses. Similar trends were observed for individuals reporting greater adherence toward protective measures against the infection. Such behavior also has the potential to reduce transit usage during the pandemic. On the contrary, higher satisfaction with public transit during the pandemic led to better safety perception and increased the tendency to take transit. The outcomes underscore the adverse effects of the pandemic on the use of the shared modes. At the same time, it also signifies that more reliable, safer, and consistent services can regain lost transit demand post-pandemic. Similar behavior was found in the first cycle of the SPETT survey ( 33 ). The models also had factors corresponding to post-pandemic behavior. It was noted that those who supported continuing transit safety policies implemented during the pandemic had lower safety perceptions toward transit alternatives. However, no significant correlation was found between this factor and transit usage behavior. This might be from the consideration of added safety against community transmission through transit. For instance, a non-transit user might still have a fear of being infected when exposed to a transit user. Conversely, the post-pandemic transit usage factor tends to affect the transit safety perception and transit usage positively.
Socioeconomic attributes, mobility tool ownership, and travel behavior were found to have a significant influence on transit usage and safety perception. The model depicted that male, fully vaccinated, lower-income groups, transit pass holders, and pre-pandemic transit users had more propensity to make transit trips frequently. Even though transit pass ownership was found to be one of the most significant factors affecting transit usage during the pandemic, the choice to own a transit pass might be the need for frequently making mandatory trips by transit. On the flip side, owning a pass might encourage one to make additional trips to make the purchase as economically beneficial as possible ( 57 ). Conversely, an aversion to using transit was observed for those over the age of 34, who had private vehicle access, and who shifted to work from home during the pandemic. These findings are also in line with previous studies assessing the impact of COVID on the willingness to use public transit ( 5 , 16 ). Moreover, these groups tended to have higher safety perceptions of private vehicles, which is intuitive.
On household location, respondents residing in regions with better transit coverage (i.e., City of Toronto, Peel, and York) were seen to have a higher propensity to use transit despite having adverse safety perceptions of regional transit ( 34 ). This may be explained by the distinctive characteristics of regional transit services. These transit systems connect the regions’ economic and academic hubs and primarily serve long-distance commuting trips ( 58 , 59 ). Moreover, they have infrequent stops with high passenger activity and crowding during peak hours, which might raise the respondents’ concerns about possible exposure. On the contrary, the same regions have more economic and academic activity than the other regions, producing more mobility during the reopening stages. Besides, the vaccine rolling out was in full swing in those regions when transit usage was reported. All these might contribute to the increased transit usage for this group of participants. However, vaccinated respondents were seen to have an adverse perception of shared modes other than transit, such as exclusive (ERH) and SRH services. This might be from the constant fear of infection while sharing limited common space with drivers or strangers.
The model also aimed to investigate whether in-vehicle safety perception significantly influences transit usage (Model M2) or vice versa (Model M1). The former model was statistically significant in supporting the underlying relation. Interestingly, only one safety perception variable was found to positively affect the transit usage tendency at the 95% confidence level. Those who rated the bus safety perception above “3” typically had a higher propensity to use transit. This might be because there was most usage of buses among other transit alternatives during the pandemic. Further insight into the dataset revealed that 39.9% of transit users took buses compared with 27.5% who took the subway.
The error correlation matrix is shown at the bottom of Table 5. Several correlation terms were found to be significant in the model. For instance, unobserved factors, like lifestyle preferences and perceptions, simultaneously affect one’s safety perception and transit usage frequency. The negative error correlation among private vehicles and other modes and transit usage suggested that unobserved factors (like a strict tendency to avoid shared space with unknown passengers) contributing to increase safety perceptions of private vehicles also tend to decrease safety perceptions of shared or public transport modes along with lowering the propensity to use transit. On the contrary, a positive correlation was observed for ERH and SRH (those who prefer door-to-door travel or avoid crowding in transit but have no private vehicle access are likely to have increased safety perception of ERH and SRH). A similar positive correlation was found between shared modes (like between SRH and bus, among bus, subway, and regional transit), presumably because of less sensitivity about crowding. Another contributing factor might be having confidence in self-protection measures or safety protocols undertaken by the service provider. Conversely, a positive correlation was observed between safety perception of transit vehicles (i.e., subway and regional transit) and transit usage. This is intuitive and may imply that those who believe that the adoption of transit safety protocols can protect them against infection are more likely to have an optimistic inclination toward better safety perceptions of transit vehicles and using transit usage more frequently. Overall, the multivariate probit model provides valuable insights into the intricate relationship between safety perceptions and transit usage.
Furthermore, Figure 9 shows the marginal effect, which was calculated for the UVP transit usage model with better explanatory power. The marginal effect can be used to better understand the impacts of significant factors. Overall, those who are older than 34 and shifted to working from home during the pandemic had a higher propensity not to take transit. To illustrate, those over the age of 54 were 26% more likely not to take transit than those under the age of 54. Conversely, those who resided in regions with wide transit coverage, used public transit before the pandemic, and had a better safety perception of buses, were seen to have a higher tendency to take transit trips. However, the lower marginal effect of vaccination may be because of respondents’ wavering attitudes toward vaccine efficacy. Nevertheless, the positive effect can be taken as optimistic behavior from the GTA residents returning to transit when COVID is not considered a threat.
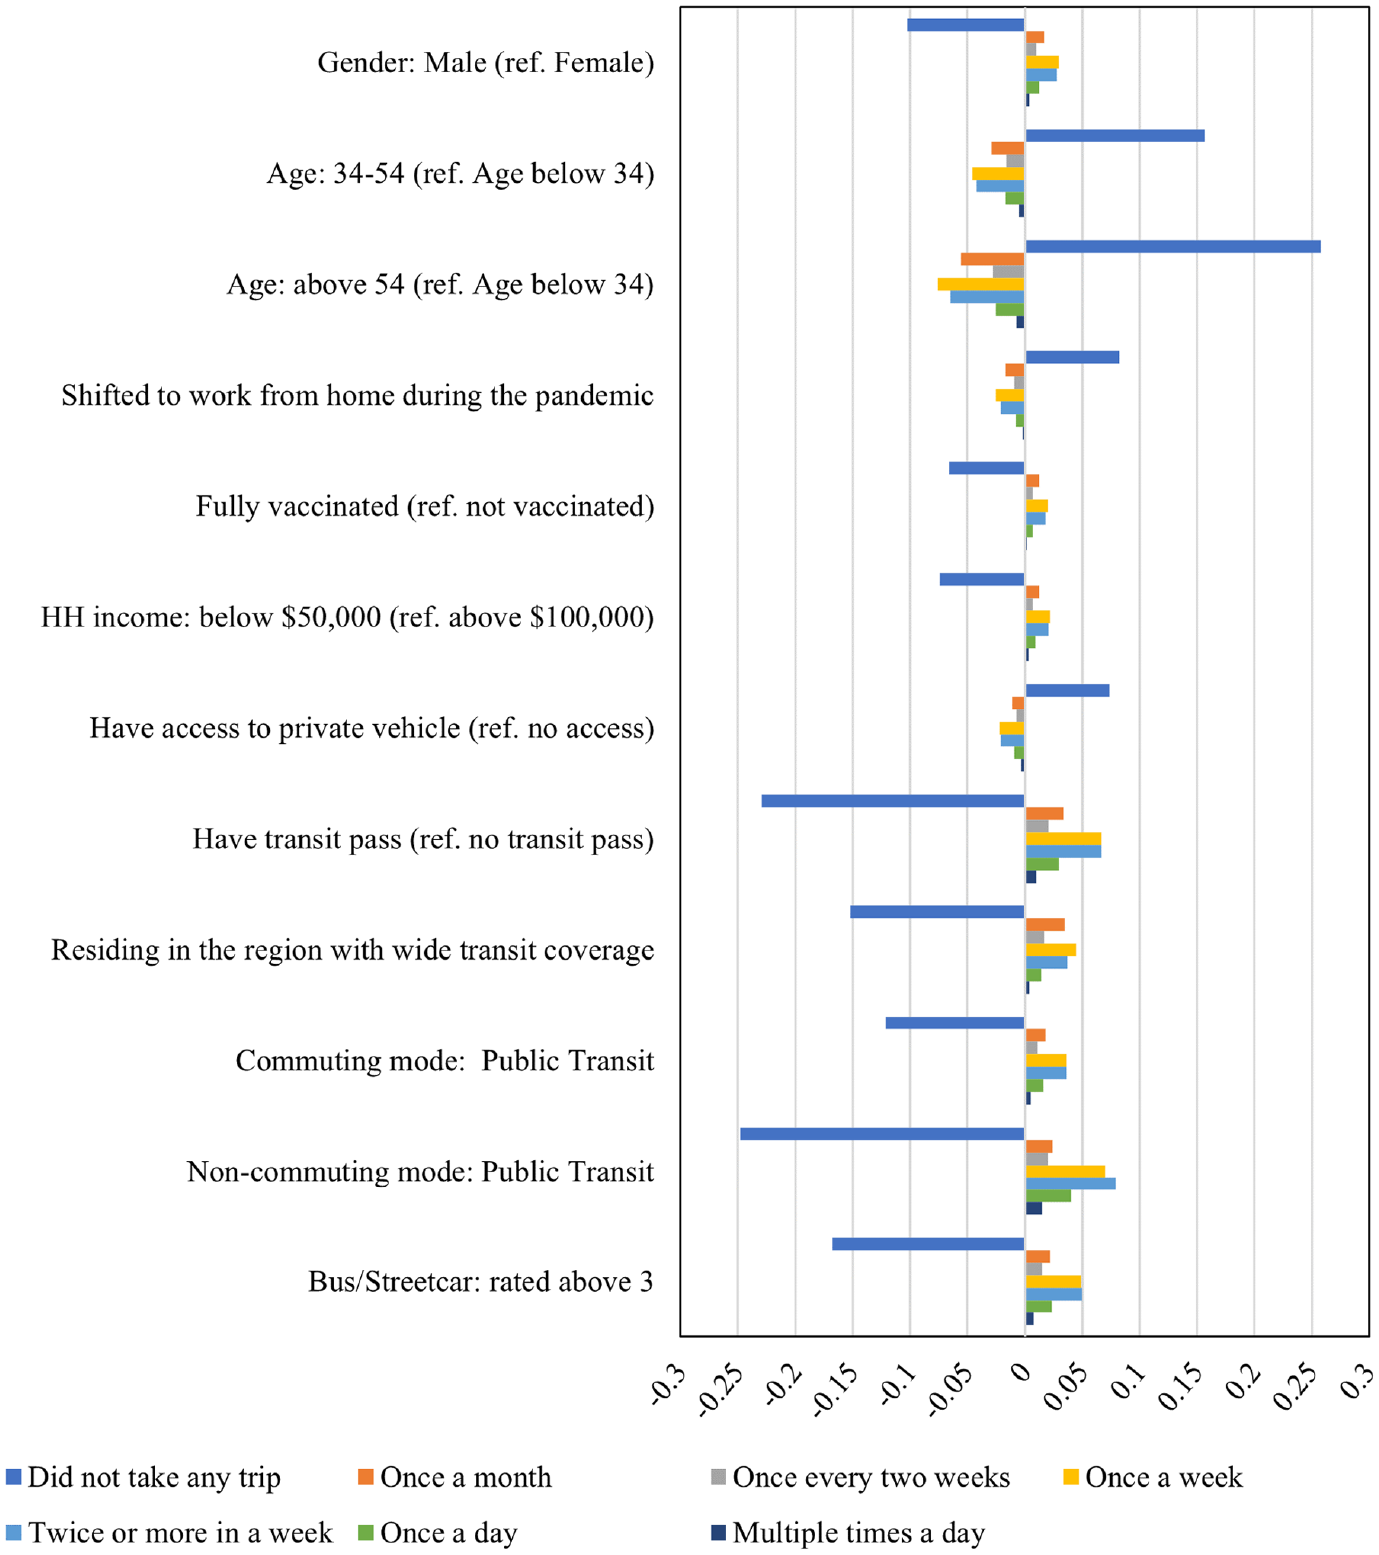
The marginal effects of attributes on transit usage.
Conclusion
The key focus of this study was to examine pandemic-related factors, such as vaccination and working from home, that have the potential to affect an individual’s transit usage behavior. In addition, the study explored the factors influencing in-vehicle safety perception, particularly public transportation, and if such perception affects transit-choice decisions. The study therefore adopted an integrated approach by jointly modeling vehicle safety perception and transit usage scenarios during the pandemic, considering the fear of virus infection. Furthermore, the study tested the impacts of pandemic-related latent factors on respondents’ transit usage behavior.
The study, in summary, found that pandemic-related factors significantly affected transit safety perception and its usage. Individuals with greater concerns about the pandemic were observed to have a higher propensity to perceive private vehicles as safer than other shared modes. Moreover, attitudes toward maintaining the social distancing measures also tended to have a negative influence on transit usage behavior. However, satisfied public transit users and those with better safety perceptions of the bus had more propensity to use it. This signifies that the assurance of more reliable, safe, and consistent service may restore the declining transit demand in the post-pandemic situation. Such notions were further cemented by observing a higher inclination toward using transit among those residing in regions with better transit coverage. While considering the impact of demographic attributes, the model revealed that those who were males, transit pass holders, pre-pandemic transit users, and belonging to a lower-income group had more inclination to make transit trips more frequently than others. A similar propensity was also observed for fully vaccinated people. On the contrary, those belonging to an older age group and those who had shifted to working from home had declining attitudes toward transit usage.
However, the study depicted significant error correlations among in-vehicle safety perceptions and transit usage, implying the effect of some unobserved factors. A significant negative correlation was observed between the safety perception of private vehicles and shared modes and transit usage. Conversely, an opposite scenario was found among safety perceptions of shared modes and transit usage.
Even though the study highlights some key factors affecting transit usage behavior, further in-depth analysis is needed. The paper represents a preliminary analysis of the SPETT second cycle survey. Some inherent limitations and constraints of the survey mean that influential factors such as travel diary, trip rate, and daily travel distance were not included in the model. In addition, the survey was collected using an online platform, which has the propensity to have a biased response from younger and higher-income groups. Imposing additional constraints like an age group quota might minimize such bias. Another point to highlight is that the study was conducted considering the modes available in the study area, whereas there might be other available modes such as human-powered three-wheeled vehicles (e.g., rickshaws in Southeast Asian countries) elsewhere. However, future work might investigate the regional effects of urban density and the long-term effects of immunization through vaccination on individuals’ perceptions of various transportation modes. In addition, a pseudo-panel study could better portray how different age groups might perceive and respond to different transportation modes. Since SPETT has some existing panel data, there is a prospect of conducting a longitudinal study in the future. Having said that, the paper highlighted the effect of perceptions of alternative vehicles on transit usage, along with portraying the efficacy of rapid vaccine rollout in restoring the lost demand. The findings will, in turn, assist the decision makers to prepare sufficiently for the “new normal.”
Footnotes
Acknowledgements
The authors are grateful to several colleagues and friends for their helpful comments when developing the survey.
Author Contributions
The authors confirm contribution to the paper as follows: study conception and design: S. M. Mashrur, K. N. Habib; data collection: S. M. Mashrur, K. Wang, B. Lavoie; data analysis and interpretation of results: S. M. Mashrur, K. Wang, P. Loa; draft manuscript preparation: S. M. Mashrur, K. Wang, P. Loa, B. Lavoie, K. N. Habib. All authors reviewed the results and approved the final version of the manuscript.
Declaration of Conflicting Interests
The author(s) declared no potential conflicts of interest with respect to the research, authorship, and/or publication of this article.
Funding
The author(s) disclosed receipt of the following financial support for the research, authorship, and/or publication of this article: The study was funded by the Natural Sciences and Engineering Research Council of Canada (NSERC) Discovery Fund.
Data Accessibility Statement
The survey, data from which were used in the study, was reviewed by the Office of Research Ethics at the University of Toronto. As per the stipulations in the ethics application of the survey (SPETT: Human Research Protocol Number 39409), the authors are not permitted to share the data in the interest of protecting the privacy of the respondents.