
Abstract
Pavement friction has been widely recognized as an important winter road maintenance performance indicator for objectively assessing the level of service required to maintain safe driving conditions during inclement weather events. Despite significant efforts being put forth by road agencies, prevailing road surface conditions during snowstorms can yield negative consequences that compromise the safety of the traveling public. Acknowledging the vast road network that needs to be monitored and the uncertainty associated with the randomness of hazardous road weather conditions, this paper presents a novel event-based framework aimed at investigating the magnitude of the effect of varying pavement friction levels in urban environments on traffic safety during snowstorms. Negative binomial safety performance functions developed using hourly weather datasets and road surface conditions information found a strong statistically significant relationship between pavement friction and traffic safety. This meant that, with the accumulation of snow and ice during snowstorms, road surface conditions were found to deteriorate thereby increasing the likelihood of collision occurrence. The event-based models developed also suggested that the risks of driving during snowstorms varied dramatically depending on the varying surface states, represented by friction coefficient ranges. Collisions were expected to significantly decrease whenever the pavement friction was above 0.6; under conditions where pavement friction was below 0.35, collisions were predicted to significantly increase. Additionally, arterial roads were shown to experience a significantly higher number of collisions than collectors, further justifying why arterials should be prioritized in snow clearing policies that most cities adopt.
Keywords
Pavement friction plays an important role in the design, operations, and safety of road networks. Research has consistently shown that the probability of crash occurrence increases as the skid resistance characteristics of the pavement decrease (1–3). As a consequence, most guidelines include pavement friction as a limiting factor in the geometric design of road elements, particularly in the design of horizontal and vertical curves (4–6). Moreover, to ensure that the pavement surface has appropriate skid resistance properties, the choice of aggregates and asphalt binder content in any hot mixture asphalt design is subject to stringent regulations ( 7 ).
During snowstorms, the accumulation of snow and ice on the roads greatly deteriorates pavement friction; this results in longer stopping distances that compromise the safety of drivers. Although most guidelines consider a conservative wet pavement friction coefficient as a factor of safety in designing road elements (4–6), during snowstorms, road surface conditions (RSCs) can become a lot worse than what were considered when the road elements were first designed. Consequently, many parts of the road network that were designed to be safe under wet pavement surface conditions could become unsafe under the prevailing snowstorm conditions.
In addition to that, driving during snowstorms is usually a challenging task. Visibility can drop significantly in harsh events until it is practically impossible to identify obstructions. Combining all these factors could explain why collision counts and crash risks have consistently been higher during the winter months in cities that experience inclement weather conditions (8–10). Events with heavy snowfalls have been found to be strongly associated with crash occurrence ( 11 ). These elevated levels of crash risk can be seen as a 1,091% increase in injury crash rates and a 2,113% increase in noninjury crash rates compared with the regular crash rates during nonsnowstorm events ( 12 ). For this reason, many jurisdictions have started introducing pavement friction as a quality standard or performance indicator to facilitate and monitor the performance of winter road maintenance operations and road service levels during snowstorms; this information can then be used to warn the traveling public about the adverse RSCs (13–15).
This paper examines the relationship between the pavement friction coefficient and collision counts during snowstorms using a location-specific and event-based framework. The main objectives of this study were to gain a deeper understanding of the effect of varying pavement friction levels on road safety and to establish pavement friction intervals representing different states of driving conditions (e.g., safe, fair, and dangerous) for real-world implementations. The first part of the analysis was conducted by including the pavement friction coefficient variable, G, as an independent variable that can explain collisions during snowstorms. To conduct the second part of the analysis, dummy variables of pavement friction were created at 0.05 increments. These dummy variables represented the upper and lower limits of RSCs where collisions become more and less likely to occur, respectively. The significance of these dummy variables in influencing collision counts was tested using safety performance functions (SPFs).
The SPFs created in this study could be used to estimate how traffic safety varies in different RSCs during snowstorms. Furthermore, by creating distinguished intervals of pavement friction, decision makers could use these ranges as performance indicators and evaluate the effectiveness of their winter road maintenance programs in keeping RSCs above a danger threshold value.
Literature Review
Qin et al. conducted a macroscopic study on highways in Wisconsin to understand the influence of snowstorms on traffic safety and to quantify the roles of winter road maintenance in mitigating the unfavorable RSCs left by snow on the roads ( 16 ). Using negative binomial regression models, the authors concluded that freezing rain directly affects crash occurrence. However, owing to the macroscopic nature of their study, conflicting results were obtained for the maintenance operations. Although deicing was shown to reduce crash counts, the models suggested that applying more salt on the roads was associated with higher crash counts.
Since RSCs are more likely to deteriorate during weather events, numerous countries have studied the collision risks associated with deteriorating RSCs caused by such events. Earlier studies mainly relied on rudimentary methods such as collision trends and naïve before-and-after analyses to draw conclusions rather than applying a robust statistical analysis. In Germany, it was found that as roads got wetter, the collision risk increased ( 17 ). In France, a similar study was done on skid-prone sites. The study concluded that as the friction coefficient decreased, the collision proportion rose sharply ( 17 ). In Denmark, collision rates were found to be indirectly proportional to friction coefficients ( 18 ).
Norrman et al. studied collisions that occurred on slippery roads in southern Sweden ( 19 ). By investigating trends and patterns in the data, they attempted to associate collisions with different types of slippery RSCs to identify the driving risk under such conditions. Although their study was not backed up statistically, they found that certain RSCs were linked with higher collision risks.
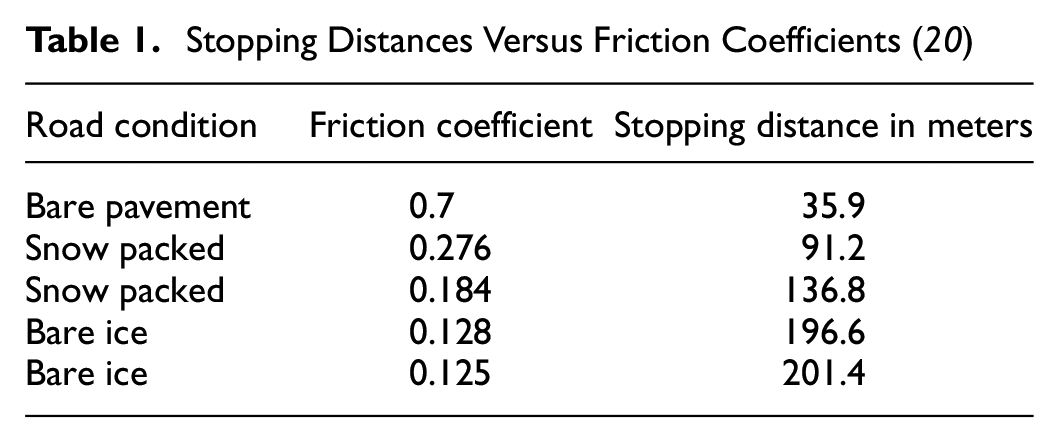
Ontario Ministry of Transportation conducted a field study to demonstrate how snowfall can lead to hazardous driving conditions ( 20 ). In this study, a vehicle with an initial velocity of 80 km/h was allowed to brake sharply to a complete stop in different environments representing different RSCs. The stopping distances were recorded and the pavement friction coefficients were measured after each attempt, as shown in Table 1. The results showed a great increase in the stopping distances as the friction coefficients decreased.
Stopping Distances Versus Friction Coefficients ( 20 )
One of the earliest attempts to understand the importance of friction and bare pavement in controlling the number of collisions was undertaken by Preus in the early 1970s ( 21 ). The author attempted to analyze the safety benefits of using studded tires on winter streets as a means to increase vehicles’ traction on slippery surfaces. Relying only on statistical comparisons, the study was unsuccessful in obtaining a clear idea of the effects of this tire alteration because it was difficult to isolate the effects of a single factor, owing to the lack of sufficient data at the time.
Since then, with the advancements in data collection technologies, numerous studies have been conducted to make better use of these datasets by employing different statistical techniques. Depending on the nature of the datasets, the level of aggregation, and the type of dependent variable that needed to be modeled, researchers have used various statistical models to adapt to the data. In a review of the most popular statistical analysis methods used in traffic safety, Lord and Mannering reported that the Negative Binomial, Negative Multinomial random-parameters bivariate, and zero-inflated Poisson and Negative Binomial models are the most widely used distributions in collision modeling ( 22 ). This is largely because these models can account for most of the confounding factors and inherent problems associated with collision data.
In recent years, researchers have tried incorporating Tobit regression in modeling collision rates. Anastasopoulos et al. conducted an aggregate collision modeling study on five interstate highways in Indiana ( 23 ). Using 5 years of aggregated collision data, the authors included variables describing the pavement condition by dividing the highways into 337 homogeneous segments. The results of their analysis showed the significant positive effect of having better pavement friction in reducing collision rates. Chen et al. conducted a similar study but used a disaggregated dataset on a select portion of highway I-25 in the state of Colorado ( 24 ). With the help of refined data collection methods, they were able to formulate a random-effects Tobit collision rate prediction model using real-time traffic and weather data. The random-effects Tobit model accounted for the unobserved heterogeneity across observations and space- and time-varying variables like hourly traffic volume, wet surface conditions, and visibility. It should be noted that even though the two studies ( 23 , 24 ) used different levels of aggregation, they both concluded that RSC was a significant factor in influencing collision rates.
Usman et al. extensively studied the effects of RSCs and weather-related variables on road safety (25, 26). In their papers, the authors converted the RSCs, as recorded by maintenance personnel, from a categorical description to a linear continuous indicator that ranged from 0 to 1, where 1 represented the best RSCs. Using the created continuous variable—named road surface index or RSI—and by employing various statistical techniques in their studies (e.g., Negative Binomial, Generalized Negative binomial, Zero-inflated Negative Binomial, and Poisson Lognormal crash prediction models), Usman et al. examined the relationship between RSI with collision counts during snowstorms on rural highways in Ontario. The results of their analysis showed the significant role of RSCs in determining traffic safety.
Although previous studies have contributed to developing and advancing methods to help understand the effects of winter weather variables on traffic safety, the extent to which RSCs would affect different levels of traffic safety during snowstorms has not been thoroughly investigated. This study built on the findings of past research and addressed the gaps in the literature by employing an event-based and location-specific framework that is capable of isolating the weather conditions and RSCs during individual snowstorms and magnifying their effects on urban road safety at a high level of granularity. In addition, municipality-wide winter road maintenance performance indicators were suggested by comparing the collision risks during the different levels of pavement friction.
Data Description
Edmonton, the capital of Alberta, was chosen to be the area of study. Edmonton is a large urban city that is characterized by its harsh weather conditions during the winter months. Temperatures are expected to drop below −15°C for extended periods and the average January snowfall is 24.5 cm ( 27 ). These weather conditions made Edmonton the perfect study area for this research.
Multiple datasets were used in this analysis so that the exact weather, RSCs, and collision counts during individual snowstorms could be identified. Twenty-one urban roads within the city were monitored during the period from 2017 to 2019 for this study. Of the 21 roads, 13 were arterials and 8 were collectors, which were spread across the city as shown in Figure 1. Dataset sources are described and explanations of how the data were filtered and fused together are given in the following sections.
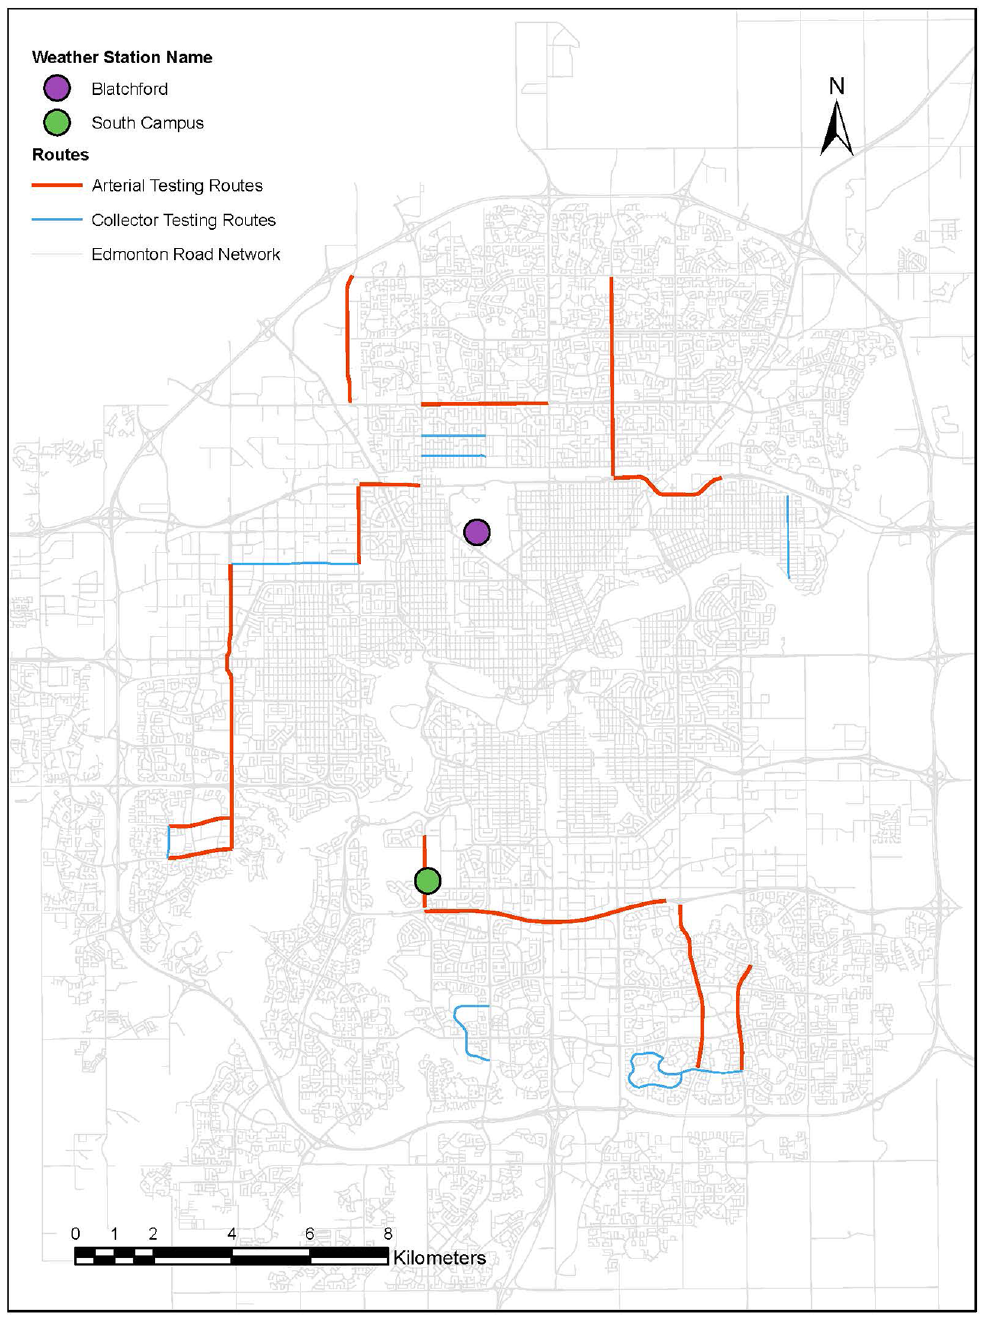
Weather station locations and friction testing routes.
Weather Data
Weather data were key components in this study. They were used to define the start times and durations of the snowstorm events of interest, and to evaluate the average weather conditions during these events. These data were obtained through the province of Alberta website ( 28 ). On the website, information about the equivalent precipitation, the maximum and minimum air temperatures, humidity, wind speeds, and directions was recorded and stored hourly by the two weather stations within the city Blatchford and South Campus. Hourly weather data were downloaded for the years 2017 to 2019 from both weather stations and prepared for further analysis.
Pavement Friction
To monitor the status of the RSCs on the streets of Edmonton and to help decide the best winter road maintenance strategy, the city conducts random friction testing runs during or after snowstorms. During these runs, the city uses the Vericom VC4000 Brake Meter to calculate the friction coefficient on the roads. Using Equation 1, this device automatically calculates the friction coefficient by recording the testing vehicle’s initial speed and the distance it takes to come to a complete stop once it has started braking.

where
d = stopping distance,
μ = unknown coefficient of friction,
v = velocity at the time of braking, and
g = gravitational acceleration constant.
Friction coefficient is a linear continuous objective measure used to describe RSCs. Instead of using subjective categorical descriptions of RSCs, such as bare, wet, and snow-covered, friction coefficients describe RSCs by calculating the resistive forces to relative motion between the vehicle’s tires and the road surface (29, 30). This measurement intuitively describes RSCs by giving values that range from 0G to over 1G. Whenever the friction coefficient on the road approaches 0G, this means that the road surface is covered in snow or ice, which makes it very slippery. On the other side of the spectrum, if the friction coefficient exceeds 0.8G, it means that the road surface is bare and dry, and that there is very strong traction between the pavement surface and the vehicle’s tires.
Events Definition
To be able to isolate the weather and RSCs during snowstorms, events of interest had to be defined and examined. As per the literature ( 31 ), and using the hourly weather data prepared previously, snowstorm events were defined for this analysis as follows:
Snowstorm events start if the precipitation value during an hour is more than 0, and the average temperature during the same hour is equal to or less than 5°C, and
Snowstorm events continue until the precipitation has stopped for three consecutive hours.
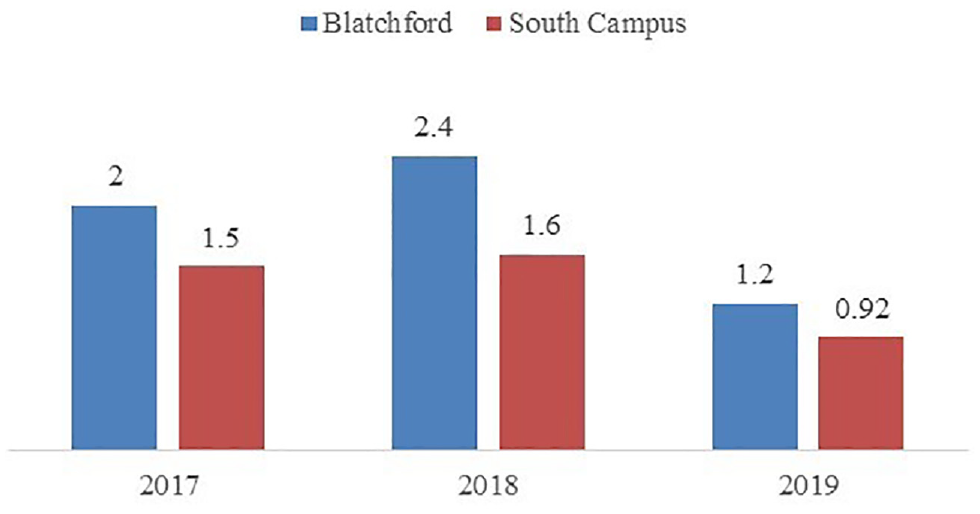
To run through the hundreds of thousands worth of hourly weather records, a MATLAB ( 32 ) code was developed to process the data and create the snowstorm events based on the two aforementioned conditions for each weather station separately. The created datasets included information about the start date and time of each event, the duration of the event, average temperature, average dew temperature, total equivalent precipitation in millimeters, average humidity, average wind speed, and average wind direction during each snowstorm event. Figures 2 to 4 illustrate the frequencies and severities of snowstorms according to each weather station during the study period.
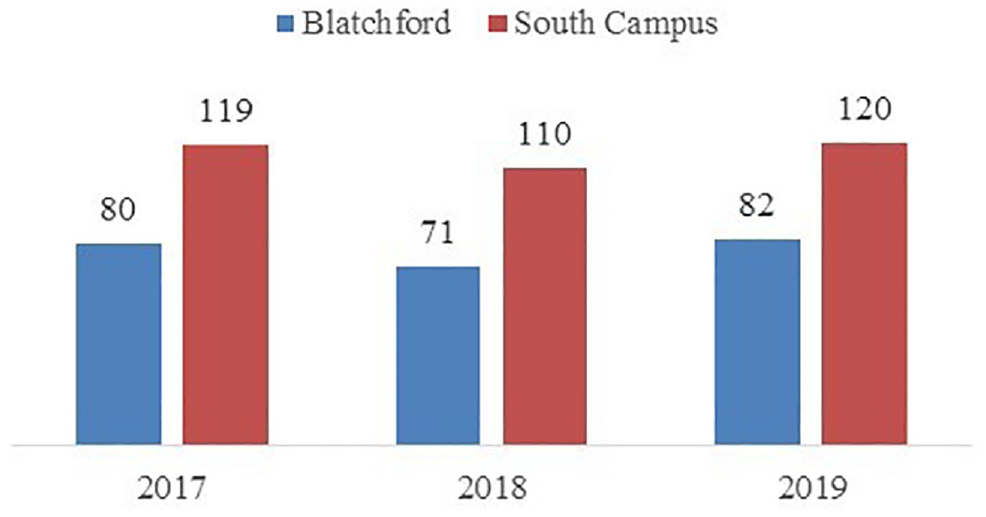
Number of snowstorm events each year according to the two weather stations.
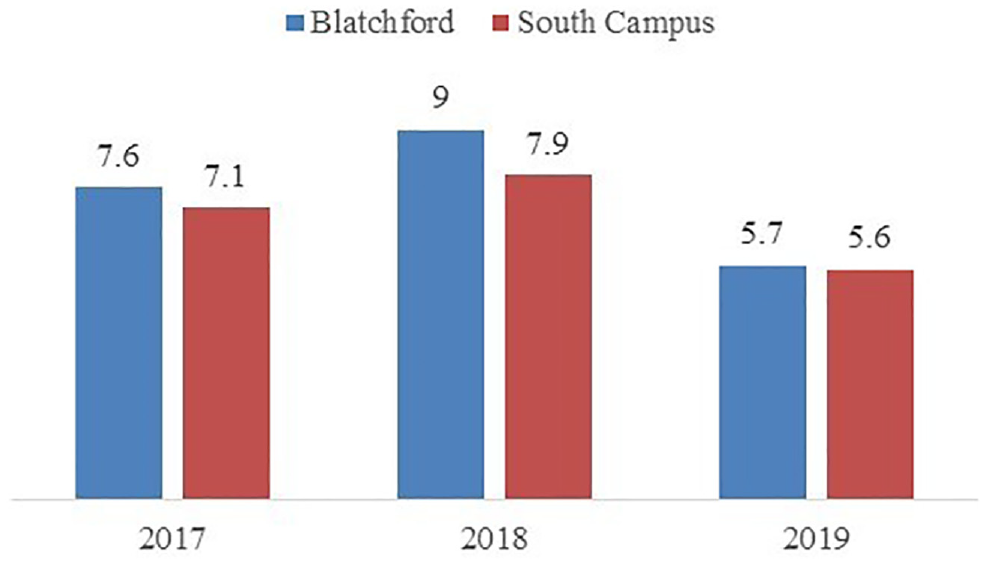
Average snowstorm duration in hours according to the two weather stations.
Average total equivalent precipitation during snowstorms in millimeters according to the two weather stations.
Traffic Volumes and Collision Data
Traffic exposure was accounted for in this study using the annual average daily traffic (AADT) counts and the million vehicle kilometer (MVK) measures. Even though a more granular measure of traffic volumes such as hourly traffic would have been more appropriate, this was never recorded, which was a limitation for this study. However, AADT records used in this research provided enough variability in the traffic volumes between the study routes and was therefore used to describe the general driving trends on them. MVK was calculated as per Equation 2.

Edmonton police service collect and store information about all collisions that occur on the streets with an outcome property damage that exceeds $2,000 or involve injuries or fatalities. The information recorded includes the date and time of the collision, its type and severity, and its location. Collisions were filtered using Esri’s ArcGIS ( 33 ) to retain collisions that only occurred on any of the 21 study routes. The resulting dataset included a total of 3,853 collisions that occurred throughout the study period. The breakdown of the annual collisions per road type is shown in Figure 5. Both the traffic and collision datasets were provided by the City of Edmonton.
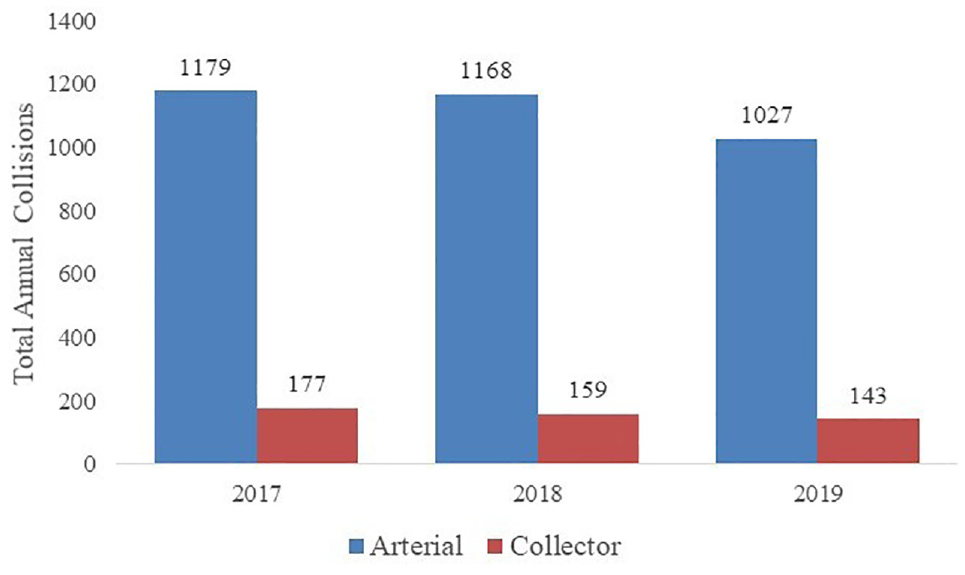
Total annual number of collisions per route type.
Data Fusion
The pavement friction and collision datasets were fused with the two snowstorms datasets using the date and time, and location information incorporated in the data. First, each study route was assigned to the closest weather station and therefore inherited all the snowstorms information that was created at that station. Second, collision and pavement friction coefficient data were added to each route’s snowstorm dataset once the times and dates of these records matched with the start time and duration of a snowstorm in the datasets. Third, the variables BI, I, and T15 were created and added to the analysis. BI stands for black ice; it is a dummy variable that takes the value of 1 whenever the average dew temperature is within 2°C of the air temperature. I stands for the precipitation intensity, which is calculated as the total precipitation during an event divided by its total duration. T15 is a dummy variable used to describe extremely cold snowstorms by taking the value of 1 whenever the average air temperature drops below −15°C. Snowstorm events with missing pavement friction records were filtered out of the final dataset.
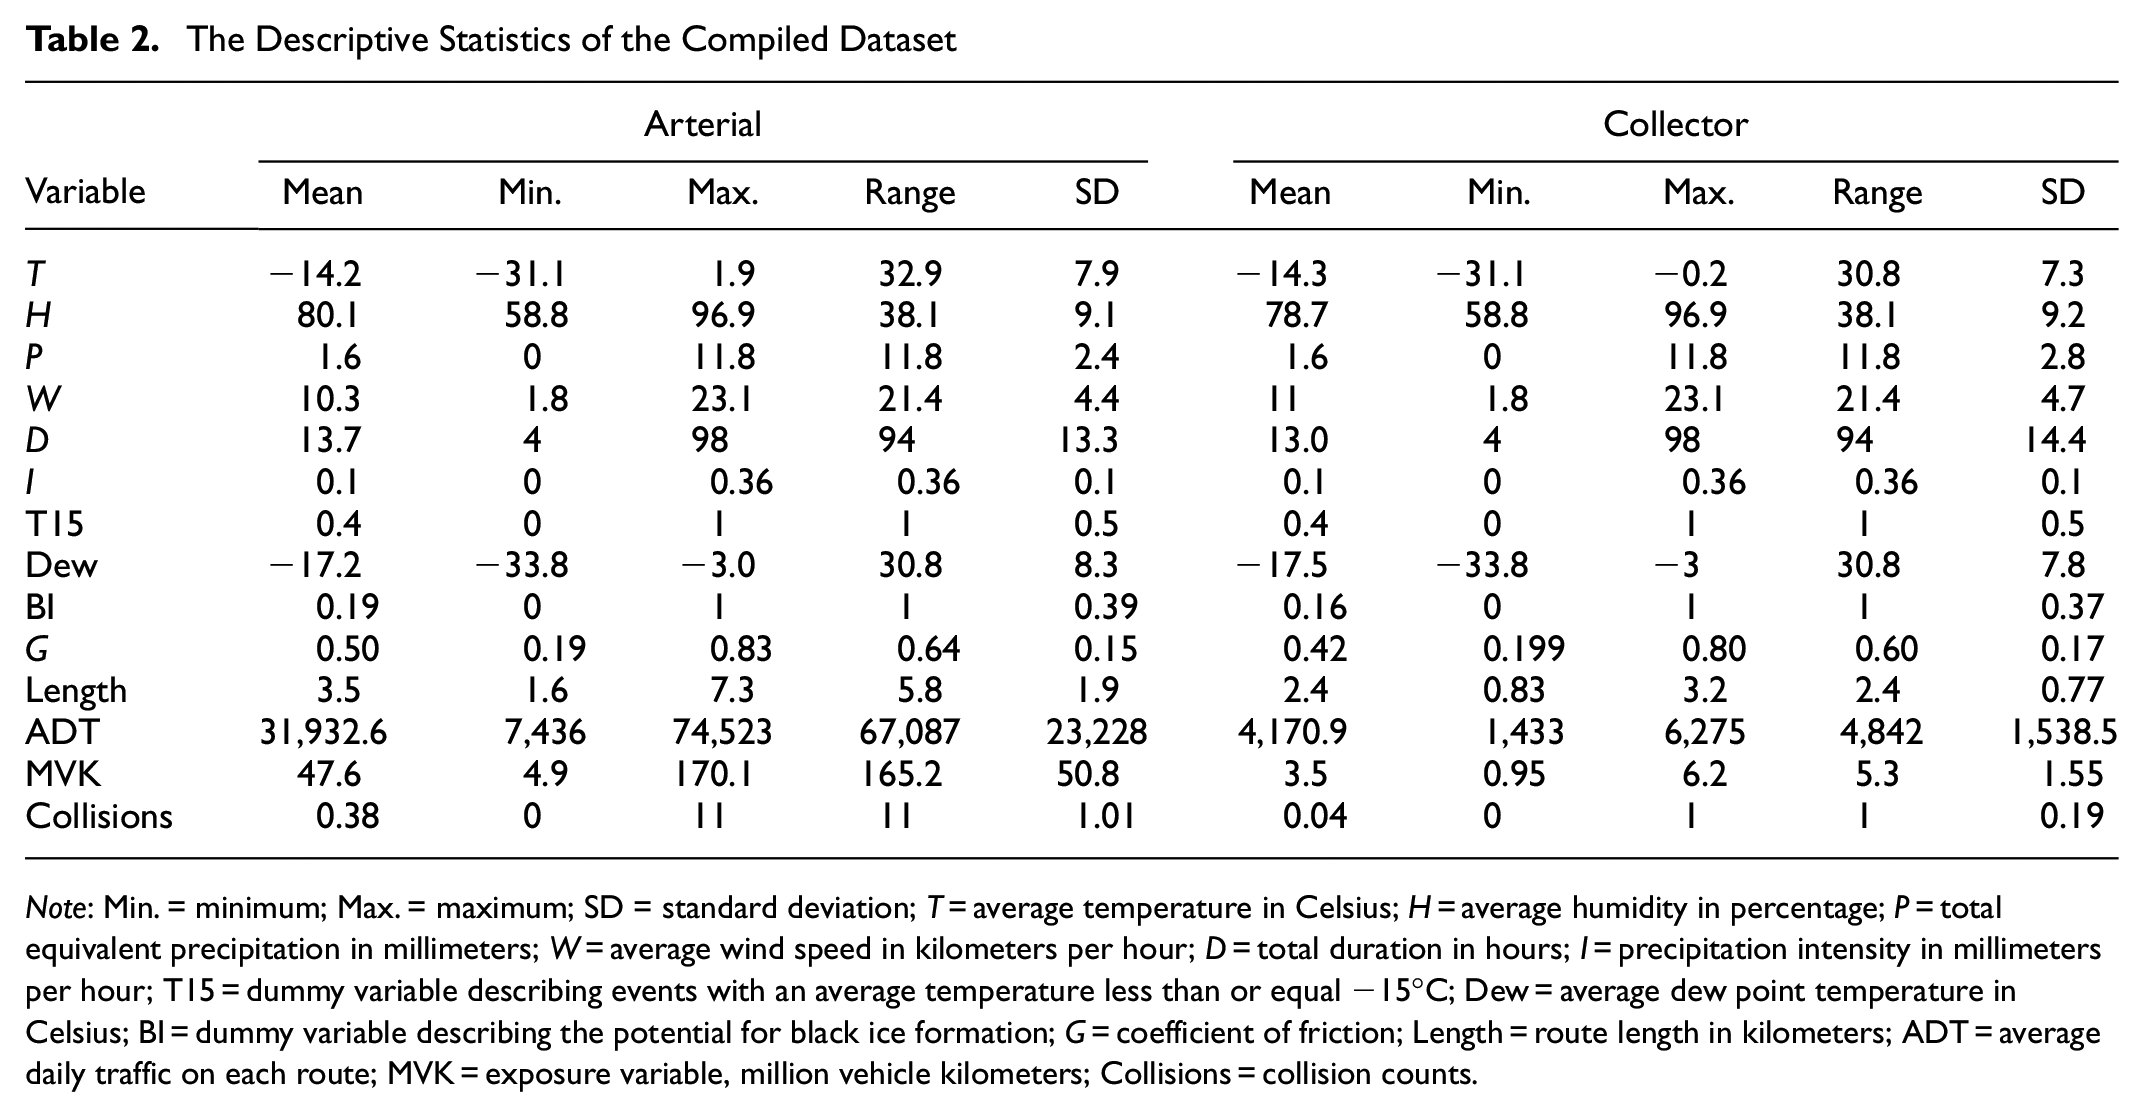
Figure 6 outlines the procedure followed to create the dataset used in the analysis, while the descriptive statistics of this resulting dataset are summarized in Table 2.
The Descriptive Statistics of the Compiled Dataset
Note
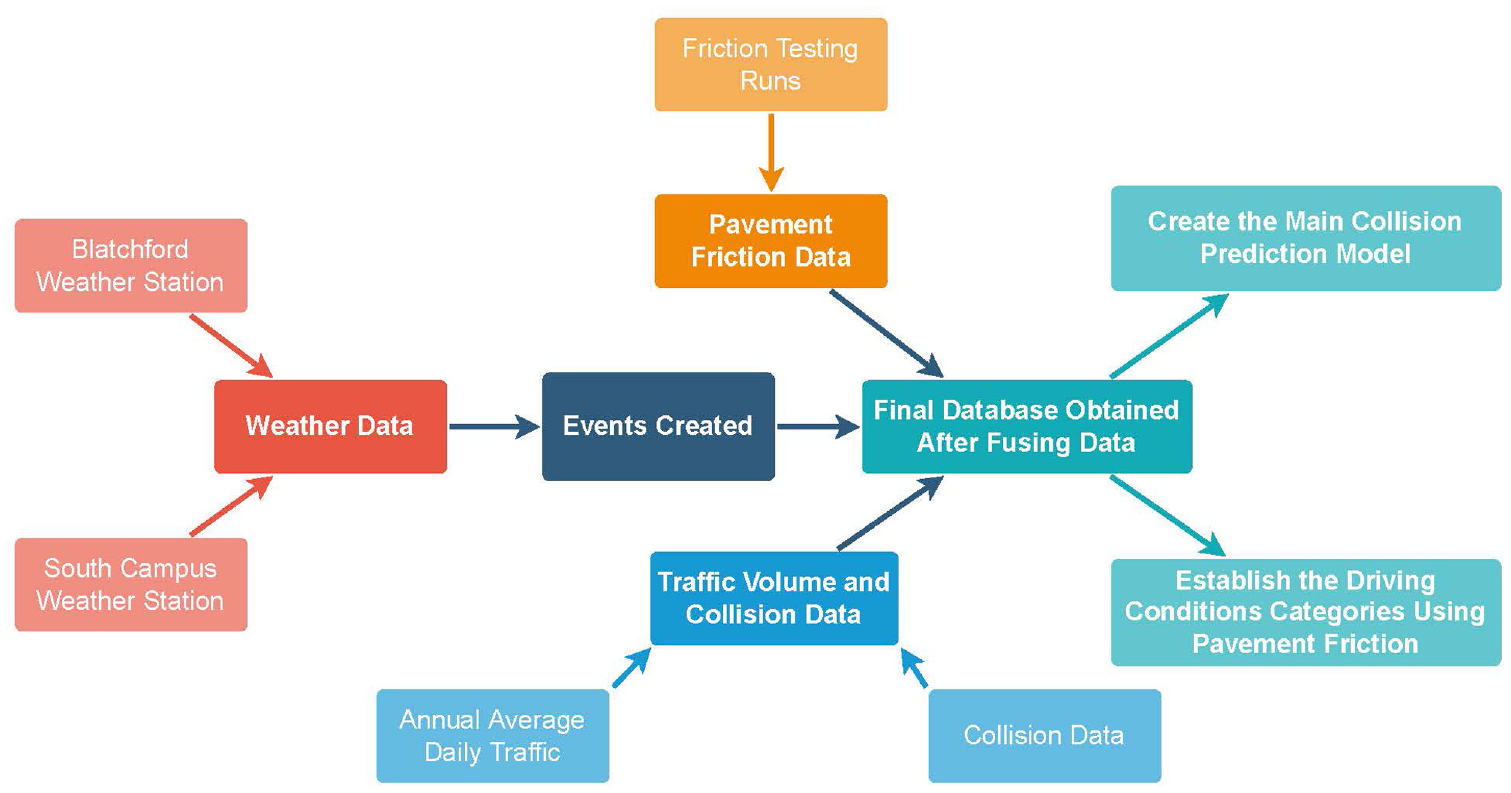
Workflow summary.
Methodology
To derive the Negative Binomial SPFs, the observed number of collisions per snowstorm, Yn, was assumed to follow a Poisson distribution with parameter


The mean number of collisions per snowstorm,


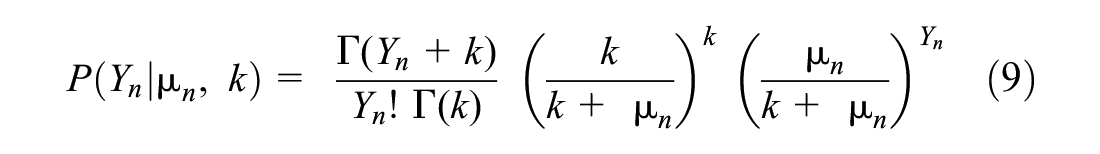
The resulting product of the two probability functions is a Negative Binomial distribution with the probability distribution function shown in Equation 9; expected value and variance are described in Equations 10 and 11, respectively.


The dependent variable under study μ i , which is the predicted number of collisions per snowstorm, was assumed to be a function of the independent variables that take the form shown in Equation 12.

where
β0 is the intercept,
Xi is a vector of predictor variables,
βi is a vector of regression coefficients, and
ε is an error term, which is a random variable that is assumed to follow a Negative Binomial distribution.
The error term, ε, accounted for the randomness that is associated with collision occurrence. The exposure and snowstorm duration terms were left outside of the exponential function because if either was equal to zero, we would not expect any collisions to occur.
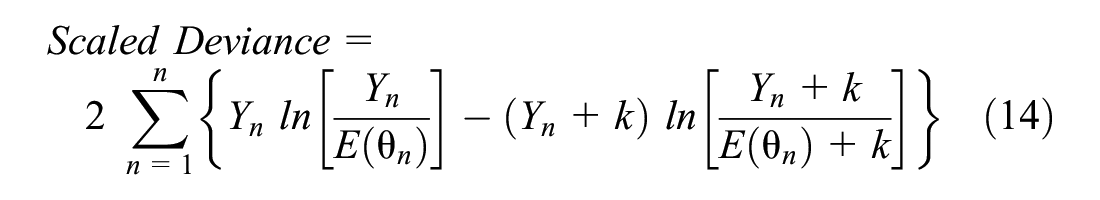
The models’ regression coefficients were calibrated using the maximum likelihood estimation method, whereas the overall goodness of fit of the models were judged by comparing Pearson’s chi-squared (χ 2 ) and the scaled devianceto the chi-square of α = 0.05; χ 2 .05. Pearson’s χ 2 and the scaled deviance were calculated for each created model using Equations 13 and 14, respectively. SAS statistical software was used for model calibration and processing ( 34 ).

All variables included in the final models were ensured to meet a minimum preset statistical significance level of 0.05 was ensured. T-tests were conducted for all the independent variables used in the models, and variables with p-values of more than 0.05 were dropped. A forward stepwise variable selection was utilized to ensure that pavement friction was among the variables that remained in the final models, while any other variable that might be correlated was removed.
Results and Discussion
First, the relationship between pavement friction and road safety was hypothesized and tested. This was done by investigating the impacts and significance of the friction coefficient values on collision counts during snowstorms. The model shown in Table 3 and presented in Equation 15 was created.
Results of the First Collision Count Model
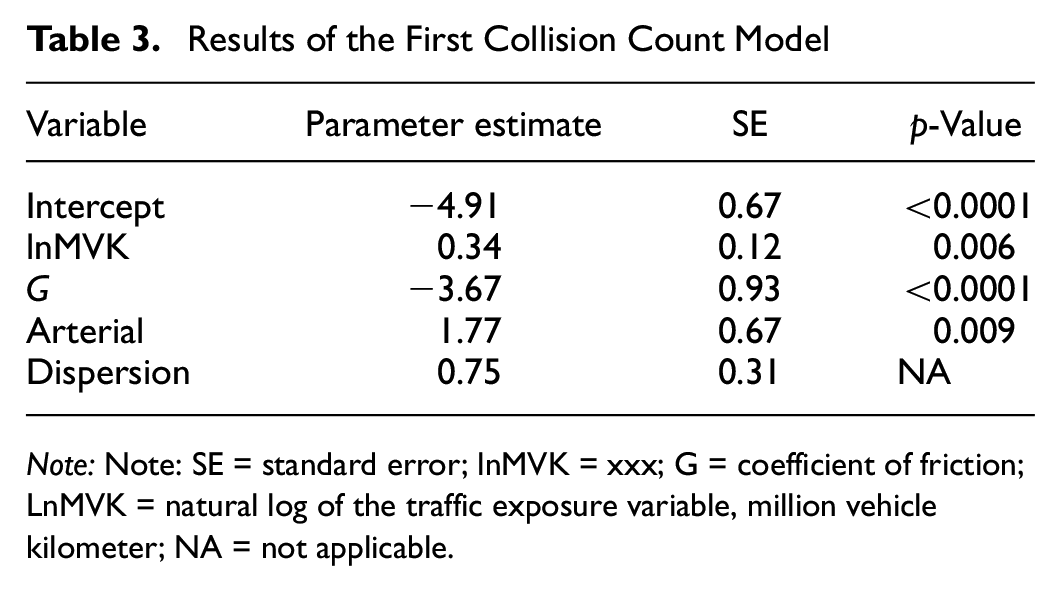
Note: Note: SE = standard error; lnMVK = xxx; G = coefficient of friction; LnMVK = natural log of the traffic exposure variable, million vehicle kilometer; NA = not applicable.
As shown in Table 3, all the variables were statistically significant at the 99% confidence level. Additionally, the shape parameter (inverse of the dispersion parameter) estimate was 1.325; meaning that the variance was larger than the mean by a factor of
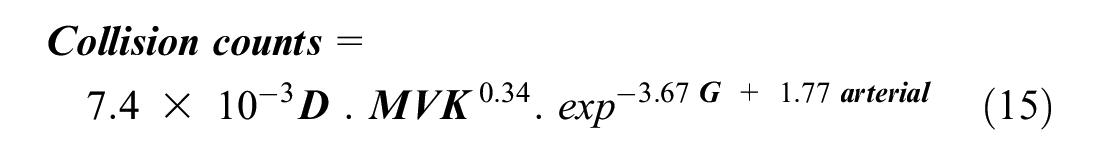
The model suggests that collisions during snowstorms increased as the exposure variable, lnMVK, increased. This is intuitive and in line with previous studies (25, 26, 35), because when there is more traffic on the roads, there are more chances for collisions to occur. Moreover, the pavement friction coefficient was found to be as significant a factor in predicting collision counts during snowstorms as under ordinary conditions (1–3). However, as pavement friction deteriorates significantly more rapidly during snowstorms, its effect in this analysis was much more pronounced. Previous studies have reported similar results when modeling collisions using other RSC indicators (25, 26). Finally, arterial roads were witness to more collisions than collector roads. This could be because of the higher traffic volumes of these roads, their higher posted speed limits, and the difference in drivers behavior while traveling on them. Interestingly, none of the weather variables considered in this study could be included in the model as they were not statistically significant; because they were closely correlated to the friction coefficient variable. This showed that, generally, weather variables do not influence collision occurrence directly; rather, their influence is seen mainly on the RSCs, which in turn affect traffic safety, as has been concluded in similar studies ( 36 ).
Once pavement friction had been found to have a significant impact on road safety, further analysis to establish pavement friction thresholds—according to which roads are significantly safer or less safe—was pursued. The upper bound of pavement friction that signified unsafe driving conditions was established by creating SPFs using dummy variables that took the value of 1 whenever the friction coefficient was below a certain threshold. Unsafe driving conditions were defined in this context as the pavement friction coefficient value when a significant increase in collisions was predicted. Friction coefficient increments of 0.05 were used until the upper bound was reached. Similarly, the lower bound of pavement friction that signified safe driving conditions or a significant reduction in collisions was evaluated. The results of the models created are shown in Table 4.
Results of the Analysis of the Pavement Friction Threshold Models
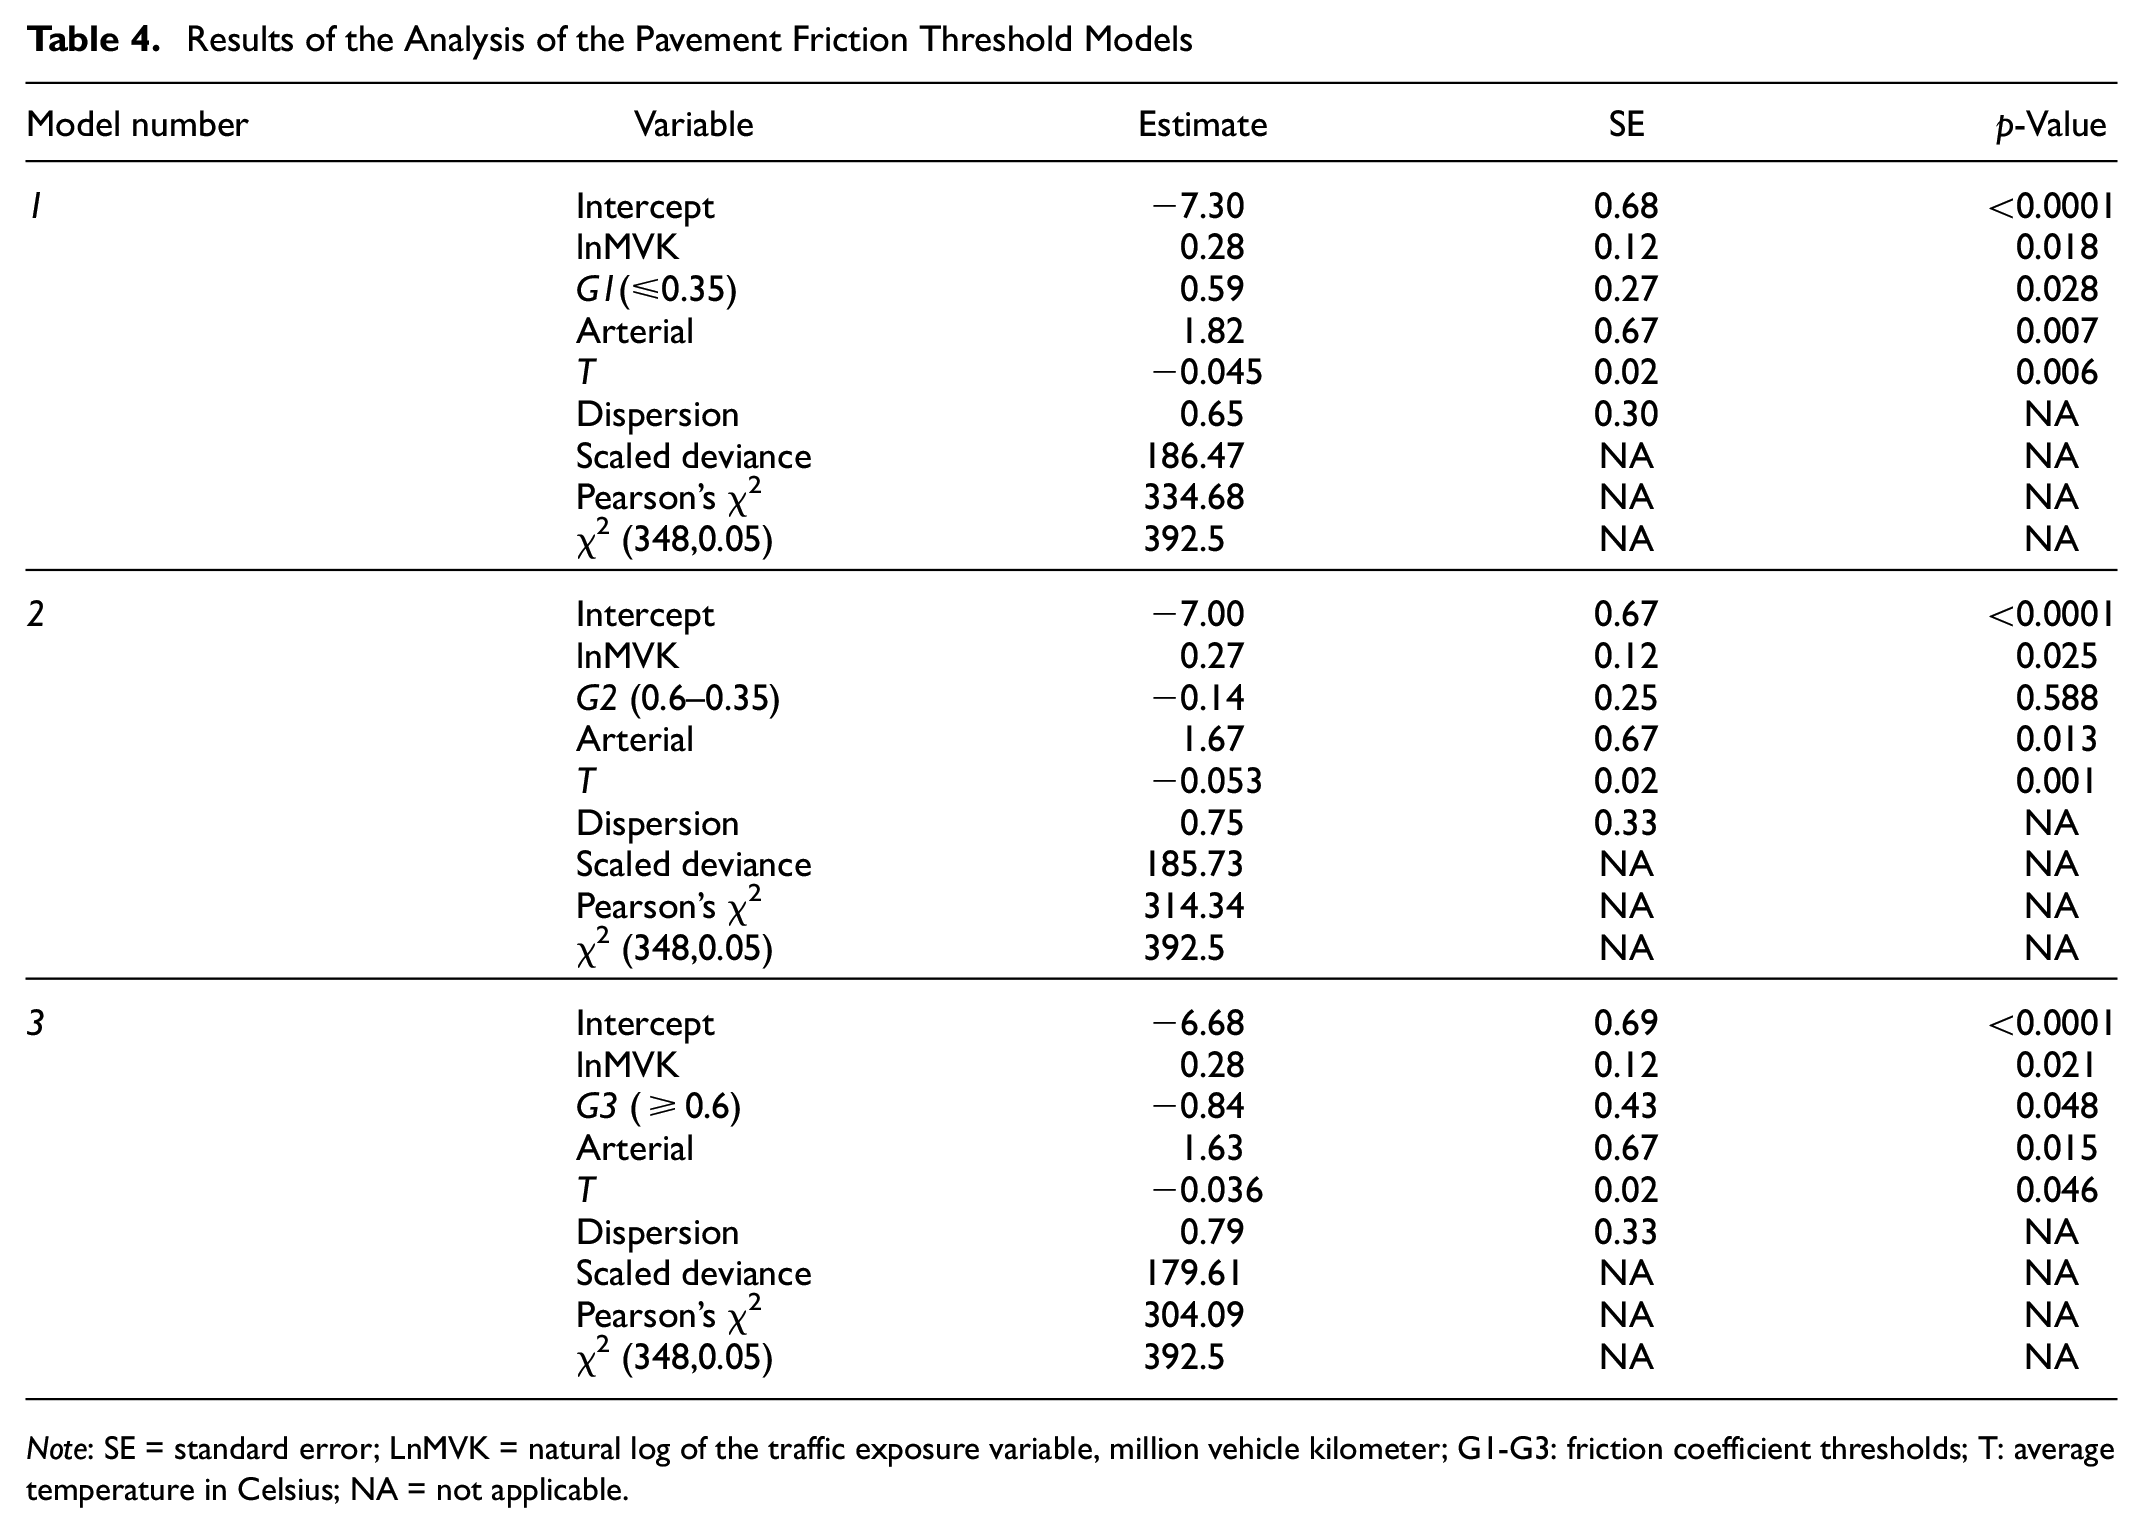
Note: SE = standard error; LnMVK = natural log of the traffic exposure variable, million vehicle kilometer; G1-G3: friction coefficient thresholds; T: average temperature in Celsius; NA = not applicable.
By examining the results of the models, several findings can be deduced. Firstly, the goodness of fit of all three models included in this analysis were significant at the 95% confidence level. Secondly, the overdispersion assumption was confirmed in all the models, as the dispersion parameters were all close to 1. Thirdly, the models showed three distinct ranges of pavement friction coefficients for urban road safety. The first range was when the friction coefficient was equal to or less than 0.35. In these conditions, the results showed that there was a significant increase in collisions. This means that the pavement friction coefficient value of 0.35 signifies the start of dangerous driving conditions and that collisions are expected to increase exponentially at lower friction coefficients. The second range was when the friction coefficient was between 0.35 and 0.6. At this interval, driving conditions were relatively safer; however, no significant reduction in collisions was predicted. The third range was when the friction coefficient was equal to or more than 0.6. In these conditions there was a significant decrease in the number of collisions as per the model. Similar to the first range, this collision reduction trend continued at pavement friction values higher than 0.6.
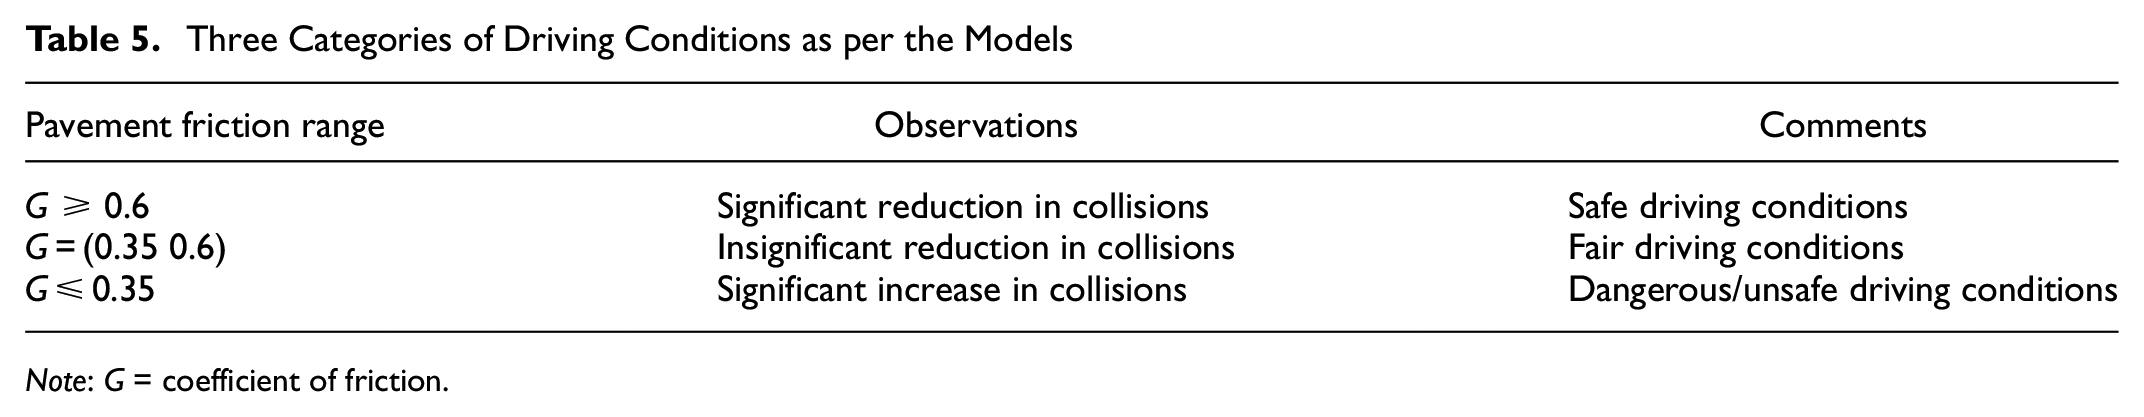
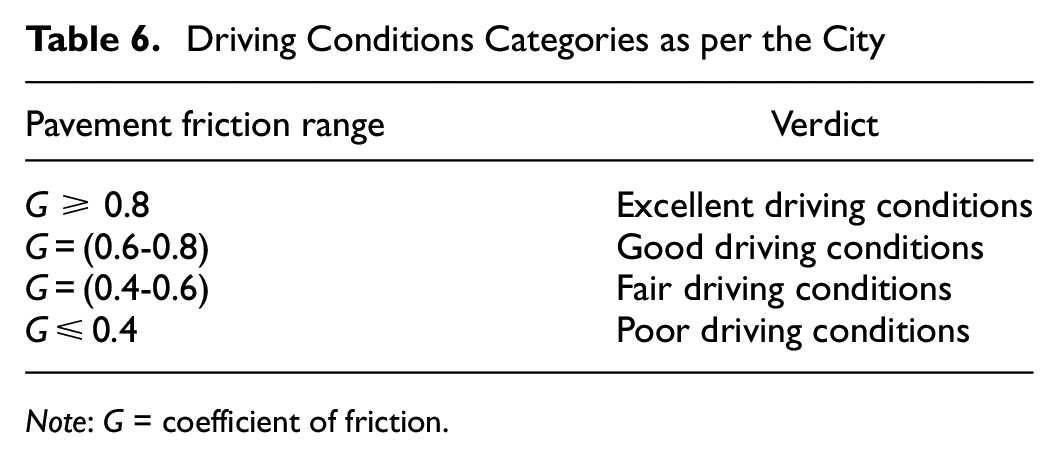
These results indicated that collisions are not only expected to increase whenever pavement friction on the roads decreases, but also that there are specific ranges of pavement friction within which driving conditions can be considered safe or dangerous. Using the friction ranges established in the three models, driving conditions can be categorized into three distinct categories, as shown in Table 5. Interestingly, the driving categories were found to be in line with the standard driving conditions categories that City of Edmonton had previously set based solely on experience (Table 6). However, the new thresholds of the categories established in this analysis have the advantage of being backed by empirical data and statistical methodology in addition to field experience.
Three Categories of Driving Conditions as per the Models
Note
Driving Conditions Categories as per the City
Note
Case Study With a Hypothetical Snowstorm Event
The calibrated models could be used to estimate safety outcomes on urban arterial and collector roads during a hypothetical snowstorm under varying RSCs. Consider a moderate to severe snowstorm event with a duration of 21 h is expected to hit a highway in Edmonton with an average exposure of 37.19 MVK. The relationship between the number of predicted collisions during the hypothetical snowstorm and the expected value of the pavement friction coefficient after using various winter road maintenance operations on the two road types could be plotted as shown in Figure 7.
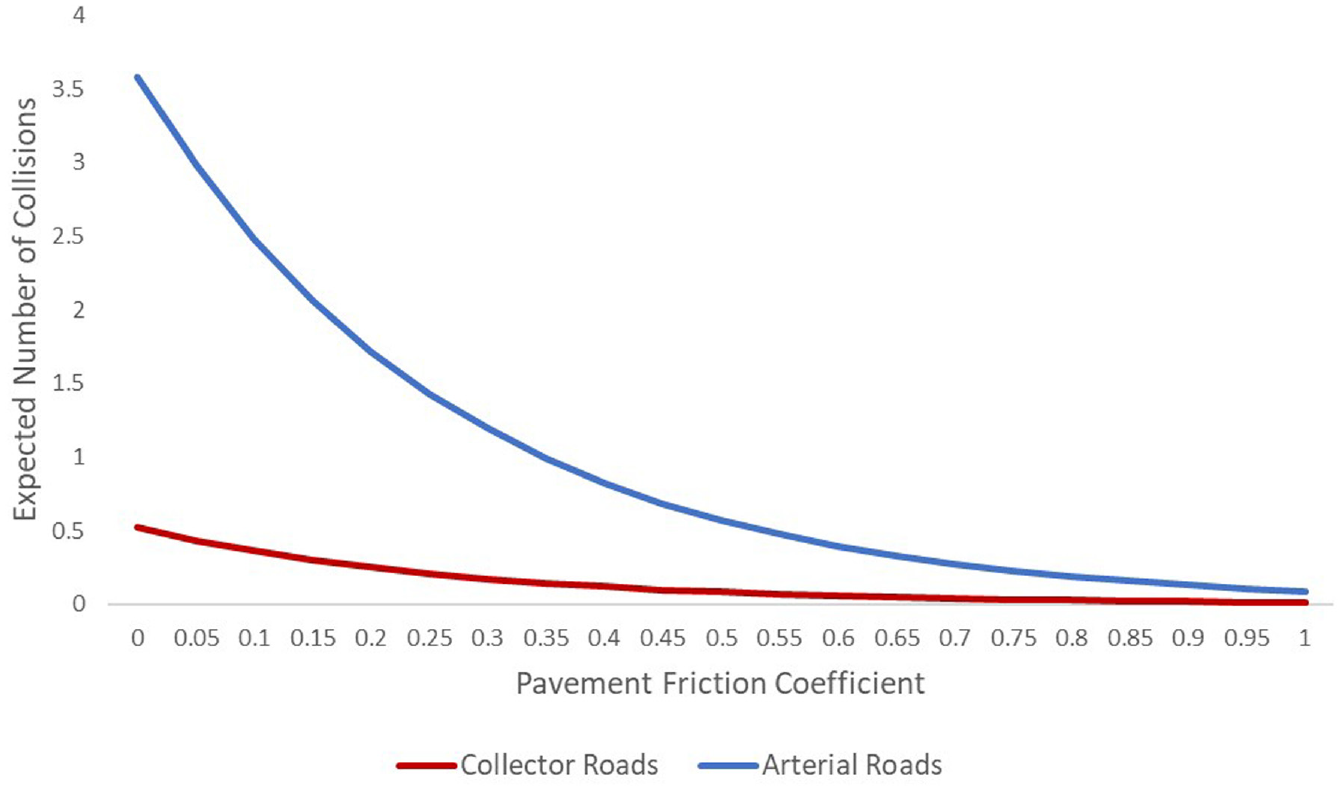
The expected number of collisions during a 21-h long snowstorm.
The graph highlights the significance of the pavement friction coefficient in determining the safety outcome of snowstorms. As can be seen, the expected number of collisions during the hypothetical snowstorm increases exponentially as the pavement friction coefficient decreases, which means that whenever the RSC deteriorates, road safety is dramatically compromised. However, relatively safer driving conditions can be restored swiftly once the winter road maintenance operations start and bare pavement is achieved.
This can be shown numerically on the graph. On arterial roads, the expected number of collisions drops from 1.50 collisions per snowstorm per road at G = 0.20, to 0.49 collisions per snowstorm per road at G = 0.50. On collector roads, the expected number of collisions drops from 0.27 collisions per snowstorm per road at G = 0.20, to 0.08 collisions per snowstorm per road at G = 0.50.
Moreover, the inherent differences in road safety between arterial and collector roads are emphasized in Figure 7. Even after fixing the exposure on the two types of roads, the arterial road was shown to experience significantly more collisions than the collector road. At a similar average pavement friction coefficient, G = 0.2, the expected number of collisions on the arterial road was 1.47 collisions per snowstorm, whereas on a similar collector road, 0.25 collisions per snowstorm were expected. This finding could justify, on a scientific basis, why arterials should take precedence over collector roads in receiving maintenance operations as per the transportation network priority hierarchy adopted by most cities (37, 38).
Conclusions
In this paper, the impacts of deteriorating pavement friction during snowstorms on traffic safety are presented using Negative Binomial SPFs. The study took advantage of hourly weather information recorded by two weather stations and pavement friction records collected by the maintenance personnel in Edmonton during the years 2017 to 2019 to compile a disaggregated dataset of snowstorm events. The created dataset was then used to investigate the relationship between RSCs and traffic safety and to establish pavement friction intervals within which driving conditions varied significantly.
The preliminary model showed a strong, statistically significant relationship between pavement friction and collision counts. Further, it was shown that the risks of driving during snowstorms varied dramatically depending on the value of the friction coefficients on the roads. The results of this investigation also highlighted three ranges of pavement friction coefficients: pavement friction above 0.6, which led to a significant reduction in collisions; pavement friction between 0.6 and 0.35, which had an insignificant reduction in collisions; and pavement friction below 0.35, which resulted in a significant increase in collisions.
Additionally, arterial roads were found to experience more collisions than collector roads. This could possibly be attributed to the profoundly varying road characteristics of arterials, such as their higher traffic volumes, higher speed limits, and the difference in drivers’ behavior while traveling on them; however, more research would be needed on that subject before any conclusions are confirmed. Nevertheless, this finding empirically supports the transportation network prioritization hierarchy adopted by most cities, in which arterial roads are maintained more rapidly and frequently than collectors. The models created in this study could be used to predict and assess the safety of arterial and collector roads during snowstorms under different RSCs.
The work presented in this paper illustrates the importance of collecting pavement friction coefficients during and after snowstorms, which could be used to significantly help transportation agencies in their snow and ice control strategies; examples of how the study’s results and pavement friction coefficients could be effectively used by the transportation agencies are discussed in the following paragraph.
By adopting a minimum pavement friction value of 0.35 as the threshold for safe driving, more efficient decision making could be followed. If a severe snowstorm event is forecasted, and the friction coefficient on the roads is predicted to drop below this value, dangerous driving conditions messages could be broadcast to drivers, and aggressive proactive winter maintenance measures could be taken to mitigate the effects of such a snowstorm. These measures could include the use of anti-icing chemicals before the snowstorm, increasing the frequency of deicing operations, or requesting additional plowing resources depending on the snowstorm severity forecasted. The efficiency of all these measures has already been shown to improve pavement friction on the roads ( 36 ). Furthermore, the cutoff values for each level of service category of driving conditions could be used as performance indicators by the winter road maintenance operators. By calculating the average times in which the road network remained at each category of the defined levels of service, the performance and effectiveness of the program could be evaluated and compared with previous years or even other jurisdictions.
Building on the results of this study, future work could include additional variables that affect traffic safety during inclement weather conditions. For example, it would be interesting to explore how spatial and temporal factors interact with pavement friction during snowstorms to influence collision risk. Advanced traffic monitoring systems such as high-definition video cameras or LiDAR sensors that can detect and identify traffic might be considered for future studies. These technologies can automatically record and store important information such as hourly traffic volumes and the composition of traffic, which could potentially improve the accuracy of the results.
Footnotes
Acknowledgements
The authors thank the City of Edmonton for providing some of the data used in this study, and Natural Sciences and Engineering Research Council of Canada (NSERC) Alliance for their support.
Author Contributions
The authors confirm contribution to the paper as follows: study conception and design: K. El-Basyouny, T. J. Kwon, A. Abohassan; data collection: A. Abohassan; analysis and interpretation of results: A. Abohassan, K. El-Basyouny, T. J. Kwon; draft manuscript preparation: A. Abohassan, K. El-Basyouny, T. J. Kwon. All authors reviewed the results and approved the final version of the manuscript.
Declaration of Conflicting Interests
The authors declared no potential conflicts of interest with respect to the research, authorship, and/or publication of this article.
Funding
The authors disclosed receipt of the following financial support for the research, authorship, and/or publication of this article: This study was supported by NSERC Alliance program.
The contents of this paper reflect the views of the authors, who are responsible for the facts and the accuracy of the data presented here. The contents do not necessarily reflect the official views or policies of the City of Edmonton.