
Abstract
Regional pavement management agencies often suffer from inadequate resources and technical people to carry out maintenance tasks efficiently. Though funding shortage is an issue for most agencies, regional agencies confront it primarily for various reasons such as the class of the roads managed by them, traffic intensity, the size of service population, and the jurisdiction. Regional agencies generally manage lower functional classes of roads that usually carry smaller traffic. Though low-volume roads (LVRs) take just 20% of the traffic, LVRs include approximately 80% of transportation system mileage. With only 20% of the traffic volume and 80% mileage in transportation, LVRs can barely compete with the return on investment of highways. As a result, regional road networks are always subject to less attention from policymakers. In this context, this research proposes a pavement management framework for the regional agencies which is economical, requires minimum technical expertise, and is easy to implement. This study includes two surveys: The Canada-wide Pavement Management Survey and the Road Users Feedback Survey. The Canada-wide Pavement Management Survey provides an overview of pavement management practices in Canada at the regional level. The concept of Pavement Management System (PMS) score is also developed utilizing the same survey responses. Findings from the Road Users Feedback Survey have been used to understand the feasibility of using road users’ feedbacks in making management decisions. Overall results from these two surveys have been utilized to develop various components of the proposed PMS framework.
Keywords
A Pavement Management System (PMS) can be defined as a combination of referencing, collecting, analyzing, and reporting pavement-related data to help the authorities decide ideal strategies for maintaining pavements in a usable condition over a defined period ( 1 ). An appropriate PMS can save agencies a significant amount of money. It is important to know when maintenance operations must be carried out. Failure to understand maintenance needs at a proper time often causes deferral of the project, and a deferred project generally costs more because of inflation ( 2 ). Renovating a road at the 87th percentile of its service life can cost five times more than renovating a road at the 75th percentile of service life ( 3 ).
It has been reported that with fewer road users, less funding is available for road maintenance, and fewer engineering techniques are applied ( 4 ). As regional agencies primarily manage low-volume roads (LVRs), they are the ones who face this issue the most. Many regional agencies in Canada work under pavement management users’ groups or road management users’ groups to economically and efficiently manage their roadways. However, this concept depends on several factors such as jurisdiction, governing bodies, funding, location, and current roadway asset conditions ( 5 ).
A country-wide pavement management survey was conducted to understand contemporary pavement management practices in Canada at the regional level. The survey yielded a significant amount of data that helped get an overview of the pavement management practices in Canada. These findings were then utilized to develop a PMS score, a new concept to determine an agency’s capability from the management perspective. Also, findings were utilized to determine necessary components of a PMS for the regional agencies with significant budget and resource drawbacks.
The road users’ feedback survey was conducted on the municipality residents of Newfoundland and Labrador to develop a pavement performance model that can help in management decision-making.
Objective
The overall goal of this study is to develop a pavement management framework, especially for the regional agencies that confront resource shortages and budget restraints. Besides, this paper introduces a new concept of PMS score to determine an agency’s efficiency in maintaining roads based on multiple parameters. To achieve these goals, two surveys were conducted: The Canada-wide Pavement Management Survey, which was conducted on the regional agencies of Canada, and the Road Users’ Feedback Survey, that was conducted on the municipality residents of the province of Newfoundland and Labrador.
The objective of the Canada-wide survey was to understand contemporary pavement management practices at the regional level. On the contrary, the road users’ feedback survey aimed to determine whether general people’s feedback can be utilized in making maintenance decisions. Findings from these two surveys were used to propose a pavement management framework for budget- and resource-restrained regional agencies.
Literature Review
PMS in Canada was introduced by the Roads and Transportation Association of Canada (RTAC) in 1977 ( 6 ). RTAC became TAC in 1991, and a pavement management committee began to work on the upgrading of 1977’s PMS ( 7 ). In 1997 TAC published its updated version named “Pavement Design and Management Guide.” The latest version of this PMS was released as a “Pavement Asset Design and Management Guide” in 2013 ( 1 ). The objective of a PMS may vary. According to Haas and Hudson ( 1 ), depending on the agency (i.e., state/provincial, city, county), the focus and scope of the level of users may differ.
Pavement management decisions can be taken at three levels: strategic, network, and project level ( 8 ). Policymakers make long-term strategies, like setting performance goals and funding allocations at the strategic level. Decision at the network level deals with the present and future network conditions, and the requirements are generally within a five-year time frame ( 9 ). Project-level decisions are typically short-term strategies dealing with maintenance techniques, design, construction, and so forth. Basic PMS components are discussed as follows.
Network Defining and Referencing System
A road network can consist of a wide variety of lengths, from very short to very long. Various parameters can be considered when defining the network, such as pavement structure (pavement materials or thickness), surface type (flexible or rigid), traffic (volume or pattern), and so forth ( 8 ). Agencies divide their road network into several manageable sections, and these sections can be referenced using a suitable referencing method. Various referencing methods are available. However, the spatial referencing system Geographic Information System (GIS) has become very popular ( 7 ). GIS is a system for creating, managing, analyzing, and mapping various types of data ( 10 ).
Detailed Database
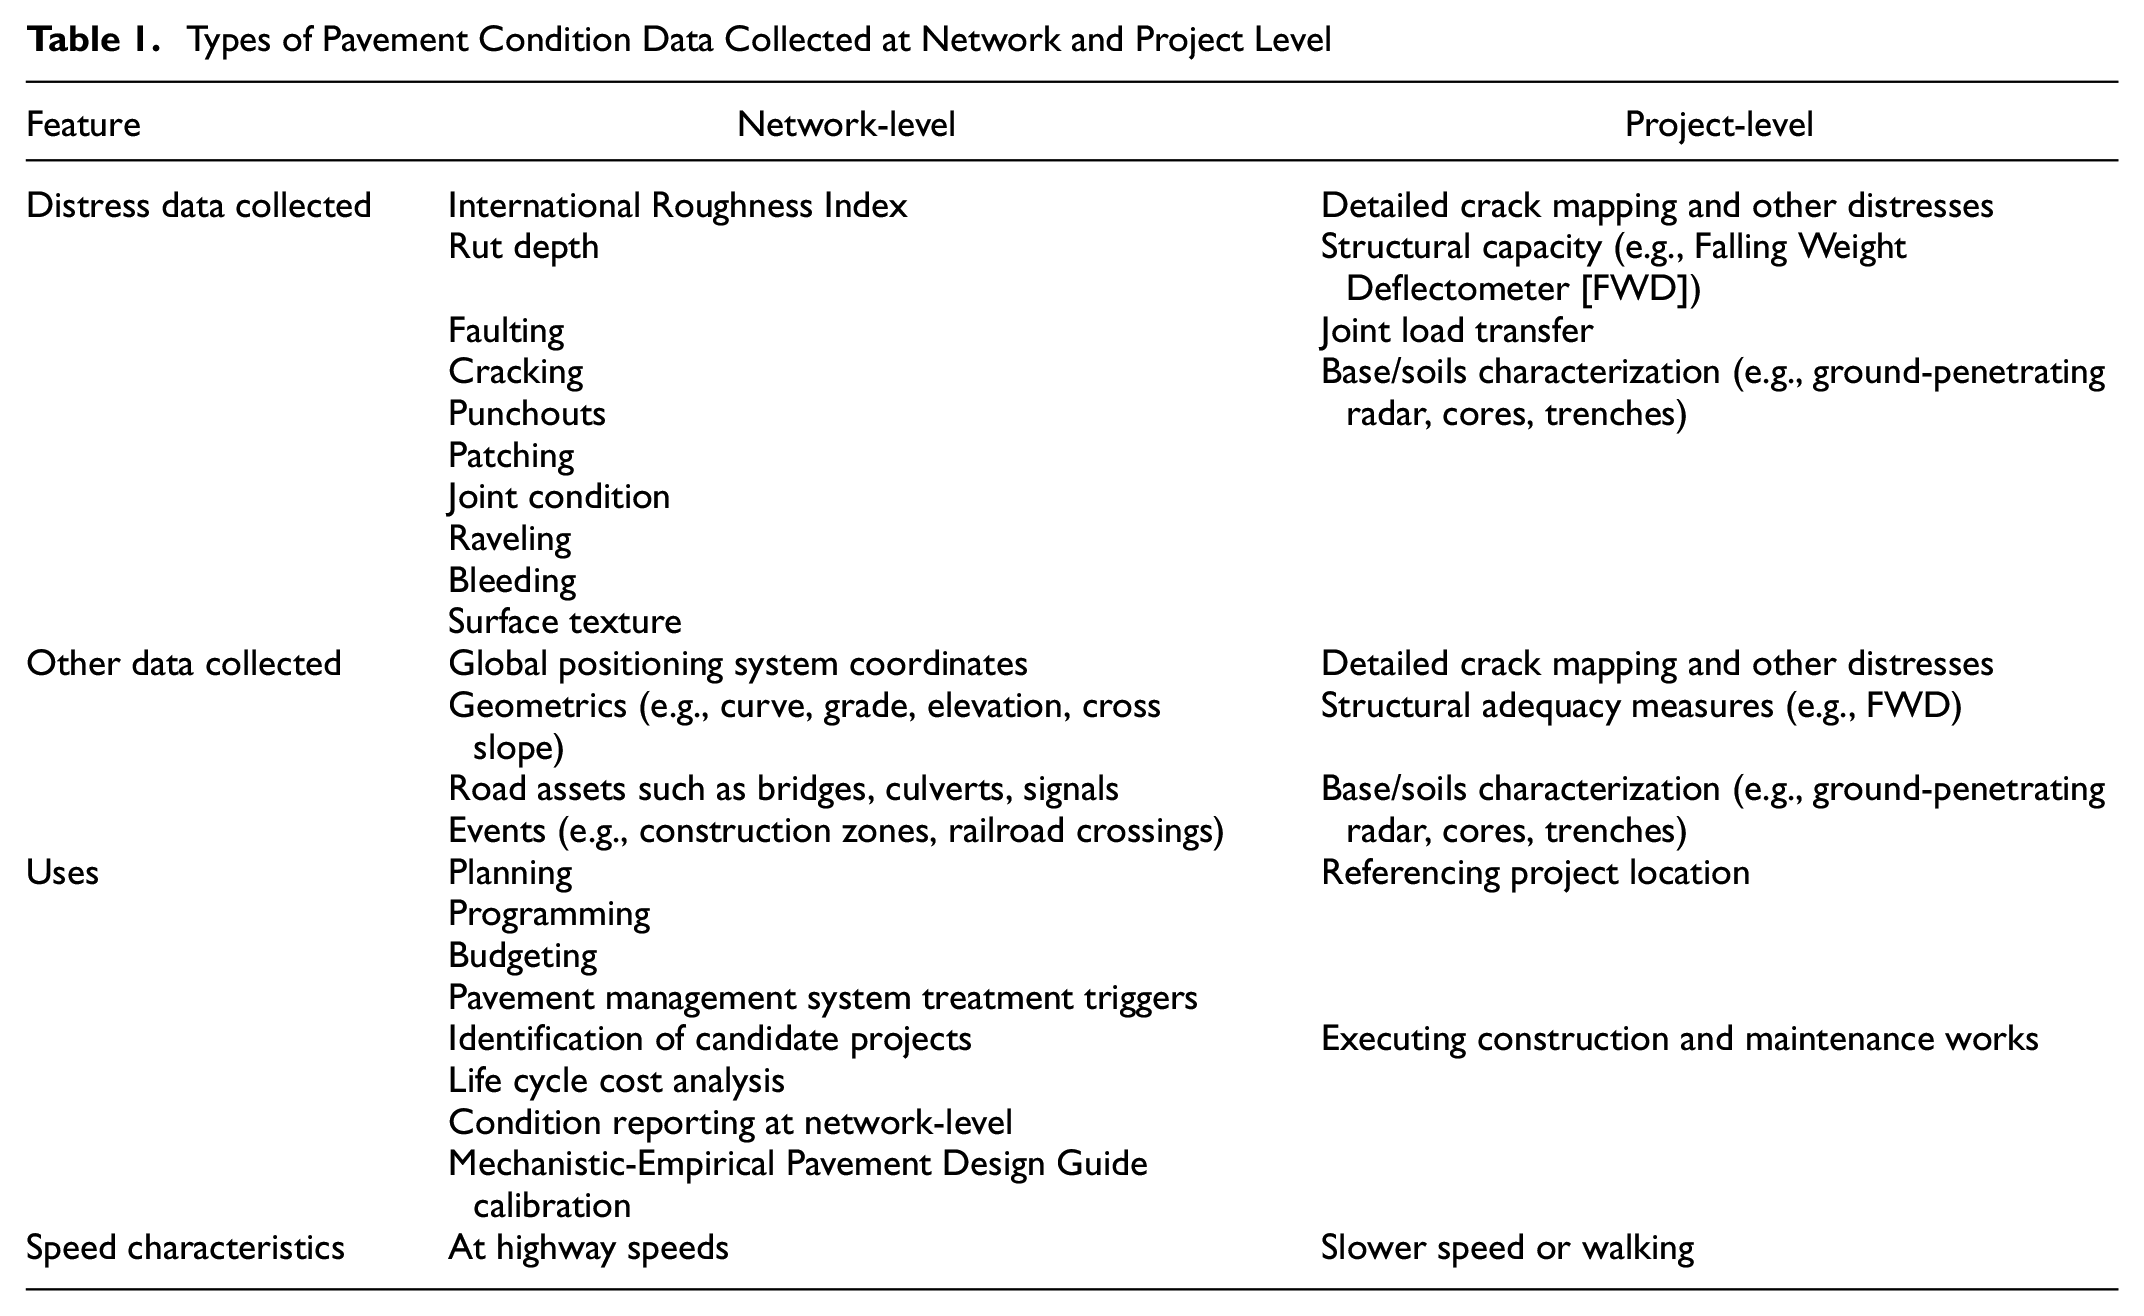
The PMS database contains different types of data: inventory data, pavement condition data, traffic data, historical data, policy data, environmental data, cost data, and so forth ( 11 ). Pavement inventory data vary at the PMS’s network level and project level ( 12 ). Network-level inventory data may include the general information of the network, whereas project-level inventory data comprise data specified for a particular project. Pavement condition data also vary at different levels. For example, many agencies collect the International Roughness Index (IRI) and surface distress at the network level, but structural capacity is obtained primarily at the project level ( 13 ). Table 1 summarizes different pavement condition data collected at the network and project level ( 12 ).
Types of Pavement Condition Data Collected at Network and Project Level
Collecting traffic data such as Average Annual Daily Traffic (AADT), Average Annual Daily Truck Traffic, traffic growth, annual Equivalent Single Axle Loads (ESALs) are the requirements of a PMS. To determine the load equivalency factors, extensive research has been done. As an approach, the AASHTO Road Test suggests using Weight-In-Motion devices to estimate the number of ESALs ( 14 ).
Historical data are necessary for predicting the future performance of pavement ( 15 ). Historical data can be divided into three categories: construction history, maintenance history, and traffic history.
Environmental data have a significant impact on pavement performance. For environmental data, the focus is on climatic issues like precipitation rate, temperature, freeze–thaw cycle, subgrade drainage condition, and so forth.
Policy data deal with the budgetary plan, maintenance, and rehabilitation alternatives, and provincial or territorial regulations. Policy data provide backup information that is necessary for deciding issues in policymaking. Policies in relation to hiring full-time staff can be tied to the population size rather than the network size, as the most significant need for tax funds may be directly related to wages paid to the employees ( 16 ).
Cost data may include initial construction cost, maintenance cost, data collection and processing cost, employee cost, user cost, and so forth. It was estimated that pavement condition data collection and analysis may cost an agency from $2.23 to $10.00 per mile ( 17 ).
Pavement Condition Evaluation System
Agencies collect individual distress data and express the magnitude of the distress in relation to density and severity scale. Density defines the distress frequency; severity defines the extent of the distress ( 18 ).
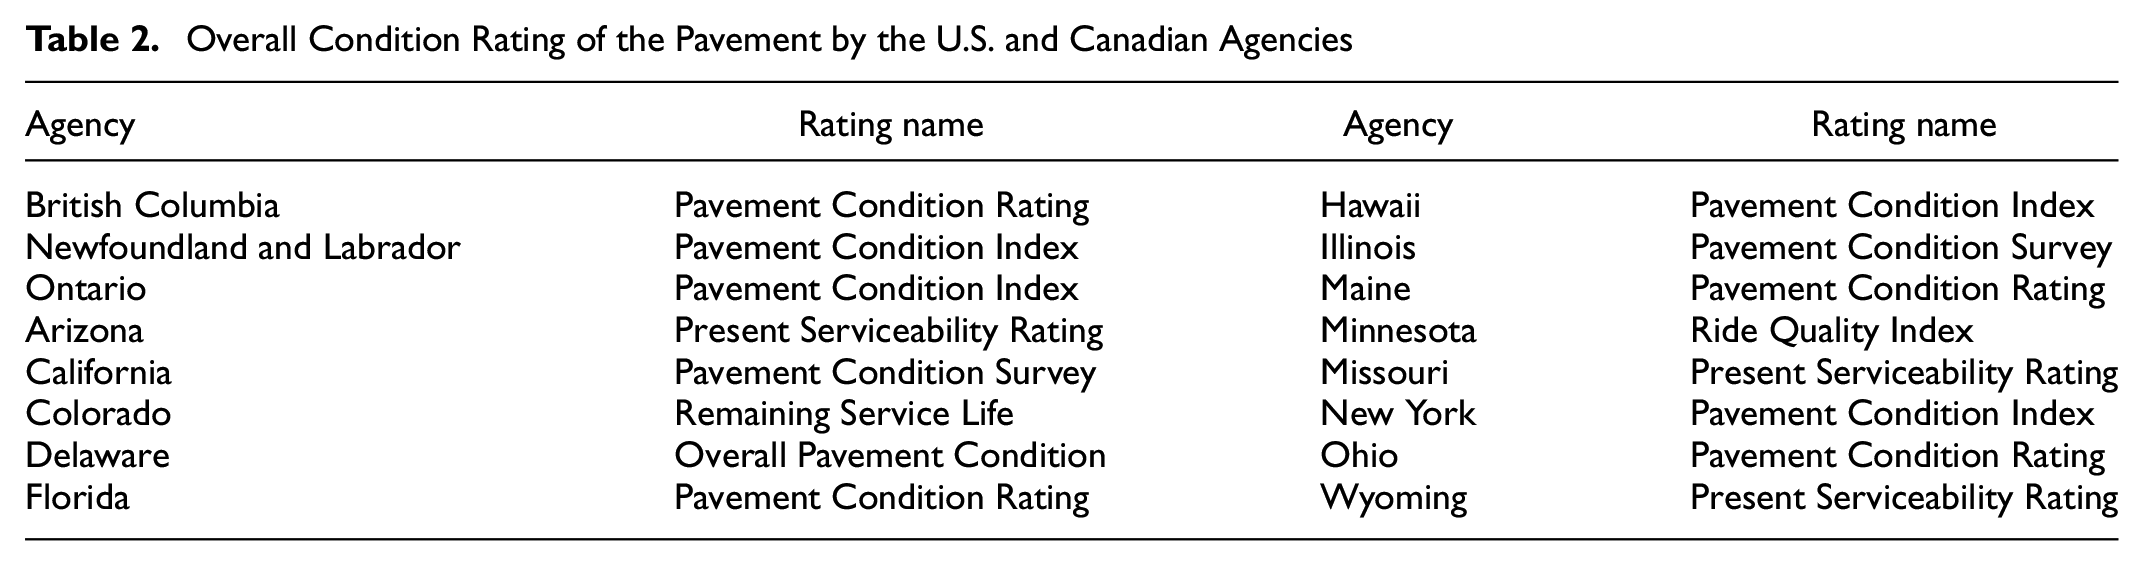
Different distresses may be transformed into one single expression to describe the overall condition of the pavement. According to the NCHRP report of 2004 on pavement management, around 80% of the agencies combine their distress rating or index with other ratings or indices such as roughness. Table 2 shows combined distress expressions by some agencies ( 19 ).
Overall Condition Rating of the Pavement by the U.S. and Canadian Agencies
There are established protocols and manuals for evaluating pavement conditions. However, an agency may develop its own based on needs.
Maintenance and Rehabilitation Priority Program
For carrying out maintenance and rehabilitation tasks at the appropriate time, a priority program is required. Integration of information, identification of possible needs, priority assessment, and output reports are four basic steps to develop a priority program ( 7 ). Different transportation agencies follow different priority models. Parametric ranking, subjective ranking, and economic ranking are common priority models employed by transportation agencies.
Performance Prediction Model
Pavement deteriorates with time as a result of multiple factors, including traffic load, poor maintenance, harsh environmental conditions, and so forth. It is beneficial for an agency to have a system that can predict the performance of pavements. Performance prediction models are typically categorized into two types: deterministic and probabilistic ( 20 ). Deterministic models consider the primary response, functional performance, structural performance, and damage models. Probabilistic models may include Markov chain models and survivor curves ( 20 ). The main advantage of the probabilistic prediction model lies in its ability to identify and aid uncertainties in design analysis, leading to reliability-based pavement designs. Yong-hong et al. ( 21 ) find pavement performance gradually decreases with the increase of construction age and the traffic load times; its changing phenomenon is related to the pavement structure in the past.
Overview of Canadian Regional Pavement Management System
Regionally managed road networks are subsets of the provincial PMS framework. Therefore, the importance of regional PMS cannot be overlooked, as any deficiency can affect the whole system. To understand contemporary pavement management practices at the regional level, the Canada-wide pavement management survey was conducted. Municipalities, cities, and towns that manage a significant portion of LVRs were contacted to participate in this survey. The survey was online and was sent through email. In total, 41 municipalities from nine provinces of Canada responded to this survey. Figure 1 shows the number of responses received from each province.
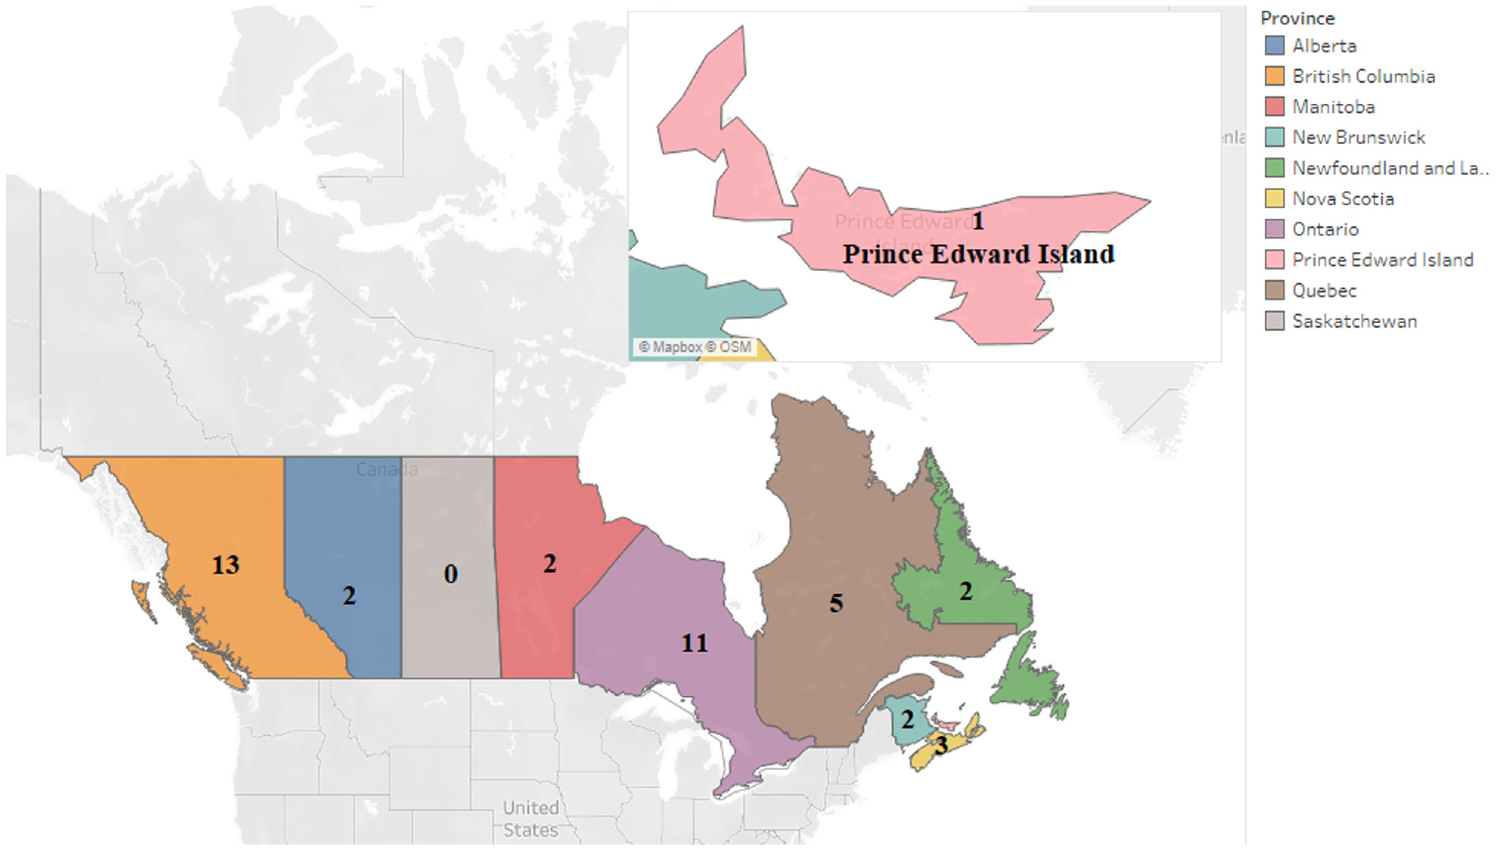
Responses from the participant provinces.
The survey questionnaire covered almost all the PMS components, such as data inventory, performance models, priority models, resource availability, and so forth, and intended to understand how those components work in regional agencies. Participants were asked how LVRs should be defined. Most of them responded that roads that carry fewer than 500 vehicles per day could be considered as LVRs, as presented in Figure 2.
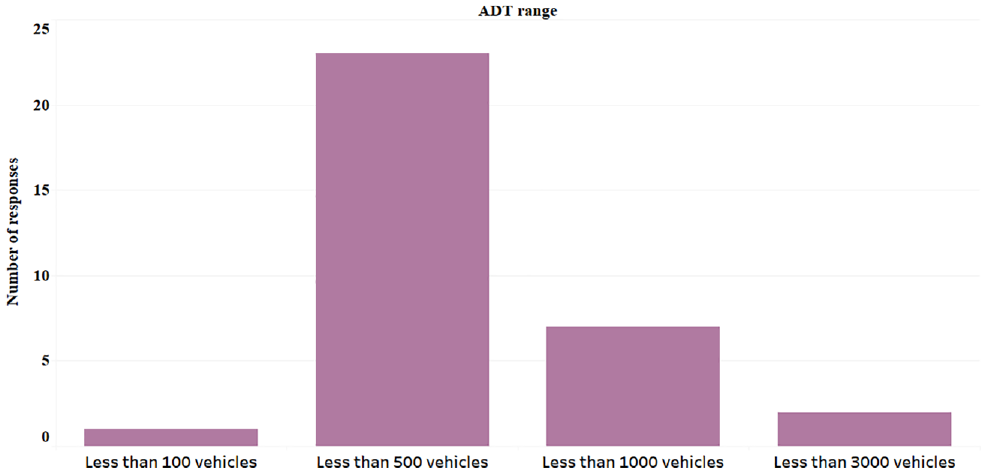
Range of average daily traffic as low-traffic road.
As regional agencies primarily manage LVRs, it is crucial to understand what kind of data they collect related to LVRs. Figure 3 represents the types of data agencies collect. It can be seen that surface distress is the most common type of data collected by the agencies, followed by traffic and structural condition data.
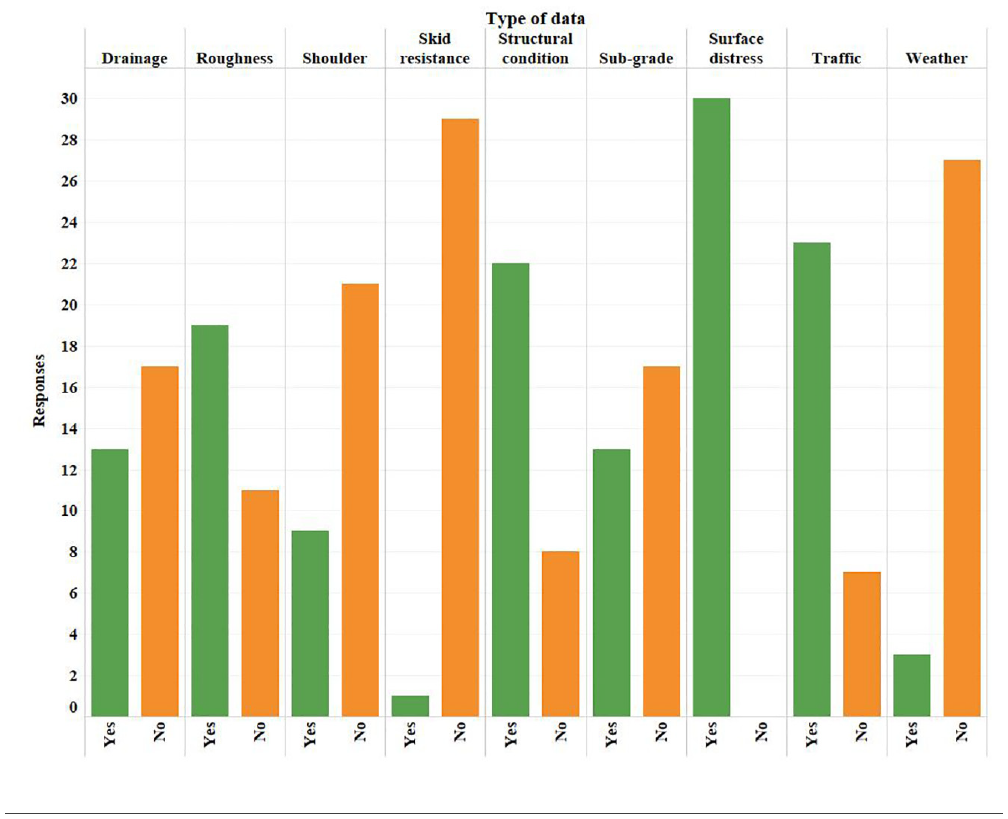
Type of data collected from the low-volume roads.
As surface distress is the most commonly collected LVR data category, it would be interesting to know what type of surface distress data the agencies collect. Before that question, it is essential to know the types of pavements that prevail under the regional jurisdictions. Figure 4 shows that most of these regional agencies own flexible pavements followed by gravel roads. Only a few agencies said that they own rigid and composite pavements. Based on the type of pavement selected, the participants were asked what distress data they usually collected from different pavements. As only a few agencies selected rigid and composite pavements, we did not receive much response in relation to the type of distress collected from those pavements. Therefore, those findings are not shown. Figure 5 represents the types of distress collected from the flexible pavements.
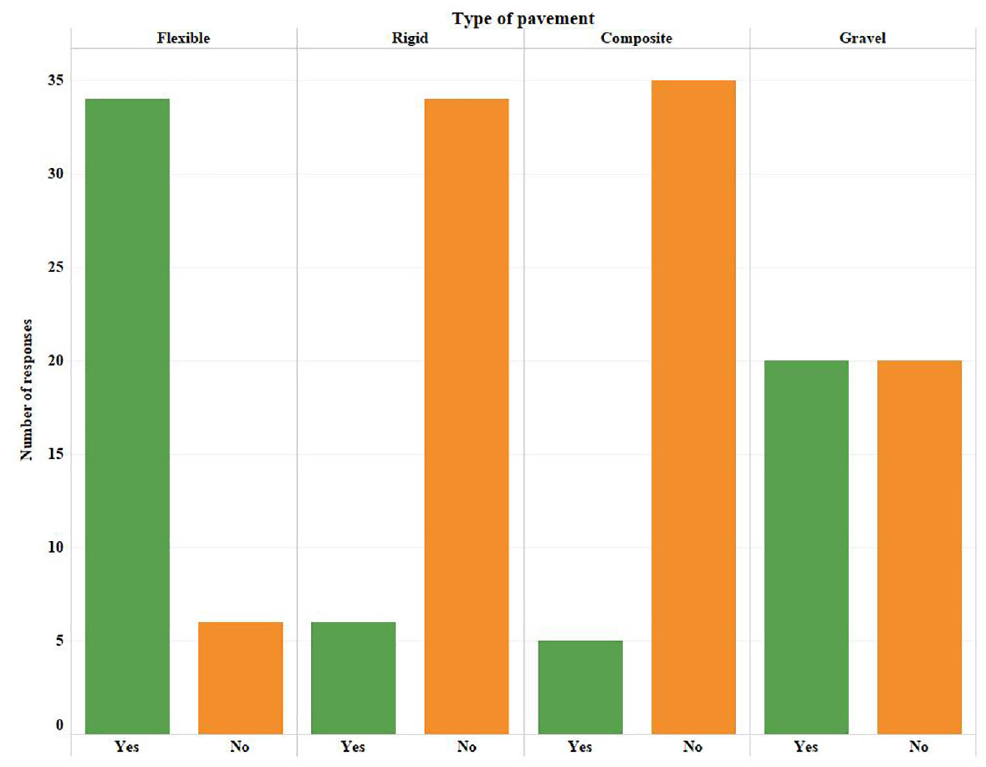
Types of pavement in the agencies.

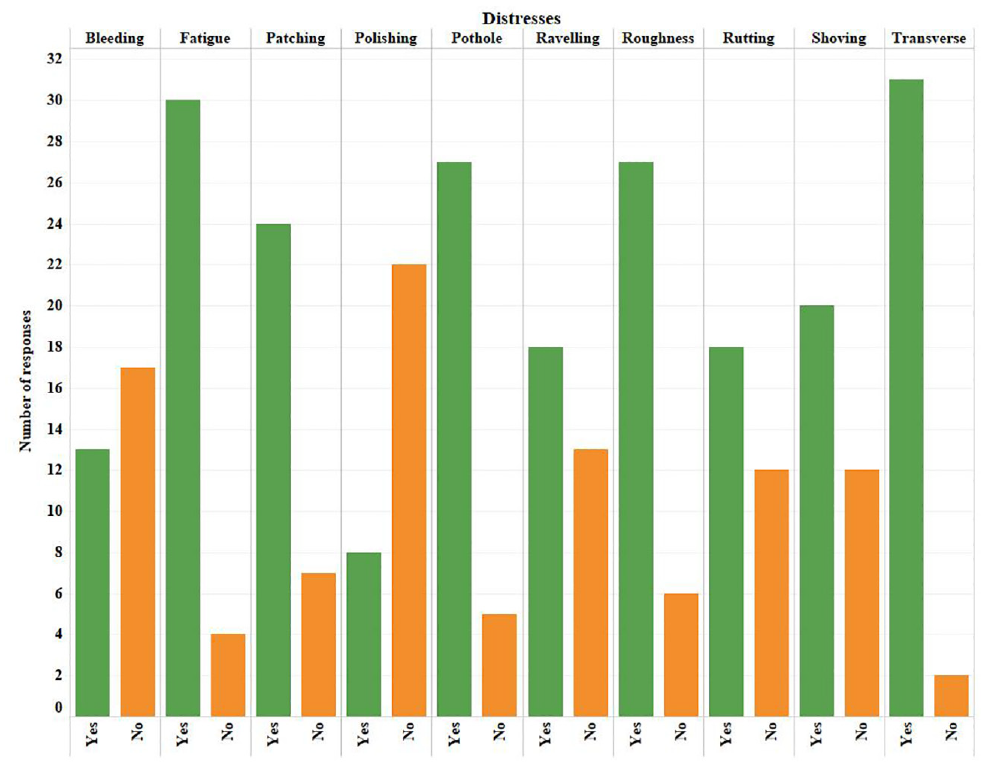
Type of distress data collected from the asphalt pavements.
Figure 5 shows that most agencies collect transverse crack, fatigue crack, roughness, potholes, and patching. Polishing is the least common type of distress collected by the agencies.
Participants were also asked the types of distress they collected from the gravel roads. Most of the respondents said loose aggregate followed by corrugation and potholes.
Once distress data are collected, an agency would like to know the overall pavement performance. A study found that most of the agencies in the U.S. and Canada convert pavement performance into a single scale ( 19 ). From Figure 6, it can be seen that Pavement Condition Index (PCI) is the most commonly used performance index in regional agencies. PCI is a numeric measure of pavement surface condition based on observed surface distresses ( 22 ). PCI ranges from 0 to 100, where “0” means the pavement is in worst condition and “100” represents the best shape ( 23 ). A few agencies said that they used Pavement Condition Rating (PCR) as a pavement performance measure. PCR is a mathematical expression that offers an indicator that reflects the composite impacts of various distress kinds, severity, and extent on the overall condition of the pavement ( 24 ). Pavement Quality Index (PQI) is adopted by a few agencies. PQI is a combined pavement performance measure which is the function of Ride Condition Index (RCI), Structural Adequacy Index (SAI), and Surface Distress Index (SDI) ( 16 ). Only one agency said they adopted Condition Rating Survey (CRS) as a pavement performance indicator. CRS represents overall pavement condition on a scale from 1 to 9 with increments of 0.1, which is explained in the 2004 CRS manual ( 25 ). A CRS score of 9 means a newly constructed pavement, and a CRS score of 1 represents a failed pavement. ( 26 ).
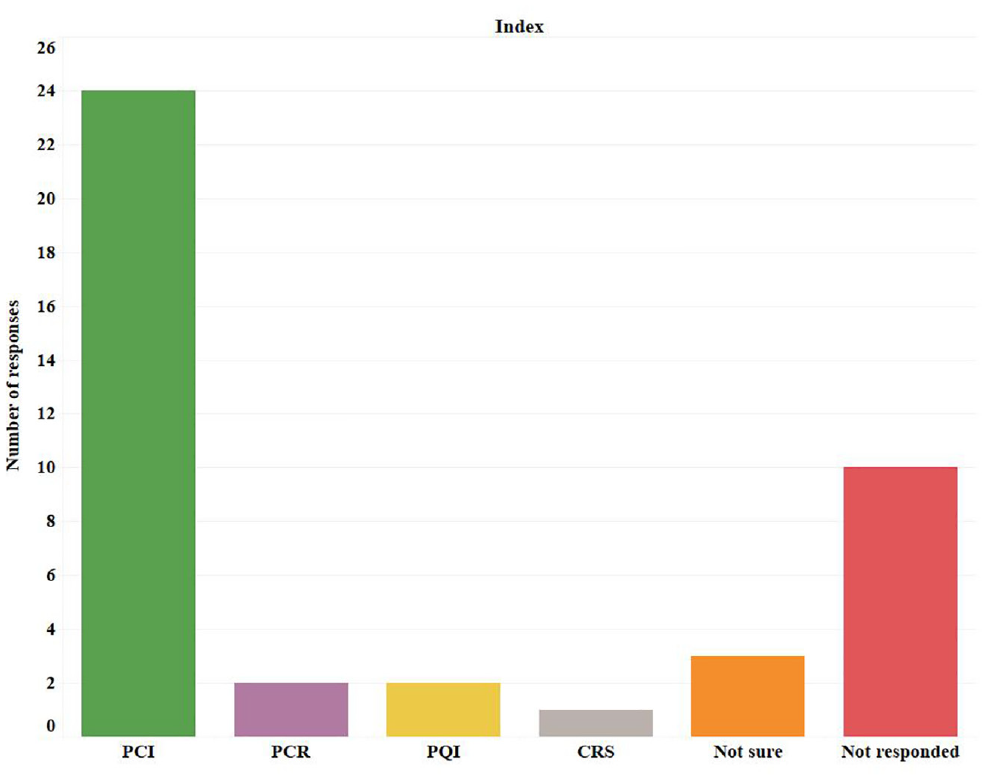
Different pavement performance indices used by the regional agencies.
After finishing a road condition survey, an agency would be interested in fixing the problems identified. As such, participants were asked to select what sort of treatment they would choose for particular distress types. The majority of the distresses were selected for asphalt pavements and gravel roads, as municipalities primarily own those types of roads. Therefore, most of the treatments discussed here are related to asphalt and gravel roads.
For potholes on asphalt pavement, the vast majority of the participants (22 out of 23 responded municipalities) selected “surface patching” as treatment, whereas only one municipality selected “micro-surfacing.” To solve the bleeding problem, municipalities preferentially selected the coarse sand applying process. Different kinds of cracks occur on asphalt pavements. For treating cracks, agencies and municipalities mainly indicated that they choose crack sealing followed by flush filling. A good number of municipalities also selected spray patching. Deep patching was found as the most popular treatment to treat rutting, followed by skin patching and resurfacing. Micro-surfacing was found to be the most common treatment for treating raveling. After micro-surfacing, resurfacing was found very common. Shoving is another common distress on asphalt pavements. Responding municipalities chose to overlay as the most common treatment for shoving. Figure 7 shows different treatments for asphalt distresses and the respective responses.
Types of asphalt distresses and treatment.
In relation to the treatment of distress on composite and rigid pavement, no response was found. Though distress on gravel roads is often ignored, we asked municipalities whether they do anything to fix corrugation, which is common distress on the gravel road. Most respondents said they would grade that distress with a box scraper, and one respondent mentioned surface treating. This discussion provides an insight into the types of treatments adopted for different pavement distresses by the agencies. However, practitioners should be consulted to choose the proper treatment. These treatments are the maintenance operations carried out by the agencies following a priority program as a standard practice.
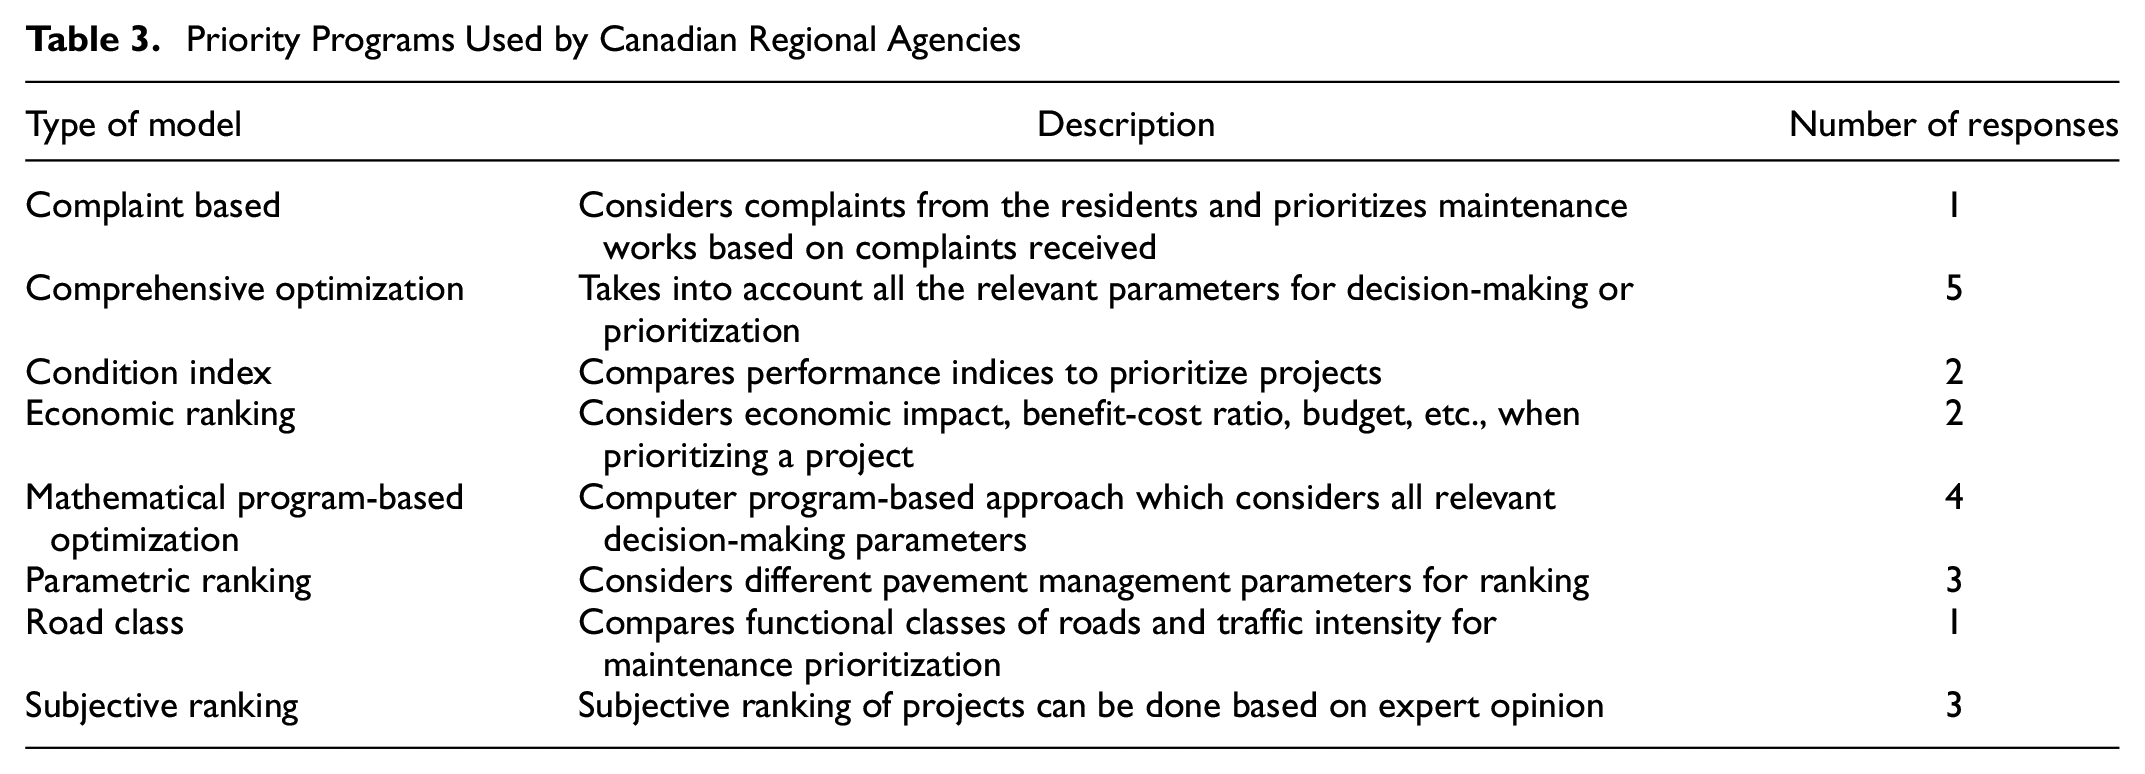
Agencies generally have several candidate projects for maintenance at a time. However, with limited budget allocation and resources, it is impossible to carry out all the maintenance work right away. Therefore, agencies need to have a priority program. An efficient priority program can save agencies a substantial amount of money. In the survey, municipalities were asked what kind of priority models they used. In total, 21 municipalities responded to this question. Table 3 shows the responses.
Priority Programs Used by Canadian Regional Agencies
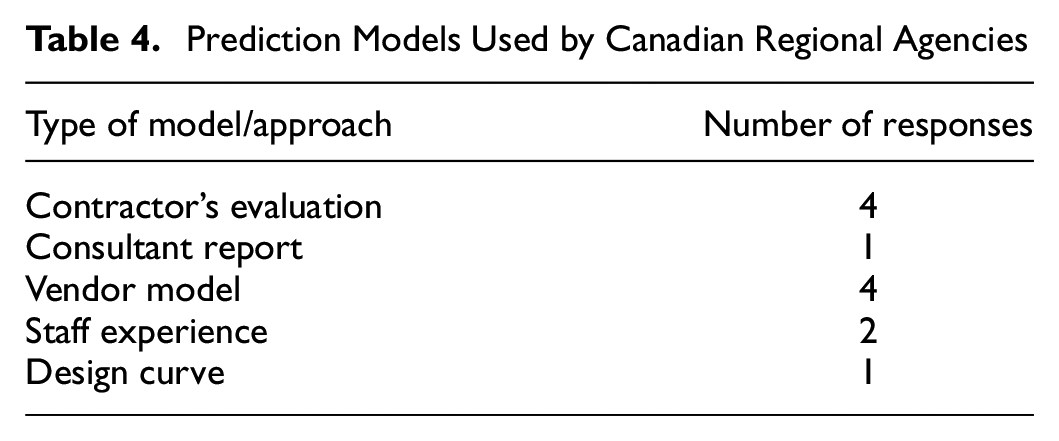
The pavement performance prediction model is an integral part of a PMS. Therefore, municipalities were asked if they adopted any performance prediction model. Some 21 municipalities attempted to this question, of which nine municipalities were unsure about the models. Other responses are presented in Table 4.
Prediction Models Used by Canadian Regional Agencies
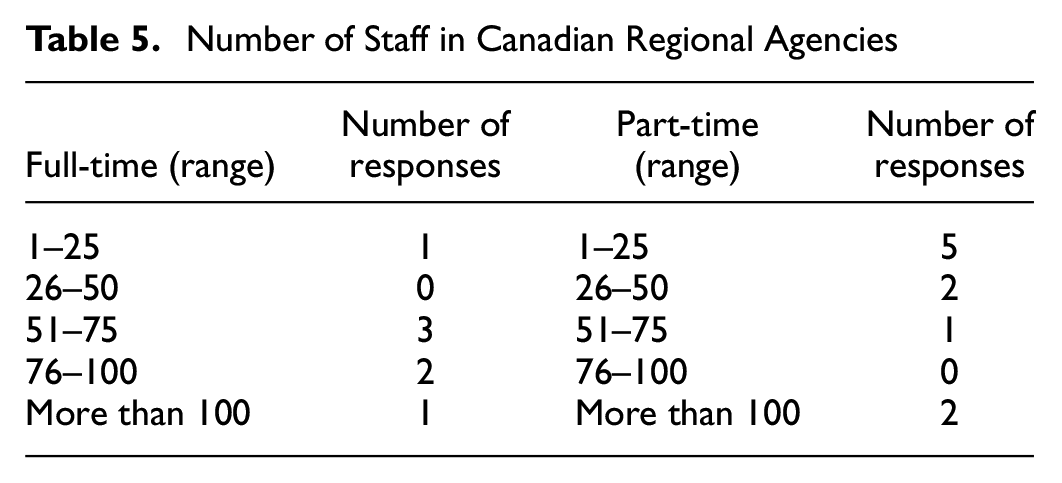
Audience municipalities were asked questions in relation to human resources in their municipalities. They were asked how many full-time and part-time staff worked in their municipality offices. Twelve municipalities responded to this question. Table 5 shows the responses.
Number of Staff in Canadian Regional Agencies
Besides human resources, municipalities and agencies may own different types of equipment that are useful for managing roads. Audiences were given four types of equipment to choose from: equipment used in maintenance, IRI collection equipment, structural condition evaluation system or equipment, and referencing tool. Table 6 shows that most of the municipalities have maintenance equipment.
Types of Equipment Available in Canadian Regional Agencies
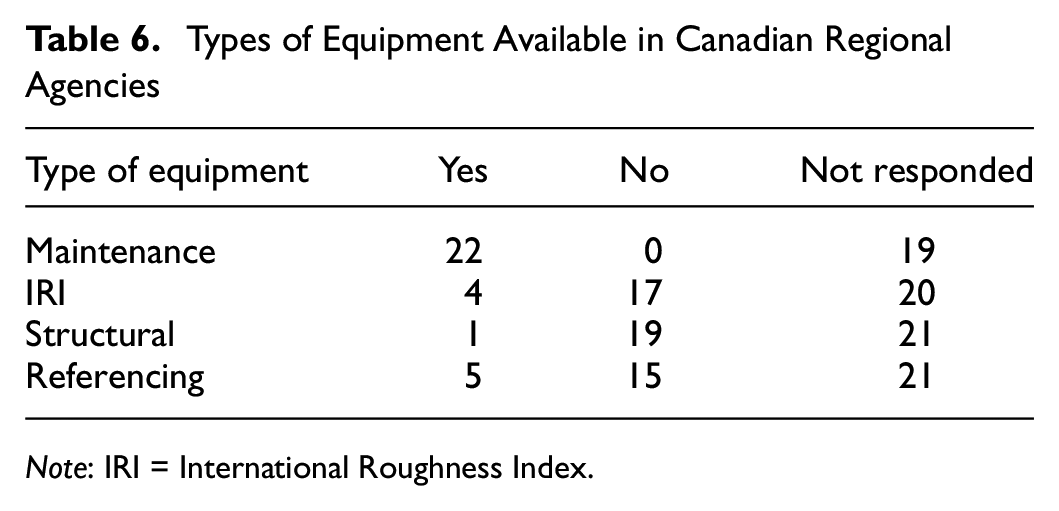
Note: IRI = International Roughness Index.
PMS Score
Utilizing the findings from the Canada-wide pavement management survey and literature, a PMS score is developed. The PMS score considers five parameters: the adequacy of the pavement database, the pavement performance model adopted, the priority model used, human resources, and other objective resource availability. The pavement database score combines different types of pavement-related data where the total score is 100. A pavement performance score is an individual score where the highest score is 100, and the lowest is 25. The highest score is assigned to the vendor model, as the professionals develop these models. Priority model and human resource availability are also individual scores. The highest score in the priority model category is 100 for the mathematical program-based optimization model, and the lowest score is 30 for complaint-based priority tasks. However, “Other resource availability” is a combination of scores on various pavement management equipment, and the combined score in this category is 100. It needs to be noted that equipment ownership should not be considered as a must criterion. Suppose maintenance work, IRI collection, and so forth, can be carried out by outsourcing services for low cost when compared with owning equipment. In that case, an agency can consider adding the score for respective equipment categories. The scores are assigned from the percentage of responses received from the survey and an extensive literature review on regional PMS. This PMS score is developed to provide a tentative idea of a regional agency’s management practices position and is not entirely definitive. Table 7 explains the PMS scoring.
Pavement Management System (PMS) Scoring Criteria
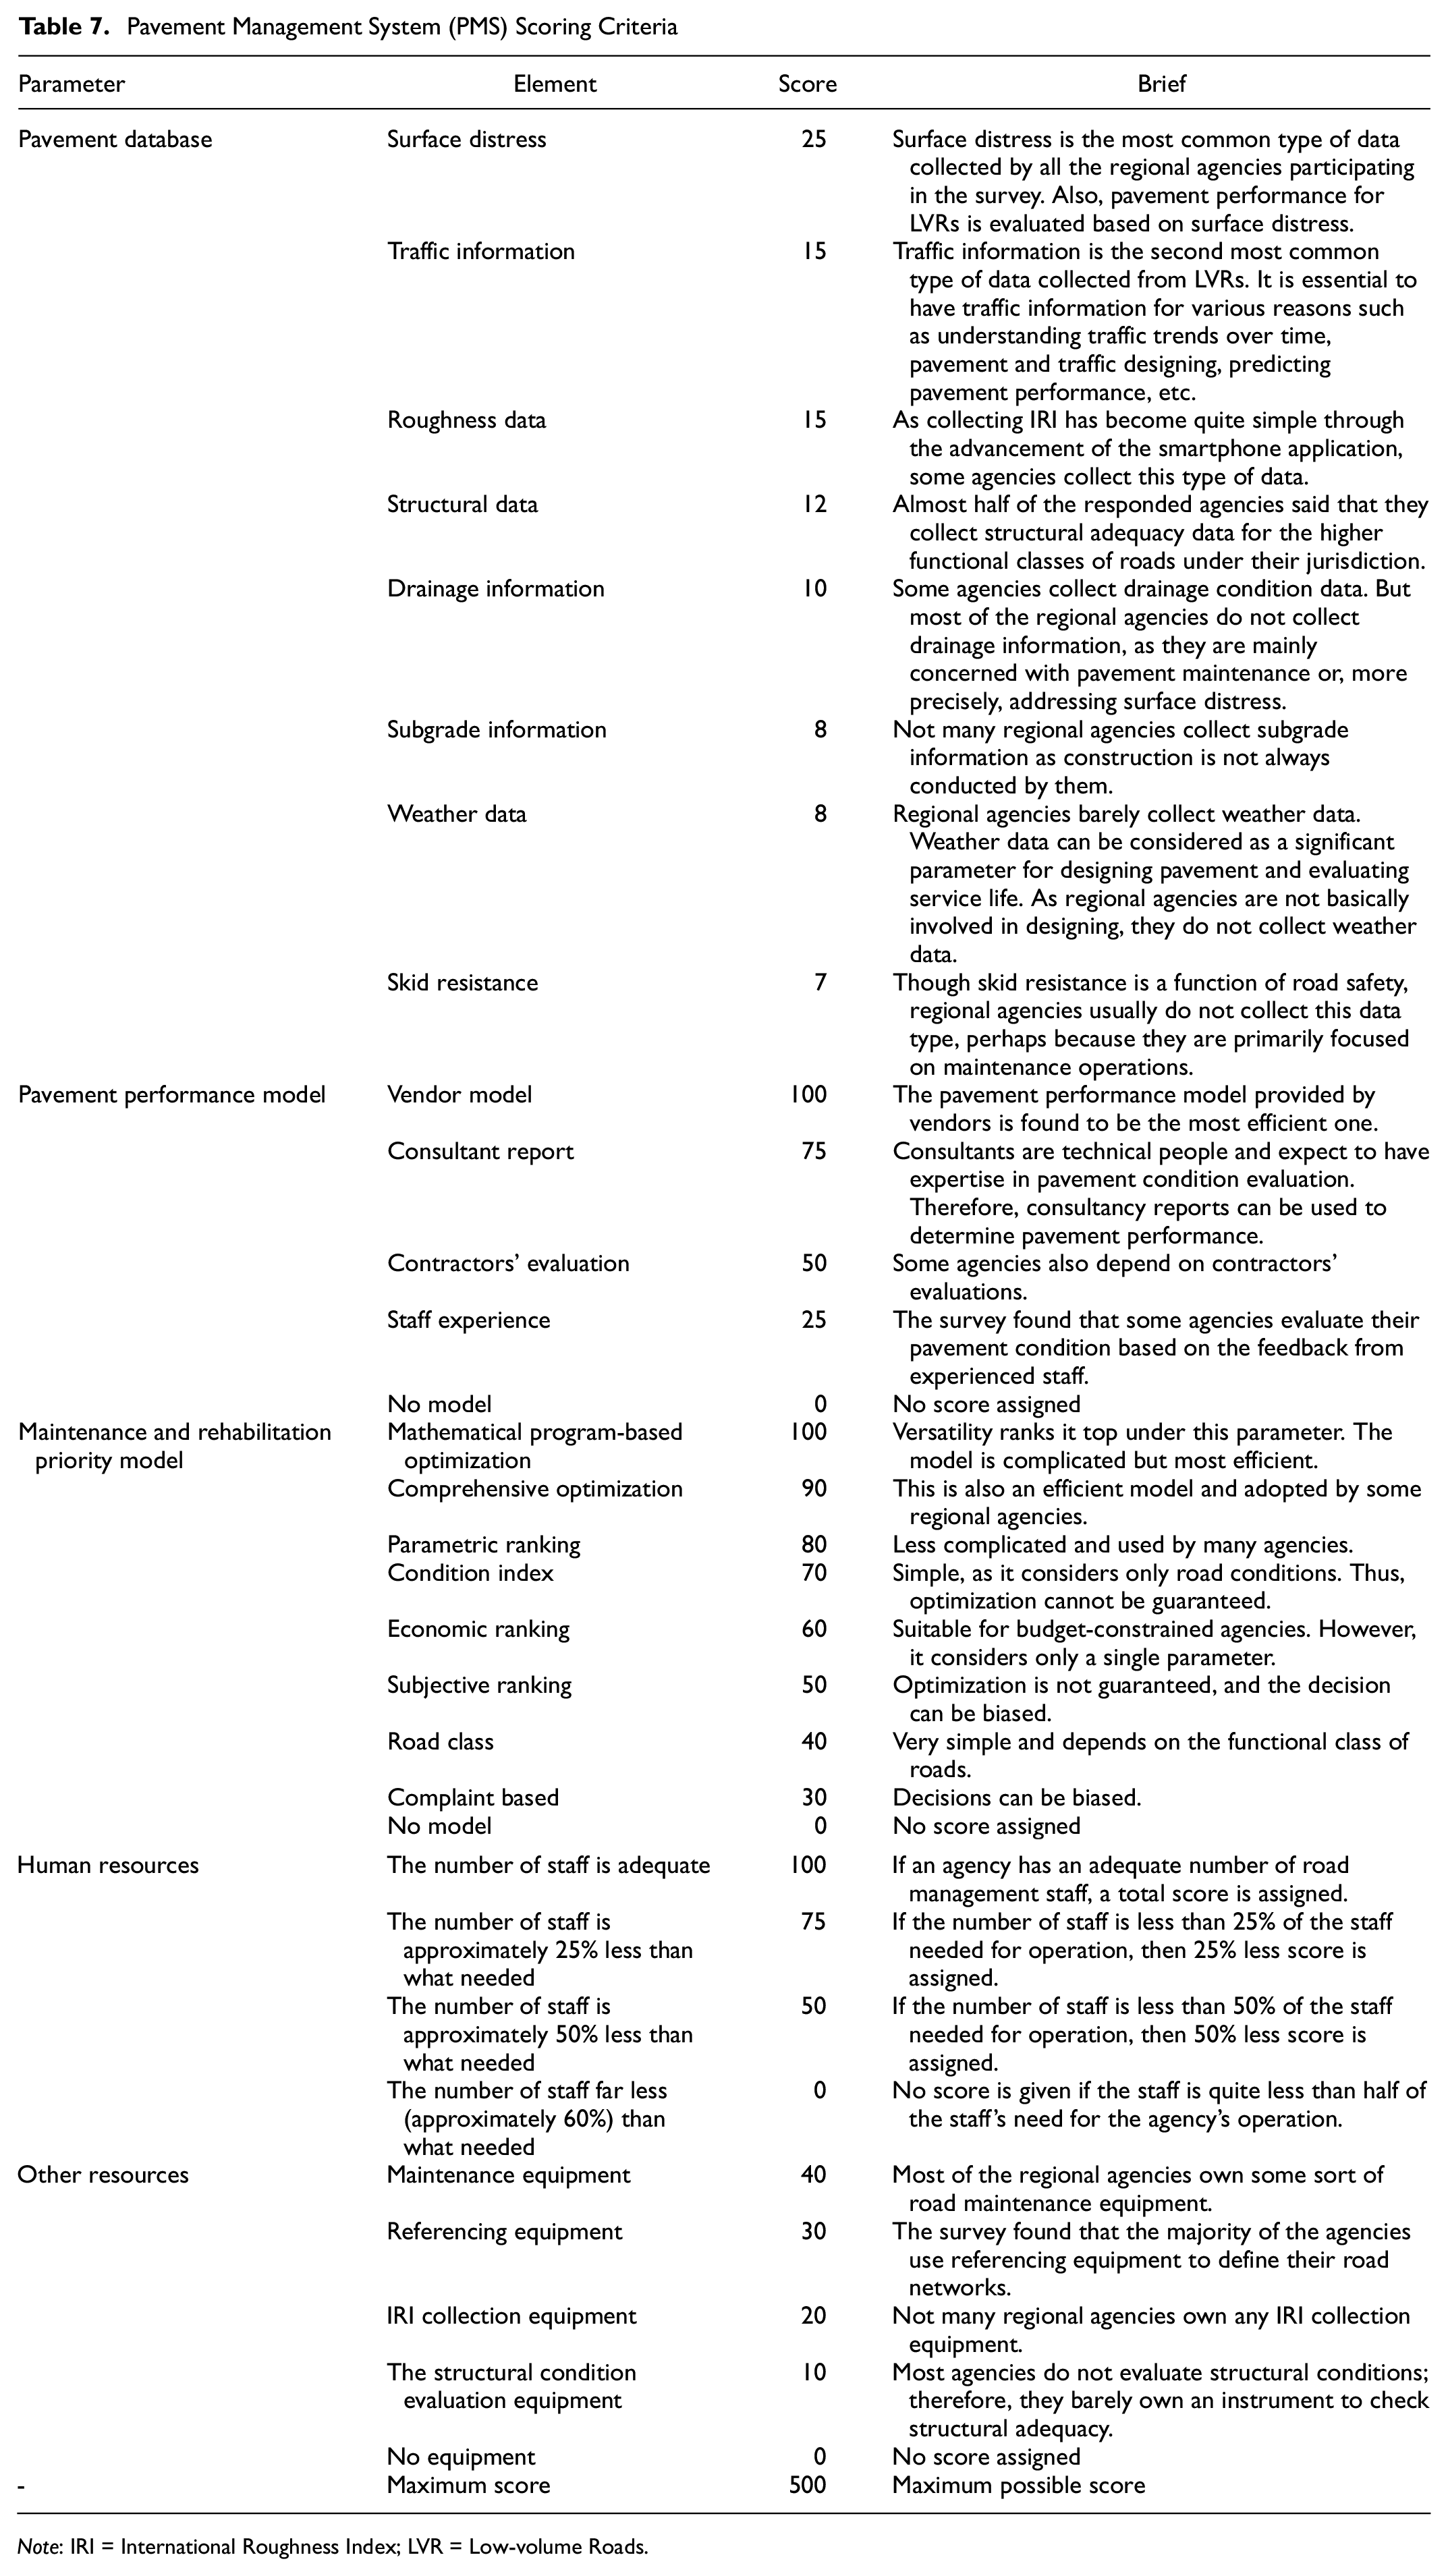
Note: IRI = International Roughness Index; LVR = Low-volume Roads.
A minimum PMS score is also suggested based on the percentile of responses received on each parameter of the PMS. This minimum PMS score defines the minimum arrangement an agency should have for a working PMS. However, good functional agencies should have a score over 400. Table 8 explains the minimum PMS score.
Minimum Pavement Management System (PMS) Score
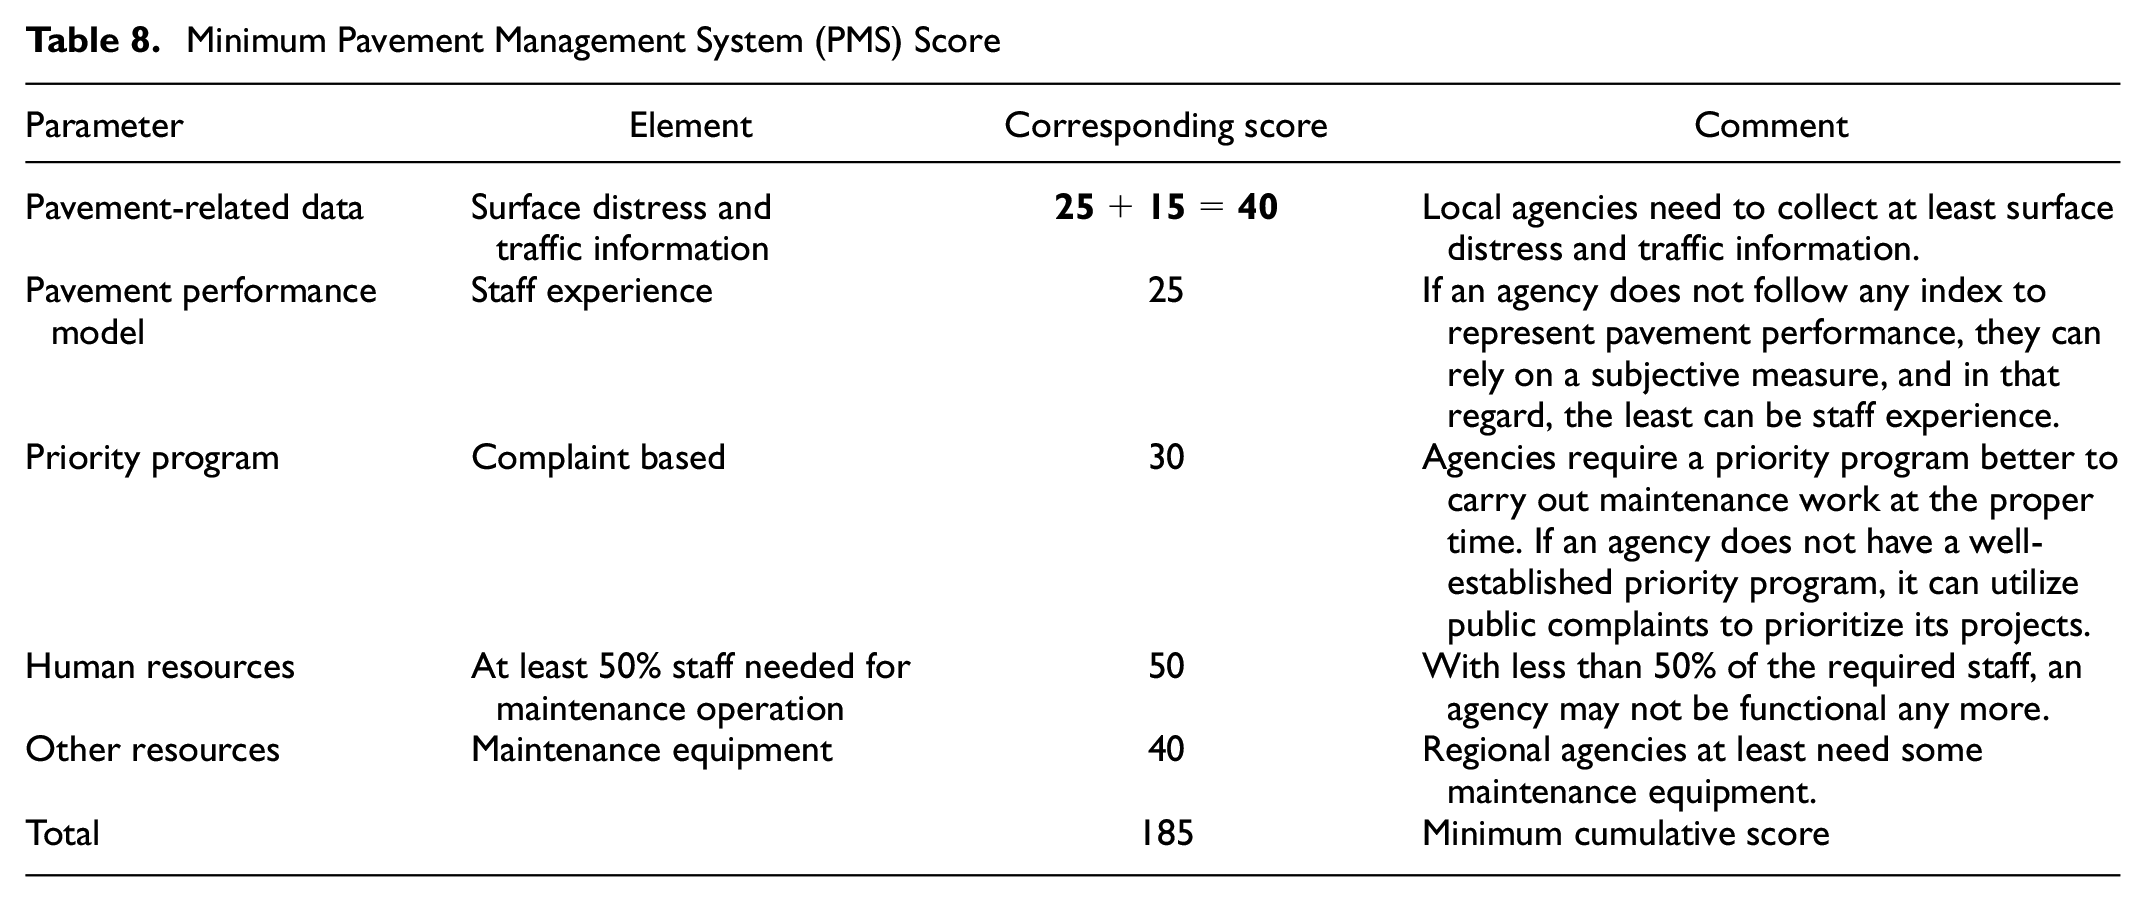
An overall PMS score of 185 or higher means that the agency has established some sort of PMS; on the contrary, if the PMS score is less than 185, the agency may not practice PMS. Agencies with a PMS score of 185 or less most likely lack budget and resources. Therefore, this study is focused on those agencies. The proposed framework has a nominal cost and requires minor technical expertise.
Proposed PMS Framework
Figure 8 is the pictorial representation of the proposed PMS framework. The framework has six components: PMS scores to understand an agency’s stand from a pavement management perspective, referencing method to define road network under an agency’s scope, a database to preserve pavement-related data, a performance index to describe the overall condition of the pavement, a prediction model to forecast maintenance needs, and a priority program to prioritize candidate projects. PMS score has already been discussed in the previous section.
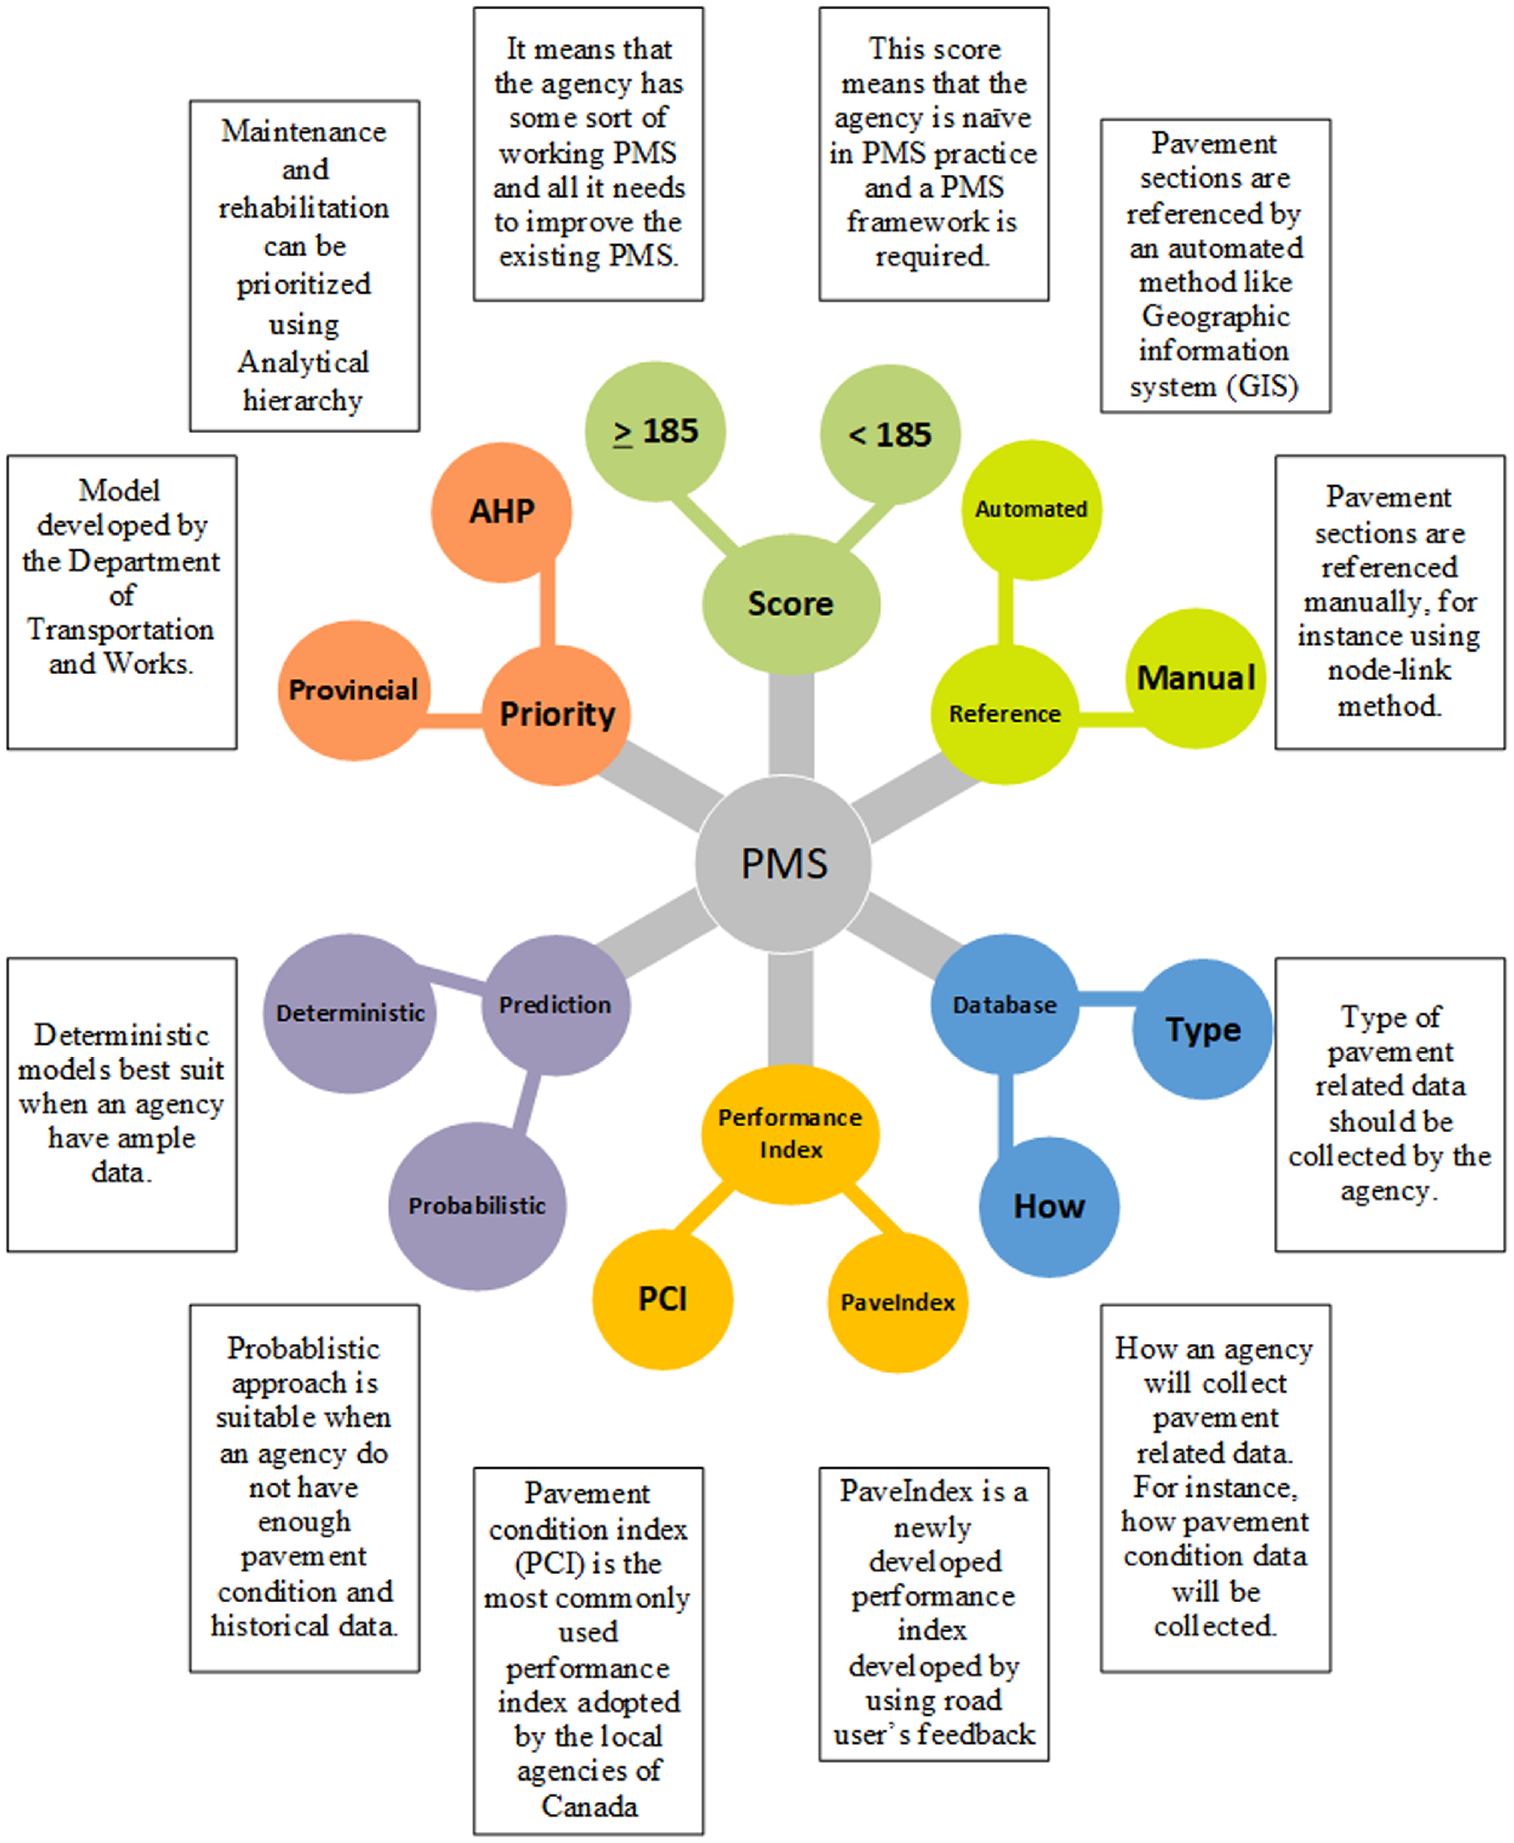
Proposed Pavement Management System framework.
It is essential to develop a system to define road networks and reference pavement sections. There are several ways to do that, which have already been discussed in the literature review. Referencing methods can vary from the simplest one to a sophisticated one, based on an agency’s needs. Most of the small municipalities and agencies in Canada opted for primary referencing methods such as node-link, branch-sectioning, route-km post. Among the automated methods, GIS is implemented widely by the regional authorities. For example, in Quebec, the City of Montreal, in Alberta, the City of Calgary, and Edmonton have implemented GIS ( 27 )
Pavement Data Management
Pavement data management for low-traffic roads include two main components: The type of data to be collected and how those data are to be collected and processed.
The collection of data can vary depending on the scope and affordability of an agency. However, the essential data types are discussed briefly as follows.
Geometric Data
Agencies need to have a clear understanding of the geometric data of their road networks. Haas and Hudson ( 1 ) described that the geometric data define the physical characteristics of the pavement sections and should contain the listed features: The class of road (Highway, arterial, collector, etc.) and Geometric properties (Length, width, thickness, surface type, number of lanes, shoulder information, etc.).
Historical Data
Agencies require historical data to carry out essential measures, such as making a budgetary plan, predicting future pavement conditions, and scheduling maintenance operations. Historical data can be divided into four categories ( 28 ): Initial construction history, reconstruction history, major rehabilitation history, and regular maintenance history. However, agencies also maintain a traffic history.
Traffic Data
Traffic data may include the volume of traffic, vehicle class, vehicle loading, axle spacing, and vehicle speed. Traffic data is an essential element in the PMS database. The following is a list of reasons that a local agency needs to collect traffic data:
Pavement Condition Data
Pavement condition data include data useful for defining pavement performance: surface distress, roughness, structural adequacy, friction, and so forth ( 5 ). Collecting pavement condition data depends on the scope and budget of the particular agency. The Canada-wide pavement management survey revealed that local agencies in Canada generally collect surface distress data. A small portion of the respondents said that they collected structural and roughness data ( 31 ). Only one municipality responded that they would collect skid data as well. Agencies need to conduct surveys to collect these pavement condition data. Our survey also revealed that most agencies conduct pavement condition surveys once every 3–5 years ( 31 ).
Environmental Data
For a sustainable PMS, it is important to consider environmental issues as these are linked to the performance of the pavement. Swarna et al. quantified the influence of Canadian environmental changes on pavement performance ( 32 ). This study concluded that temperature and precipitation are the significant factors influencing pavement distresses, such as asphalt concrete rutting, bottom-up fatigue cracking, and subgrade rutting, which leads to reduced pavement service life ( 32 ). Environmental data may include the yearly average precipitation, pavement temperature, subgrade drainage conditions, freeze–thaw cycles, and so forth.
Cost Data
Agencies need to record the initial cost of construction, reconstruction, rehabilitation, and regular maintenance. Maintaining cost data are necessary for the following reasons ( 33 ):
To make a budgetary plan
To perform economic analysis on candidate projects
To prioritize candidate projects.
Policy Data
Local agencies need to be aware of the policy outlines and the updates on the policy. Policy data are essential to allocate funds and make budgets.
Process of Data Collection
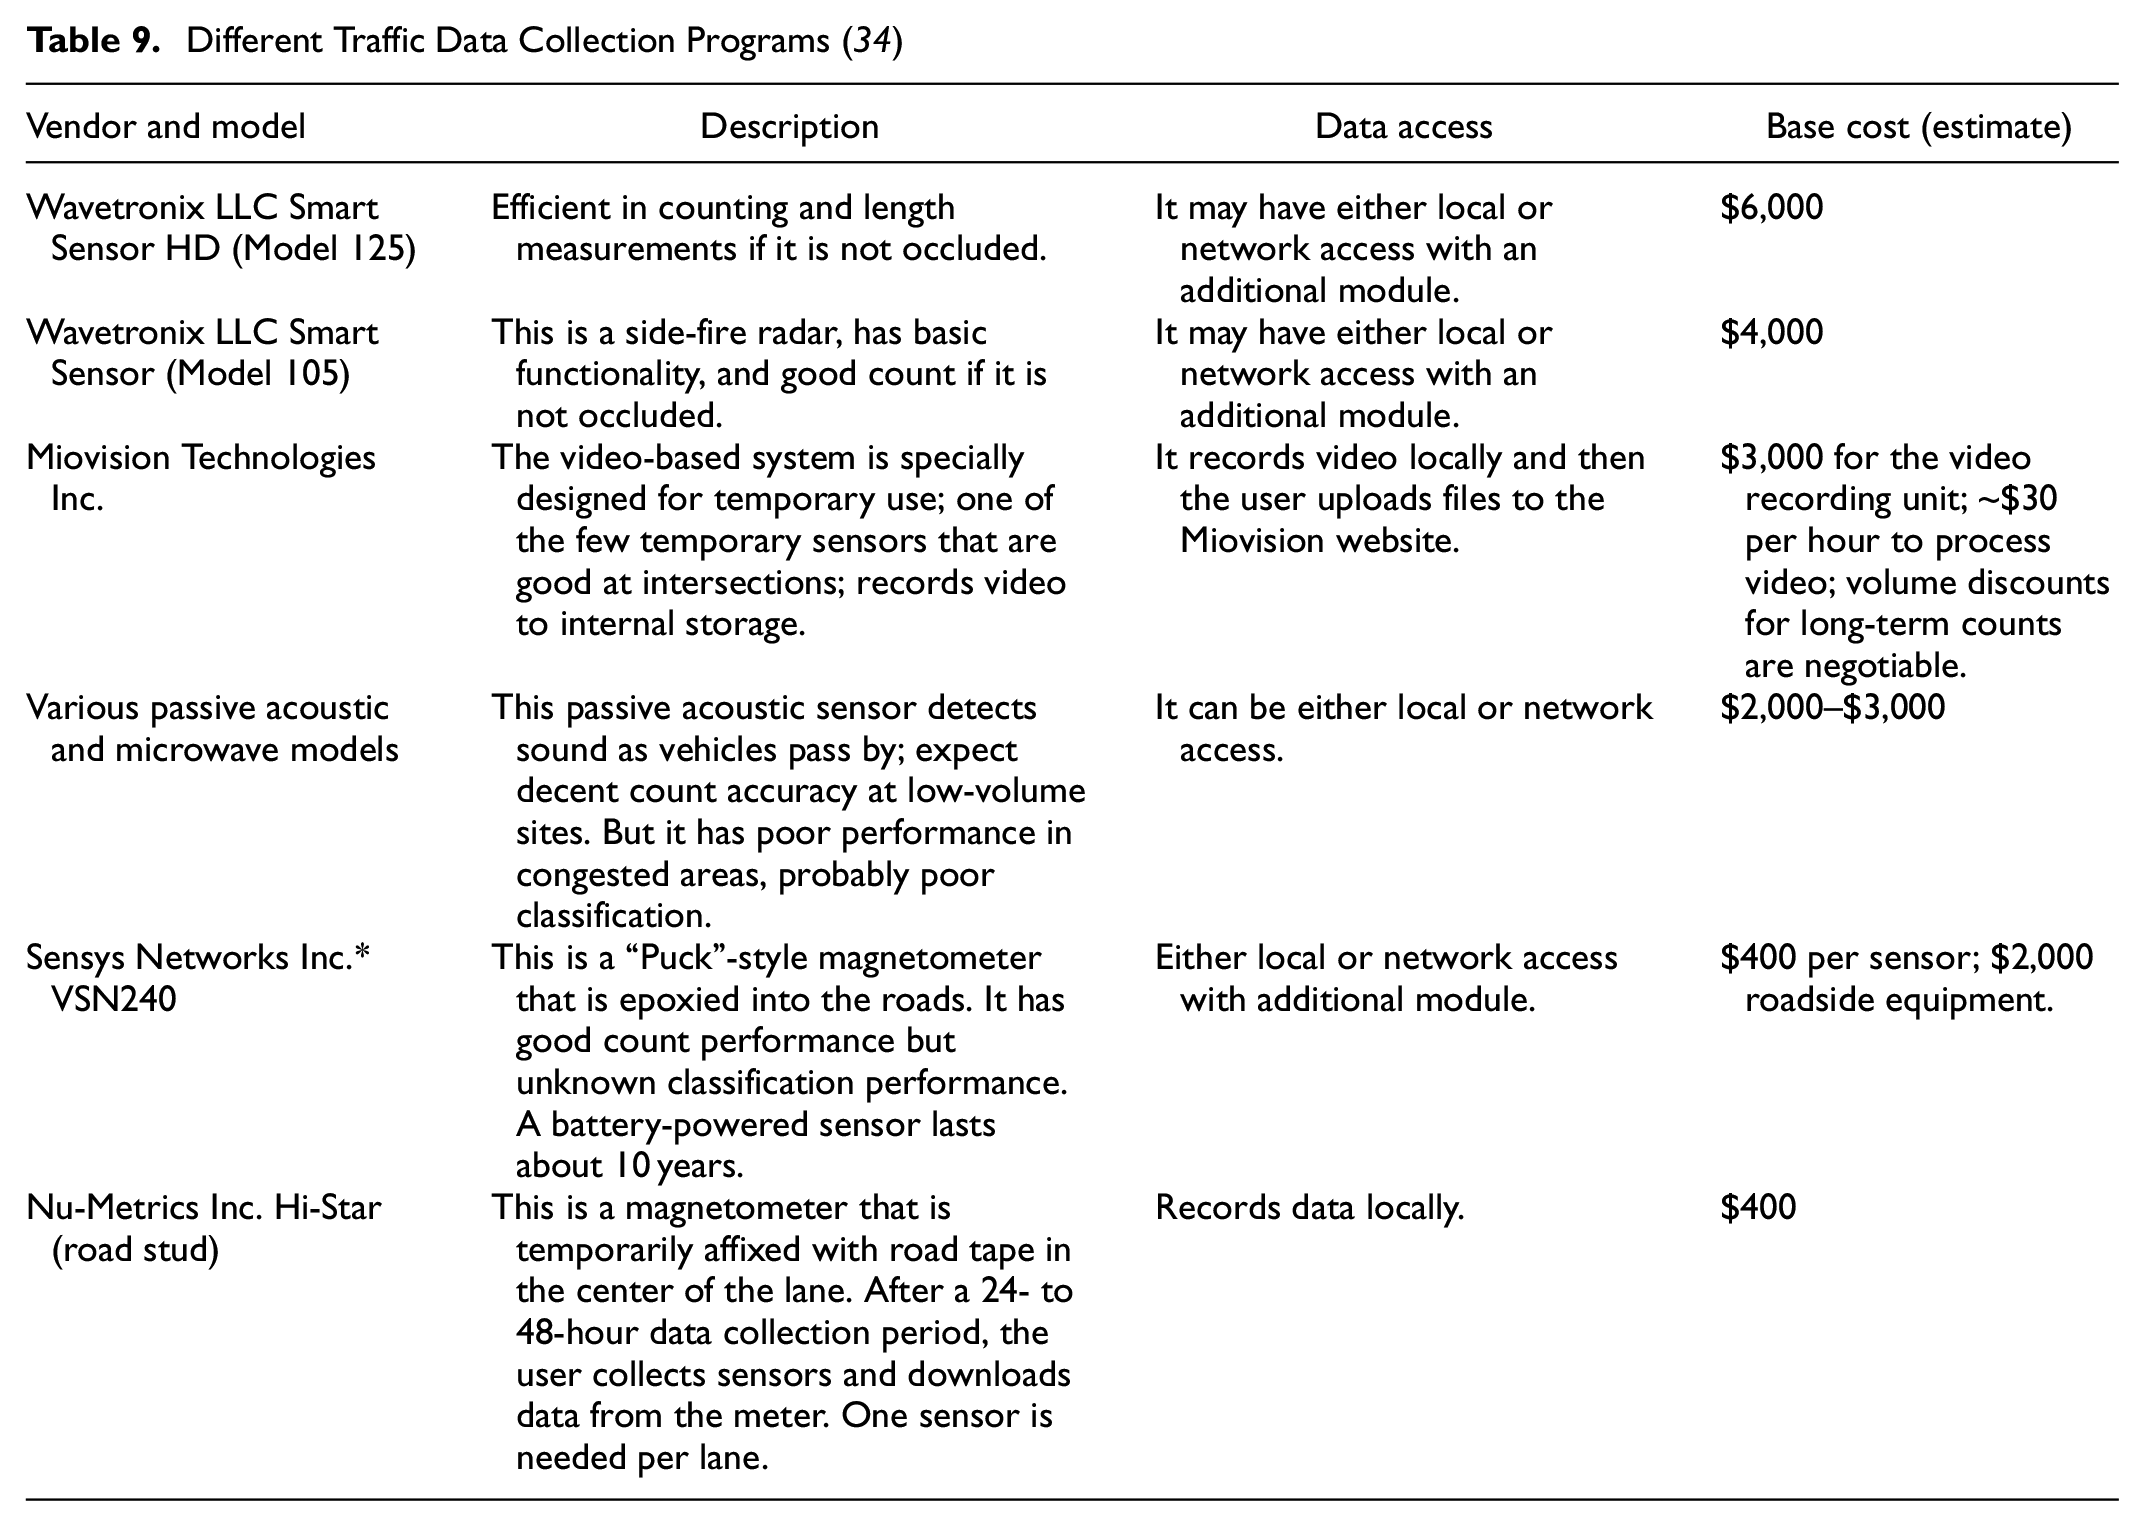
The types of data discussed in the previous sections need to be collected correctly and at the appropriate time. For instance, cost data can only be collected when new construction occurs, or a pavement section gets repaired. Some data need to be monitored continuously for some time to get a trend. Traffic data need to be monitored in this way to produce a comprehensive traffic trend. Table 9 represents some models and affordable programs that local agencies can use to achieve traffic data ( 34 ).
Different Traffic Data Collection Programs ( 34 )
Pavement Performance Evaluation
According to the Canada-wide pavement management survey responses, local agencies generally collect surface distress data, followed by structural condition data and roughness data ( 31 ). Surface distress data is the most widely collected data type for several reasons. First of all, these data are easy to collect. There are specific guidelines for collecting different distresses from different pavement surfaces. Second, it is inexpensive. Surface distress data can be collected manually with a piece of paper, and simple equations can calculate a performance index. In the Canada-wide pavement management survey, municipalities were asked what index they use to express their pavement performance. PCI was found as the most commonly used pavement performance index adopted by the local agencies for their low-traffic roads in Canada.
PCI
PCI is a measure of pavement surface condition. It ranges between 0 and 100; 0 represents a failed pavement, and 100 represents a perfect pavement. PCI is a method in which observation is subjective. Observers are given a set of pavement distresses (basically cracks and rutting) to evaluate from two aspects. One is density, and the other is severity. Density depicts how frequently the distress is noticed on the pavement section, and severity represents the extent of that particular distress. Agencies need to set up a minimum PCI value that represents pavement in a serviceable condition. Based on this, PCI value agencies then decide on maintenance programs. However, the decision on PCI score may depend on the class of road and the type of pavements. Table 10 shows a typical PCI range and general decision matrix.
Typical Pavement Condition Index Range and Recommendations ( 35 )
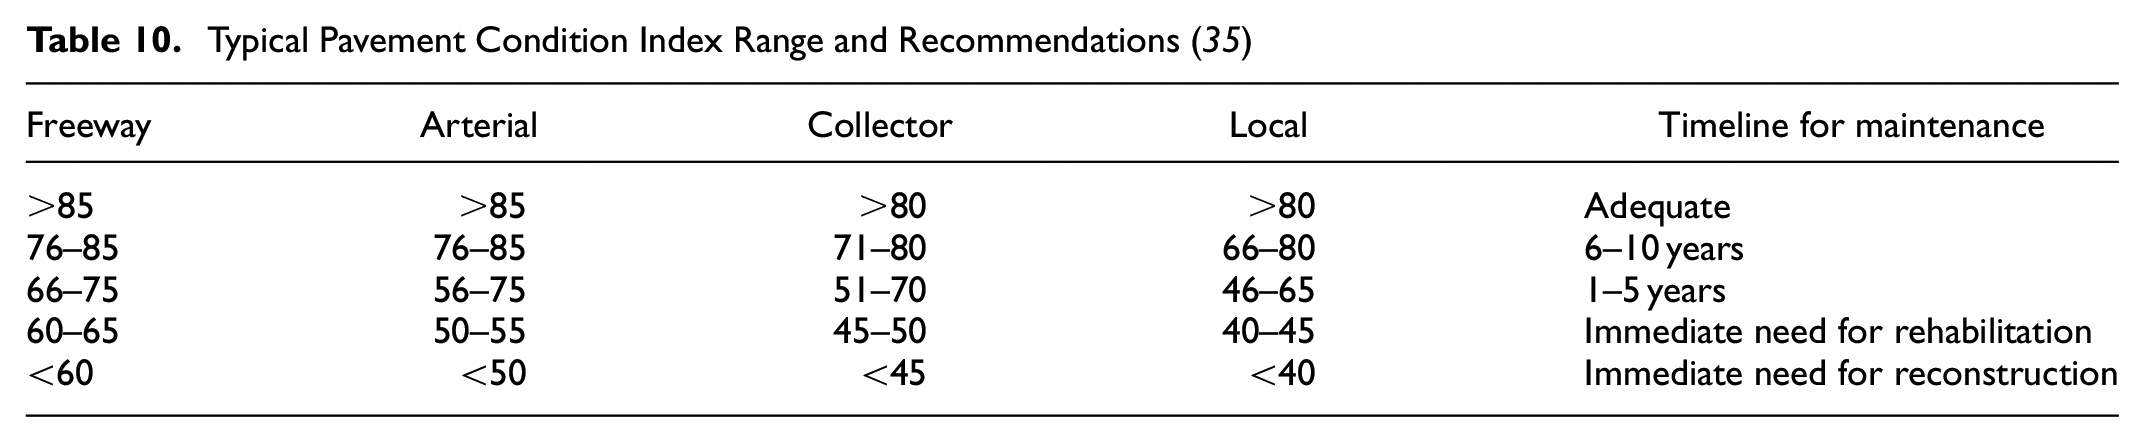
Local agencies in Canada can choose to adopt already developed performance indices like PCI or something similar to manage their roads. Staff experience and engineering judgment can also be considered. However, a meaningful performance index always helps to make a better decision.
PaveIndex
Agencies that lack human and other resources may utilize road users’ feedback to develop a pavement performance model. For example, many municipalities in Newfoundland and Labrador are run by volunteers as there are not enough people to operate municipality offices. In that case, road users’ feedback can be utilized to develop a pavement performance model ( 36 ). An approach to this type of model has been described in a journal. In the model, the road users from municipalities of Newfoundland and Labrador were asked to rate the overall condition of their municipality road network from a scale ranging from “Excellent” to “Very poor.” Based on the response, participants were then shown five commonly found pavement distresses (potholes, longitudinal crack, transverse crack, alligator crack, and rutting) and asked how frequently they would observe those distresses. For rating the density of the pavement distress, the participants were given four density levels: “No distress,”“Intermittently,”“Frequently,” and “Very frequently.” Density scale “No distress” meant that a particular type of distress was not present on the pavements, “Intermittently” meant that distress was present in a nominal amount, “Frequently” meant the distress was twice as visible compared with the “Intermittently” scale, and the “Very frequently” scale considered that distress was three times more visible when compared with “Intermittently” scale. A brief guideline on how to rate those distresses was also attached with the survey questionnaire. If a participant selected “Excellent” as the overall condition, then they were not shown any distress on the assumption that the road network within their municipality was in perfect condition. On the contrary, if a participant selected “Good,”“Average,”“Poor,” or “Very poor,” they were shown five different pavement distresses and asked to rate them as per the density scale mentioned before. Then a logistic regression model was developed considering overall condition as the response variable and different distress densities as predictor variables. For the analysis, overall condition “Average” and above were considered as “Acceptable” conditions, and below-average condition such as “Poor” and “Very poor” were considered as “Unacceptable” condition. Table 11 presents the assumptions. Please note that first two columns (Model output and Overall condition level) are correlated and the last two columns (Considered distresses and Distress density level for each distress) are just individual information shown in one table.
Response and Predictor Variables for the Logistic Model
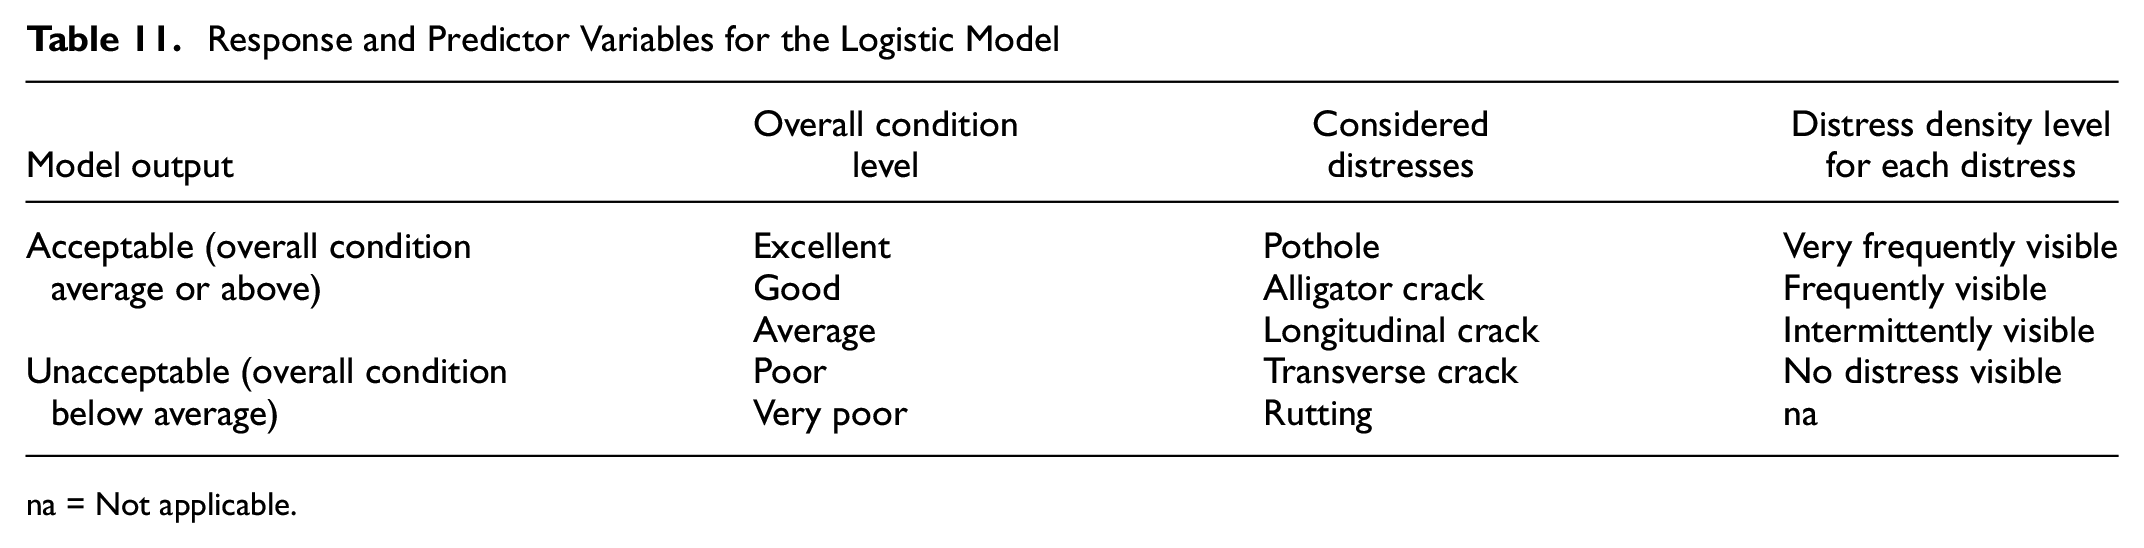
na = Not applicable.
There were 295 responses received, which were then split into a 70:30 ratio; 70% was considered as a training dataset. The logistic model was developed using the training dataset, which provided the following equation:

where P(Acceptable) represents the probability of getting an “Acceptable” condition. P(Acceptable) can be called PaveIndex. A PaveIndex value 0.50 or higher represents an “Acceptable” condition, and smaller than 0.50 means an “Unacceptable” condition. To validate the model, 30% of the response data was used as a test dataset. The overall accuracy of the model was found to be 75.6%.
Pavement Performance Prediction Model
Agencies need to have a tool or software or a model that can predict pavement performance over time. This helps agencies to allocate funding for a future project and carry out maintenance operations in time. As discussed in the literature review section, prediction models can be broadly divided into two: deterministic and probabilistic. Deterministic models work well when adequate data are available. Deterministic models can precisely predict pavement performance or condition because this approach considers historical data relevant to pavement performance. Deterministic models are suitable when comprehensive data are available. There are plenty of deterministic models implemented in many agencies.
On the contrary, probabilistic approaches do not require much data. For example, the Markov transition matrix can predict the future stage of a pavement section. In this process, pavements need to be categorized in a group or family based on pavement age, surface type, maintenance history, and so forth. Considering the overall condition of a pavement group, the next stage of the condition can be determined using probability function and expert opinion. Moreover, the Markov model is straightforward to develop and can be developed in a spreadsheet. Budget- and resource-restrained agencies can adopt such a model to forecast their maintenance requirements.
Another popular approach that many agencies are now adopting is Bayesian models. Both objective and subjective data are combined in these models. The variables used in the model are described in relation to probability distributions ( 37 ).
Some agencies have adopted completely subjective models, which sometimes can be referred to as expert opinion-based models. The approach to this kind of model is similar to the deterministic model, except that the relationship between the dependent variable and the exploratory variable is based on expert opinion rather than historical data.
Priority Program for Maintenance and Rehabilitation
Agencies need to prioritize their roads and pavement sections to carry out maintenance and rehabilitation works. From the Canada-wide pavement management survey, it was found that most of the local agencies in Canada adopted a comprehensive optimization approach, followed by a mathematical program-based optimization model ( 31 ).
Agencies can also consider the Analytical Hierarchy Process (AHP) to prioritize road sections for maintenance. AHP has been a popular methodology used by many pavement management agencies because it is simple, and implementation is easy. There is plenty of software that can execute AHP efficiently. Moreover, AHP can also be developed in a spreadsheet like Microsoft Excel. The methodology and its application in the local road priority program are discussed in the following section.
AHP is a hypothesis of relative estimates for sorting and analyzing complex decisions based on math and psychology ( 38 ). It was developed by Thomas L. Saaty in the 1970s. The methodology has been refined since then. AHP depends on eigenvector strategies generally applied to set up the overall weights for various measures ( 39 ). AHP decides the weights for every standard by implying a relative significance score between standards. The last weighting is then standardized by the most extreme eigenvalue for the matrix to limit the effect of irregularities in the proportions. The strategy is outlined in the accompanying steps.
Let us assume
Let A = (

where
The term
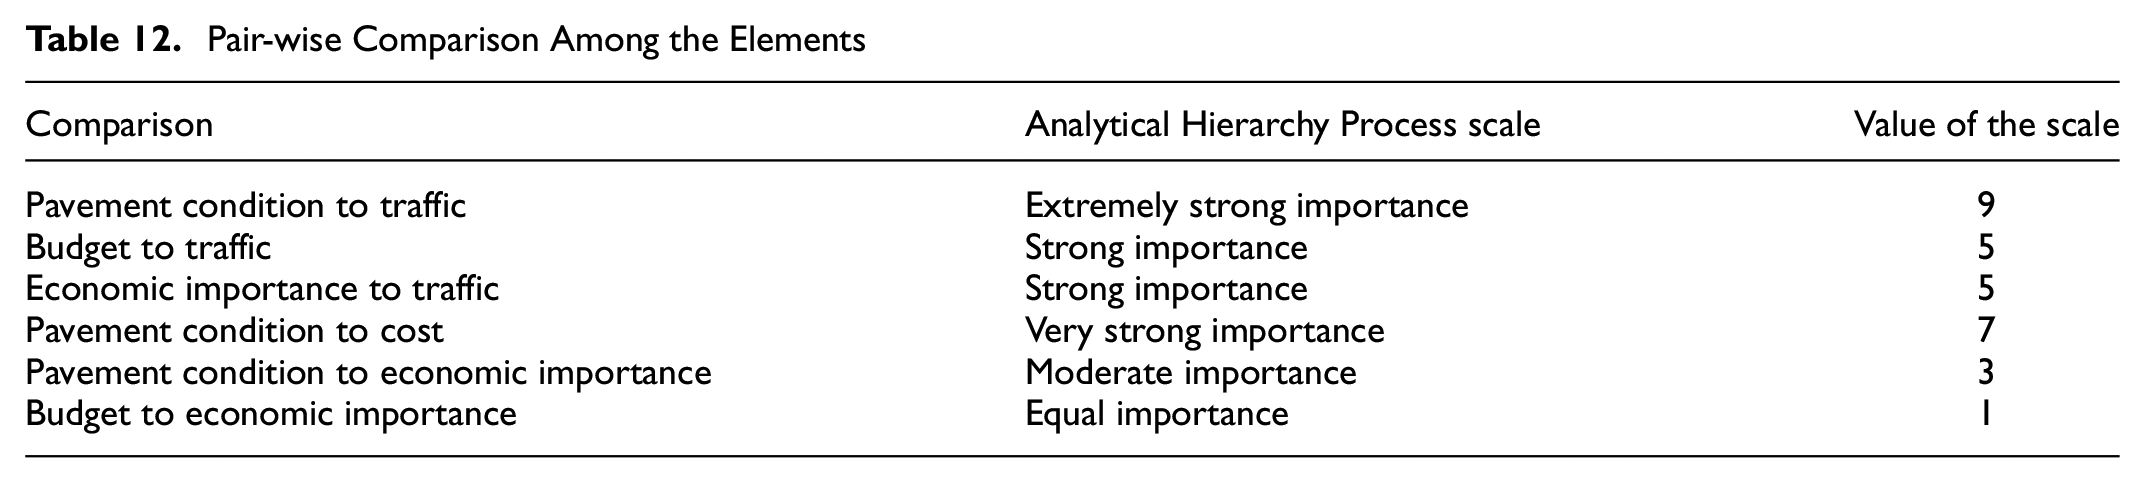
Studying the Canada-wide survey responses and road users’ feedback, the following parameters have been identified for this process:
Traffic, which is considered as the function of service population and safety
Pavement condition, which is the function of both safety and reliability
Economic importance
Project cost.
Table 12 represents a sample pair-wise comparison matrix. However, agencies should consider expert opinion in this regard.
Pair-wise Comparison Among the Elements
Summary and Conclusions
This study utilized an extensive literature review on the PMS, a Canada-wide pavement management survey, and road users’ feedback from the municipalities of the province of Newfoundland and Labrador to propose a pavement management framework for resource- and budget-constrained regional agencies. Though the framework is proposed in the Canadian context, it can also be suitable in other countries. The study has been summarized and concluded as follows:
The Canada-wide pavement management survey provides a complete overview of the regional PMS of Canada. Based on 41 responses from nine different provinces, the survey reveals that: LVR should be considered as fewer than 500 vehicles per day; PCI is the most commonly used performance index; comprehensive optimization model is the most popular priority program; for predicting pavement performance, regional agencies rely either on the vendor’s model or the contractor’s evaluation.
A pavement management system score (PMS score) was developed using the Canada-wide pavement management survey responses. This is completely a new concept, and the score helps to understand an agency’s ability from the pavement management perspective.
A minimum value for the PMS score has been determined. This score has been calculated considering the minimum subjective and objective resources an agency needs to afford a working PMS. This score can provide an overview of an agency’s affordability.
The proposed PMS framework consists of five main components: a referencing system, a PMS database, a pavement performance index, a prediction model, and a priority program.
For referencing road networks, a budget-constrained agency can use a simple manual referencing method, for instance, the node-link method.
PMS databases depend on the agency’s objective and scope. However, a regional agency must collect pavement surface conditions and traffic data to manage their roads better.
A budget-constrained agency should adopt an objective measure of pavement performance. But if they cannot afford to have an objective model, then at least a subjective model needs to be considered. Although subjective measures are never 100% accurate, they are cost-effective. A newly developed pavement performance index, namely PaveIndex, has been introduced in this paper. PaveIndex is very easy to adopt, takes very little technical expertise, and costs nothing. With proper training given to volunteers or the municipality residents, the management agency can have a tentative idea of their respective road networks in PaveIndex.
Regional agencies can adopt a priority model that has already been developed in their respective province; else, a simple method like AHP can be adopted, which has been discussed earlier in the paper.
The overall study proposes an economic pavement management framework for budget- and resource-constrained regional agencies. The components of the proposed framework are easily adaptable, and the implementation cost is minimal.
Footnotes
Author Contributions
The authors confirm contribution to the paper as follows: study conception and design: K. Hossain, S. Guha; data collection: S. Guha; analysis and interpretation of results: S. Guha, K. Hossain; draft manuscript preparation: S. Guha, M. Lawlor, K. Hossain. All authors reviewed the results and approved the final version of the manuscript.
Declaration of Conflicting Interests
The author(s) declared no potential conflicts of interest with respect to the research, authorship, and/or publication of this article.
Funding
The author(s) received no financial support for the research, authorship, and/or publication of this article.