
Abstract
Field ageing gradients of bitumen samples recovered from 14 asphalt road sections were investigated via rheological and chemical characterizations and statistical analysis. The effects of air voids and environmental factors on the ageing gradient were evaluated using the field ageing and climate data. The effectiveness of the pressure ageing vessel (PAV) test was assessed in accelerating the bitumen’s long-term ageing by comparing with the field ageing data. Critical factors for field ageing were identified using statistical methods. A statistical model for the Glover-Rowe (G-R) parameter was formulated and verified by incorporating the screened key factors. Results indicate that a threshold air void content (around 6%) exists in differentiating the field ageing gradient patterns in the asphalt pavements. An increasing tendency is observed between the ageing gradient and annual days below 0°C. The chemical indices, stiffness-related indices, and G-R parameter can quantify the field ageing gradient of asphalt pavements. The PAV test can condition the bottom slices’ bitumen to the same ageing level as that in a pavement depth of 0.5–2 cm after 8 years’ field service. Pavement service life, binder content, minimum temperature, days above 32°C, and days below 0°C are the critical material and environmental factors that significantly affect bitumen’s complex shear modulus, crossover frequency, G-R parameter, and ΔTc. The statistical model is verified with an acceptable mean absolute error of 28.1% and a R2 value of 0.95.
Keywords
Ageing of asphalt pavements causes bitumen’s hardening and embrittlement, leading to a performance deterioration of the asphalt pavements. The accumulated ageing in the asphalt layer will increase the elastic stiffness and relaxation time of the viscoelastic bitumen, resulting in higher stresses and in pavements more susceptible to fatigue damage and thermal cracking ( 1 ). Over the long term, ageing of asphalt pavements is mainly caused by the oxidation of the bitumen and produces two major oxidized products, carbonyl and sulfoxide. The pavement ageing resulting from long-term oxidation is primarily controlled by the properties of the asphalt mixtures and pavement structures (e.g., air voids, binder content, pavement thickness, ageing kinetics) and environmental conditions (e.g., temperature, solar radiation, precipitation) ( 2 – 4 ). Thus, long-term ageing in asphalt pavements has been one of the kernel performances that required in-depth understanding and accurate characterization.
Considerable efforts have been focused on evaluating the ageing behavior of bitumen and asphalt mixtures ( 5 – 9 ). However, most existing studies used laboratory ageing methods such as the rolling thin film oven (RTFO) test and pressure ageing vessel (PAV) test to simulate the short-term and long-term ageing of bitumen in the field. As mentioned above, the bitumen/asphalt pavement ageing is triggered by a combination of factors, so the actual field ageing may not be properly simulated in the laboratory. Because of the high cost of obtaining field samples and monitoring the long-term (e.g., 8 to 20 years) performance of asphalt pavements, investigations into the field ageing of asphalt pavements are limited in the literature, thus being insufficient to provide a thorough understanding of long-term ageing behavior under field conditions ( 1 , 10 – 14 ). Furthermore, the effects of climate conditions on long-term field ageing are unclear too. One reason is that obtaining the long-term climate data for field road sections with monitored ageing performance is sometimes a challenging task. Another reason is that most of the existing studies collected the field data in limited road sections within one or two specific climate regions. This has restricted their findings’ applicability in different climate conditions. To address these limitations, this paper collects field cores and associated climate data from nine European and African countries in different climate regions. This study will analyze these field ageing data associated with climate information to provide a reliable and in-depth understanding of the field ageing of asphalt pavement materials.
To study the field ageing gradient or non-uniform ageing of bitumen in asphalt pavements, a common practice is to slice the field cores into thin layers along the vertical pavement depth and measure the chemical or ageing properties of the bitumen recovered from the sliced layers ( 1 , 11 ). The same coring and slicing approach will be utilized in this paper. However, the ageing gradient is defined as two parts: (a) a macroscale ageing gradient that is along the vertical pavement depth; and (b) a mesoscale ageing gradient that changes with the thickness of the bitumen mastic coating film to the aggregates ( 15 , 16 ). Once the bitumen is extracted and recovered from the field cores, laboratory tests are available to characterize its physical, chemical, and mechanical properties. One existing study concluded the evolution of chemical indices (carbonyl, ether, ester, and sulfoxide) versus ageing durations and verified the ageing kinetics model’s validity to predict carbonyl change using field data ( 17 ). In addition, the variation of rheological properties (complex shear modulus, viscosity, non-recoverable compliance, and percentage recovery) along the vertical pavement depth caused by field ageing have also been investigated in the current literature ( 18 , 19 ). As can be seen, the mainstream approach is to simply present the diagrams of the different indices versus one variable (e.g., pavement depth or ageing duration), while the relationships between various indices and the screening of the critical influence factors are currently missing. Statistical methods including multivariate analysis of variance, principle component analysis, and response surface methodology would be beneficial when facing a range of variables and are already used in the field of pavement engineering ( 20 – 22 ). In this paper, statistical analysis is implemented for: (a) identifying the key factors (including materials properties and environmental factors) affecting the bitumen’s field ageing; and (b) establishing a statistical model for asphalt pavements’ long-term ageing performance incorporating the key influence factors of field ageing.
In summary, this paper is focused on an experimental and statistical investigation of bitumen’s long-term field ageing for asphalt pavement sections in different climate regions. Field cores from 14 road sections of nine European and African countries and the corresponding climate data are first collected. Then field samples are sliced into thin layers along the vertical pavement depth for the extraction and recovery of the bitumen. Subsequently, the recovered bitumen is subjected to rheological and chemical tests in the laboratory. The significance of various factors is discussed in relation to their effects on the field ageing and an ageing performance model is calibrated and verified using a statistical analysis of the field ageing and climate data.
Objectives
There are two primary objectives of this paper:
To investigate the bitumen’s long-term field ageing gradient in the asphalt pavements of different climate regions.
To identify the key material and environmental factors affecting the field ageing and develop the statistical relationships between them.
Materials and Methodologies
Materials
Field cores were collected from 14 road sections of eight European countries and one African country, as shown in Figure 1. Most of the cores were taken between the wheel path. For the CZ and FR2 sections, they were collected from the side of the road and along the racetrack, respectively. For the BE and HU sections, the cores were taken in a small part of the road (within a few meters). The diameter of field cores varied between 90 and 150 mm, except for IRL section, where it was 200 mm, as this section contained large aggregates. The thickness of field samples varied between 100 and 200 mm. The field cores were then sliced into thin layers along the vertical pavement depth and the bitumen was recovered from each layer for laboratory tests. The thickness of the top and second from top slices was 5 mm and the remaining lower slices were 1 cm in thickness. Exceptions include two sections (FR1 and IRL) where the thickness of the top slice was 1 cm because of the aggregate size and human factors. Depending on the thickness of the asphalt layers, the total number of slices varied between two and five for each road section. Bitumen recovery was conducted according to EN 12697-3, with an automated asphalt analyzer and trichloroethylene as the solvent. Table 1 shows the detailed information and measured data of the selected asphalt pavement sections and field samples. It should be noted that the bitumen recovered from the bottom slices of four sections (HU1, UK, BE, and HR) were further subjected to the PAV test (standard conditions with 20 h ageing time, 100°C, and 2.1 MPa) to conduct a comparative analysis between the field ageing and laboratory ageing procedures.
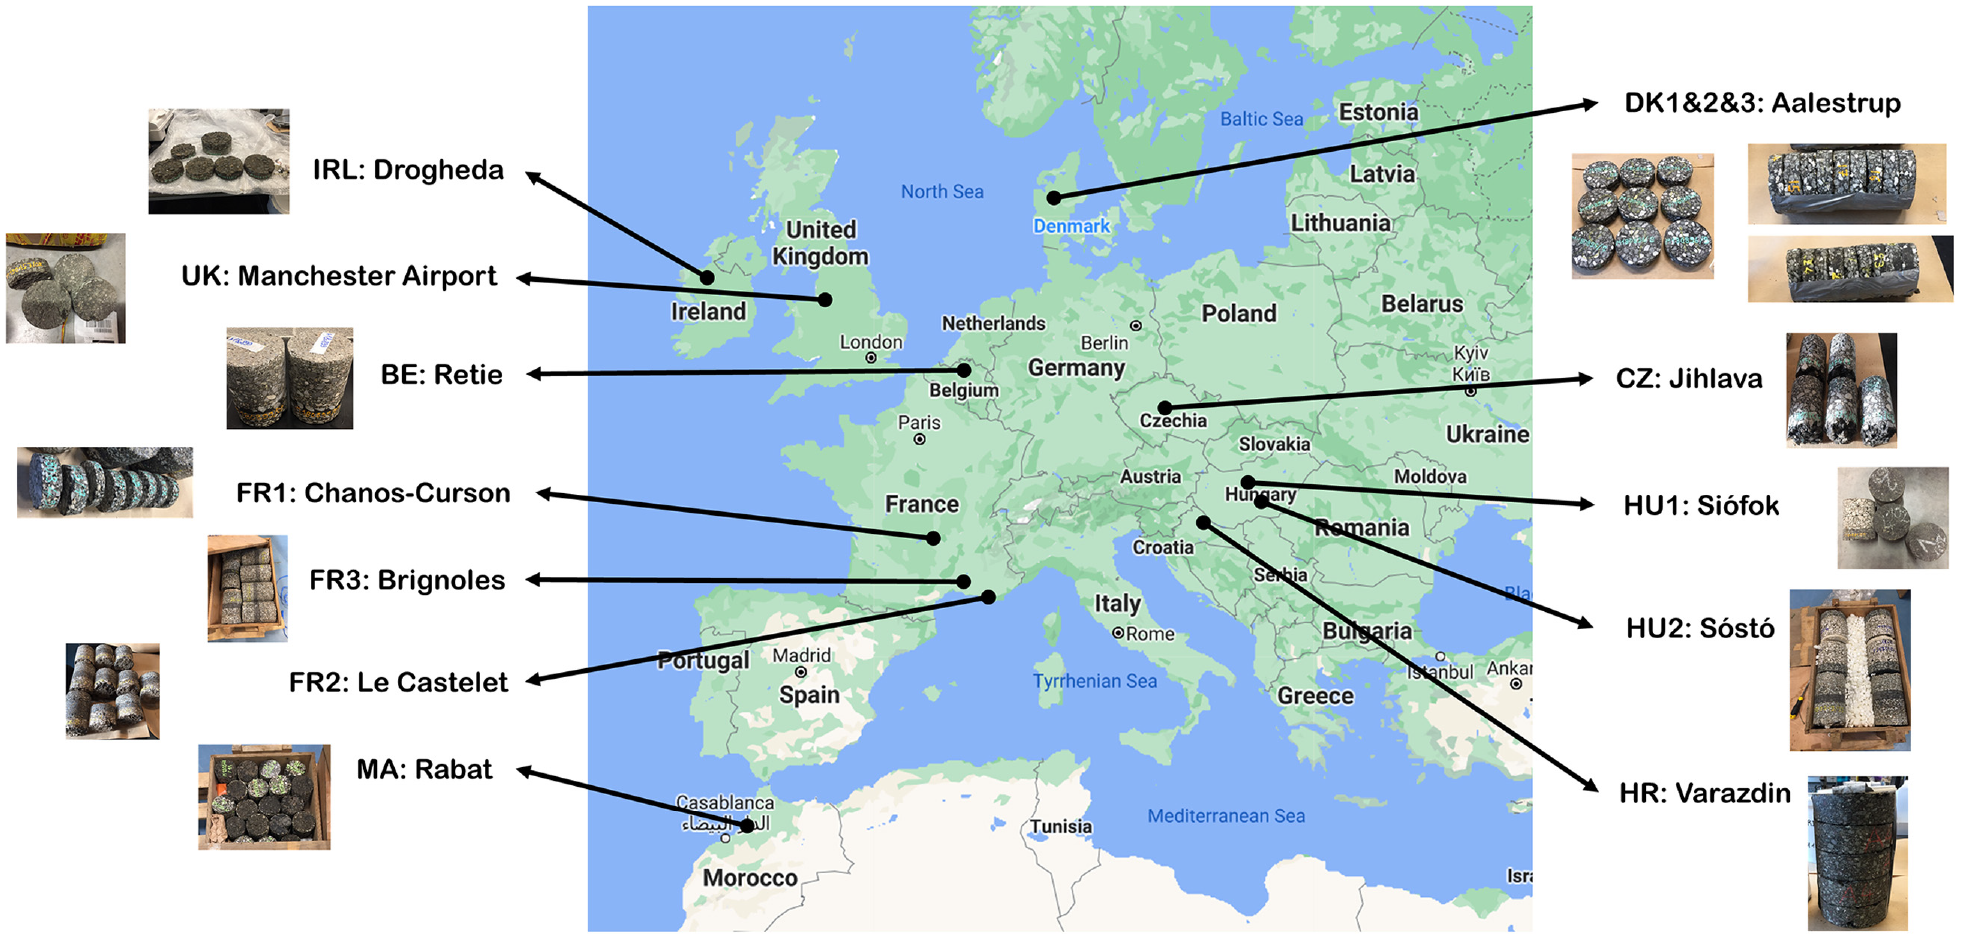
Geographical distribution of the road sections
Properties of Road Sections and Field Samples
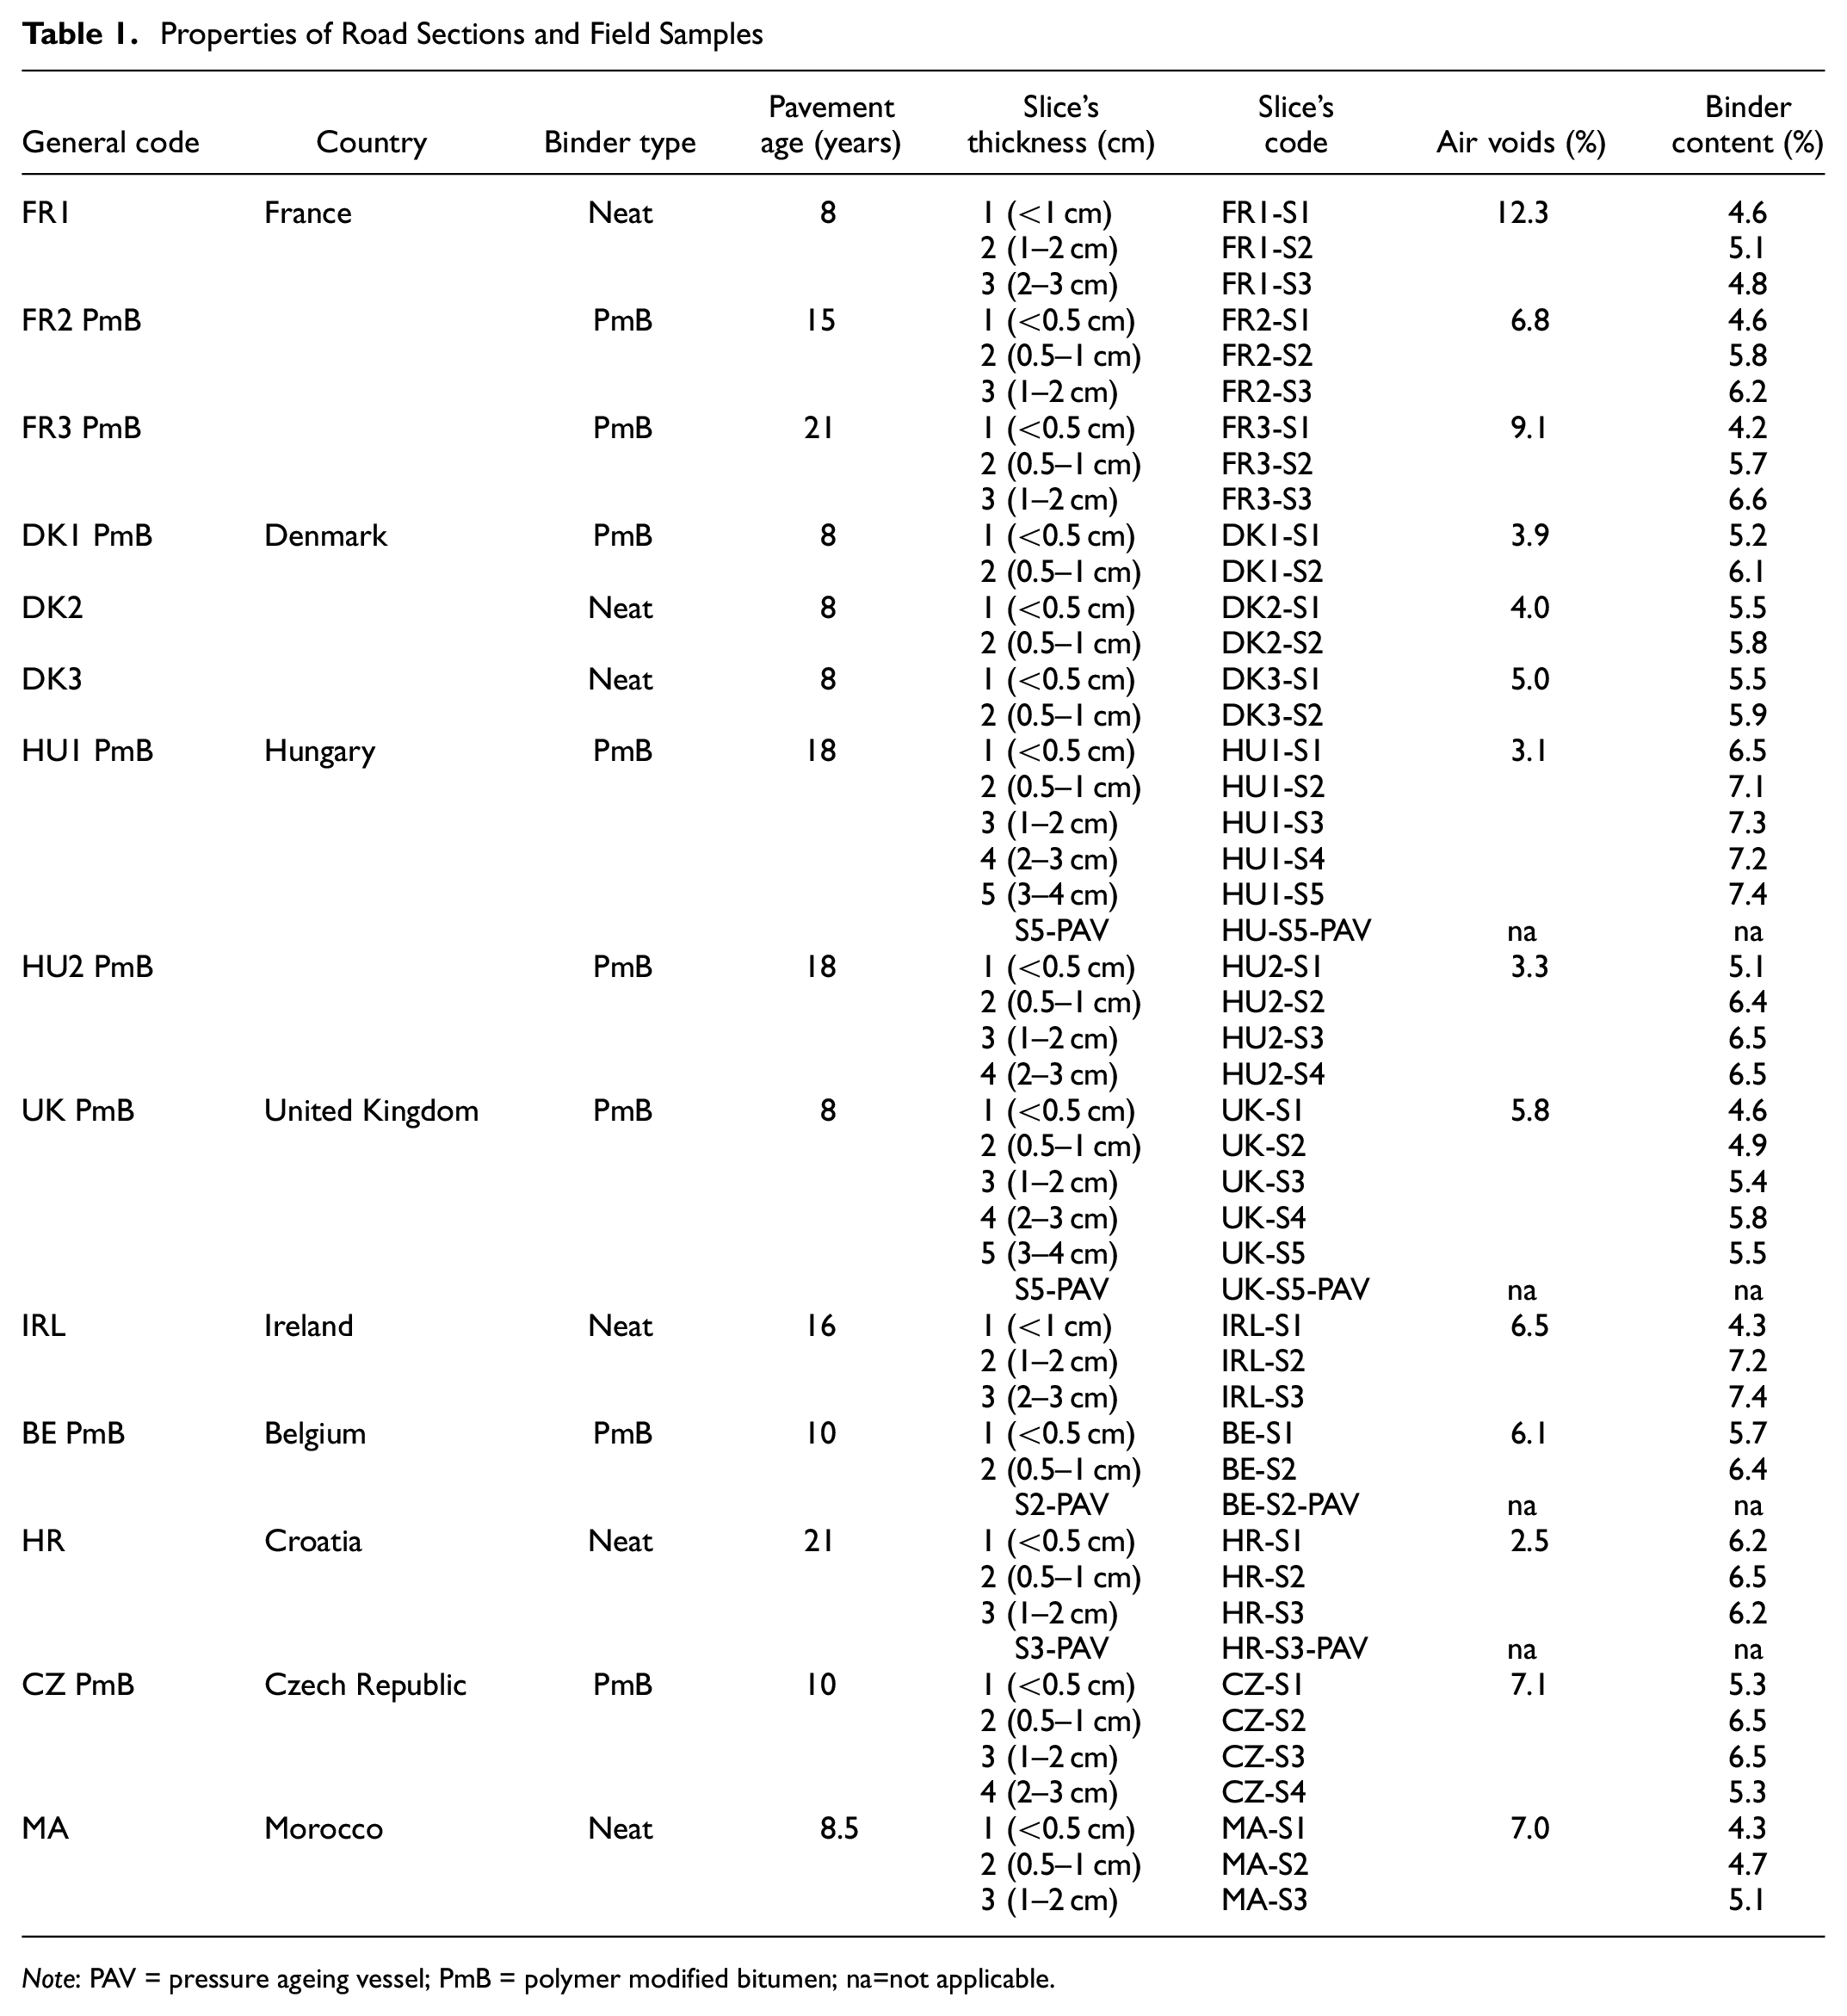
Note: PAV = pressure ageing vessel; PmB = polymer modified bitumen; na=not applicable.
Climate Data
To explore the environmental effects on bitumen’s field ageing, 20 years’ (from 2001–2020) climate data were collected for the road sections in Table 1. The climate data sets are available in the Climate Tool at the Long-Term Pavement Performance (LTPP) database. They were collected initially from the National Aeronautics and Space Administration (NASA) for the project Modern-Era Retrospective analysis for Research and Application, Version 2 (MERRA-2). In this paper, the temperature-related data were selected as field ageing is more sensitive to temperature than to other environmental factors. Table 2 demonstrates the critical temperature-related data selected for the field asphalt pavement sections from 2001 to 2020. The days above 32°C and the days below 0°C are the criteria in the MERRA-2 data sets used to determine the high and low temperature durations of a region. Additionally, the climate data for three Denmark (DK1&2&3) road sections are the same because they are in one area.
Critical Temperature-Related Data of Road Sections from 2001 to 2020
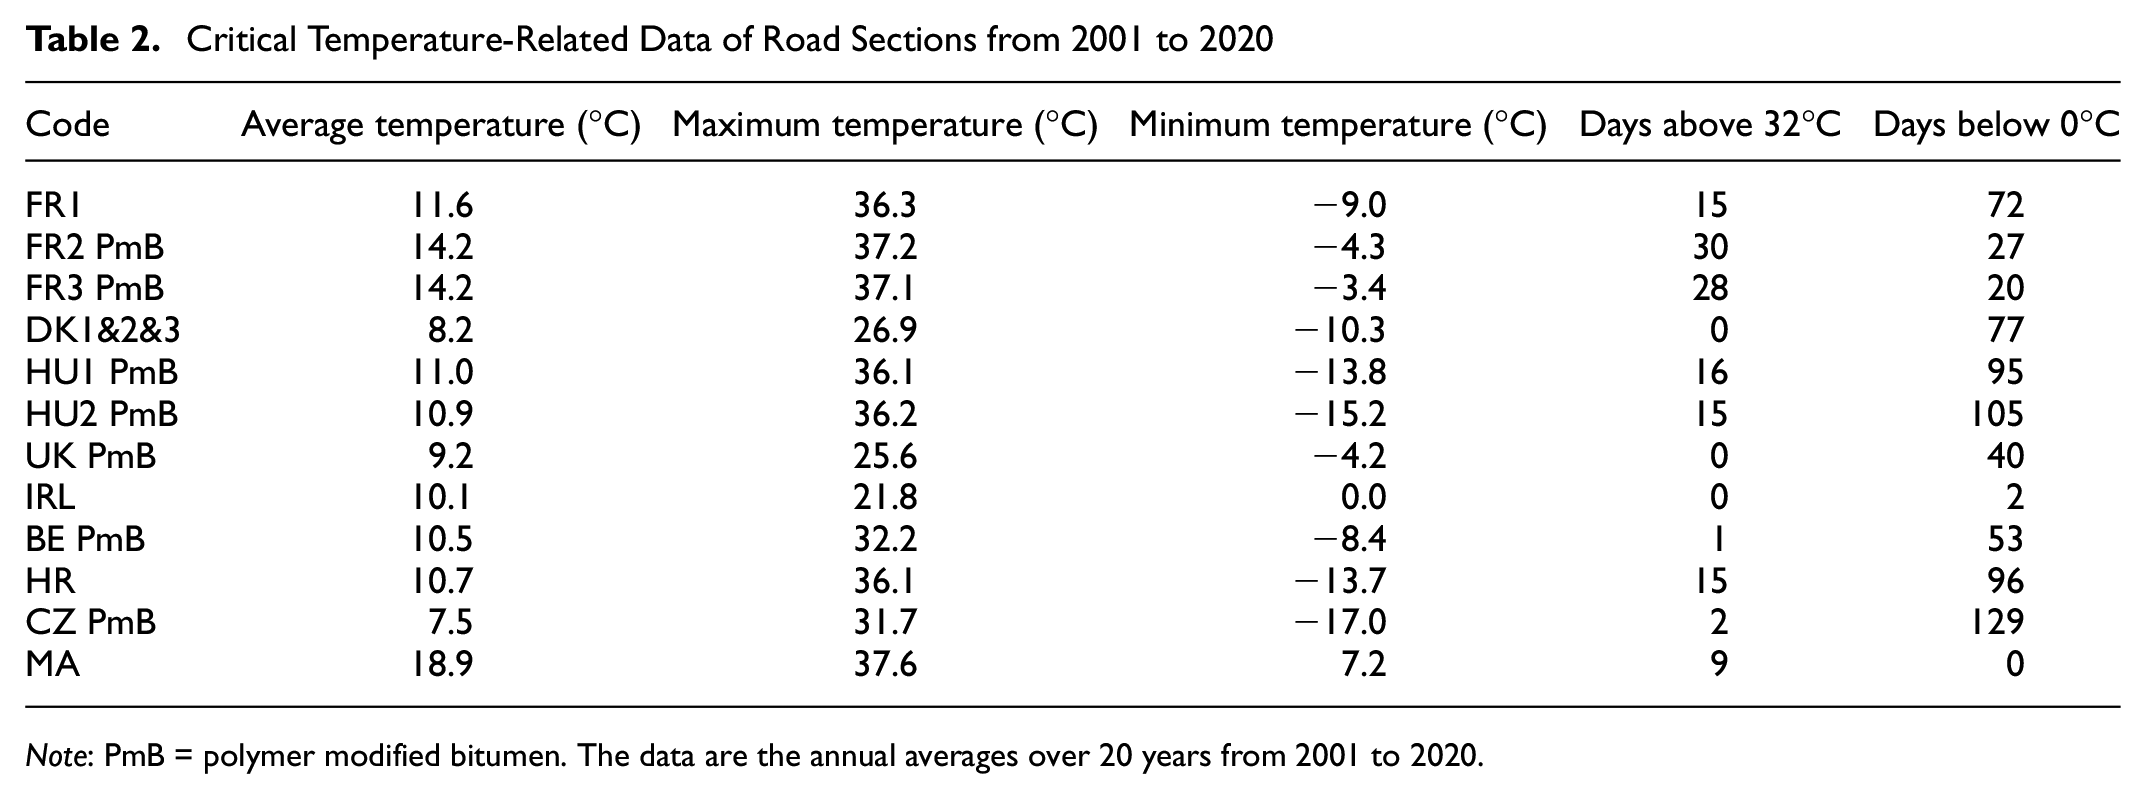
Note: PmB = polymer modified bitumen. The data are the annual averages over 20 years from 2001 to 2020.
The road sections were classified into different climatic regions, including dry-no freeze, dry-freeze, wet-no freeze, and wet-freeze, based on the annual amount of precipitation and freeze index according to the LTPP criteria ( 23 ). The freeze index is defined as the summation of difference between 0°C and mean daily air temperature when the mean daily air temperature is negative. The wet/dry threshold is at annual average precipitation of 508 mm and the freeze/no freeze threshold is at the annual average freeze index of 83.3°C ( 24 ). Table 3 shows the annual average precipitation, annual average freeze index, and the climate region classification for the 14 surveyed road sections based on the LTPP criteria mentioned above. This climate region classification of the surveyed road sections will be employed to investigate the climate effects on the long-term ageing of asphalt pavements in the field.
Climate Regions of Road Sections
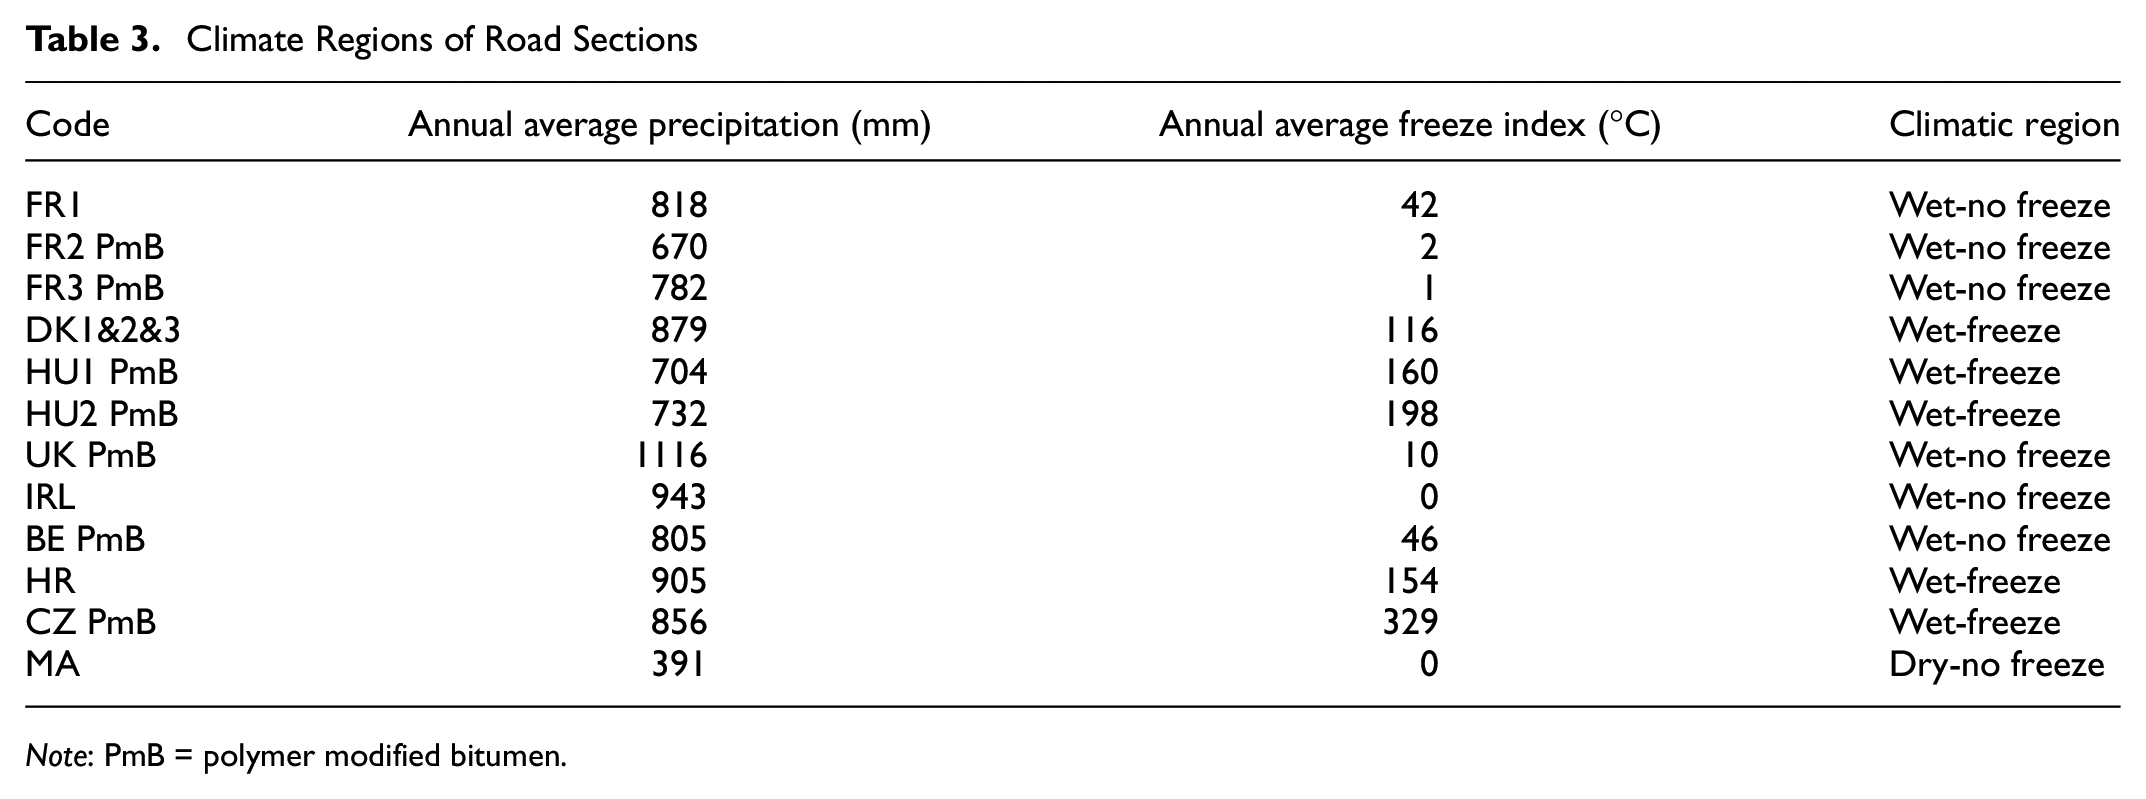
Note: PmB = polymer modified bitumen.
Laboratory Characterization
Rheological Test
Dynamic shear rheometer (DSR) was used to characterize the rheological properties of bitumen via frequency sweep tests. Three types of parallel plate (4, 8, and 25 mm) were used to cover a temperature range of −30°C to 90°C. Specifically, the 4 mm plate test was conducted in the −30°C to 10°C temperature range with a 6°C interval. The strain input was selected as 0.02% and the frequency range was from 0.01 to 10 Hz. For the 8 mm plate test, the testing temperature range was from 10°C to 50°C with a 10°C interval. The frequency range was from 0.01 to 10 Hz and the loading strain was 0.05%. For the 25 mm plate test, the temperature range was 50°C to 90°C with a 10°C interval and the frequency range was again 0.01 to 10 Hz. The strain amplitude was 1%. The three strain levels were selected considering the testing temperature and maximum torque of testing equipment to ensure the tests were conducted within the linear viscoelastic ranges of the bitumen. Subsequently, the RHEA™ software was used to construct the master curves and to derive various parameters to quantify the rheological, chemical, and ageing properties of the recovered bitumen, as detailed below.
Penetration, crossover frequency, R-value, G-R parameter, critical low temperature controlled by stiffness (LST), critical low temperature controlled by m-value (LmT), and the ΔTc were derived from the raw DSR results. Using the |G*| at 25°C and 0.4 Hz and Equation 1 ( 25 ), the penetration can be calculated to reduce the consumption of bitumen samples. Crossover frequency and R-value are the main factors of the Christensen and Anderson (CA) master curve model for fully characterizing any given bitumen’s rheological properties. Equation 2 shows the CA model’s definition ( 26 ). G-R parameter is a newly developed index to quantify the age-related cracking resistance of bitumen ( 27 ) and is defined as Equation 3.


where
R-value represents the difference between glassy modulus and crossover modulus in the logarithmic form (

where
LST, LmT, and ΔTc were originally obtained from a bending beam rheometer (BBR) test and used for evaluating the age-related cracking resistance at the low temperatures ( 27 ). On account of the precious nature of the field samples, the DSR data were used to derive these indices based on linear viscoelastic interconversion rather than conducting a BBR test that would consume a great amount of the bitumen samples ( 28 – 31 ). Before calculating, S (60 s) = 300 MPa and m (60 s) = 0.3 in the BBR test were replaced by G (60 s) = 143 MPa and m (60 s) = 0.28 in DSR results, in accordance with a white paper of the Western Research Institute ( 32 ). Then the LST, LmT, and ΔTc could be obtained by Equations 4 to 6.


where
Chemical Test
Fourier transform infrared (FTIR) spectroscopy was used as an effective tool to track the oxidative ageing of bitumen. The Nicolet IS 10, with a diamond cell and an attenuated total reflection setup, was used. The testing wavenumber range, repetitive scans, and resolution were 4000 to 500 cm−1, 32, and 4 cm−1, respectively. The formation and accumulation of carbonyl and sulfoxide are the two major oxidative products in the bitumen’s ageing process ( 33 ). Correspondingly, the carbonyl index (IC=O) and the sulfoxide index (IS=O) were determined from the FTIR results. A reference area (Aref) of the spectral bands is needed when calculating the two indices and the CH2 and CH3 functional groups were selected as the reference in this study. Table 4 shows the reference FTIR spectral bands and the equations for calculating the carbonyl index and sulfoxide index based on a recent research ( 34 ).
Functional Groups and Their Baseline Limits to Determine the Area of Index
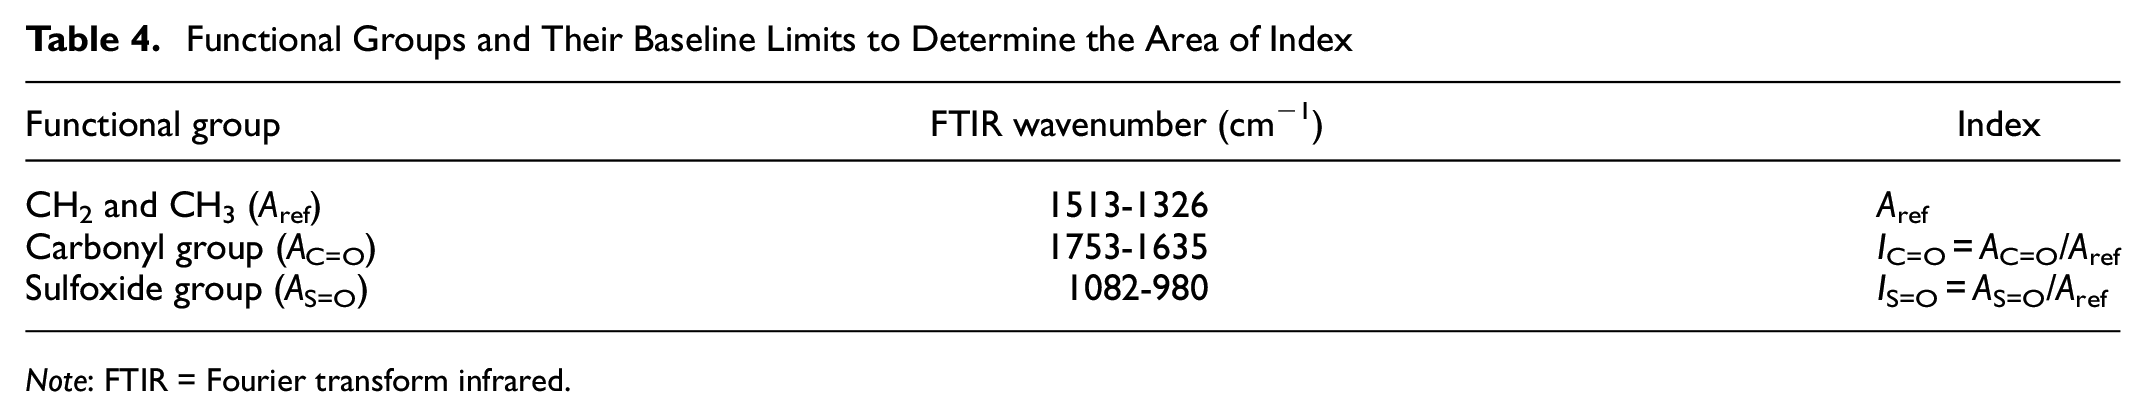
Note: FTIR = Fourier transform infrared.
Collections of Testing and Deriving Parameters for Experimental and Statistical Analysis
Various parameters were obtained from the field asphalt road sections, including experimental (rheological and chemical) indices, environmental factors, and mixture properties. These parameters were categorized into different groups based on their physical meanings as the following:
• Environmental factors: annual average temperature, maximum temperature, minimum temperature, days above 32°C, and days below 0°C.
• Mixture properties: service life, air voids, binder content, and pavement depth.
• Chemical indices: IC=O, IS=O, and IC=O+IS=O.
• Rheological indices:
○ Binder stiffness related: penetration, |G*| at 15°C and 0.005 rad/s, and LST.
○ Binder relaxation related: LmT, crossover frequency, and R-value.
• Performance indices: G-R parameter and ΔTc.
The sulfoxide index and the carbonyl index were reported to represent the short-term and long-term ageing according to the laboratory ageing procedures ( 35 ); however, it is unknown, after the long-term field ageing, whether the sulfoxide index will change significantly. Thus, the sulfoxide index and a combination of carbonyl and sulfoxide indices were also investigated in this paper. The G-R parameter and ΔTc were selected as the performance indicators because they correlated well with the pavement distresses and have thresholds for the critical ageing conditions. By varying the complex shear modulus |G*| and phase angle δ in black space diagrams, the G-R parameter becomes an effective index to quantify the cracking resistance of the bitumen at different ageing conditions ( 5 ). The G-R parameter has two thresholds (180 and 600 kPa) to represent the onset of cracking and severe cracking based on Kandhal’s ductility thresholds ( 36 ). For the ΔTc index, the threshold was −2.5°C based on the statistical relationship between the long-term observations of asphalt pavements’ cracking lengths and bitumen’s physical properties ( 27 ).
The above testing and collected parameters were further normalized when assessing the effects of material properties and climate conditions on the bitumen’s ageing gradient in the field. This is because: (a) the original (when constructing) bitumen’s properties were unavailable, so that it was necessary to find a reference base for comparison (in this study, the first slices’ bitumen samples of the field cores were selected as the reference); and (b) the original properties of the testing samples differed for different pavement sections, such that the changing rate or ageing difference of various evaluating indices (
Statistical Methods
One factor at a time (OFAT) method is a conventional and popular statistical approach to assess the effect of an explanatory variable on a specific dependent variable of the experiment. However, this approach is unable to provide information on the interrelationships of all involved factors. To study bitumen’s field ageing in asphalt pavements, it is vital to identify which explanatory variables are affecting the pavements’ age-related performance. In this study, a multivariate analysis of variance (ANOVA) was conducted to discriminate which dependent variables are sensitive to the explanatory variables and which explanatory variables are the primary influence factors. Subsequently, a multiple nonlinear regression method was employed to establish the performance statistical model incorporating the key factors from those screened by the multivariate ANOVA. Additionally, the collected data were divided into two groups for model calibration (30 data sets) and verification (10 data sets), respectively. The software used in this paper was IBM SPSS Statistics 25.
A flowchart is presented in Figure 2 to show the experimental and statistical analysis procedure.
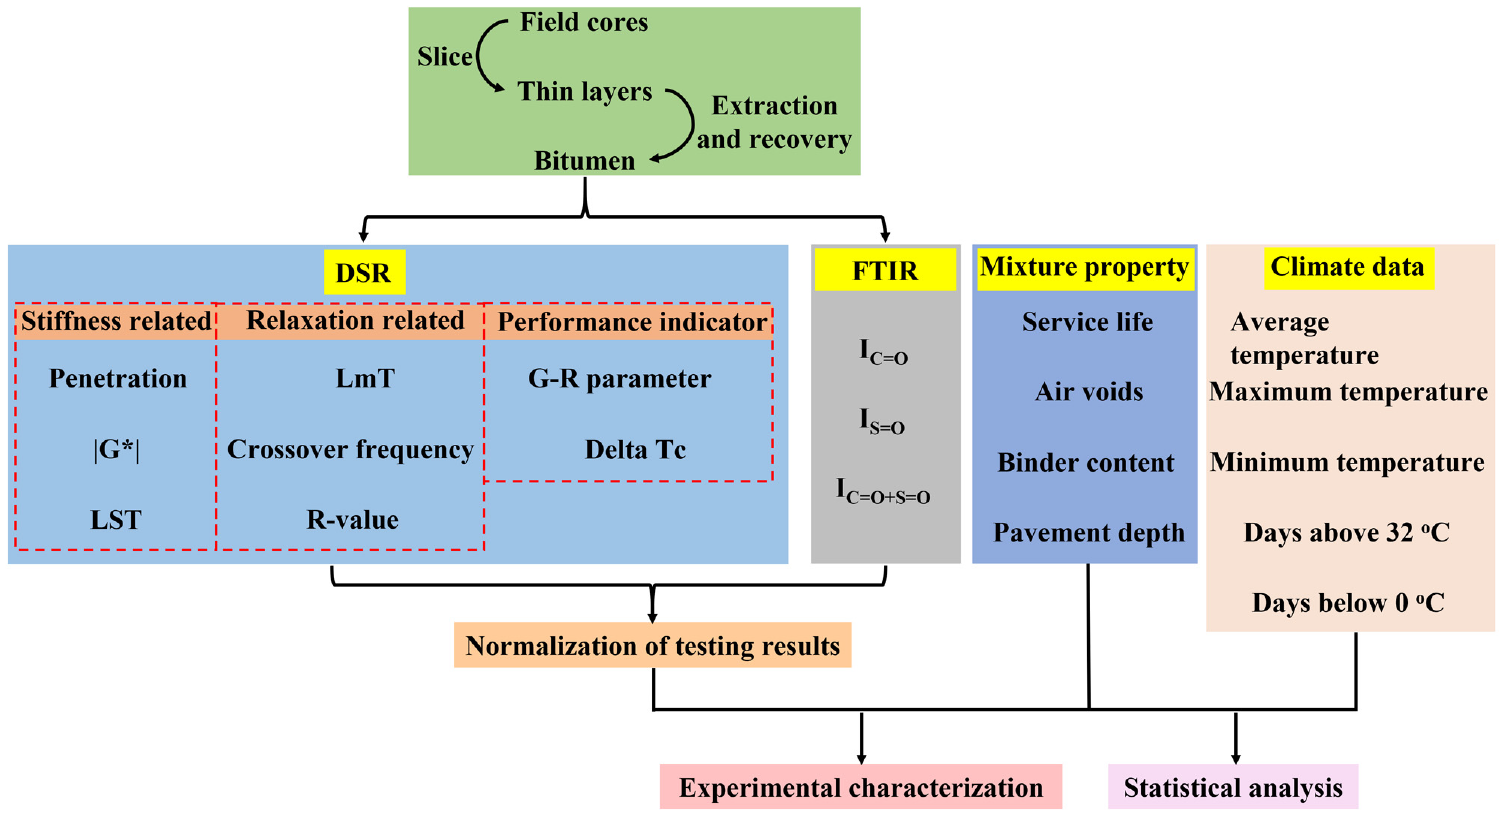
Flowchart of the experimental and analysis procedure.
Results and Discussion
Ageing Gradient
Effect of Air Voids on the Ageing Gradient
Air voids were found to significantly affect the pavements’ field ageing gradient among the mixture properties. The top three slices’ data were used to assess the effect of air voids on the rheological, chemical, and performance indices. Findings are shown in Figures 3 and 4. It should be noted that there are only 12 data points in Figure 3 and eight data points in Figure 4 as a result of the different slices’ quantities and thicknesses in some specific road sections.
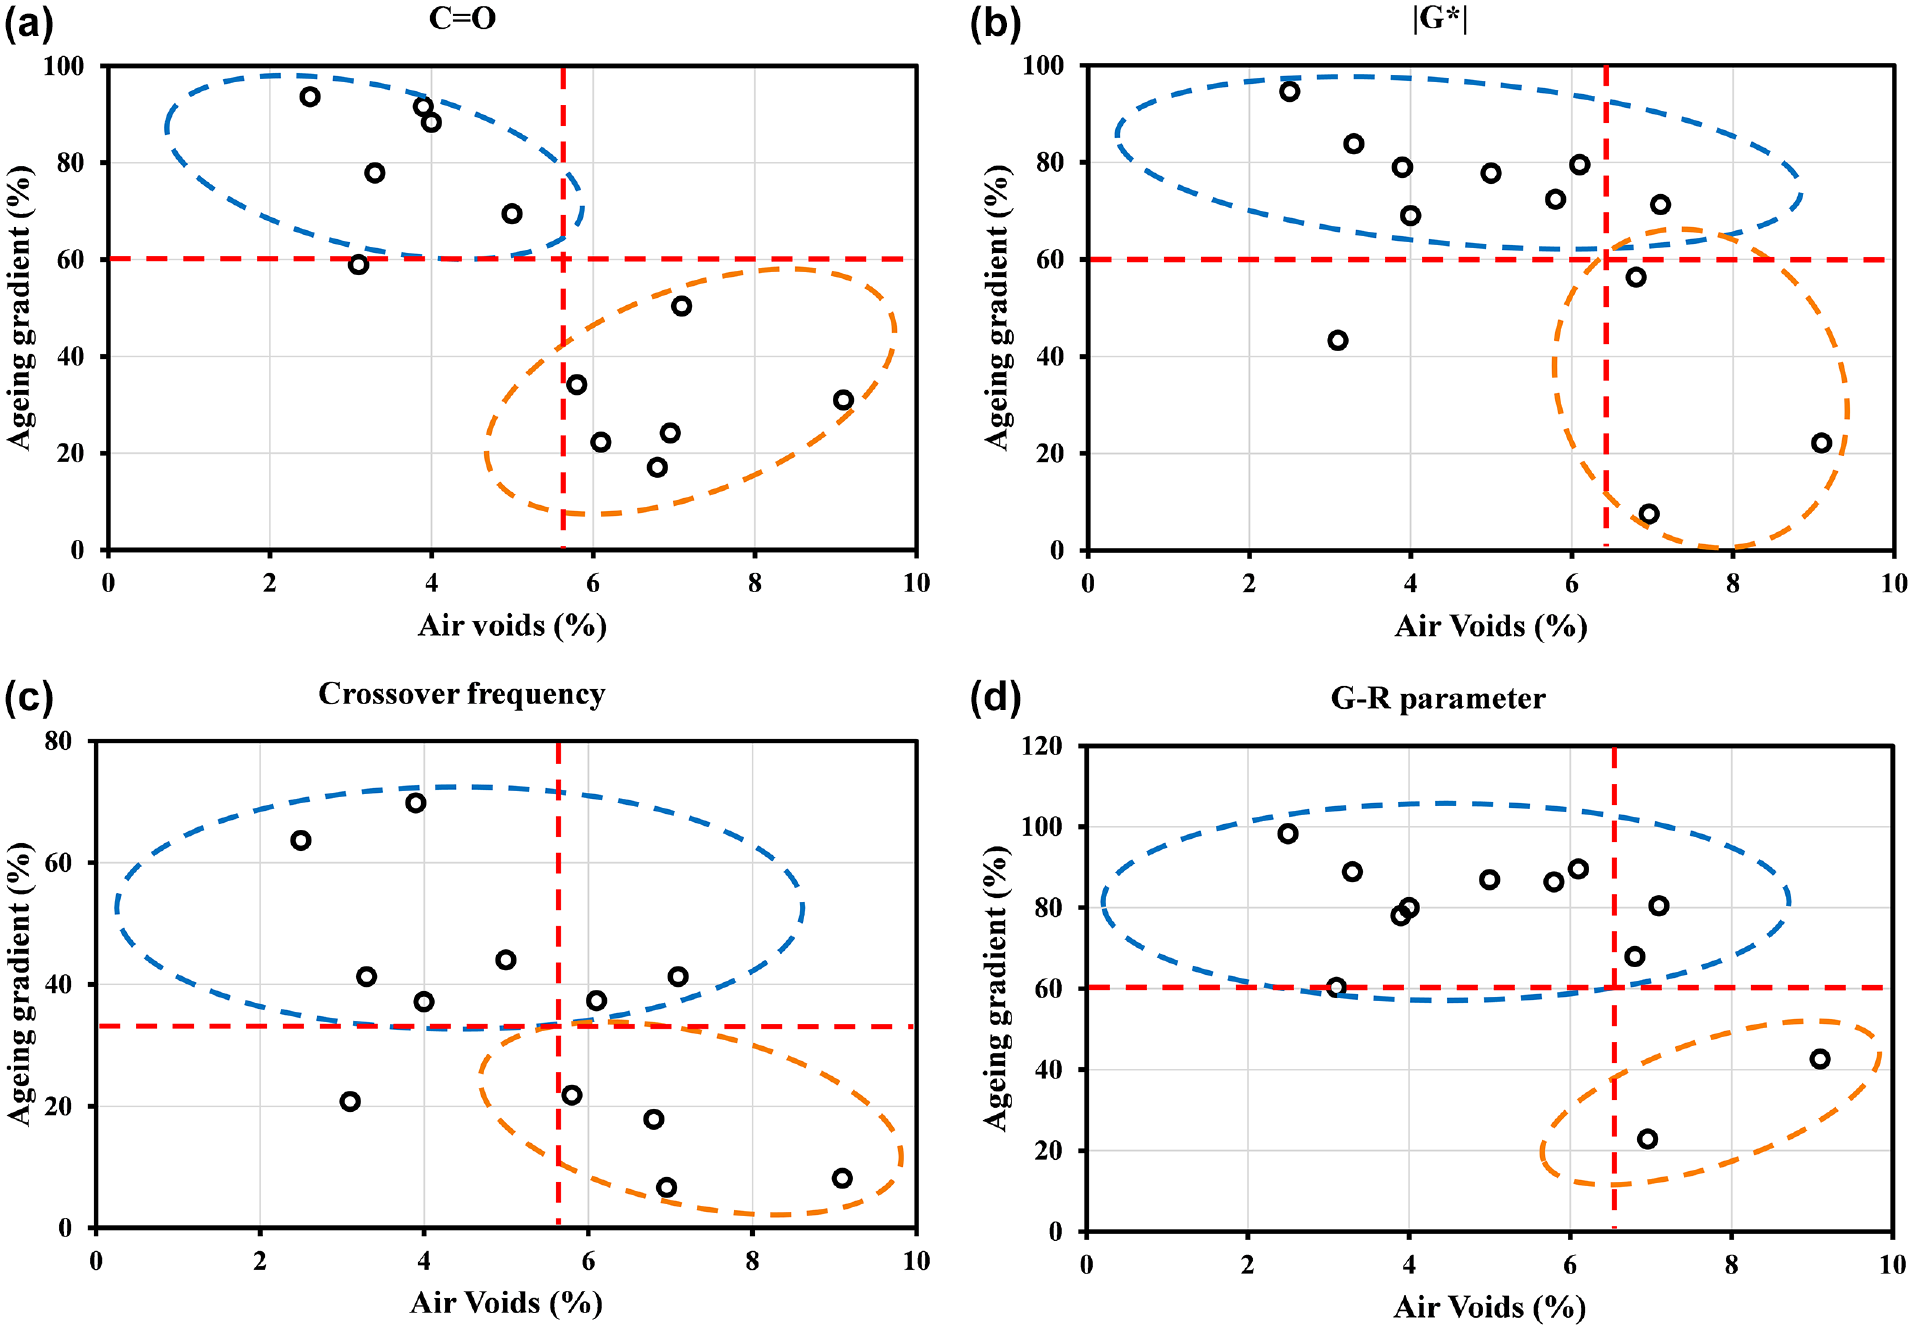
Effect of air voids on the ageing gradient between the top (0–0.5 cm) and second from top (0.5–1 cm) slices: (a) C=O; (b) |G*|; (c) crossover frequency; (d) Glover-Rowe parameter.
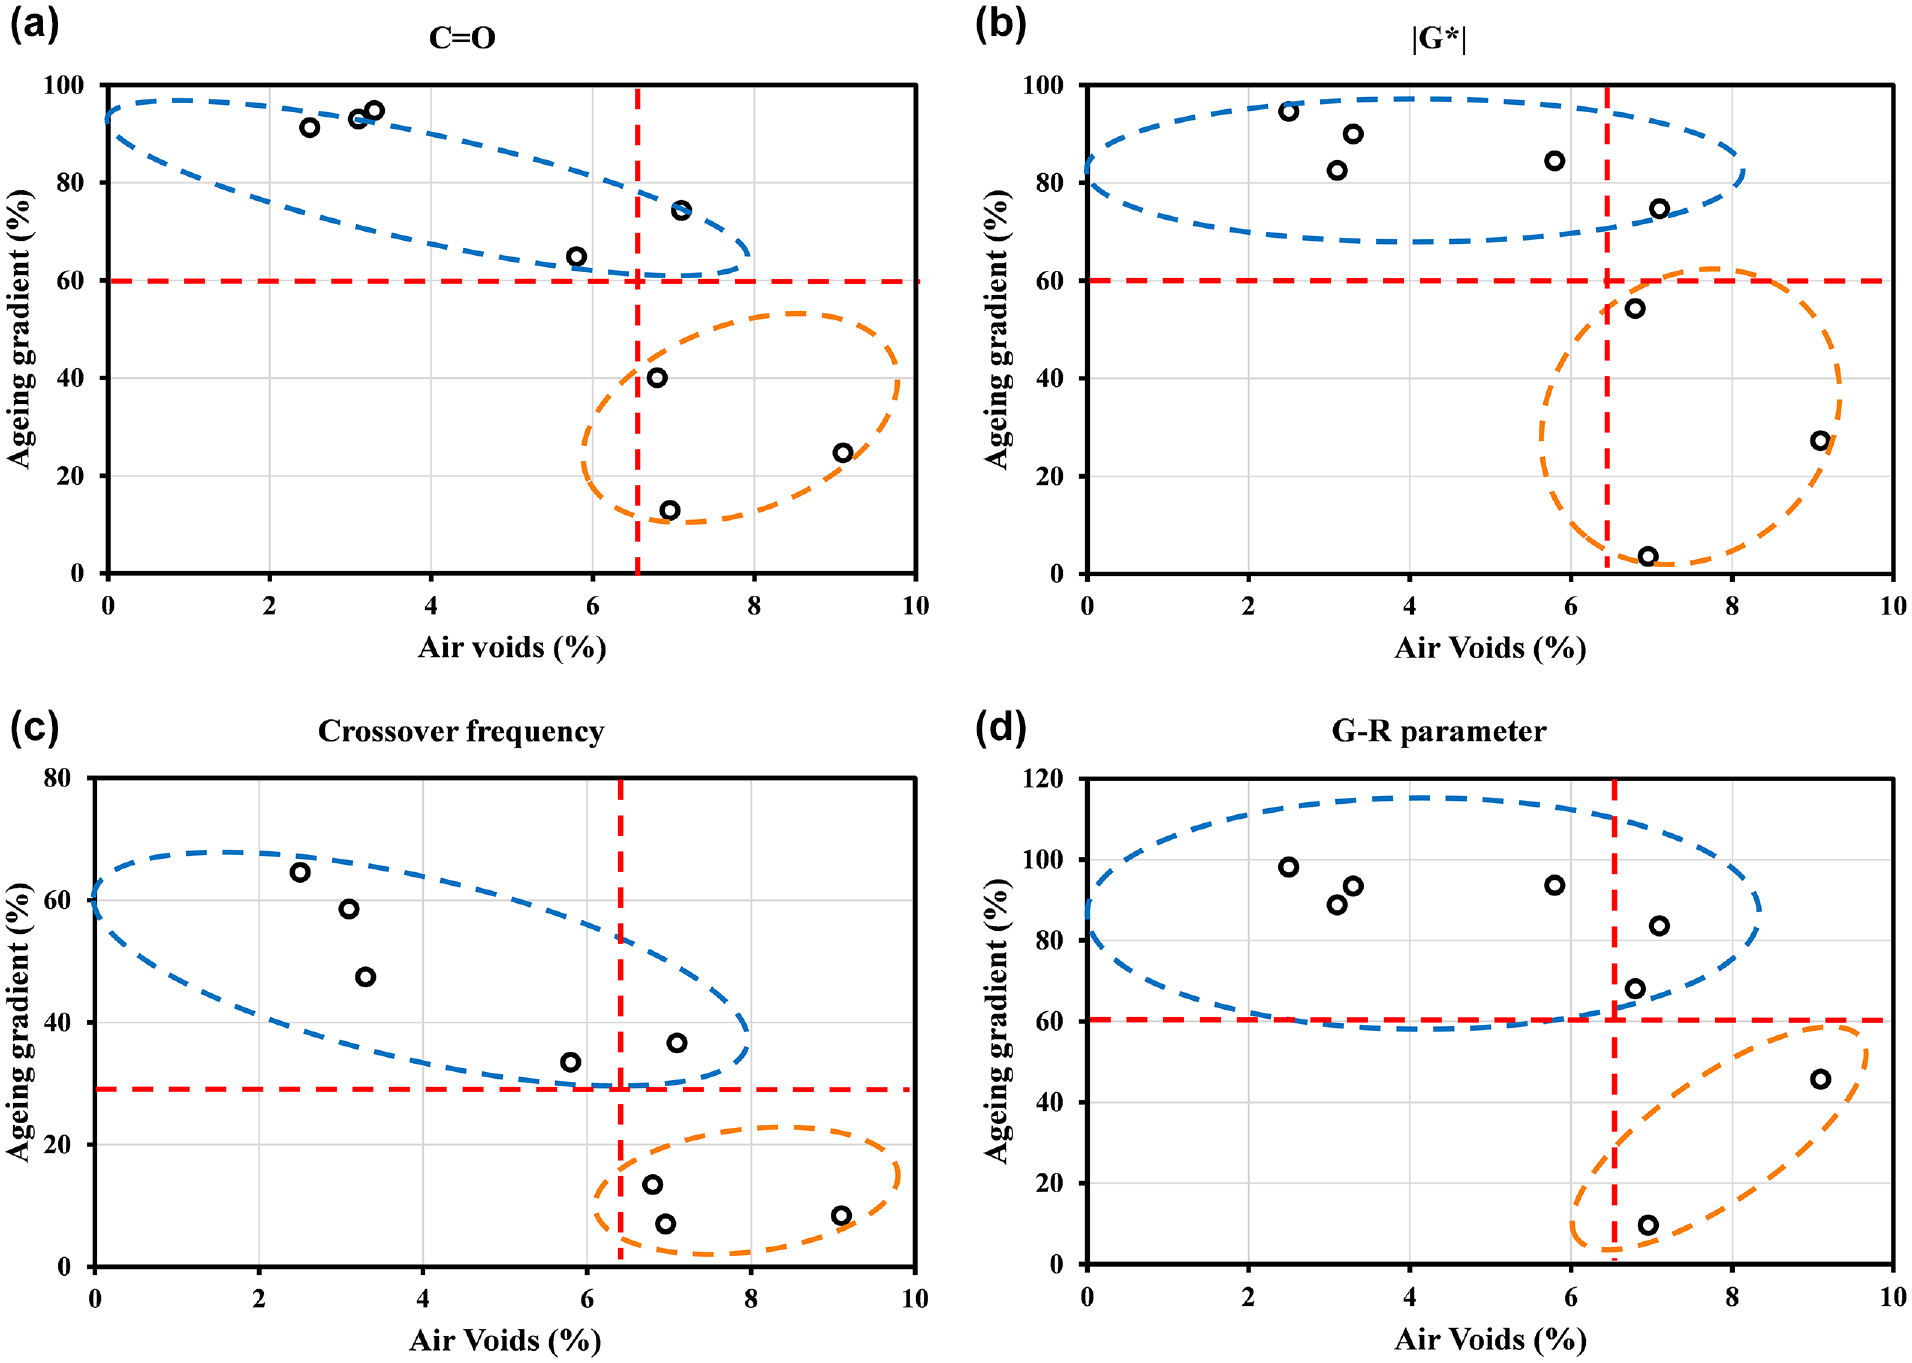
Effect of air voids on the ageing gradient between the top (0–0.5 cm) and third from top (1–2 cm) slices: (a) C=O; (b) |G*|; (c) crossover frequency; (d) Glover-Rowe parameter.
According to the results in Figures 3 and 4, the artificial thresholds of ageing gradient (30% for the crossover frequency and 60% for the other indices) were set to discriminate the affecting patterns of air voids on the ageing gradient. The two thresholds were selected based on: (a) all the data points in Figures 3 and 4 being in two different regions (top left and bottom right); and (b) the thresholds of the ageing gradient (vertical axis) being defined to determine the same critical air voids value (horizontal axis) of 6%. Thus, the data points in the blue and orange circles respectively represent the high and low ageing gradient resulting from different air void content. As can be seen, the ageing gradient becomes more evident with the decrease of air voids, which is consistent with the current understanding; however, there may exist a critical value of air voids, which is approximately 6% based on the observations. When the air void content is lower than the critical value, the ageing of pavement surface is severe while the deep layers’ ageing is slight because the relatively low air void content impedes the access of oxygen. More oxygen can flow and diffuse into the lower layers when the air voids exceed this critical value, leading to the reduction of the ageing gradient. The four indices in Figures 3 and 4 separately represent bitumen’s chemical property, stiffness-related property, relaxation related property, and performance related property with a clearer trend than other unplotted indices.
In Figures 3 and 4, the MA section (7.0% air voids) has a lower ageing gradient than do the other sections with similar air void values. As shown in Table 2, the average temperature of the MA section is the highest among all the sections; the days above 32°C and below 0°C are 9 and 0, respectively. Thus, the temperature condition of this road section is almost the warmest among the investigated sections. Combining the effects of relatively high air void content and field temperature, it is predictable that the ageing gradient of this road section will be smaller than that of other road sections.
Effect of Environmental Factors on the Ageing Gradient
The annual days below 0°C were found to have a significant influence on the bitumen’s field ageing gradient among the environmental factors. As shown in Figure 5, the ageing gradient quantified by the changing rates between top and top second slices generally exhibit an increasing tendency with the annual days below 0°C. Since the pavements’ field ageing is a long-term process, the oxidation speed of bitumen will be relatively low if the asphalt pavement is in a region that is permanently exposed to low temperature. Under such conditions, the ageing gradient becomes more evident as the temperature and oxygen content are both low in the lower pavement depths. Moreover, other ageing inductions (e.g., ultraviolet radiation, water deterioration) affect the surface layer’s bitumen more than does thermal oxidative ageing when the temperature is low, thus leading to a higher ageing gradient. As can be seen in Figure 5, the ageing gradient is not positively associated with the pavement age, which strengthens the above finding to some extent. It should be noted that there are only 10 data points in Figure 5 because the top slices’ thickness of FR1 and IRL road sections were 1 cm, which was different from the other road sections. The chemical indicator (IC=O + IS=O) shows an acceptable R2 value of 0.79 compared with the remaining indices in Figure 5. This is because the FTIR test directly measured the amount of the ageing products (carbonyl and sulfoxide), while the remaining indices in Figure 5 are either physical or performance parameters, those indirectly representing the ageing levels of bitumen. Additionally, the road sections within the orange circles all belong to the wet-freeze region. This finding potentially indicates that if the asphalt pavements are constructed in the frozen regions, then the ageing gradient will be non-negligible in both pavement design and maintenance process. Apart from these, no significant correlations were found between the average/maximum/minimum temperature and the ageing gradient, and thus they were not plotted.
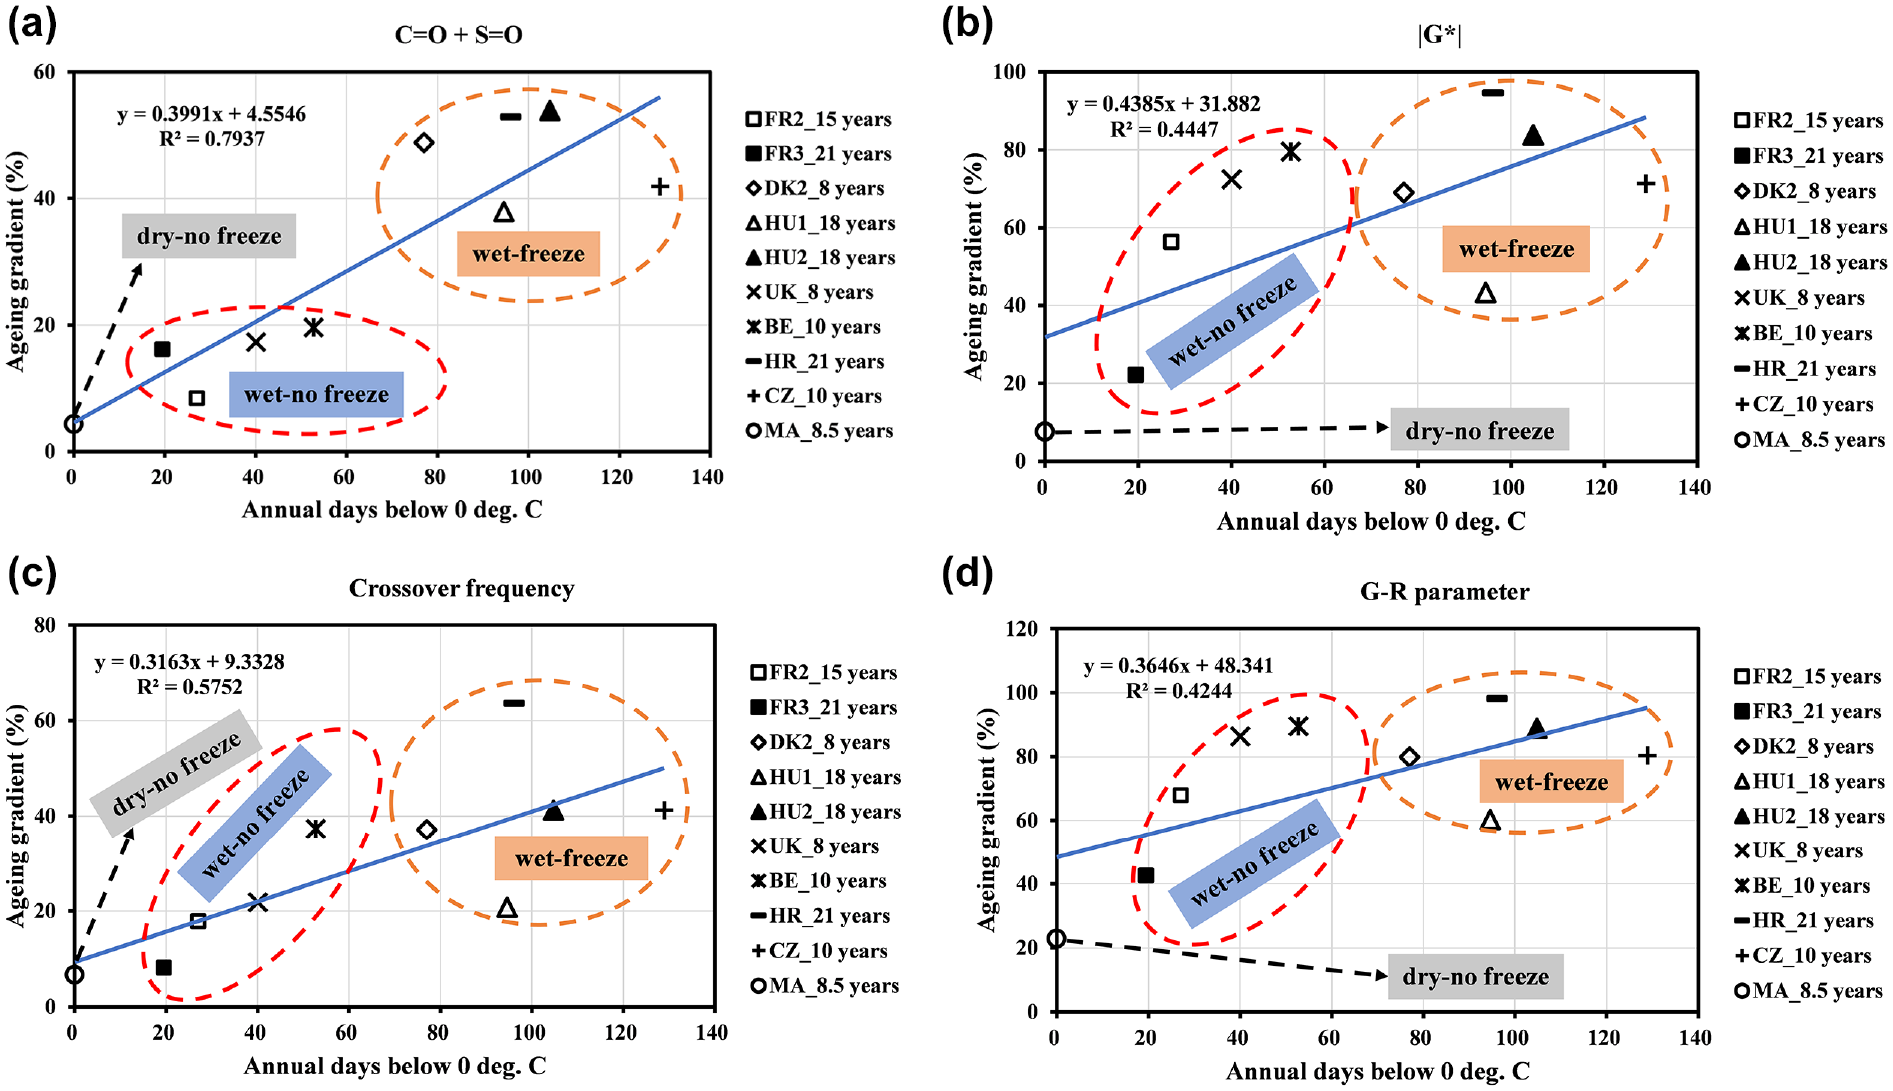
Effect of the annual days below 0°C on the ageing gradient between the top (0–0.5 cm) and second from top (0.5–1 cm) slices: (a) C=O + S=O; (b) |G*|; (c) crossover frequency; (d) Glover-Rowe parameter.
Combining the findings in Figures 3 to 5, if an asphalt pavement with a relatively low air void content (<6%) is in the wet-freeze climatic region, the ageing gradient will be more severe. This finding could contribute to pavement maintenance strategy and materials selection. For example, if a porous asphalt pavement (air voids usually higher than 18%) is built in a wet-no freeze or dry-no freeze region, the depth of pavement to be maintained could be deeper than a dense-gradation asphalt pavement. As for the materials selection process, the bitumen’s anti-ageing property in the lower layers should not be the priority when constructing a dense-gradation asphalt pavement in the wet-freeze region since the field ageing mainly occurs in the pavement surface under this circumstance.
Ageing Efficiency of the PAV Test Compared with Field Ageing
The capability of the PAV test to simulate the long-term ageing of bitumen has been doubted recently ( 37 , 38 ), especially in simulating the ageing of highly viscous bitumen and polymer modified bitumen (PmB). However, direct comparisons are limited in the literature between the PAV ageing and field ageing ( 39 , 40 ). In this study, the bitumen recovered from the bottom slices of four road sections (HU1, UK, BE, and HR) were further PAV aged. The bitumen from the HU1, UK, and BE sections are PmB and the HR sample is a neat bitumen. The data labeled with PAV in Table 5 are the testing results for those bitumen samples subjected to the PAV ageing.
Comparison of the PAV Test and Field Ageing
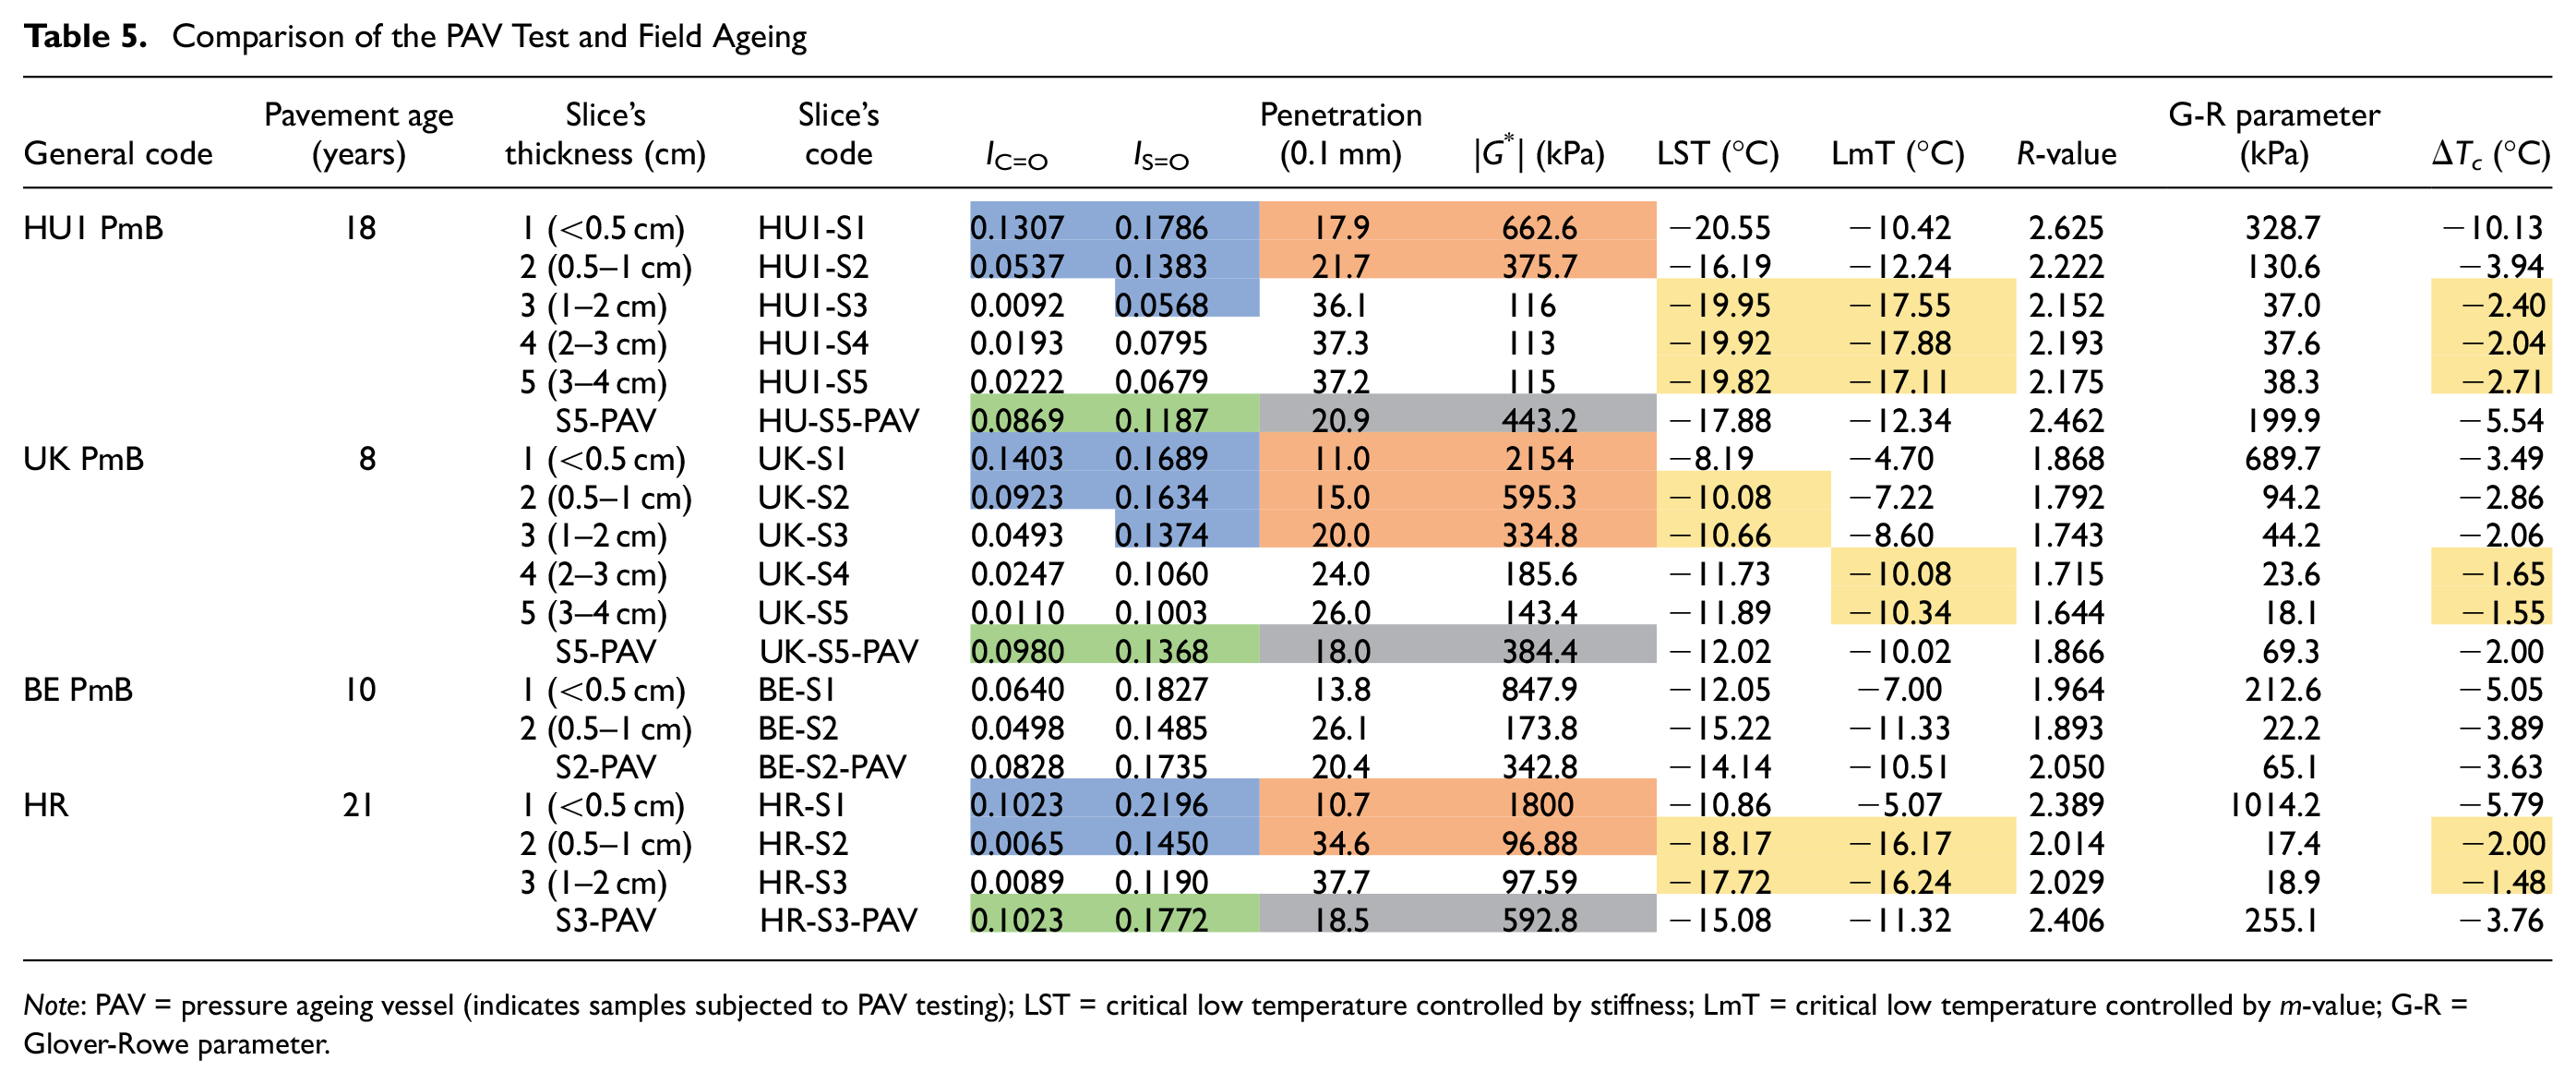
Note: PAV = pressure ageing vessel (indicates samples subjected to PAV testing); LST = critical low temperature controlled by stiffness; LmT = critical low temperature controlled by m-value; G-R = Glover-Rowe parameter.
The ageing gradient, quantified by the chemical indicators (IC=O and IS=O), is insignificant when the pavement depth exceeds 2 cm. Under such pavement depth, the field ageing is greatly reduced as the temperature is relatively lower and oxygen needs longer diffusion time to reach the bottom of the asphalt layer. After the additional PAV ageing conditioning, the bitumen from the bottom slices’ samples (HU1, UK, and HR) generally exhibits a similar ageing degree as the field samples from the pavement depth between 0.5 and 2 cm (almost 0.5–1 cm) as highlighted by the light blue and light green colors in Table 5, but shows a lower ageing level than the bitumen from the very top surface slices (<0.5 cm). It is noteworthy that the minimum service years of the four road sections is 8 years, which indicates the current PAV protocol is insufficient to condition the bitumen to the same ageing level as the very top pavement surface (<0.5 cm) that has been used for 8 years. When quantifying the ageing gradient using the stiffness-related parameters (penetration and |G*|), the ageing gradient will become insignificant with the increase of pavement depth as the difference in the lower slices is relatively lower than in the upper slices. Additionally, the PAV ageing on the bottom slices could yield a similar ageing degree to that of the bitumen samples from the pavement depth between 0.5 and 2 cm (highlighted by the light gray and orange colors in Table 5), which is the same as the chemical indices.
The results of LST, LmT, and ΔTc show different trends from the current understanding. The LST and LmT represent the minimum low service temperatures of bitumen and the ΔTc is used to quantify the low-temperature cracking resistance of bitumen by accounting for the bitumen’s stiffness and relaxation properties. When the bitumen is aged, the values of LST and LmT should increase and values of ΔTc should decrease theoretically, indicating low-temperature performance deterioration caused by ageing. However, the values highlighted by the light yellow color in Table 5 remain unchanged in both the upper layers (<1 cm) and lower layers (>1 cm) although the ageing gradient exists along the vertical pavement depth. Moreover, the LST value of the UK-S5 sample decreases and the ΔTc value of the BE-S2 sample increases even after the PAV test. This may be caused by the polymer modifier’s degradation that has an opposite effect to bitumen ageing. Thus, the rationality of using ΔTc to quantify the low-temperature cracking resistance is questioned based on the above observations. A recent report has concluded the same issues with using ΔTc to evaluate the cracking resistance of highly oxidized PmBs ( 41 ). The main problems are the interpolation accuracy and applicability for materials with relatively high elastic components such as those heavily aged or polymer modified. Thus, ΔTc is not employed as a performance index based on the current findings.
The testing results of the R-value exhibit a decreasing tendency down the pavement depth; however, the R-values of BE-S2-PAV and HR-S3-PAV are even higher than the top slices’ data, which is not in accord with the chemical and stiffness-related parameters’ results. The G-R parameter shows a decreasing trend with the increase of pavement depth and the G-R parameter results of the PAV-aged bottom slices’ bitumen show a similar ageing level to that of the bitumen recovered from the pavement depth 0.5–2 cm. The findings are consistent with those in the chemical and stiffness-related indices. Thus, it is considered a good index to represent the bitumen’s cracking resistance in long-term field ageing.
Statistical Model between G-R Parameter and Dominating Factors in Ageing
Screening of the Critical Mixture Properties and Environmental Factors in Bitumen’s Chemical, Rheological, and Performance Indices
Testing results of the top slices were used to analyze the effect of mixture properties and environmental factors on bitumen’s physical and chemical properties during long-term field ageing given that: (a) the original binders’ test results are unavailable; and (b) the testing results of the lower slices are mainly governed by the original bitumen’s properties and less influenced by the field ageing because of the existence of ageing gradient.
The explanatory variables in the statistical analysis (Table 6) include pavement service life, air voids, binder content, annual average temperature, maximum temperature, minimum temperature, days above 32°C, and days below 0°C; the dependent variables in the statistical analysis are IC=O, IS=O, IC=O+IS=O, penetration, |G*| at 15°C and 0.005 rad/s, LST, LmT, crossover frequency, R-value, G-R parameter, and ΔTc. Multivariate ANOVA, which is a widely used statistical method for determining whether the multiple influence factors significantly affect the dependent variables based on hypothesis testing, was conducted to discriminate which dependent variables are sensitive to the explanatory variables and which variables are the dominating factors in the regression relationships. The significance level was set at 0.01 and the interaction terms were not discussed because all the factors were covariates rather than fixed factors. As shown in Table 6, the |G*|, crossover frequency, G-R parameter, and ΔTc were significantly affected by the explanatory variables, while no significant relationships were found between the explanatory variables and the other dependent variables (IC=O, IS=O, IC=O+IS=O, penetration, LST, LmT, and R-value): those are not listed in Table 6. The main factors responsible for the above dependent variables are the pavement service life, binder content, minimum temperature, days above 32°C, and days below 0°C. The statistical results are consistent with the results in Table 5. One interesting finding is that there is no significant influence on the dependent variables from the air voids since only the top slices’ testing data were used.
Multivariate ANOVA for the Effect of Mixture Properties and Environmental Factors on Bitumen’s Ageing Indices
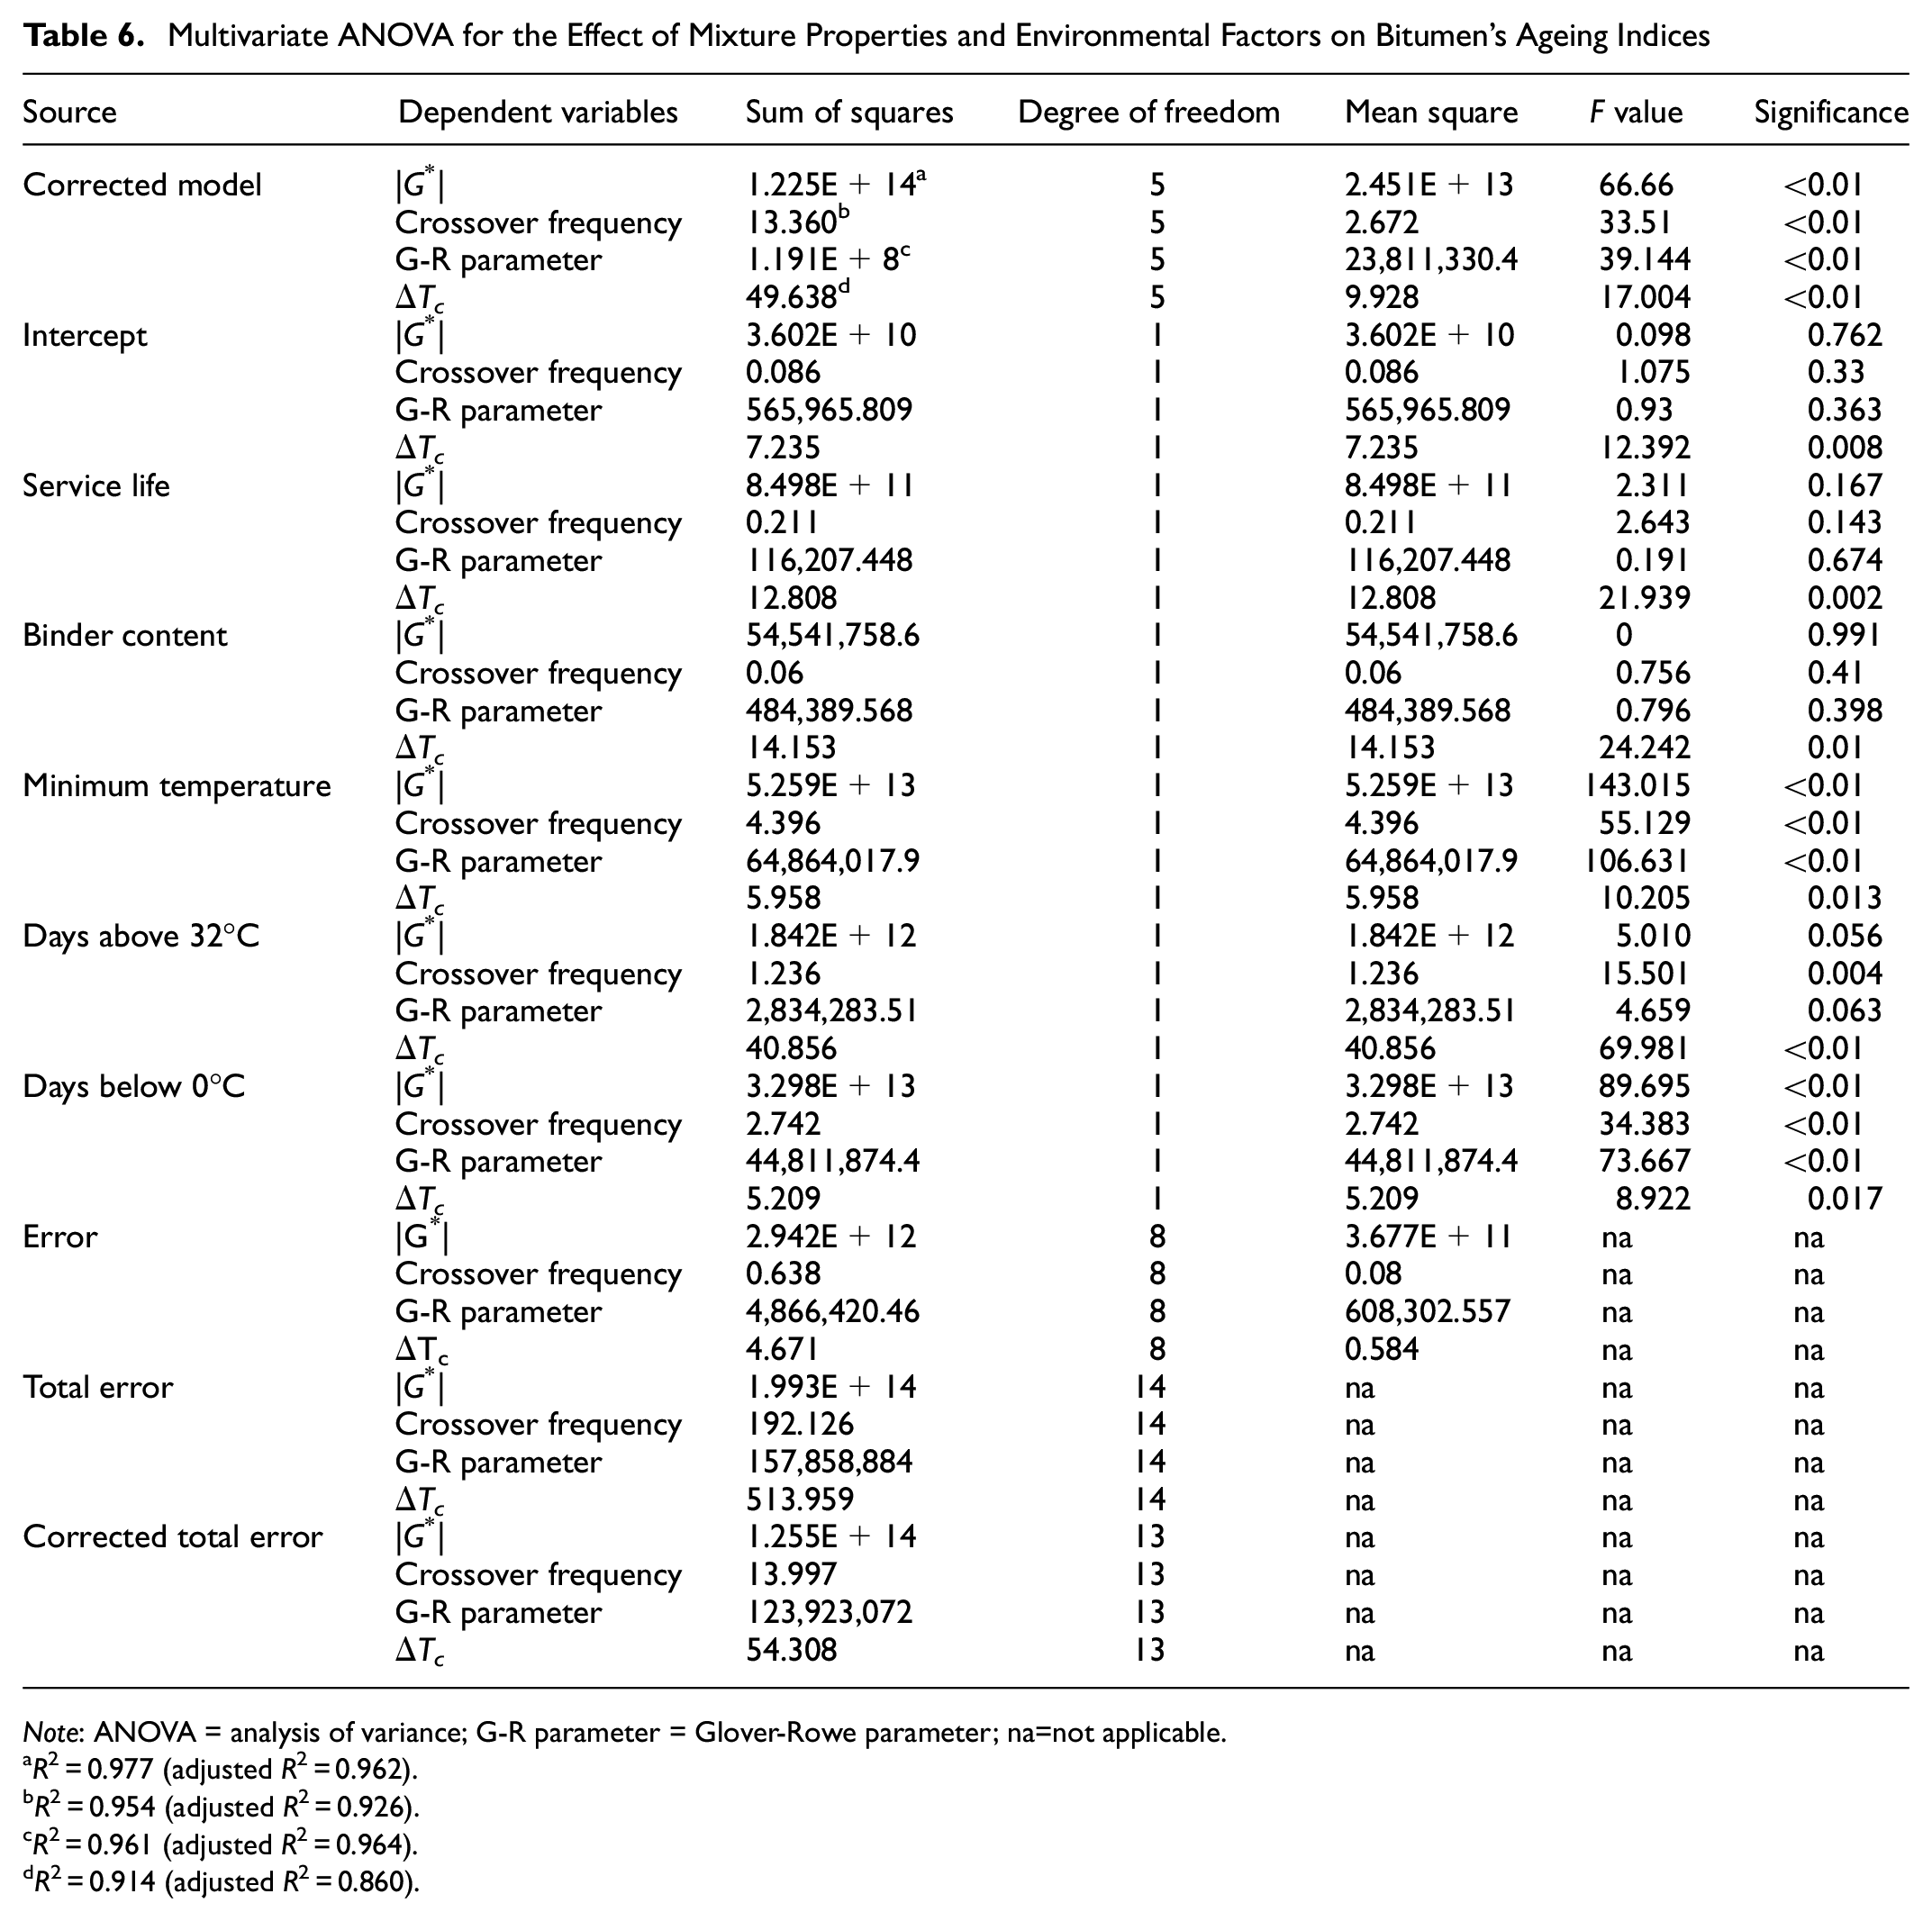
Note: ANOVA = analysis of variance; G-R parameter = Glover-Rowe parameter; na=not applicable.
R 2 = 0.977 (adjusted R2 = 0.962).
R 2 = 0.954 (adjusted R2 = 0.926).
R 2 = 0.961 (adjusted R2 = 0.964).
R 2 = 0.914 (adjusted R2 = 0.860).
Model Calibration and Verification
Seven explanatory variables, including mixture properties, environmental factors, and bitumen’s rheological and chemical indices, were selected to establish a statistical model for the G-R parameter based on the previous findings and the actual service conditions of asphalt pavements. This model is not used to predict the G-R parameter but to reveal the interrelationships with materials properties and external factors. One can focus more on those critical materials properties and environmental factors when considering the materials selection and pavement design in a specific region if such a relationship reasonably exists. Equation 7 shows the model’s definition. As discussed above, ΔTc is an index that cannot quantify the ageing-related performance consistently, while the G-R parameter has a clear definition and is highly correlated with the |G*| and phase angle at 15°C and 0.005 rad/s. Thus, the G-R parameter rather than ΔTc was selected as the ageing performance indicator when developing the statistical models.
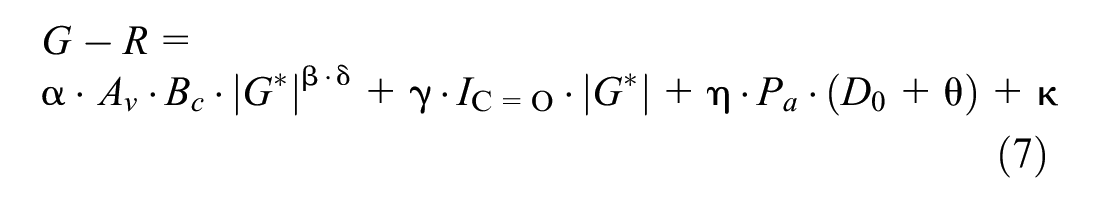
where
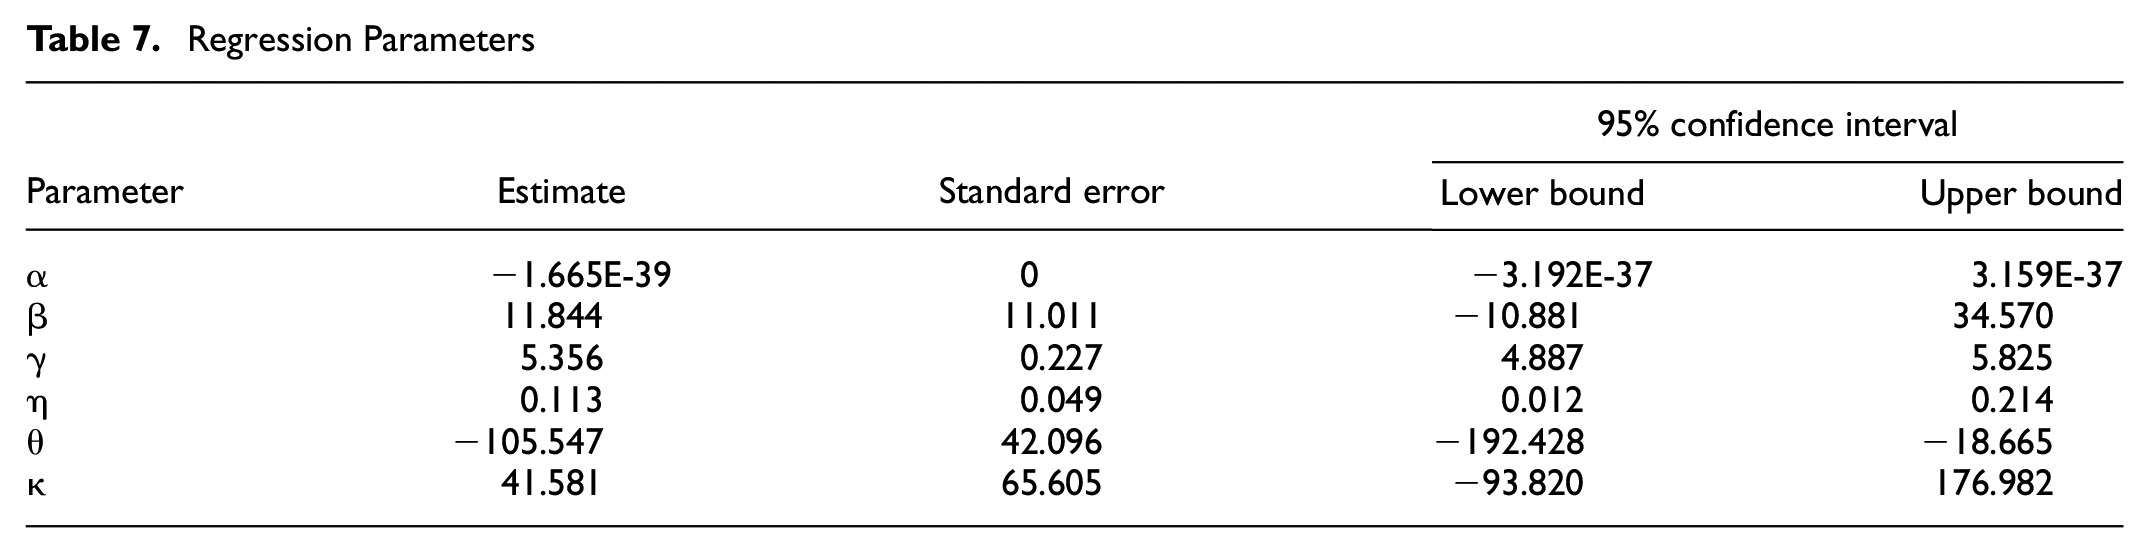
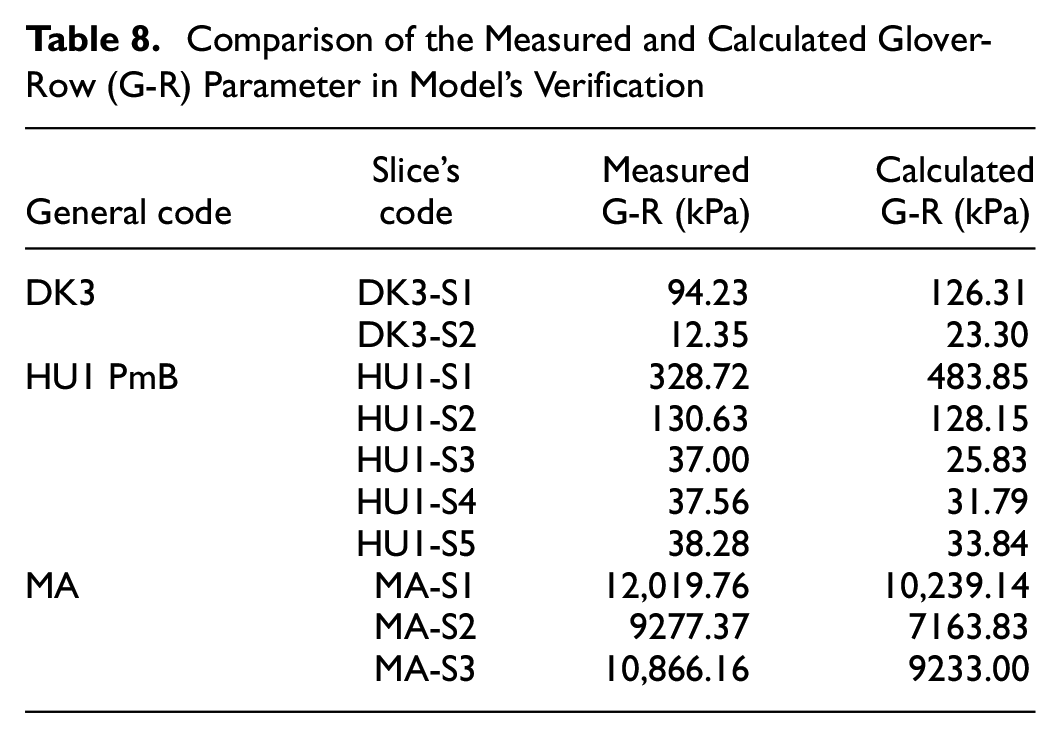
Thirty G-R parameter data were used to establish the model and the remaining 10 G-R parameter data from three road sections (DK3, HU1 PmB, and MA) were selected to verify the model. The data sets for model verification include both unmodified and modified bitumen. In addition, the measured G-R parameter of the verification data sets varied from 37 to 12,000 kPa, as indicated in Table 8, as such a wide range of data variation would better examine the feasibility of the model. The regression results for the model calibration are shown in Figure 6 and Table 7. As can be seen, the mean absolute error (MAE) and determination coefficient are respectively 31.4% and 0.96, which implies that the model’s accuracy is acceptable considering the inherent errors from the experimental procedure. Subsequently, the validity of this model using the same coefficients as Table 7 was verified by using the remaining 10 G-R data. Figure 7 and Table 8 indicate the results. The MAE and determination coefficient are 28.1% and 0.95, respectively. The model’s validity is relatively good given that seven parameters were incorporated. However, more data are desirable to optimize the model and extend it for the application in more different asphalt mixtures and ageing conditions.
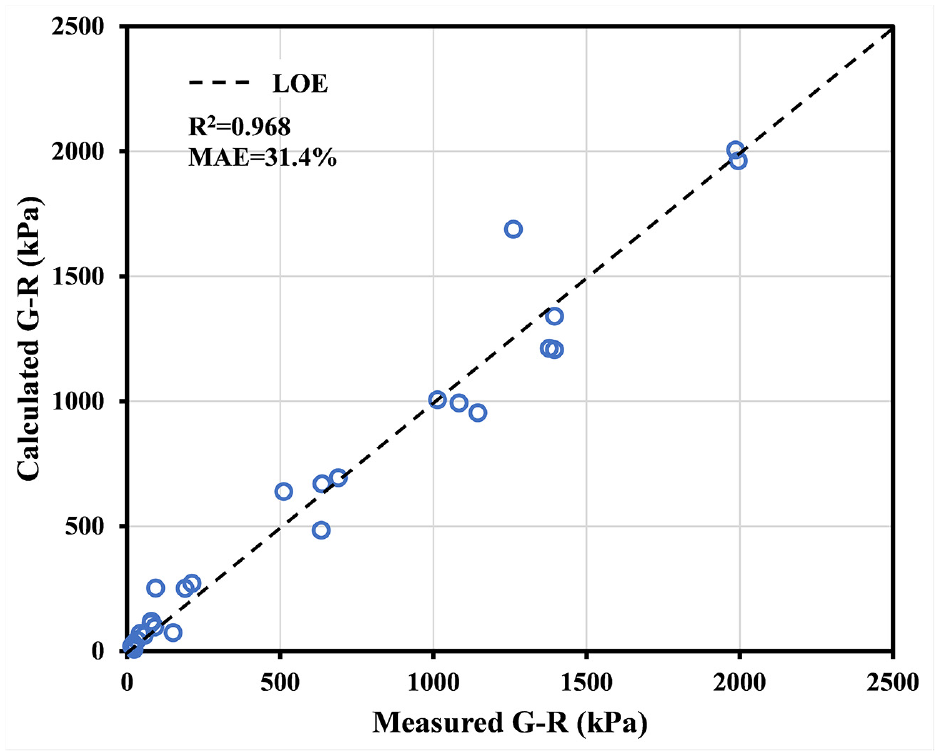
Calibration result of the statistical model.
Regression Parameters
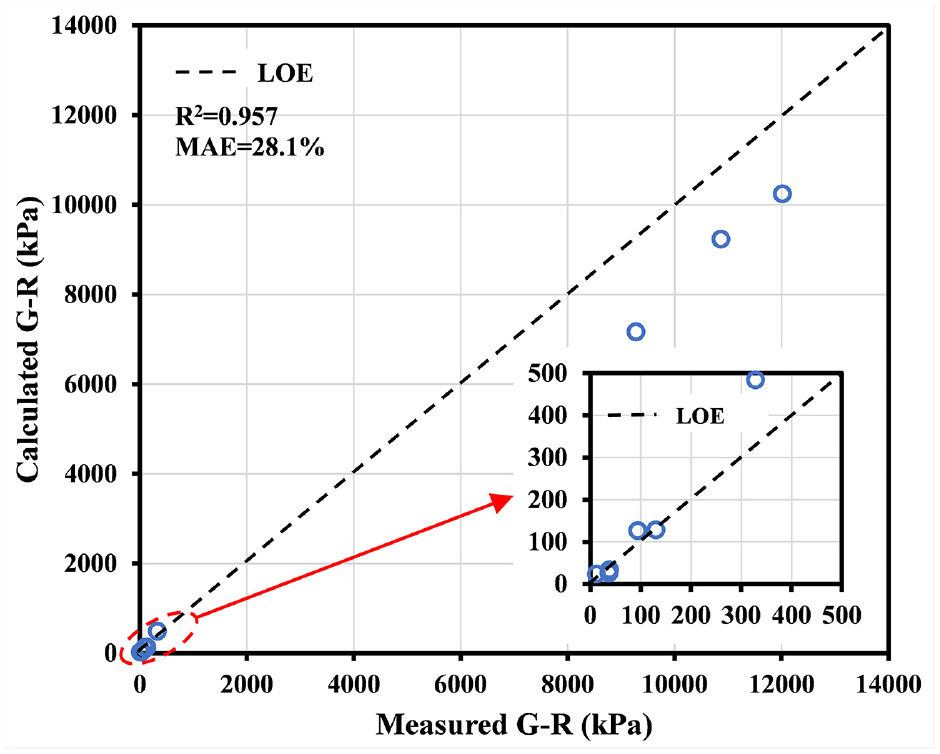
Verification result of the statistical model.
Comparison of the Measured and Calculated Glover-Row (G-R) Parameter in Model’s Verification
Conclusions
This study investigated the bitumen’s long-term field ageing in 14 asphalt pavement sections in three climatic regions via experimental and statistical approaches. Field ageing gradient and the efficiency of the PAV test were assessed. The interrelationships between the materials and environmental factors and the ageing performance indices were statistically analyzed. A statistical model for the G-R parameter was calibrated and verified. The major conclusions are as follows:
A threshold air void content (approximately 6%) exists in differentiating the field ageing gradient patterns in the asphalt pavements. The ageing gradient remains at a relatively high level at lower air voids (<6%) and dramatically declines when exceeding the threshold air void content.
There is an increasing tendency between the ageing gradient and annual days below 0°C. No significant correlations are found between the ageing gradient and the average/maximum/minimum temperature.
The chemical indices, stiffness-related indices, and G-R parameter can quantify the field ageing gradient of asphalt pavements. The PAV test can condition the bottom slices’ bitumen to the same ageing level (quantified by the above parameters) as that in a pavement depth of 0.5–2 cm after 8 years field service.
Pavement service life, binder content, minimum temperature, days above 32°C, and days below 0°C are the critical material and environmental factors that significantly affect the |G*|, crossover frequency, G-R parameter, and ΔTc.
A statistical model incorporating the mixture properties (pavement service life, air voids, and binder content), environmental factor (annual days below 0°C), chemical indicator (IC=O), and rheological indices (|G*| and phase angle at 15°C and 0.005 rad/s) was established for linking to the G-R parameter. The statistical model is verified as acceptable with a MAE of 28.1% and an R2 value of 0.95.
Footnotes
Author Contributions
The authors confirm contribution to the paper as follows: study conception and design: H. Zhang, Y. Zhang; data collection: H. Soenen, X. Carbonneau, X. Lu, C. Robertus; analysis and interpretation of results: H. Zhang, Y. Zhang, H. Soenen; draft manuscript preparation: H. Zhang, Y. Zhang. All authors reviewed the results and approved the final version of the manuscript.
Declaration of Conflicting Interests
The author(s) declared no potential conflicts of interest with respect to the research, authorship, and/or publication of this article.
Funding
The author(s) disclosed receipt of the following financial support for the research, authorship, and/or publication of this article: The authors would like to acknowledge the financial support of a PhD studentship provided by Aston University, Nynas, and Colas. This work is also supported by the Asphalt Institute Foundation (AIF).