
Abstract
Recent wildfire risks in California have prompted the implementation of public safety power shutoff (PSPS) events, procedures enacted by utility operators to deenergize parts of the electrical grid and reduce the likelihood of wildfire ignition. Despite their yearly occurrence, PSPS events are severely understudied, and little is known about how these events affect disaster preparation activity, travel behavior, and transportation systems. With growing wildfire risks in North America and beyond, PSPS events require immediate and thorough research to reduce their negative externalities and maximize their benefits. This exploratory study employs survey data from East Bay Hills residents in Alameda and Contra Costa counties in California who were affected by two PSPS events in October 2019 (n = 210). Through descriptive statistics and basic discrete choice models for the decision to conduct typical or changed travel, this research contributes to the literature as the first assessment of PSPS event travel behavior. We found that travel did not change drastically during the event, although respondents conducted a high number of preparedness activities. A sizable portion of the sample conducted extended trips during the PSPS event days, whereas a small number evacuated to a destination overnight. Respondents received relatively clear information from multiple communication methods, indicating substantial information about the events. Modeling results found that power loss was a driver in travel behavior change, whereas demographics indicated heterogeneous responses within the sample. The paper concludes with a discussion of key takeaways and suggestions for research in this nascent field.
Keywords
Public safety power shutoff (PSPS) events involve deliberate actions to deenergize portions of the electrical grid to reduce wildfire risk. PSPS events were first widely implemented in the United States by San Diego Gas & Electric (SDG&E) following the 2007 Southern California Wildfires, after officials found that downed power lines owned by SDG&E had sparked the Witch and Rice Canyon Fires ( 1 ). More recently in 2018, the Camp Fire in Paradise, California, which killed 85 people and destroyed over 18,000 structures, was caused by electric transmission lines owned and operated by Pacific Gas & Electric (PG&E) ( 2 ). Moreover, recent California wildfires between 2017 and 2019 burned almost 1.5 million acres, leading to nearly 1.1 million people combined being ordered to evacuate ( 3 ). This does not even count the devastating 2020 wildfire season in California that burned over 4.2 million acres and destroyed over 10,000 structures ( 4 ). Consequently, PSPS events have become a key wildfire mitigation tool in California.
As PSPS events become a new normal, several key research needs are evident. First, a broad understanding of how people make safety decisions during these events is severely needed. It remains unclear whether people will (1) remain at home; (2) seek electricity, Internet, or supplies; and/or (3) leave the area. These choices can change traffic patterns and induce congestion, while also altering transportation responses for potential evacuations. Second, power shutoffs significantly affect the communication of emergency information, including mandatory evacuation orders for a wildfire. PSPS events cut power to cell towers, limiting the use of wireless networks and mobile phones. Third, research is needed to determine the feasibility and effectiveness of transportation responses in evacuations without power. Power-based strategies (e.g., traffic signal priority) and strategies that might require lighting to implement (e.g., contraflow) may not be feasible. Public transit services to help people reach evacuation centers or resource hubs may not be operational. Fourth, critical transportation infrastructure can stop functioning in PSPS events. For example, many traffic signals, train systems, airports, tunnels, and ports require power for basic operations and safety. Finally, PSPS events will continue to affect disaster preparedness, response, and recovery as daily life becomes more electricity-dependent. Reliance on electric vehicles (EVs), mobile phones, and the Internet will continue to grow, all of which could be rendered inoperable in a PSPS event or even an evacuation. With EVs becoming an important facilitator of transportation, their resilience to power shutoffs (whether planned or unplanned) will be important moving forward. To begin addressing these key research gaps, we built on work in Wong et al. ( 5 ) and developed the following two research questions:
1) What preparedness and communication activities were conducted before the PSPS events that may affect transportation systems?
2) What travel decisions did people make before, during, and after PSPS events?
To answer these research questions, we surveyed 210 residents of the East Bay Hills in Alameda and Contra Costa counties in California, focusing on trip-making behavior. The paper is ordered as follows. First, we conduct a brief literature review of PSPS events and other power-related events that affected transportation. We then briefly present the data and methods employed in the paper, followed by the results from the survey. We end with a discussion of the survey results and a conclusion, both of which feature future research directions.
Background and Literature
We first present background and literature related to PSPS events in California and the impact of unplanned power outages on transportation. Using this literature, we identify several key literature gaps that this paper aims to address.
PSPS Events in California
PSPS events are conducted at the discretion of utilities (such as PG&E, SDG&E, or Southern California Edison [SCE]) in coordination with relevant governmental agencies to reduce wildfire risk. Although multiple variables and indicators are used to make the decision to conduct a PSPS event, utilities typically consider strong winds, high temperatures, low humidity, and current drought conditions in their decision making. Wind in particular can cause elastic extension failures (e.g., electric lines touching objects) or fatigue failure (e.g., electrical grid components or surrounding objects falling) ( 6 ). A comprehensive study by De Abreu (2020) using PG&E data found that rural areas, distribution lines (as opposed to transmission lines or substations), and vegetation contact (as opposed to buildings) had high proportions of wildfire ignition events ( 7 ).
Through data collected via the California Public Utilities Commission ( 8 ), Table 1 presents PSPS events conducted by California utilities between September 2017 and December 2020. In all, 3.2 million customers (which is more analogous to households rather than people) were affected by PSPS events. Of those 3.2 million customers, about 140,000 customers were classified as medical baseline, which denotes customers that need electricity for medical reasons (e.g., to power medical devices, keep medicine refrigerated, keep a home warm or cool). In response to the events, utilities set up approximately 572 physical and mobile community centers to provide information and resources (e.g., water, device charging ability), serving over 100,000 people. Other recent research reported similar figures for the number of affected customers and noted that the average outage each year ranged from 32 h (2020) to 46 h (2019) with a maximum outage between 94 h (2018) and 163 h (2019) ( 9 ).
Details of Public Safety Power Shutoff (PSPS) Events in California Between 2017 and 2020 ( 8 )
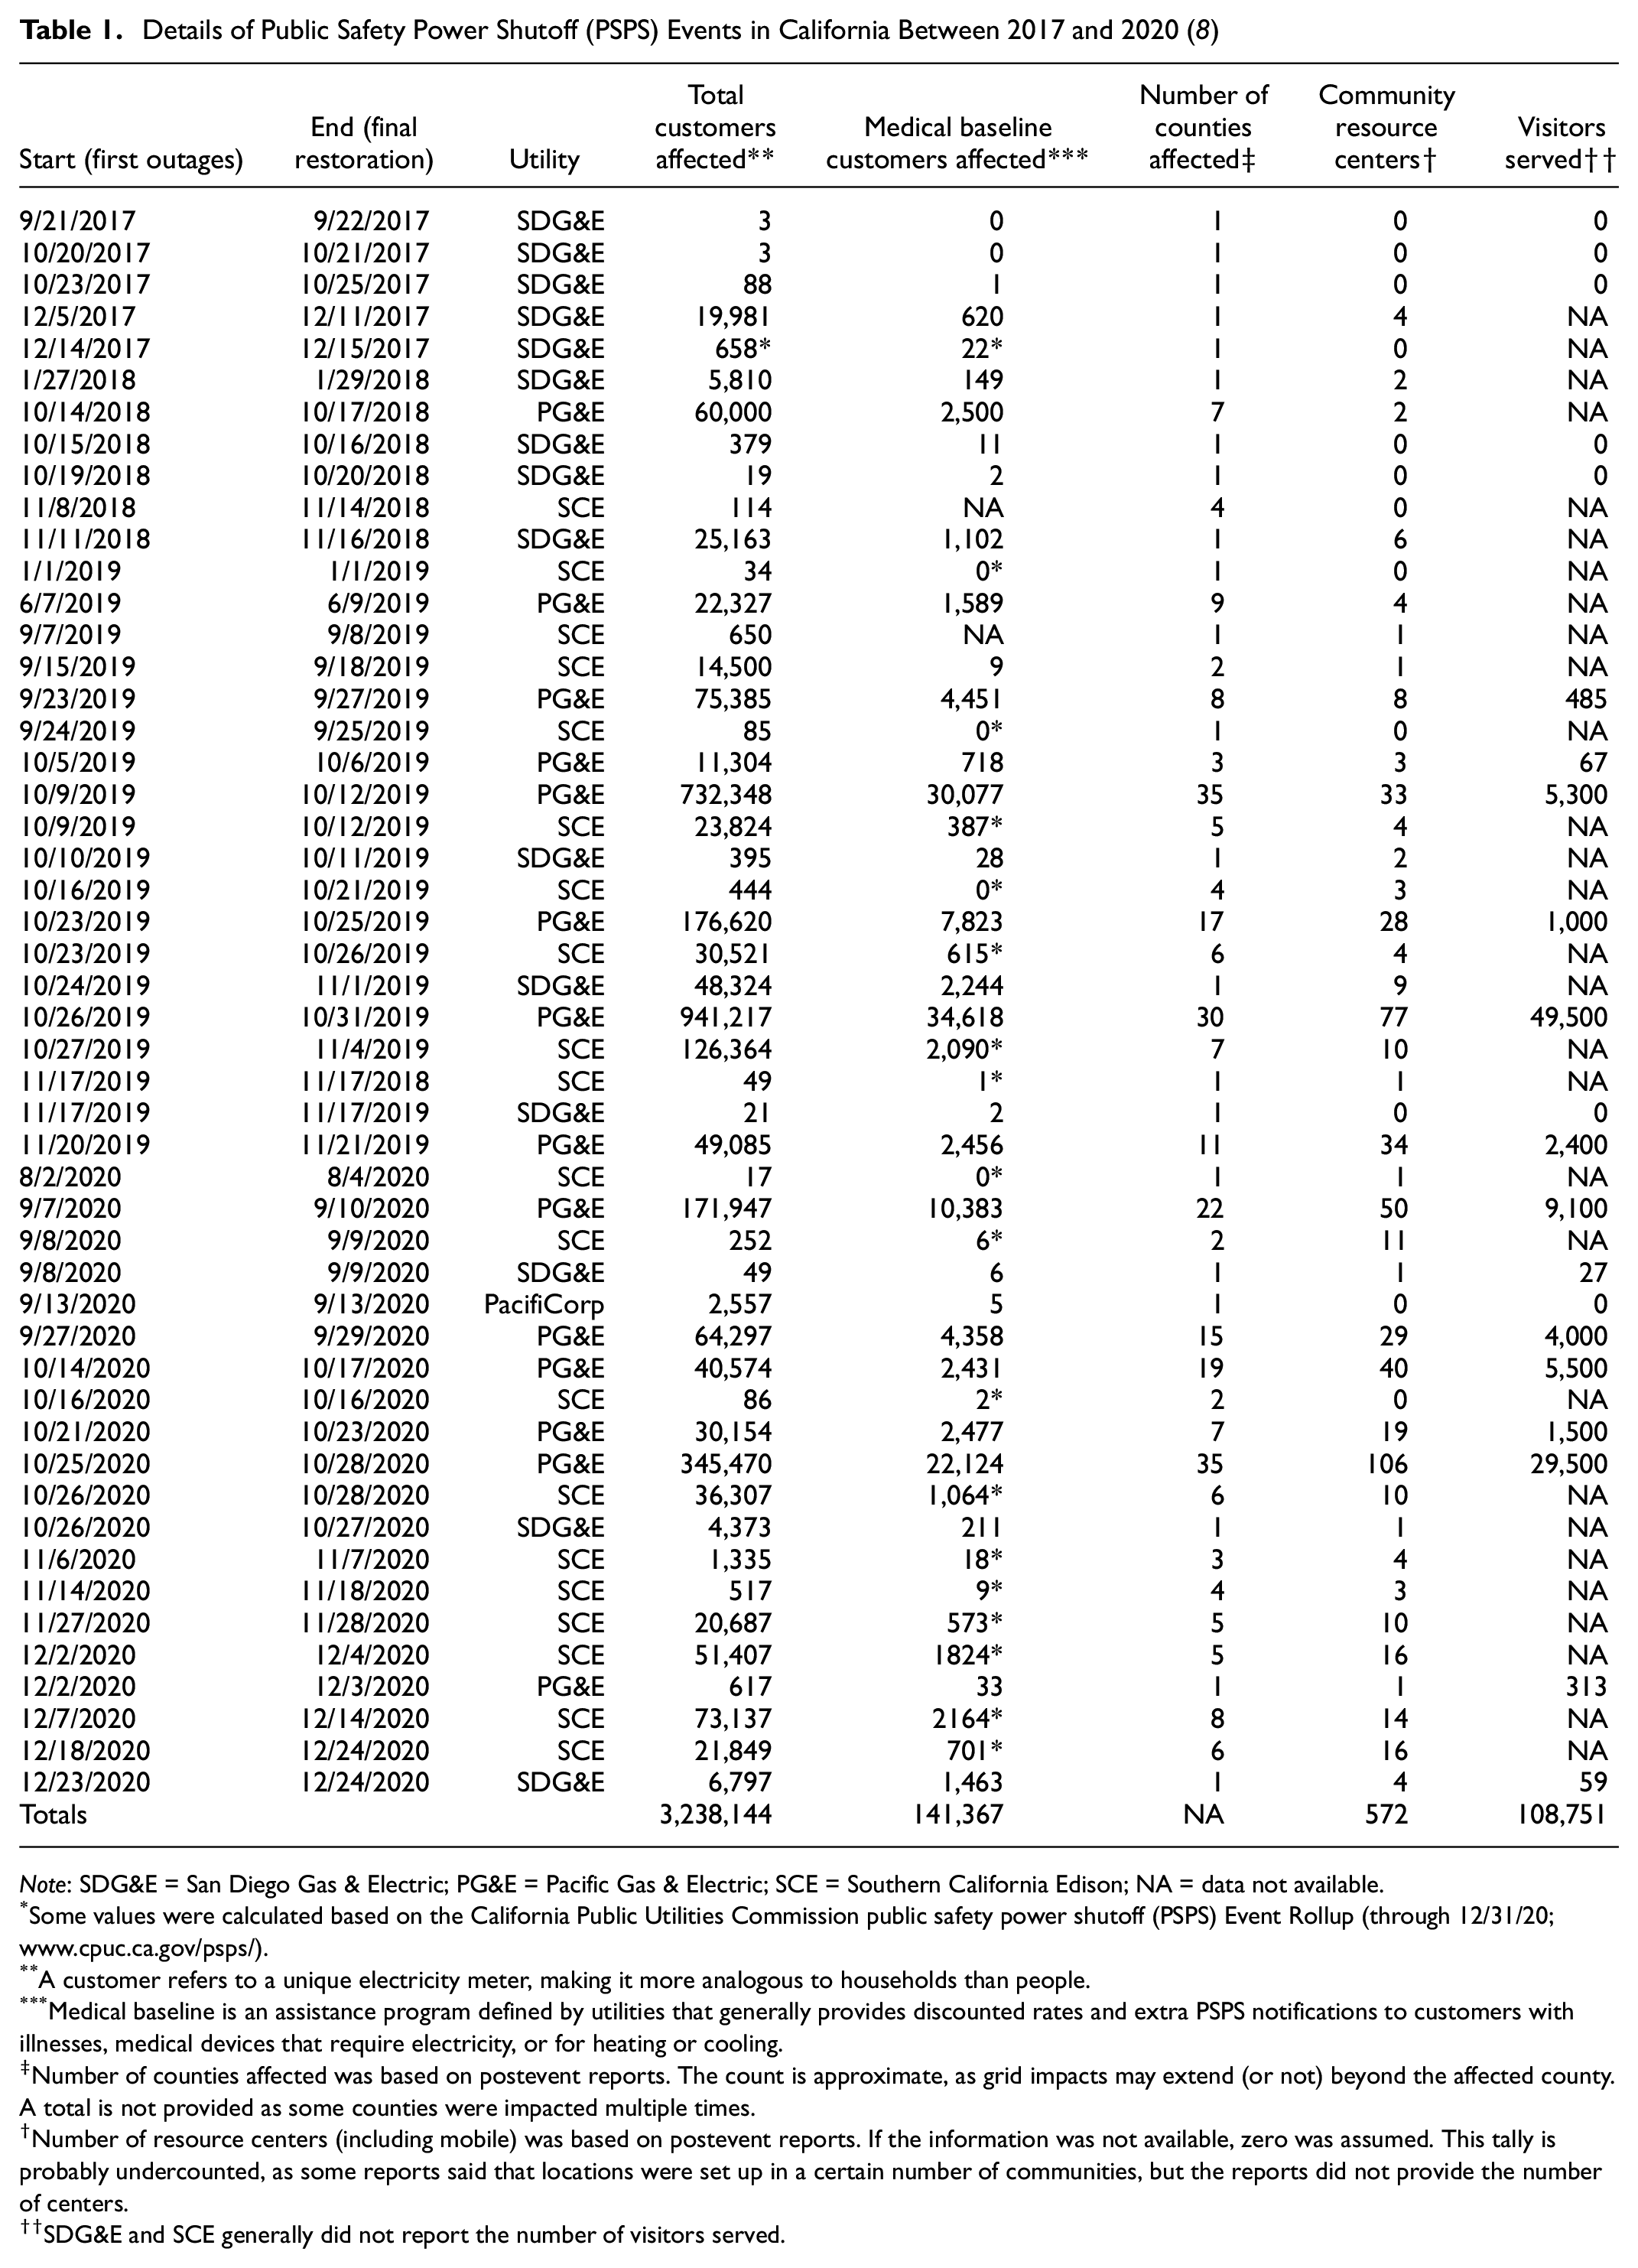
Note: SDG&E = San Diego Gas & Electric; PG&E = Pacific Gas & Electric; SCE = Southern California Edison; NA = data not available.
Some values were calculated based on the California Public Utilities Commission public safety power shutoff (PSPS) Event Rollup (through 12/31/20; www.cpuc.ca.gov/psps/).
A customer refers to a unique electricity meter, making it more analogous to households than people.
Medical baseline is an assistance program defined by utilities that generally provides discounted rates and extra PSPS notifications to customers with illnesses, medical devices that require electricity, or for heating or cooling.
Number of counties affected was based on postevent reports. The count is approximate, as grid impacts may extend (or not) beyond the affected county. A total is not provided as some counties were impacted multiple times.
Number of resource centers (including mobile) was based on postevent reports. If the information was not available, zero was assumed. This tally is probably undercounted, as some reports said that locations were set up in a certain number of communities, but the reports did not provide the number of centers.
SDG&E and SCE generally did not report the number of visitors served.
Despite the power shutoffs, recent wildfires in California were still caused by (or at least associated with) electrical equipment or power lines. For example, the Saddle Ridge Fire in October 2019 began under a transmission tower ( 10 ). In Northern California, the Kincade Fire, which also began in October 2019, started near a PG&E power line where part of a broken line was discovered ( 11 ). Even before recent wildfires in 2018 and 2019, PG&E reported that its electrical equipment had started over 1,500 fires in California between 2014 and 2017 ( 12 ).
Significant challenges also remain in PSPS implementation. Work by Hill et al. (2020) identified how PSPS events have several health and safety implications in residential settings (e.g., refrigerating medications and food, regulating indoor temperature, powering medical devices), community settings (e.g., pumping water, powering traffic lights), and healthcare settings (e.g., scheduling procedures, conducting procedures) ( 13 ). Recent research found that vulnerable populations (e.g., households with someone with a chronic condition, children under the age of five, older adults over 65, or an income 30% or less for the area and household size) living in PSPS zones reported higher levels of distress, worse physical health, and trauma stemming from Northern California wildfires in 2018 ( 14 ). The research also found that those who experienced a PSPS event reported poorer physical health, and higher vulnerability individuals expressed greater concern about the consequences of PSPS events ( 14 ). PSPS events are further complicated by structural interests, as put forth by Guliasi ( 15 ). The research identified contrasting visions over the future of energy between utilities and regulatory agencies in California, which caused regulatory inertia and impeded decision-making. As transportation agencies become more involved in PSPS events, discussions are likely to revolve around producing resilient systems that do not conflict with sustainability goals ( 16 ). Similarly, PSPS strategies will need to consider growing transportation electrification. Work by Beheshtian et al. (2018) found significant vulnerabilities in New York City’s motor fuel distribution following a disaster and argued for more renewable and decentralized power/fuel infrastructure for transportation ( 17 ). However, Feng et al. (2020) cautioned using EVs in evacuations, noting that utilities would face significant supply issues that could cascade into widespread power failures ( 18 ).
Transportation and Power Failures
Recent research on disasters has reported and identified transportation challenges that result from power outages. Studying the 1998 Ice Storm in Canada that left 4.7 million without power, Chang et al. (2007) identified transportation failures with high extent/scope (e.g., inoperable traffic lights, inability to pump fuel), though only moderate impact compared with other critical infrastructure ( 19 ). Similar issues arose during the August 2003 Blackout (caused by a combination of software issues, human error, and trees tripping lines) that affected tens of millions in the Northeast United States and Canada: traffic signals were inoperable, traffic management facilities were shut down, trains were suspended, fuel could not be pumped, and flights were grounded ( 20 – 24 ). Beyond the immediate impacts, Hill et al. (2020) also noted excessive mortality rates and long-term adverse health effects (e.g., gastrointestinal illness from spoiled food) from the August 2003 Blackout ( 13 ). Research by DeBlasio et al. (2004) emphasized the urgent need for advanced preparations and planning, institutional coordination (also noted by Tipaldo and Galgano [ 24 ]), and decision making that prioritizes key actions and communications ( 22 , 23 ).
Other research has also studied power outages and transportation. For example, Melnikov et al. (2015) found lower traffic flows and slower traffic right after a major outage in Amsterdam, but then higher traffic flows and recovered speeds throughout the rest of the day ( 25 ). The research posited that the timing of the outage led more people than usual to drive for their commute, rather than take public transit. Ulak et al. (2018) noted that areas around Tallahassee, FL that generated more trips (i.e., residential areas) were also more affected by power outages during and following Hurricane Hermine in 2016, though the Tallahassee city center was still highly functioning ( 26 ). Hurricane Isaac in 2012 resulted in electricity disruption for 1 million customers in Mississippi and Louisiana, leading to trip times of three to four times longer as people attempted to find air conditioning, fuel, food, water, and information on their home’s damage ( 27 ). Along with traffic caused by inoperable traffic signals, congestion led to significant delays in relief distribution and supplies deliveries ( 27 ). Finally, during Hurricane Sandy in 2012, a significant number of people on the U.S. East Coast lost power, but social media communication continued during and after the storm ( 28 ). Two significant patterns that emerged from Twitter posts analyzed in the research were related to power outages and transportation. A real-time model, as developed by Sadri et al. (2018), could help identify traveling behavior and transportation needs ( 28 ).
Key Literature Gaps
Despite this growing literature on power outages, disasters, and transportation, several key gaps remain. First, little is known about transportation impacts related to deliberate shutoffs (i.e., PSPS events), which differ in preparedness time, restoration, and impact compared with unexpected outages. Second, even though there has been work on the impact of outages on transportation systems, research has not fully explored how people make travel choices before, during, or after these events. For example, people may leave an affected area or try to collect resources, causing localized congestion. Those with reliance on electrified transportation (such as subways, light rail, electric buses) may experience significant service disruptions when getting to work or finding safety. The goal of this paper is to begin addressing these gaps, leading the transportation field to establish a more consistent and accurate understanding of travel behavior in these PSPS events, which can be eventually (1) tied to transportation modeling approaches (e.g., Murray-Tuite and Wolshon [ 29 ] and Intini et al. [ 30 ]), (2) integrated with related behavioral research for evacuations that are caused by wildfires (e.g., Kuligowski [ 31 ], Wong et al. [32, 33], and Grajdura et al. [ 34 ]), and (3) developed into its own comprehensive field (e.g., Lindell et al. [ 35 ]).
Data and Methods
We next briefly describe the two PSPS events related to the paper, with a focus on PG&E and the East Bay area. We then discuss the survey distribution, analysis methods, and limitations.
October 9 to 11 PSPS Event (2019)
Beginning on October 4, 2019, a 7-day weather forecast report from the Northern California Geographic Area Coordination Center’s Predictive Services unit identified a potentially strong wind event. PG&E began monitoring the event and found that it matched forecasts from October 8 and 9, 2017, when several catastrophic fires occurred (e.g., the 2017 Northern California wildfires) ( 36 , 37 ). As PG&E continued to monitor the forecast over the following days, the initial weather prediction was classified as “high risk.” This classification indicated the presence of a combination of variables (e.g., dry fuels, critical weather conditions) that could lead to the ignition and growth of a significant fire ( 37 ). Throughout the following days, the PG&E meteorology team used weather forecasts and models to analyze and identify the potential fire risk time periods and geographic locations. As the analysis continued, the National Weather Service began to issue Fire Weather Watches for the upcoming event. The notifications indicated a high likelihood of a high-risk weather event. By October 6, anticipated peak wind speeds in the North Bay were 60 to 70 mph and 45 to 50 mph in the East Bay; PG&E decided to activate Emergency Operations Centers ( 37 ). One day later, the first notifications were sent to customers just after 13:00 on October 7 to nearly 600,000 customers, with power shutdowns beginning in the early morning on October 9 ( 37 ). In this example, a notification time of about 2 days before shutoff was provided. In the following days, the weather models continued to remain consistent and showed no significant changes to the events predicted ( 37 ).
PG&E notifications, National Weather Service red flag warnings, and local government announcements told residents about the potential PSPS events and encouraged them to prepare (e.g., gather resources, prepare backup generators) ( 38 ). The notifications relayed that the weather patterns were predicted to last through October 10 ( 38 ). On the morning of October 9, PG&E implemented its first PSPS to 513,000 customers in high-risk areas in Northern and Central California. However, the second PSPS phase, which would affect roughly 234,000 customers in the eastern and southern parts of the San Francisco Bay Area and was scheduled for noon, was delayed until later in the afternoon ( 38 ). In all, PG&E reported that over 700,000 customers lost power, which corresponds to over a million people ( 8 ).
Even before the PSPS event, the San Jose mayor told residents to plan for a PSPS event for as long as 7 days ( 39 ). Still, many residents across California expressed frustrations, especially as businesses, schools, and other services were unavailable owing to power shutoffs ( 39 , 40 , 41 ). California Department of Transportation officials worked to keep critical thoroughfares and tunnels open, while the Bay Area Rapid Transit (BART) Authority maintained public transit services, with some limitations in place (e.g., escalators out of operation at select stations) ( 39 ). By the morning of October 11, most East Bay counties had fully restored power (e.g., of the 30,827 customers in Alameda County 100% of them had power restored) ( 42 ).
October 26 to 28 PSPS Event (2019)
Before the PSPS event that began on October 26, PG&E monitored meteorological conditions, forecasts, and models in areas where PG&E’s assets (e.g., electrical lines) were located. PG&E’s internal models were compared with external resources including the European Center for Medium-Range Weather Forecasts, Global Forecast System, Northern and Southern Operations Predictive Services, and the National Weather Service ( 43 ). PG&E also segmented customer service areas into nine different sections so potential customer impacts could be localized and then analyzed. PG&E provided information on the potential PSPS event through its website. During the PSPS event, the PG&E website had 4.2 million unique visitors, 7.7 million visits, and over 20 million page views. The site also had key information translated from English into six languages (Chinese, Korean, Russian, Tagalong, Spanish, Vietnamese) ( 43 ).
Early on October 24, PG&E forecasts indicated that certain areas could experience high wind concurrent with high fire risk. On October 24, PG&E sent customer notifications (via call, text, and email) alerting them of the possibility of a PSPS event, approximately 2 days in advance of the first shutoffs ( 43 ). The 36 to 48 h advanced notifications included instructions, such as to charge electronic devices and gather nonperishable food items. On October 25, PG&E representatives visited customers in person who had not confirmed receipt of previous PSPS event notifications and continued distributing PSPS updates. On October 26, a PG&E notification alerted customers that power would be shut off in 12 h ( 43 ). In the following days, PG&E continued to release notifications updating customers on the estimated PSPS event timeline and potential time of power regeneration. On October 29, PG&E released the “All Clear” notification, confirming the end of the PSPS event ( 43 ). The month’s previous PSPS event better prepared residents for the October 26 to 29 PSPS event and many had gathered resources (e.g., ice, generators) before the event ( 44 ). However, some residents were still unprepared (e.g., had not charged EVs) and some businesses anticipated losses of as much as $10,000 ( 44 ). At this time, research has not been conducted to identify how prior preparations for PSPS events could affect traffic flow or other key outcomes (e.g., grid balancing).
Survey and Analysis Methods
To fill the literature gaps, we conducted an online survey of East Bay Hills residents in the San Francisco Bay Area (n = 210), administered between November 2019 and February 2020. The survey focused on the two large-scale PSPS events described above that were conducted by PG&E between October 9 to 11 and October 26 to 28 in 2019. Questions were predominately centered on travel choices and behavior during the events, while also including some contextual questions about preparedness and communications. Another section of the survey was designed to capture evacuation intentions, which will be the source of future research using the data set. These two events were notable in their size (see Table 1) and their wide range of impacts on transportation, which included,
Failure of traffic lights (both events),
Closing of gas stations (both events),
Effort to keep the Caldecott Tunnel (a major thoroughfare in the East Bay) open (first event), and
Reduced service on the BART system (first event).
Survey distribution was enabled through partnerships with over 20 local organizations, city departments, and regional entities including emergency management agencies, transportation agencies, public transit operators, fire departments, police and public safety departments, and advisory councils. Outreach was also conducted to local news and media outlets. Partners were allowed to share a link to the online survey with any online communication methods including but not limited to Facebook, Twitter, Nextdoor, organization websites, and email listservs. Several organizations also opted to distribute physical flyers with the link to attendees at local meetings. Participants were offered the chance to win one of five $200 gift cards. Details of the sample are provided in the Appendix. The demographics of the sample follow those in the East Bay Hills: predominately wealthy, auto-dependent, highly educated, white, and older.
We analyzed the data in two different ways: (1) descriptive statistics of travel behavior and preparedness actions, and (2) simple binary logit models to identify factors that influenced a change in travel. We present the descriptive statistics first, providing key measures related to power failure, trip-making, long-distance trips, communication, and preparedness. Next, we present six binary logit models, one for each day without power, that focus on the choice of changed travel versus regular travel. We decided to build six separate models for each day as power shutoffs were not uniform across people or geographies. By separating the models, we could identify the influencers of travel behavior for each day as the shutoff progressed, while also offering an opportunity to compare across days to see whether influencers changed. Low sample sizes also prevented us from building other types of models, which is a study limitation and is noted below.
For the modeling, we first identified categorical dependency between the dependent variable (i.e., the choice to change travel or conduct typical travel) and approximately 50 independent variables by conducting a series of chi-squared tests, helping guide variable selection. Following methodology from Ben-Akiva and Lerman ( 45 ), we retained statistically significant and behaviorally relevant variables. We note that we only tested preparedness variables for the first day of lost power for each PSPS event, as the question was worded as actions “before the PSPS event.” We also decided to retain several nonsignificant demographic variables (up to a p-value of 0.2), opting for less bias (though also reduced efficiency). These variables could also help guide future research. Several nonsignificant power loss variables were also included to control for past days of power loss that may have affected future travel.
Study Limitation
This study has several limitations. First, we note that the survey has a self-selection bias as people opted into the study. Given the online delivery of the survey, we also probably missed a subset of the population that does not have access to the Internet. The sample is also not random, as we worked with multiple agencies to distribute the survey. Further, the survey was relatively long (i.e., with the median duration of completed surveys at about 1 h) and contained several questions related to evacuation intentions and sharing of transportation and shelter in disasters, leading to some attrition. Future surveys of PSPS events should probe risk perceptions and the direct impact of these events (on medical devices, cooling needs, etc.) to improve accuracy and results. The long survey time may also increase bias in the results, particularly reflecting respondents who may have more free time. Future surveys may need to subdivide evacuation intentions and PSPS event information into two separate surveys. The survey was also conducted in English, excluding non-English speakers.
In addition, the low sample size restricted us from employing other types of discrete choice models, in particular the identification of multinominal logit models for the directionality of travel change (i.e., more or fewer trips). Consequently, the models are highly simplistic. We tested mixed logit models for each binary model, but we did not find any significance, probably because of the low sample size and only one response per person. Models were also divided by day, rather than considering all days together, which is also a limitation. Future work with a larger sample size might consider other model forms, such as latent class choice models and sequential logit models.
Results
In this section, we present descriptive statistics of travel behavior, preparedness, and some communications, followed by the results from six binary logit models for the decision to conduct typical or different travel.
Impact of PSPS Events on East Bay Residents
We first present key descriptive statistics on the impact of two October 2019 PSPS events on East Bay residents in Contra Costa and Alameda counties (see Table 2). The results show that a significant portion of residents lost power in both PSPS events. However, fewer people responded that their workplaces lost power, probably because workplaces and job centers in the East Bay are not concentrated in high fire risk areas that experienced power loss. Consequently, most people did not miss a day of work/school. In relation to preparedness activities, nearly all of the respondents conducted at least some preparations before both events, though activities were more frequent for the first event. Preparation was common in preparing electronics and backup power sources, finding information about the events, and buying key supplies (e.g., gas, food, water). Moreover, a significant number of people conducted general disaster preparedness activities such as preparing/restocking emergency supply kits, learning about their community’s emergency plans, and updating their own emergency plans. These actions may better prepare households for future disasters and increase awareness of hazards.
Impact of PSPS Events and Communications for East Bay Residents
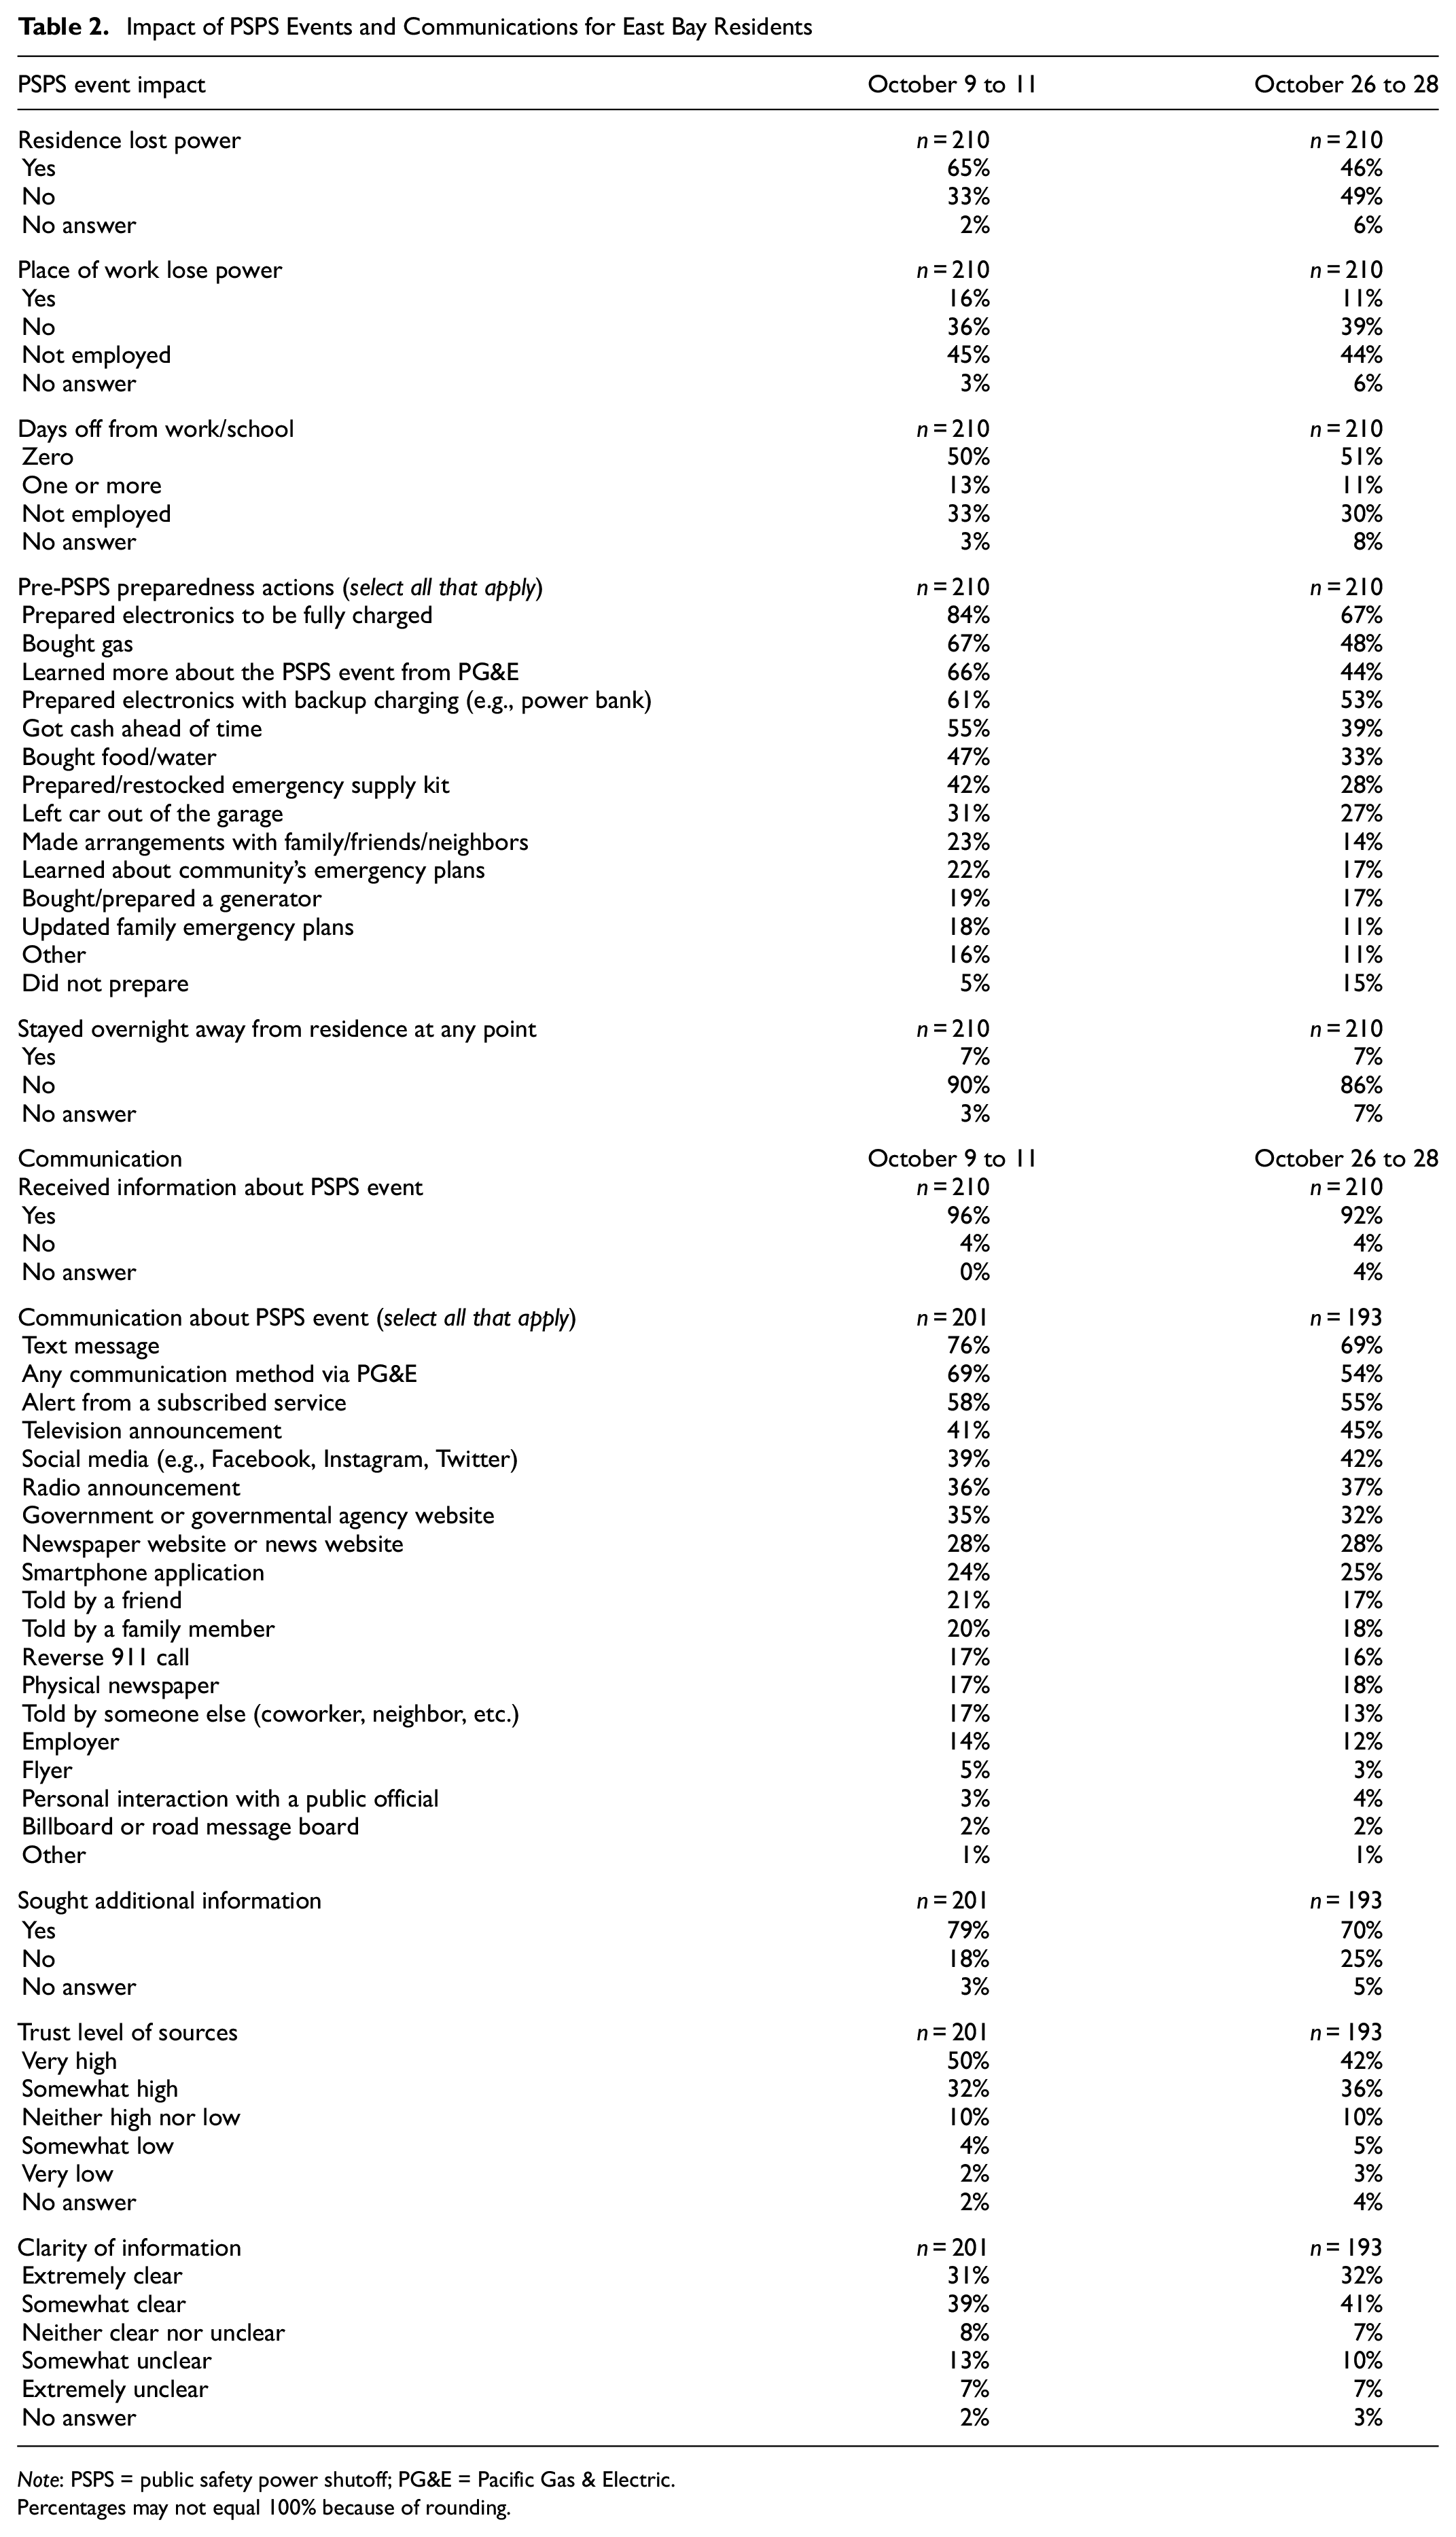
Note: PSPS = public safety power shutoff; PG&E = Pacific Gas & Electric.
Percentages may not equal 100% because of rounding.
Communication of PSPS Events
Communication of information before, during, and after PSPS events provides residents with critical knowledge. Generally, customers receive an initial 36 to 48 h advanced notification for a potential PSPS event, followed by a 24-h, 12-h, and shutoff notification ( 37 , 43 ). Table 2 presents several descriptive statistics of the communication of the two PSPS events. We found that participants tended to receive information the most through text messages, via PG&E, and from subscribed alert services (e.g., Alameda County Alert; Contra Costa County Community Warning System). The results indicated a high usage of mobile phones to receive communication and high uptake of subscribers to East Bay alert systems. Still, newer forms of communication such as social media and traditional forms (e.g., television, radio) were also widely used to gain information. In general, how residents received information indicates that official sources (i.e., from the governments, news outlets, or utilities) were more widely used than word-of-mouth through social networks. We also found that most respondents sought out additional information from more than one source, owing to some confusion before the event (as noted by the clarity of information question). Communication sources were viewed as somewhat or highly trustworthy by most respondents.
Changes in Travel Behavior During PSPS Events
We also asked participants if they altered their travel, changed the number of trips, changed their transportation mode, or took an extended trip during the day (Figures 1 to 4). Figure 1 shows that most people did not change their travel during the PSPS events. This result indicates that transportation systems will experience somewhat regular travel patterns during power loss days. Of those who changed their travel, more people took fewer trips or did not travel than people who took more trips. While the total trips may have decreased, localized congestion at inoperable traffic lights and near destinations for supplies (e.g., gas stations, grocery stores) may have still occurred. Moreover, we found that just a handful of respondents altered their transportation mode, indicating further stability in travel patterns. However, in Figure 4, we found that 25% to 43% of people who did leave their residence because of the PSPS events took a trip for an extended part of the day. This “day-time evacuation” was to find resources (e.g., power, Internet, air conditioning, etc.) and may affect some transportation systems.

Change in travel behavior for each public safety power shutoff (PSPS) day (n = 210).

Change in number of trips during public safety power shutoff (PSPS) events (of those who did not conduct typical travel).

Change in mode of transportation (of those who did not conduct typical travel).

Conducted an extended trip during the day owing to the public safety power shutoff (PSPS) event (of those who did not conduct typical travel).
Choice Models for Changing Travel During PSPS Events
We developed six simple binary logit models for the choice of (1) changing travel the day of the PSPS event and (2) conducting typical travel. Positive coefficients indicated that the variable was associated with a change in travel. Variables were also tested in a mixed logit structure with 1,000 Halton draws for each model, but we did not find significant deviations. Simulation draws enable the easy and fast estimation of the mixed logit model owing to its open-form structure. The October 9 to 11 PSPS event is presented in Table 3 and the October 26 to 28 PSPS event is presented in Table 4.
Binary Logit Models for Changing Travel for Each Day of the October 9 to 11 PSPS Event
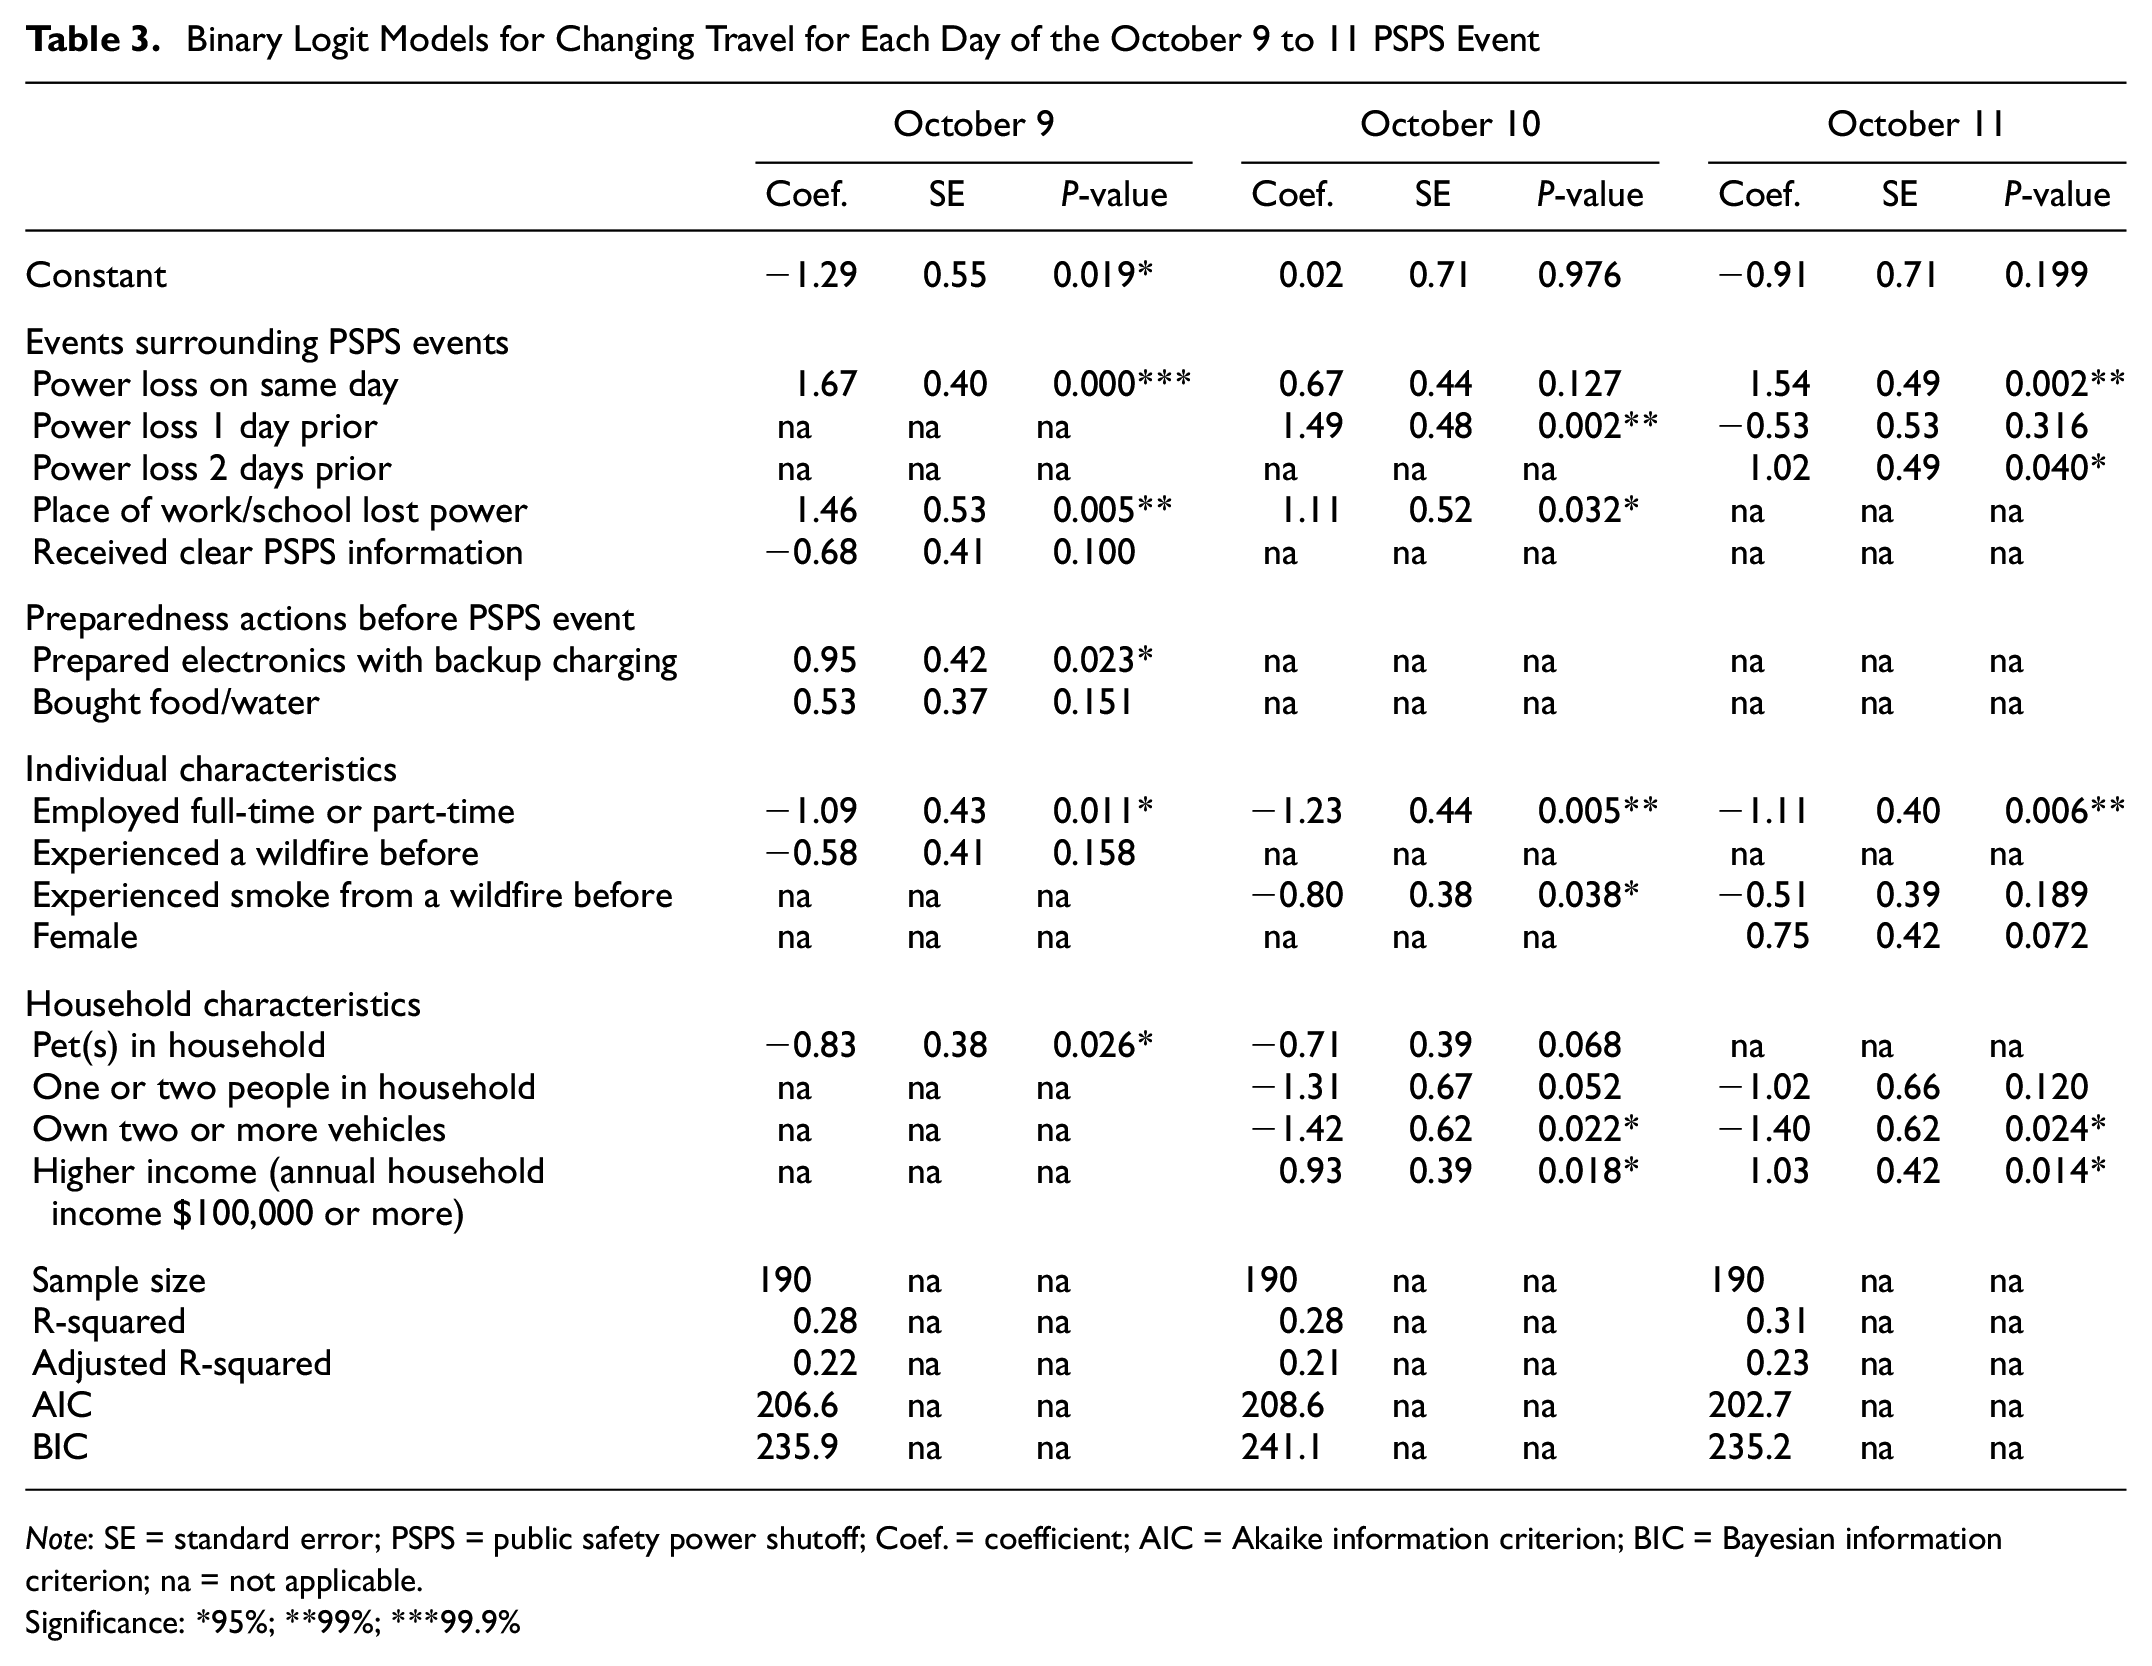
Note: SE = standard error; PSPS = public safety power shutoff; Coef. = coefficient; AIC = Akaike information criterion; BIC = Bayesian information criterion; na = not applicable.
Significance: *95%; **99%; ***99.9%
Binary Logit Models for Changing Travel for Each Day of the October 26 to 28 PSPS Event
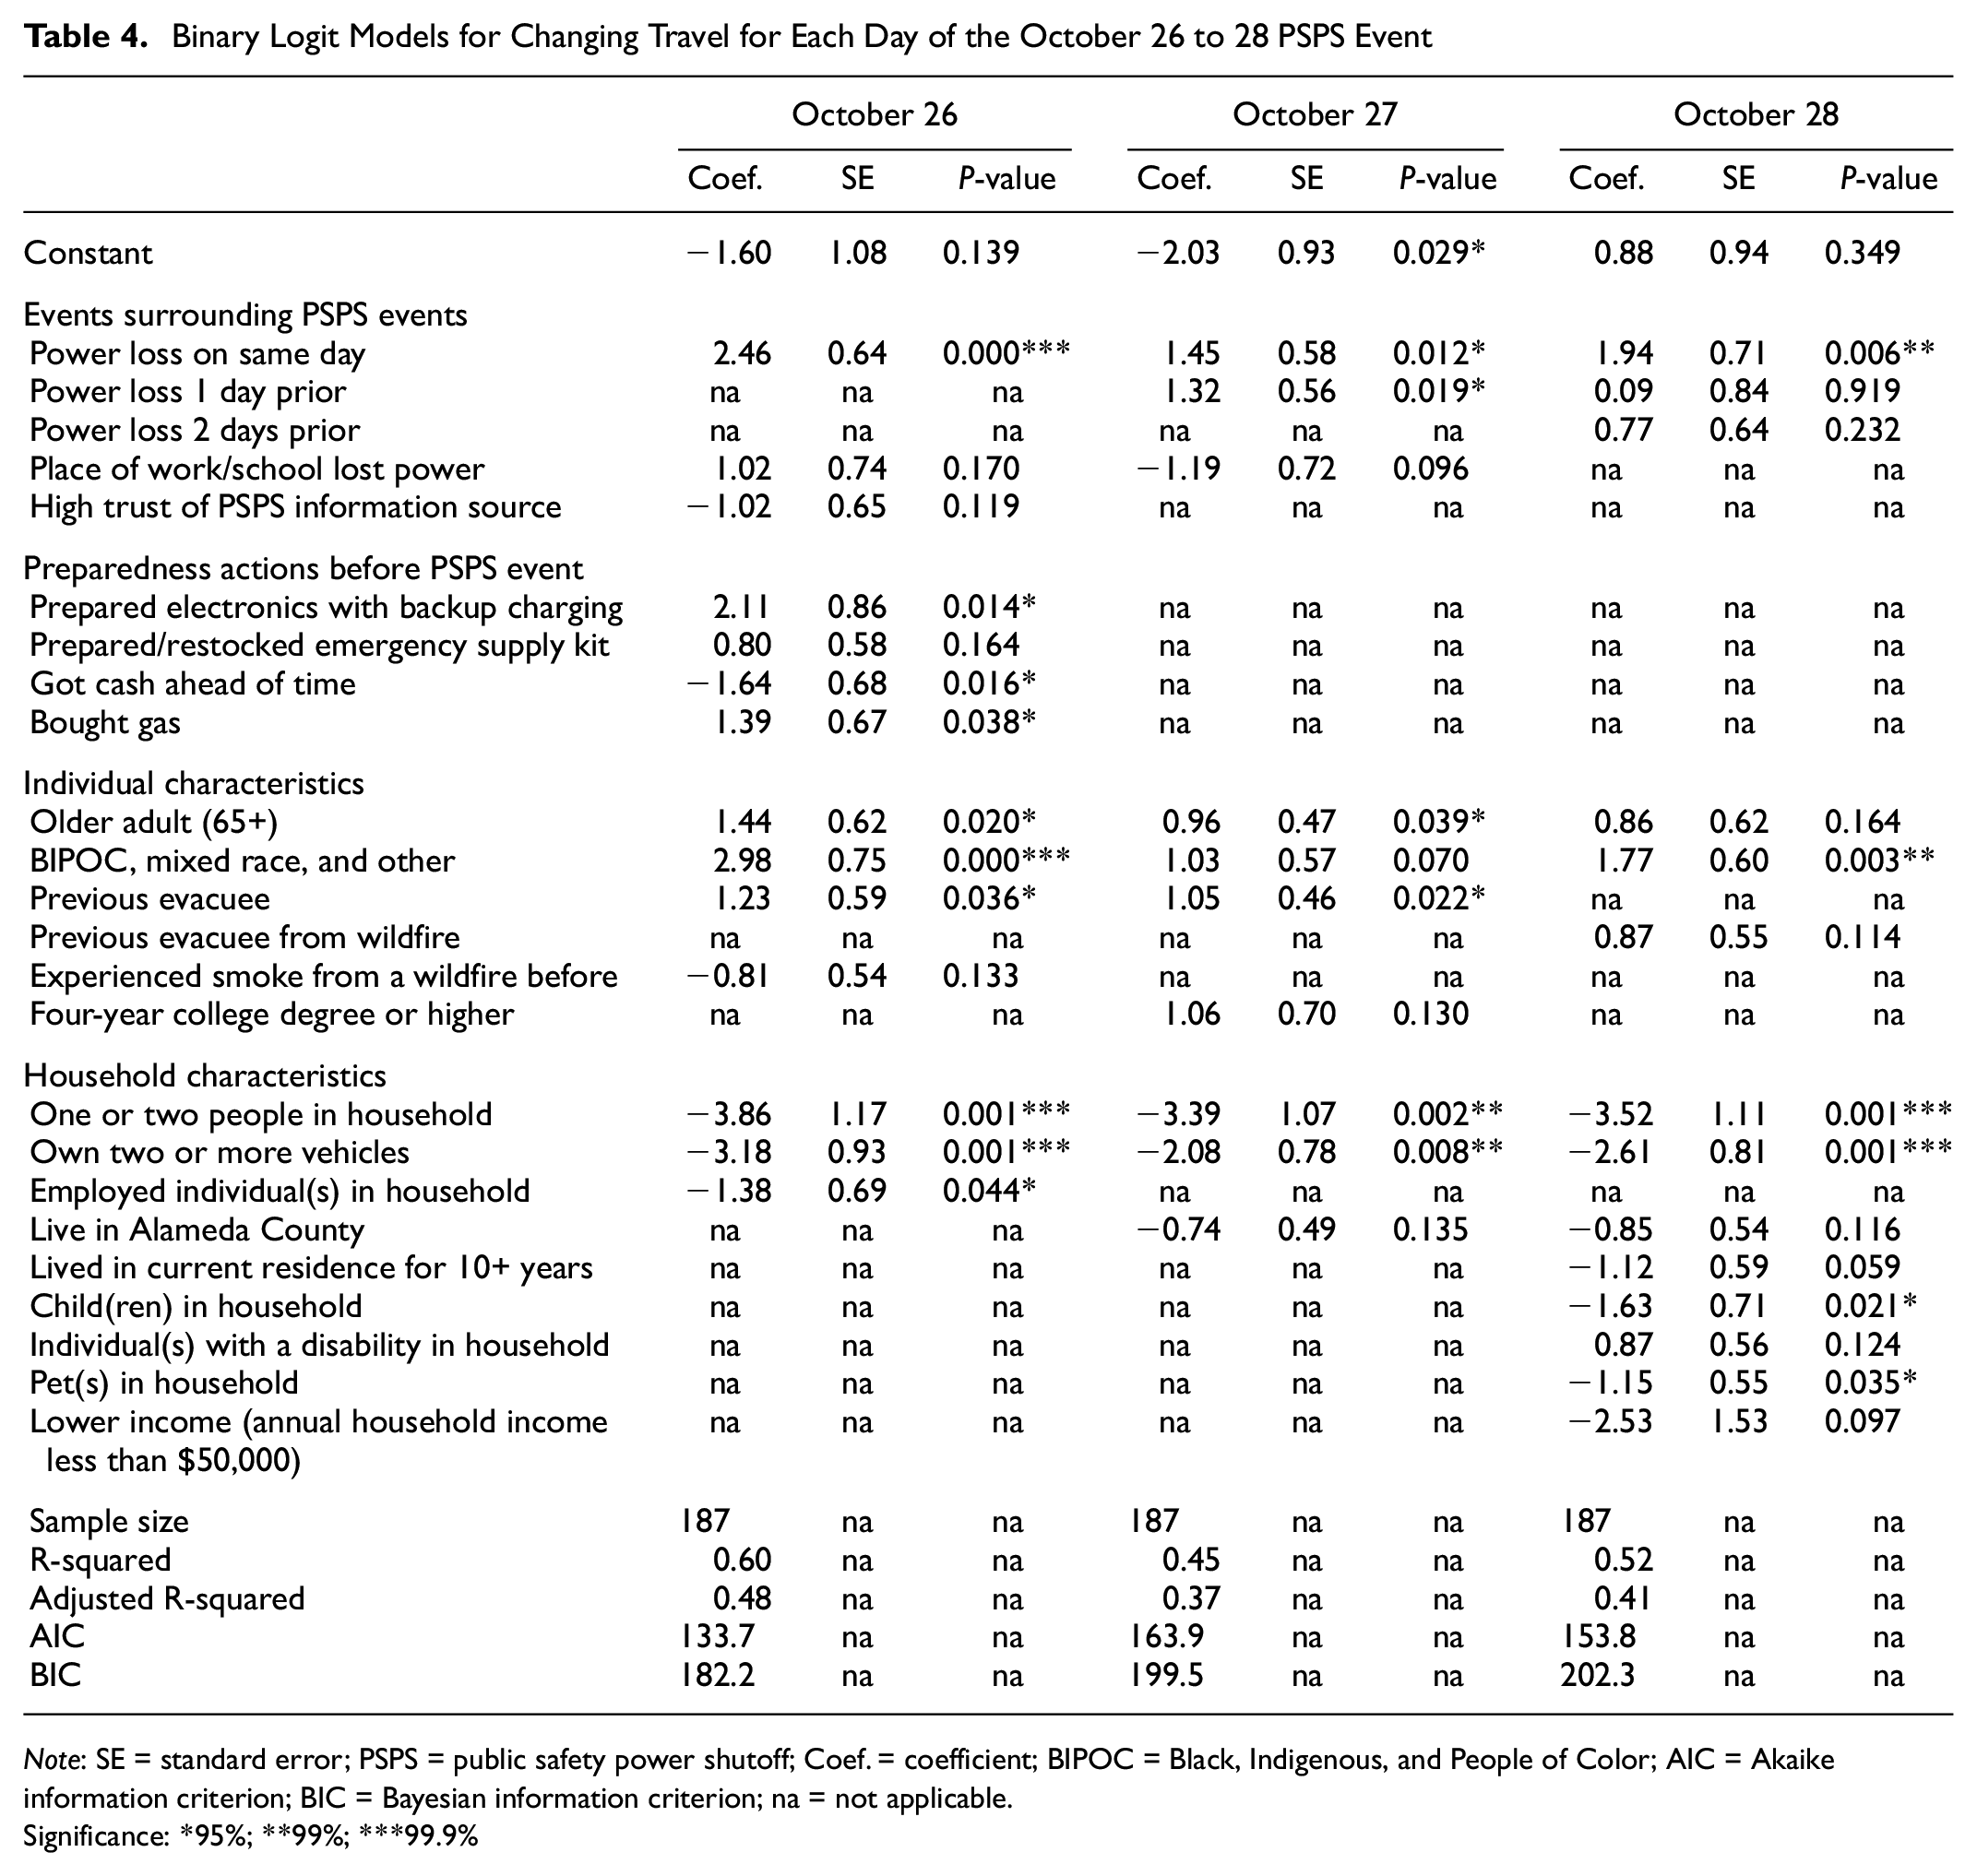
Note: SE = standard error; PSPS = public safety power shutoff; Coef. = coefficient; BIPOC = Black, Indigenous, and People of Color; AIC = Akaike information criterion; BIC = Bayesian information criterion; na = not applicable.
Significance: *95%; **99%; ***99.9%
Choice Models for October 9 to 11 PSPS Events
For October 9 and 11 (Table 3), people who experienced power loss that day were also more likely to change their travel. For October 10, the prior day’s power loss (i.e., on October 9) was more influential. This aligns with descriptive results that some people conducted extended trips, changing their travel, because of the PSPS events. People who lost power at their workplace or school were also more likely to change their travel for October 9 and 10. With some workplaces losing power, some people may have conducted work at home or in a community space. For preparedness events on October 9, only preparing electronics with backup charging was significant for affecting travel change. People may have traveled to purchase additional batteries or power banks to ensure their electronics would not fail.
Most individual characteristics were insignificant. However, we found that full-time and part-time employees were more likely to conduct typical travel. This result runs counter to our finding related to the loss of power at work/school. We hypothesize that the variable may be capturing individuals who were still required to work during the PSPS events. Those who had experienced smoke from a wildfire before were more likely to conduct typical travel for October 10. These individuals may have general higher preparedness levels, enabling them to travel more regularly.
For household characteristics, those with pet(s) in the household were more likely to conduct typical travel (October 9) along with those who owned two or more vehicles (October 10 and 11). While we anticipated that more vehicles in the household would lead to unique travel behavior, the results may indicate the travel consistency of auto-centered households. Households with higher incomes were more likely to change their travel, perhaps because they had the means to leave the PSPS event area for the day or overnight.
Choice Models for October 26 to 28 PSPS Events
For the October 26 to 28 PSPS event, power loss on the same day was significantly correlated with the decision to change travel (Table 4). This result mirrors the earlier PSPS event. The power loss on October 26 also contributed to changed travel on October 27, indicating some lagging effects. This lagging could exist because some individuals with enough resources for 1 day of lost power might have lacked resources for subsequent days. In this way, each additional day of power loss compounds the resource loss and challenges faced at home. For preparedness, preparing electronics and buying gas were both positive and significant, and are likely to be associated with additional trips. Interestingly, getting cash was tied to typical travel behavior, which could result from the co-location of ATMs at key destinations covered by typical travel (e.g., going to a grocery store).
For individual characteristics, older adults were more likely to change their travel (October 26 and 27), perhaps in search of power for medical devices and cooling. Black, Indigenous, and People of Color (BIPOC), racially mixed individuals, and individuals that stated their race as other were also more likely to change their travel (October 26 and 28). Previous evacuees were more likely to change their travel. For household characteristics, smaller households and those who owned two or more vehicles were more likely to conduct typical travel for all 3 days. Smaller households may not have needed to add trips to gain more resources or may not have been as concentrated in the power loss area. Respondents with employees (October 26), children (October 28), and pets in the household (October 28) were all more likely to conduct typical travel.
Discussion
This initial study to understand travel behavior during PSPS events yielded several key insights that could guide future research and assist practitioners in their transportation response.
Key Takeaways
First, people conducted a significant number of preparedness activities, suggesting that they took the potential hazard seriously and were generally ready for the mitigation event. This level of preparation is encouraging, as many of these tasks can help prepare households for other hazards including wildfires. High levels of preparedness (at the household and community levels) may also be associated with the substantial number of communication methods through which respondents received PSPS event information. In particular, the uptake of alert subscribers is encouraging for disseminating information quickly. Moreover, when the grid is deenergized, the variety of communication methods increases the likelihood that governments will be able to reach impacted individuals.
Second, we found that most respondents did not change their travel behavior overall, which reflects evidence by Chang et al. (2007) that transportation is only moderately affected by power outages (especially compared with other critical infrastructure) ( 19 ). However, those who did change their travel can be largely grouped into four unique categories based on the descriptive statistics: (1) nontravelers or minimal travelers; (2) extended day-trippers (e.g., in search of power); (3) localized resource gatherers (e.g., in search of supplies); and (4) long-distance evacuees. Future research will need to reask survey questions in a way that can better capture these answers as a multinomial choice for easier and clearer modeling. Indeed, the survey presented for this paper only asked whether travel had changed (a binary “yes” or “no” question), without asking for further details on how travel changed (as seen in the categories above).
Third, we did not find compelling evidence that people significantly changed their mode choice (as was found in Melnikov et al. [ 25 ]). This difference may be explained by a scheduled power outage that occurred over a longer time. Moreover, the East Bay Hills do not have frequent or extensive public transit coverage for possible modal shifts. Along these lines, we did not find any concrete results that the number of trips increased, as was found in Ulak et al. (2018) for a hurricane example ( 26 ). However, since the survey did not ask about the change in travel time or distance of trips, a conclusion about other transportation effects cannot be formed with this survey. These significant limitations can be overcome by an improved survey, a larger sample size, and targeted questions based on this initial research.
Fourth, our series of six binary logit models showed clear evidence that a loss of power at the residence altered travel behavior. Moreover, we found that some preparedness activities, individual characteristics, and household characteristics were associated with changes in travel. However, we noted that several demographic characteristics (e.g., age, gender, race, education, employment status, income) were not always consistent or significant from model to model. Regardless, the models indicate that these characteristics should continue to be explored in future work on travel behavior in PSPS events, especially when more data can be collected. Owing to limitations in the survey in the wording of questions and low sample sizes, we were unable to conclude much on why certain respondents changed behavior or the direction of this change (i.e., fewer trips, more trips). Future work is needed to test other discrete choice models, which is a limitation of this study.
Planning and Policy
Finally, related to policy making and transportation response during PSPS events, our results indicated that significant congestion is unlikely to occur, except at facilities that require power as described in past literature (e.g., Chang et al. [ 19 ], DeBlasio et al. [22, 23] and Miles et al. [ 27 ]). Generators, backup batteries, and solar power can help keep key intersections, infrastructure, and intelligent transportation systems operational during PSPS events. Backup power should also be planned for vulnerable residents (e.g., those with power needs that are required for survival) who may also have low mobility and poor access to reliable transportation.
Our results also indicate that a substantial number of respondents left their residence for the day to seek power and other resources. Community resource centers should continue to be prioritized by utilities and government agencies as safe locations for people to congregate and receive necessary supplies. To facilitate increased accessibility and equity, centers should be (1) located near public transit, (2) preestablished in communities with more vulnerable individuals, and (3) dynamically assigned via mobile vehicles to affected neighborhoods. Utilities and agencies need to prioritize resources to individuals without reliable access to transportation and who rely on electricity for survival. Future work is also needed to better assess who is most affected by PSPS events, how much hardship they experience, and how they experience it. This research need follows work previously done by Coleman et al. (2020) on the power and transportation hardships experienced by vulnerable populations following Hurricane Harvey in 2017 ( 46 ).
Utilities and agencies should also consider planning for and even promoting short-distance evacuations during PSPS events, similar to the urging by officials in Berkeley, California to leave during one event in 2020 ( 47 ). With a small proportion of the sample already conducting this action, a more formal recommendation could help direct people to places with power and reduce the number of potential evacuees if a wildfire does occur. In addition, utilities and agencies should begin to consider the impact of EVs on the grid before, during, and after PSPS events. EVs could help provide backup power to critical medical devices at home and facilitate evacuations. However, if vehicles do not have substantial charge, households may not be able to gather supplies. Moreover, evacuees may have trouble reaching their evacuation destination in the event of a wildfire.
Conclusions
This research constitutes the first research effort to understand the effects of PSPS events on individual decision-making related to travel and preparedness activities. Although the early results and findings from the survey of East Bay residents (n = 210) are most valuable for California, this research could also assist utilities and agencies in other states with high wildfire risks (e.g., Colorado, Oregon, Washington, Arizona, Idaho, Montana, Florida).
Through descriptive statistics, we found relatively stable travel patterns without any major increases of trips generated during the PSPS events. However, those who did change their travel did so to remain at home, gather resources, find power (through extended day trips), or conduct long-distance evacuations. Preparedness activities were common, indicating high levels of preparedness in the East Bay Hills. Moreover, the variety of communication methods, clarity of messaging, and high trust of sources indicate that people were able to receive adequate information on the events. Modeling results found that power loss influenced people to change their travel behavior, whereas a variety of individual and household characteristics also affected travel choice.
Beyond the United States’ context, opportunities exist to expand this work to other countries with significant wildfire risks (e.g., Canada, Australia, Spain, Portugal, Greece). The growing frequency and intensity of disasters will make these PSPS events more common and more challenging with growing electrification in transportation. Electrification and PSPS events present several new research directions. For example, work is needed to determine the feasibility and realization of EVs as battery sources to deliver power back to the grid, homes, and key devices (e.g., mobile phones, medical devices). However, delivering power to drained EVs during evacuations could bring potential challenges. Moreover, research is needed to understand charging behavior before PSPS events and evacuations. Public transit electrification (especially of buses) also requires further research to ensure their resilience and operation during disasters. Future research could build on this study, which offers a unique starting point for transportation agencies, utilities, and governments to maximize the benefits of power shutoff events for all people.
Supplemental Material
sj-docx-1-trr-10.1177_03611981221078569 – Supplemental material for Power Trips: Early Understanding of Preparedness and Travel Behavior During California Public Safety Power Shutoff Events
Supplemental material, sj-docx-1-trr-10.1177_03611981221078569 for Power Trips: Early Understanding of Preparedness and Travel Behavior During California Public Safety Power Shutoff Events by Stephen D. Wong, Jacquelyn C. Broader and Susan A. Shaheen in Transportation Research Record
Footnotes
Acknowledgements
We thank emergency and transportation agencies, cities, planning councils, and news sources across the East Bay who distributed the survey. We thank Professor Joan Walker and the Transportation Sustainability Research Center for their support and time given to the project. Finally, we thank the three anonymous reviewers for their supportive comments and feedback.
Author Contributions
The authors confirm contribution to the paper as follows: study conception and design: S. Wong, S. Shaheen; data collection: S. Wong; analysis and interpretation of results: S. Wong, S. Shaheen; draft manuscript preparation: S. Wong, S. Shaheen. All authors reviewed the results and approved the final version of the manuscript.
Declaration of Conflicting Interests
The authors declared no potential conflicts of interest with respect to the research, authorship, and/or publication of this article.
Funding
The authors disclosed receipt of the following financial support for the research, authorship, and/or publication of this article: This research was made possible by the National Science Foundation Graduate Research Fellowship Program, the Dwight D. Eisenhower Transportation Fellowship Program, and funding from Professor Joan Walker.
Supplemental Material
Supplemental material for this article is available online.
References
Supplementary Material
Please find the following supplemental material available below.
For Open Access articles published under a Creative Commons License, all supplemental material carries the same license as the article it is associated with.
For non-Open Access articles published, all supplemental material carries a non-exclusive license, and permission requests for re-use of supplemental material or any part of supplemental material shall be sent directly to the copyright owner as specified in the copyright notice associated with the article.