
Abstract
Police officers on duty on the road for traffic stops, vehicle collisions, traffic direction, and so forth, are exposed to the risk of being hit or even killed by a passing vehicle. Very few studies have tried to develop a system that can warn pedestrians or police officers on duty on the road to take proactive evasive action. This study proposes an Internet-of-Things protection system for police officers on duty on the road. The development of the system envisaged involves three essential phases: 1. detection, 2. risk analysis, and 3. warning and communication. This study focused on the risk analysis phase. We applied a fuzzy rule-based algorithm that integrates four input indicators (lateral distance from police officer to traveled lane, magnitude of speeding, stopping sight distance, and direct distance) into a single estimate of the risk of a collision. The study used data from a real-world situation on Highway 416 in Ontario, Canada to demonstrate the application of the proposed model. The results clearly demonstrated that the proposed model could generate risk estimates that could be used to give timely warning of a possible collision risk to police officers at work on a road.
Police officers have several duties such as directing traffic and pedestrians, stopping traffic for speeding, assisting/investigating severe collisions that require officers to be on the road and exposed to the risk of being hit by a passing vehicle. Between 2003 and 2013, 138 police officers were struck and killed on U.S. highways ( 1 ). Data for 2015 to 2019 showed that 50 police officer deaths resulted from being struck by a vehicle. During this 5-year period, traffic stops accounted for 24% of the deaths and assisting/investigating vehicle collisions for 22% ( 2 ).
Much research has considered the road safety of the general public ( 3 – 5 ), but little research has been conducted on reducing the number of collisions involving police officers on duty. This study proposes a new mathematical algorithm for developing a real-time Internet-of-Things (IoT) protection system to protect police officers who are on duty on the road. The IoT protection system in this study refers to a variety of wireless-connected devices such as sensors, detectors, and computers that can be used to provide field officers with real-time situational awareness and early warning of a possible collision.
The adoption of IoT technologies in road safety is creating new ways to improve situational awareness for people using the roads. Examples include built-in vehicle devices, such as an automatic pedestrian detection system, which use advanced sensing technologies (LiDAR or radar) ( 6 ). Another example is a prototype system called “WalkSafe” that aims to protect distracted pedestrians who are using a smartphone by alerting them. The system relies on phone cameras for detecting vehicles coming toward a pedestrian ( 7 ). Foerster et al. proposed a similar pedestrian protection system called “SpareEye” that also uses smartphone cameras ( 8 ). The system alerts the pedestrian to vehicles along the pedestrian’s walking path. Lin et al. developed an IoT system called “pSafety,” which uses a smartphone’s GPS data to estimate the position of a pedestrian and to provide a warning of a potential collision with an approaching vehicle 3 to 4 s before the collision might occur ( 9 ). Tong and Jia developed augmented reality glasses (i.e., a wearable device), which activate a warning when there is a risk of a collision ( 10 ). The screen on the virtual reality glasses displays the remaining time to a collision and shows the expected path of the approaching vehicle. Some studies have considered the safety of construction zone workers by investigating the possibility that wearable devices, known as smart vests, could reduce collision risk with approaching vehicles. The researchers embedded sensors into traffic cones to detect and analyze approaching risks and the sensors could then alert construction zone workers by LED lights or by vibration in the case of a high-risk situation. The study technology warned the construction zone workers of a collision risk as soon as a single cone was hit by an approaching vehicle ( 11 , 12 ).
In an IoT protection system, a high-risk situation is generally estimated using surrogate safety indicators ( 13 ). Surrogate safety indicators are performance measures used to assess the level of risk/safety in real-time. Several surrogate road safety indicators have been introduced (e.g., time to collision, post encroachment time, time headway). Mahmud et al. ( 14 ) and Johnsson et al. ( 15 ) provided comprehensive reviews of such surrogate safety indicators. The indicators can capture a portion of the risk associated with certain types of collision. For instance, time to collision and time headway are useful indicators if capturing the risk associated with rear-end collisions, whereas post encroachment time better captures the risk associated with angle collisions at intersections. Currently, no single indicator can successfully capture all types of collisions on roadways.
The use of multiple indicators to assess collision risk requires a complex and sophisticated algorithm that can generate and integrate varying weights for the different indicators. An integrated system that can produce a single composite indicator would obviously be attractive to decision makers needing to set target goals and priorities. Arun et al. regarded the integration of outcomes from several surrogate indicators into a single composite indicator that estimates the risk associated with collisions as a promising approach, but their study focused on vehicle-to-vehicle collisions ( 16 ). No research has considered a composite indicator that could alert police officers to the risk of being hit by a vehicle.
Teodorović noted that an intelligent transportation system often needs to deal with traffic flow situations for which data are very uncertain, scarce, or both ( 17 ). As a result, the choice of an appropriate method for a study that aims to develop a new product often depends largely on the nature of the available data, and missing observed data are often a major constraint. Several advanced algorithms (e.g., deep learning) require a fairly large volume of input data to calibrate the system and some data are inevitably uncertain. In this study, it was necessary to consider actual and near-miss collisions between vehicles and police officers, but as these collisions occur only rarely, it was not possible to observe and record a large amount of relevant data for system calibration.
This study used a fuzzy rule-based algorithm to produce a single composite indicator. Zadeh proposed fuzzy rule-based algorithms as a tool for capturing and analyzing uncertainty without requiring a large amount of input data ( 18 ). A fuzzy rule-based algorithm uses a membership function to determine a membership value between 0 and 1 for each input indicator. The membership function can be changed into a “fuzzy set,” designed to capture the imprecision of the input and output indicators. These fuzzy sets can be used to evaluate binary situations such as yes/no, true/false, and those defined as linguistic variables (e.g., safer or riskier). Fuzzy rule-based algorithms have been widely used in transportation safety studies ( 19 – 22 ).
Study Goal and Objectives
The goal of this study was to develop a real-time risk assessment framework (i.e., a mathematical algorithm) for the risk analysis required in the development of an IoT protection system that can provide police officers on duty on the road with a timely warning of the risk of being hit by an approaching vehicle. The study objectives were to
Identify appropriate input indicators of the different risks associated with police officers’ diverse activities, and traffic situations;
Apply a mathematical algorithm that can integrate outputs from multiple indicators, estimate varying levels of risk, generate a single composite risk indicator, and provide an opportunity for timely warning to the police officer; and
Demonstrate the use of the algorithm in a case study involving field police officers on duty on the road.
Proposed IoT Protection System
Figure 1 shows the three phases of the proposed IoT system: (1) detection, (2) risk analysis, and (3) warning and communication.
Phase 1 (detection): A 360° scanning radar sensor can be installed, for instance, on top of a police vehicle. This sensor can detect an object within the line of sight up to a maximum radius of 700 m. The outputs of the detection phase are the positions (i.e., x- and y-coordinates), trajectories, and speeds of passing vehicles, and police officers in real-time (e.g., second by second).
Phase 2 (risk analysis): The risk analysis defines input indicators to establish the spatial and temporal interaction between the police officers and passing vehicles. The input indicators could include the lateral distance from the officers to the traveled lane, the magnitude of speeding, the stopping sight distance (SSD), and the direct distance. The indicators are then integrated (using a fuzzy rule-based algorithm in this study) to estimate a composite risk indicator. The risk indicator ranges from zero (lowest risk) to one (highest risk). The risk indicator is the outcome of the risk analysis phase and is used as an input to generate the appropriate level of warning in Phase 3.
Phase 3 (warning and communication): If the risk generated in Phase 2 exceeds various preset thresholds, the system can generate the appropriate level of audio and/or vibration warning to the police officer. The warning can be disseminated to the police officer’s equipment (e.g., mobile radio) or wearable device (e.g., wrist band) and the police officer can take evasive action.
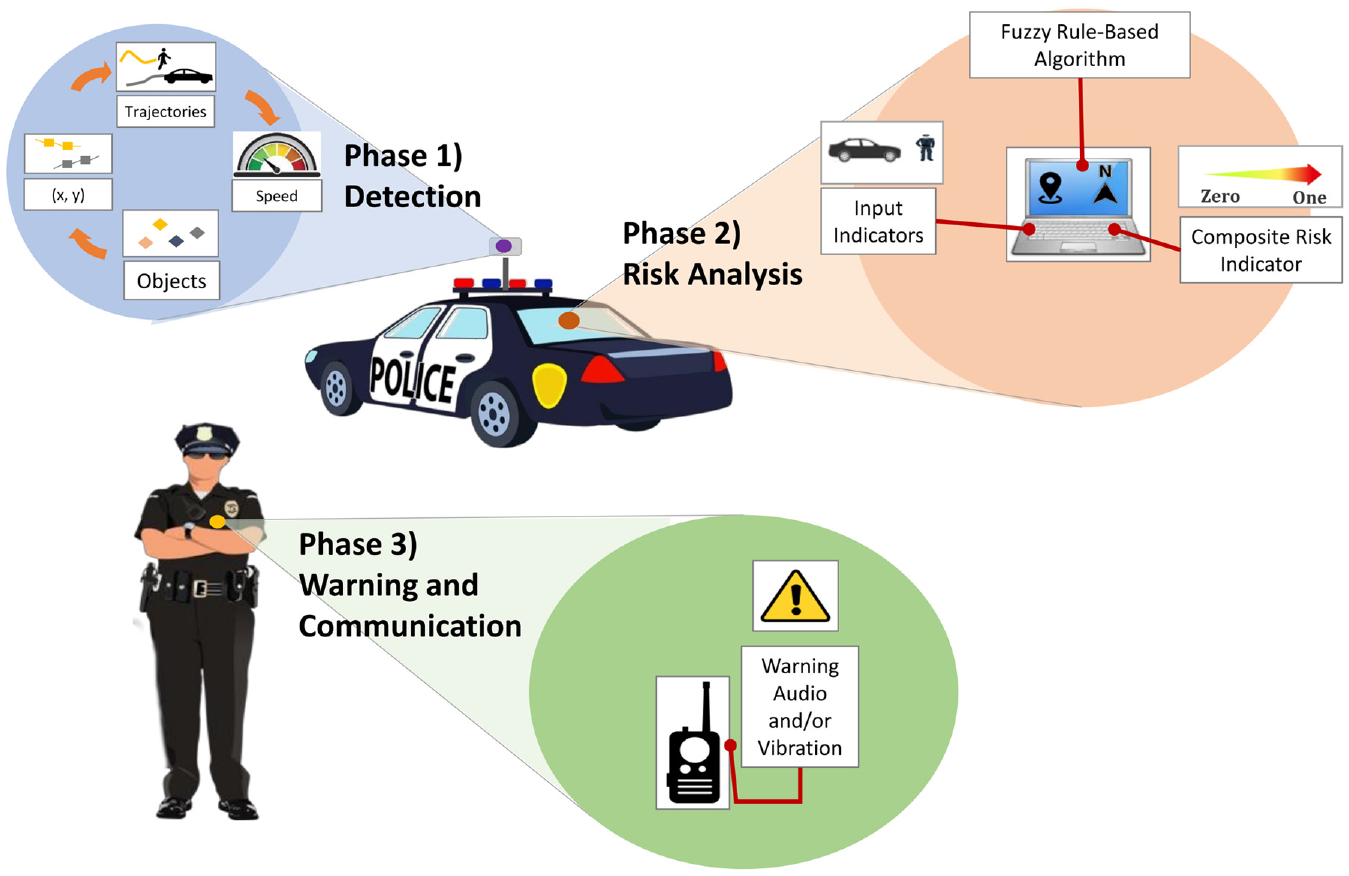
Concept of the proposed Internet of Things (IoT) protection system.
Although we aim to develop a single-unit machine that can perform all three task phases simultaneously and automatically, this study focused primarily on Phase 2 (risk analysis). As a conventional radar system can detect input information such as the second-by-second position of police officers and vehicles, the technology needed for Phase 1 already exists and this study simply adopted a radar system similar to the system applied by Mukherjee et al. ( 23 ). Phase 3 (warning and communication) will be investigated in future work.
Research Approach
The risk analysis phase comprises the following five distinct subtasks:
Identify input indicators—determine appropriate input indicators for capturing the possible collision risks associated with a police officer’s field activities and traffic environment;
Apply a mathematical model—select and use an appropriate mathematical model (a fuzzy rule-based algorithm in this study) for integrating the input indicators into a single composite indicator;
Calibrate the model—collect real-world data and use the data on input indicators to calibrate the mathematical model to mimic the real world;
Estimate the composite risk indicator—apply the calibrated model to a scenario that reflects a typical situation for police officers to illustrate how the model can be used to estimate the risk associated with the scenario; and
Validate the model—compare the model accuracy estimated by the proposed model with a past study to demonstrate how well the model estimates the risk associated with a police officer’s field activities and traffic environment.
Task 1: Identify Input Indicators
To determine appropriate input indicators, the study investigated several collisions in which first responders including police officers were struck by a vehicle ( 24 , 25 ). We also thoroughly reviewed surrogate road safety indicators used in past studies ( 14 , 15 ). We then selected or developed the four indicators shown in Figure 2. The four indicators are: (1) Indicator A (lateral distance from officer to traveled lane), (2) Indicator B (magnitude of speeding), (3) Indicator C (SSD), and (4) Indicator D (direct distance).
Indicator A (lateral distance from officer to traveled lane): When a pedestrian (a police officer in our case) is working by a roadway, there is a possibility of being hit by a passing vehicle. Transportation engineers try to provide a safe lateral distance (minimum 0.6 m) between pedestrians walking along the side of a roadway and the traveled lane ( 26 ). Figure 2a illustrates the concept of Indicator A. As the lateral distance from the officer to the roadway decreases, the situational risk increases.
Indicator B (magnitude of speeding): Aggressive driving (e.g., speeding, tailgating, running a red light) is known to be a key factor in collisions, and speeding (i.e., excessive speed) is known to be the most significant aggressive driving behavior. Several North American studies have argued that reducing speeding is one of the most promising ways to reduce any type of collision ( 27 – 31 ) and it seems very reasonable to assume that aggressive driving will contribute to increasing the probability of a collision with a police officer on a roadway ( 29 ). This study used the magnitude of speeding, that is, the speed differential between a vehicle’s travel speed and the posted speed limit, as a primary measure to assess an approaching vehicle’s aggressiveness. Equation 1 and Figure 2b explain the concept of Indicator B. As the magnitude of speeding increases, the risk increases.

where
Note that Indicators A and B do not assess any spatial interaction between an officer and a passing vehicle. These interactions can be assessed using the following two indicators:
3. Indicator C (SSD): This is an estimate of the minimum distance at which a driver notices an object (in our case an officer) on the roadway and can make a complete stop to avoid a collision with the object ( 32 , 33 ). See Figure 2c. SSD is an important highway design parameter that considers a variety of safety elements including perception–reaction time, speed, and friction coefficient (see Equation 2). In this study, SSD is presented as a binary indicator. If the distance between the vehicle and the nearest point of conflict is less than the SSD, the situation is considered risky. If the distance is longer than the SSD, the situation is considered safe.

where
4) Indicator D (direct distance): In certain situations, Indicators A, B, and C cannot capture the potential risk and will not trigger a warning that a vehicle is approaching. For instance, if a police officer is located outside the threshold lateral distance from the roadway, an approaching vehicle is traveling at less than the posted speed limit, and the vehicle’s estimated SSD appears adequate, the system may not trigger a warning. However, there could be a rare but real circumstance when a police officer may suddenly move into the roadway without noticing an approaching vehicle. To take such a circumstance into account, this study used the direct distance between a vehicle and a police officer as an input indicator (see Figure 2d). As the direct distance decreases, the situational risk increases.
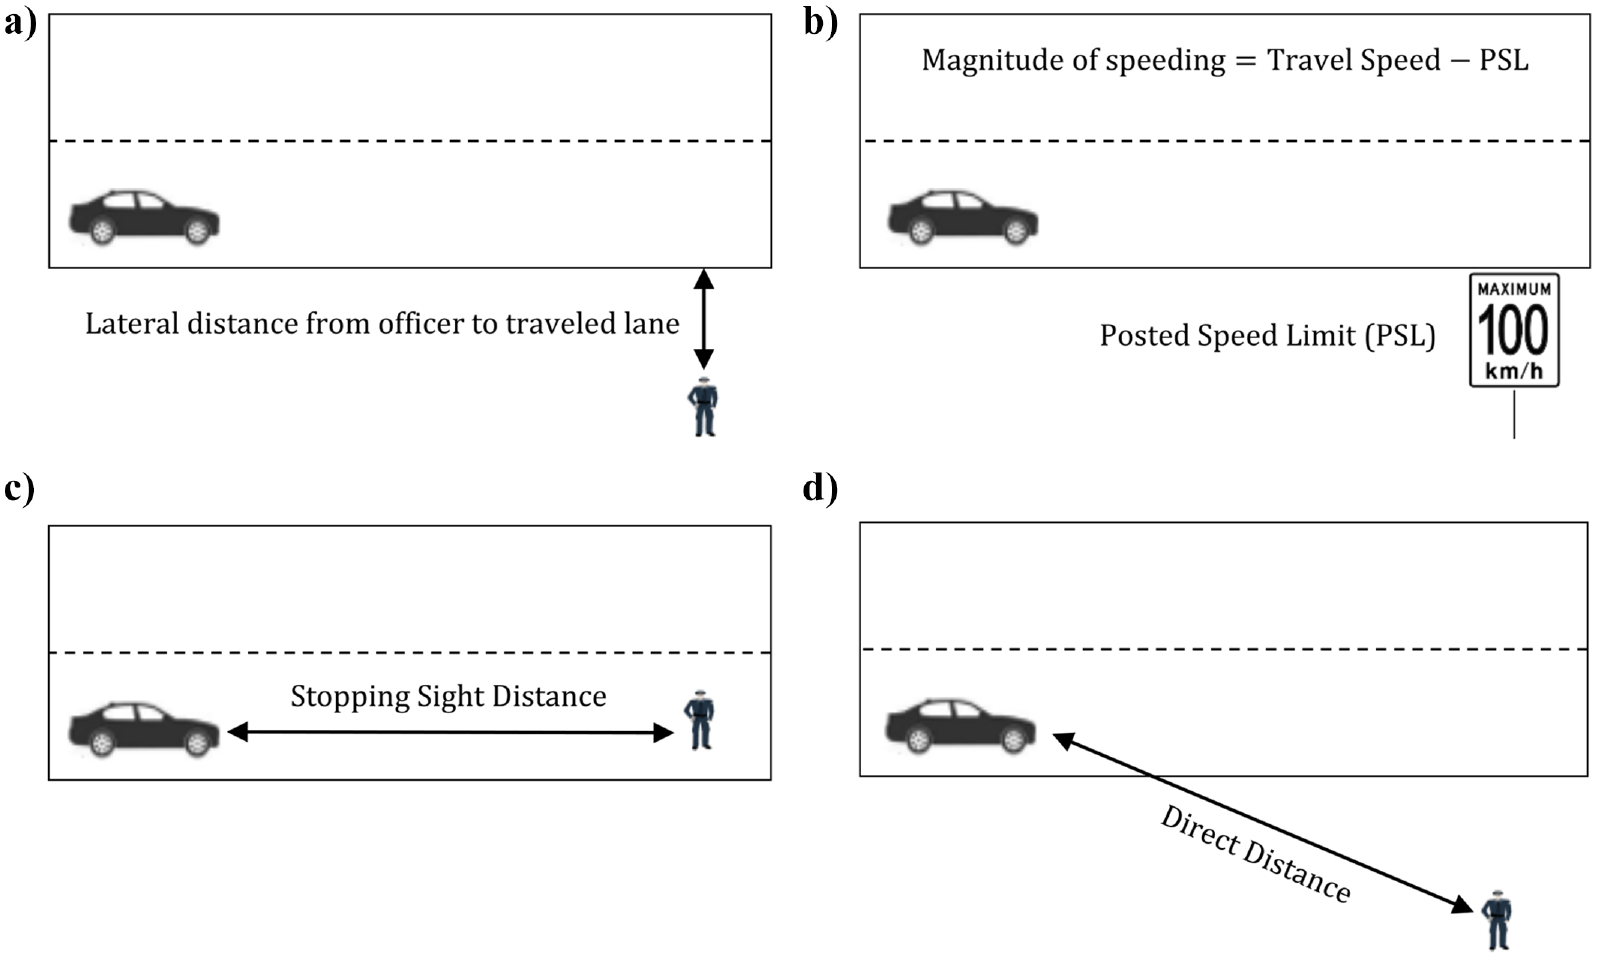
The four input indicators: (a) Indicator A, (b) Indicator B, (c) Indicator C, and (d) Indicator D.
Although this study did not use the traveling speed of vehicles as a separate and independent indicator, both Indicators C (SSD) and D (direct distance) indirectly capture the risk associated with an approaching vehicle’s travel speed. Equation 2 shows, for instance, that as a vehicle’s approaching speed increases, the SSD required for a complete stop increases. It is clear that higher speeds increase the level of risk. In addition, as the proposed system analyzes the situation second-by-second, Indicator D (direct distance) also takes an approaching vehicle’s traveling speed into account. As an approaching vehicle’s speed increases, the direct distance rapidly decreases and the estimated level of risk rapidly increases. In summary, we think it would be redundant to consider approaching vehicles’ travel speed as an independent indicator in our proposed model.
Task 2: Apply a Mathematical Model
Figure 3 shows a diagram of a fuzzy rule-based algorithm with two main modules: 1) the knowledge base, and 2) the fuzzy inference unit ( 34 ). The knowledge base is the information that a modeler needs to provide for a fuzzy rule-based algorithm. This information can be collected using past studies, experts’ opinions or both. The fuzzy inference unit refers to the consecutive processes that the algorithm follows to generate output. The fuzzy inference unit has three main stages: (a) fuzzification, (b) rule evaluation, and (c) defuzzification ( 35 ). In the fuzzification stage, the input indicators (in this study, the four input indicators shown in Figure 2) are converted into input fuzzy sets using input membership functions. The number and shape of the membership functions for each input indicator are defined in the knowledge base module. In the rule evaluation stage, the four input indicators in the form of fuzzy input sets are combined using “IF–THEN” rule constructions. The output of this stage is fuzzy output sets. The IF–THEN rules should be defined in the knowledge base module. For example, a rule could be defined as follows: if lateral distance from officer to traveled lane (Indicator A) is “safer,” magnitude of speeding (Indicator B) is “safer,” and SSD (Indicator C) is “safer,” and direct distance (Indicator D) is “safer,” then output fuzzy set is “very low.” In the defuzzification stage, the fuzzy output sets are converted to estimated risk values using output membership functions. The number and shape of the membership functions for risk values are defined in the knowledge base module. A more detailed description of a fuzzy rule-based algorithm is provided by Mendel ( 35 ).
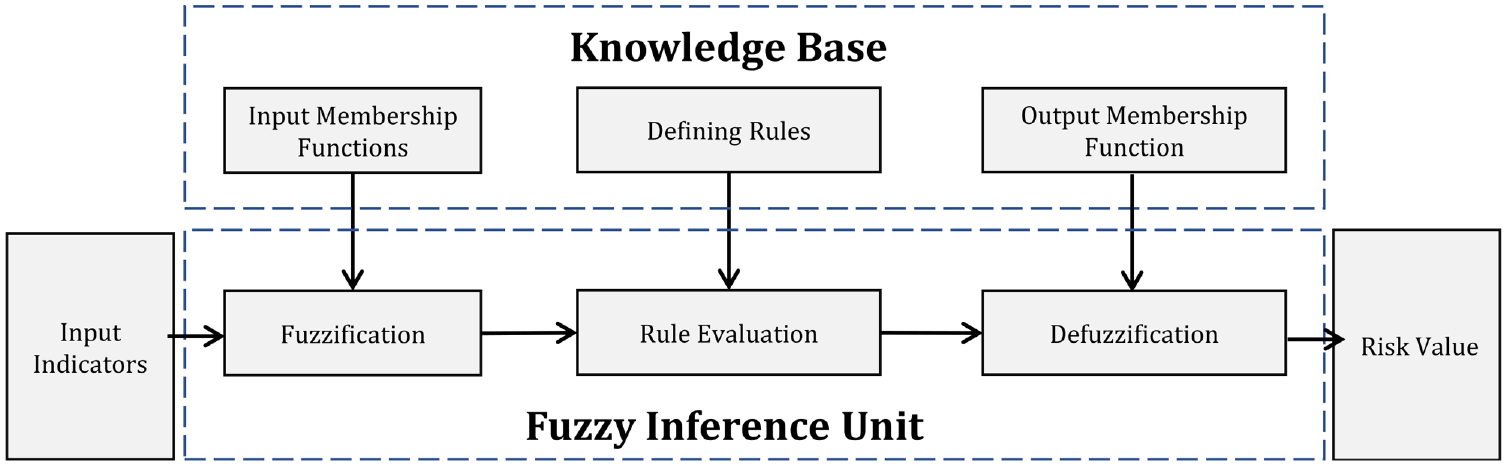
Fuzzy rule-based algorithm.
Task 3: Calibrate the Model
As the proposed IoT protection system has not yet been implemented in a real-world circumstance, the study collected data (e.g., second-by-second x- and y-coordinates, and speed data of pedestrians, traffic) from a static radar system installed on a section of Highway 416 near Kemptville, Ontario. The radar covers a 1.4-km section of a rural highway with four lanes (two lanes in each direction) and a grass median. The lane widths are 3.5 m and the shoulder widths are 3.5 m. The static radar scans 360° and can detect any moving objects within line of sight up to a maximum radius of 700 m. The proposed IoT protection system will have similar detection capabilities (see Mukherjee et al. [ 23 ]).
For the model calibration we used 51 real-world events collected on the Highway 416 section. In each situation, one or more people were performing activities outside of the vehicle (e.g., moving along a shoulder lane or even crossing a highway). As an example, Figure 4 shows a real-world event that can be considered a risky circumstance. The left part of Figure 4 shows a truck driver (the blue box) outside the truck while a vehicle is approaching (the white arrow). The right part of Figure 4 shows a bird’s eye view of the situation with the truck driver standing on the roadway by the front of the truck with the vehicle about to pass him. From the moment that the truck driver stepped out of the driving cabin, it took 13 s for the approaching vehicle to pass the driver.
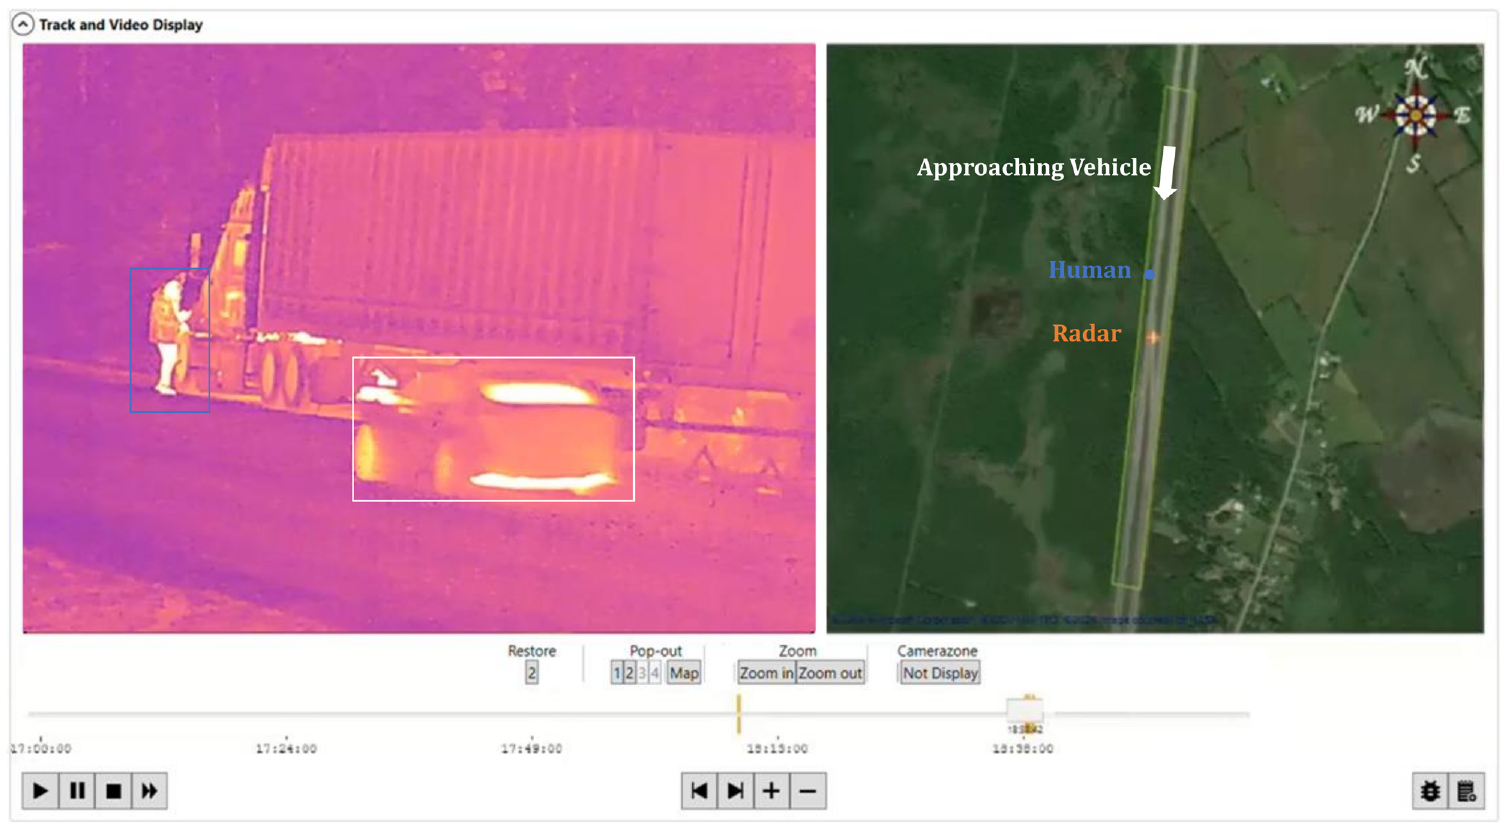
Real-world situation showing a pedestrian at risk.
We think that this situation is comparable to a police officer ticketing a stopped vehicle. For this particular situation, we were able to access recorded data showing 13 consecutive seconds of second-by-second trajectories of the driver moving in the area by the truck and the vehicles passing by.
Figure 5 shows the three-step calibration process required to localize the fuzzy rule-based algorithm to a study location: Step 1: fuzzification, Step 2: rule evaluation, and Step 3: defuzzification.
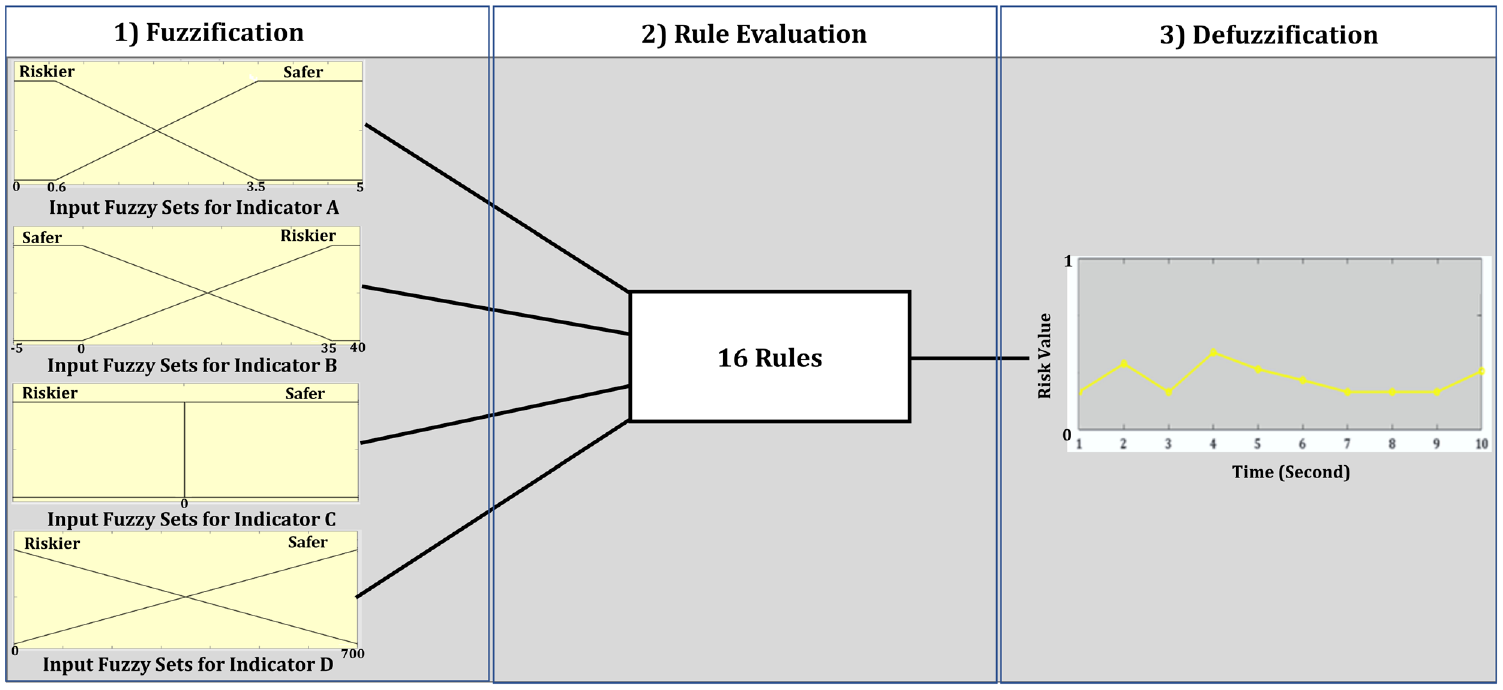
Proposed fuzzy rule-based algorithm.
Step 1) Fuzzification
This step includes the following three substeps:
Determination of input fuzzy Set: We assigned the most basic number (two) of input fuzzy sets for each indicator, that is, each indicator could be “safer” or “riskier.”
Determination of membership function for input fuzzy set: Several alternative types of membership function can be adopted including triangular-, trapezoidal-, or bell-shaped. As the trapezoidal-shaped function can uniformly discriminate between riskier and safer situations it was considered the most suitable function for this study.
Determination of boundary values for membership function: The boundary values of a membership function play an important role in a fuzzy rule-based algorithm. In this study, the boundaries were determined by using existing knowledge obtained either from the relevant literature or from analyzing data in our study area.
For the boundary values for Indicator A, we used the lateral buffer space regulation suggested by the U.S. Department of Transportation ( 26 ). The lateral buffer space is a lateral area that separates traffic flow from the workspace or collision site (providing safe space for workers such as police officers to perform their duties on the road). The minimum lateral buffer space is usually 0.6 m and the maximum value is usually approximately 3.5 m (one full lane-width) ( 36 – 38 ). This study set the boundary values of the input fuzzy sets of Indicator A as 0.6 m and 3.5 m, respectively.
The boundary values for Indicator B were estimated from the data for vehicle travel speeds at the study site. Figure 6 is a boxplot showing the distribution of the travel speeds. As the posted speed limit of the study section is 100 km/h, the boundary values for the fuzzy sets for Indicator B were 0 km/h and 35 km/h (= 135 − 100 km), that is, the magnitude of speeding varies from 0 km/h to 35 km/h.
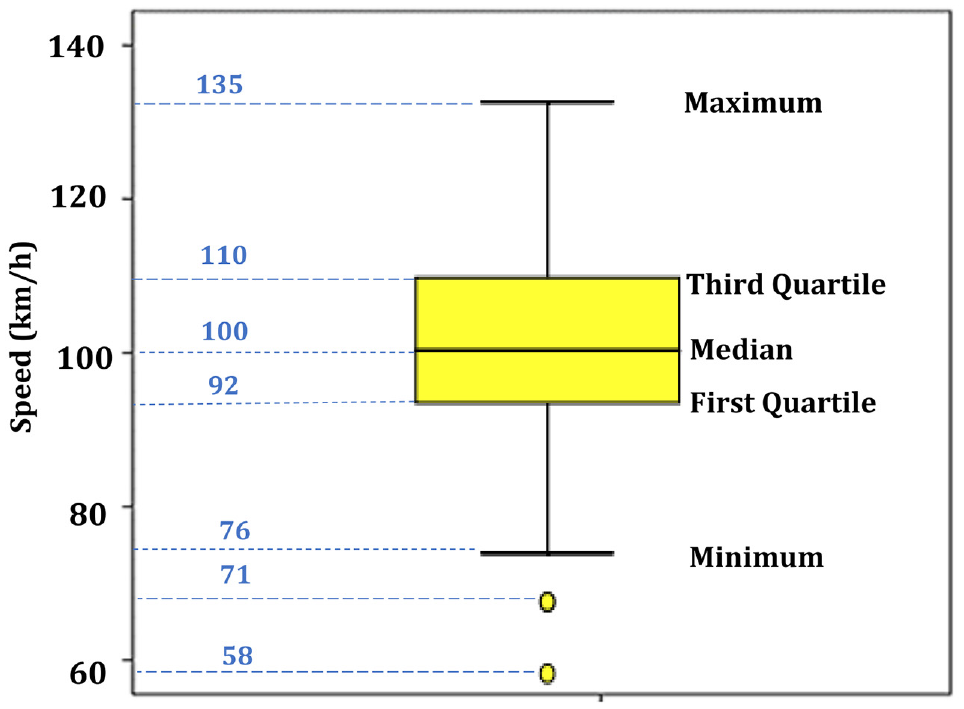
Distribution of vehicle travel speeds.
The boundary value for Indicator C was based on the SSD presented in the most recent geometric guidelines ( 32 ). We estimated the distance from an approaching vehicle to the nearest point of conflict and compared this with the SSD. If the distance obtained was positive (higher than or equal to zero), the situation was considered safe. If the distance obtained was negative (lower than zero), the situation was considered risky. This means that there is only one value (zero) for the boundary condition of Indicator C.
To determine the boundary values for Indicator D, we used the maximum and minimum distance between a police officer and a vehicle. The maximum distance was the maximum distance covered by the radar, that is, approximately 700 m. The minimum distance was zero (the distance at which a collision occurs).
Step 2) Rule Evaluation
The rules provide an important bridge between the four indicators and the risk value and allow us to apply “IF–THEN” rule constructions. As there are four indicators and each indicator has two input fuzzy sets (safer and riskier), the total number of combinations becomes 16 (=
Step 3) Defuzzification
For each of the 16 rules, we needed to define the output fuzzy sets associated with the risk value. This study followed the procedure suggested in previous studies to generate predefined output fuzzy sets (
39
,
40
). We assigned an integer value 0 (safer) or 1 (riskier) to the two input fuzzy sets for each indicator. Each rule maps each input indicator
Task 4: Estimate the Composite Risk Indicator
We used data from the real-world situation shown in Figure 4 to illustrate the proposed approach. The data included 13 consecutive seconds of trajectories of a human and an approaching vehicle. Figure 7 shows the four input indicators and the estimated risk value (i.e., the composite risk indicator) during the 13 s. We used the MATLAB Simulink package to produce the risk value ( 41 ).
Indicator A (lateral distance from officer to traveled lane). Figure 7a shows that the person is positioned between 1.0 and 1.5 m from the shoulder-side traveled lane for the entire 13 s. Indicator A is expected to contribute to an increase in risk values if the person moves toward the traveled lane.
Indicator B (magnitude of speeding). Figure 7b shows that the magnitude of speeding is 0 km/h at each of 13 s except at Second 10 when the vehicle increases its speed to 102 km/h giving a magnitude of speeding of 2 km. Indicator B can be expected to contribute to an increase in risk values at Second 10.
Indicator C (SSD). Figure 7c shows that the SSD increases from 0 for the first 7 s, but increases to 1 from Time 8 onwards. The value of 1 for SSD means that the vehicle could not stop in time if the person moves into the traveled lane or if the driver loses control of his vehicle. Indicator C can be expected to contribute to an increase in risk values from Time 8.
Indicator D (direct distance) Figure 7d shows that the direct distance between the person near the truck and the approaching vehicle decreased until Time 11 and then increased after passing the person. Indicator D was expected to contribute to gradually increasing risk values as the vehicle came closer to the person up to Time 11, to become 7 m (highest risk) at Time 11 and then decrease as the vehicle increased its distance after passing the person at Time 11.
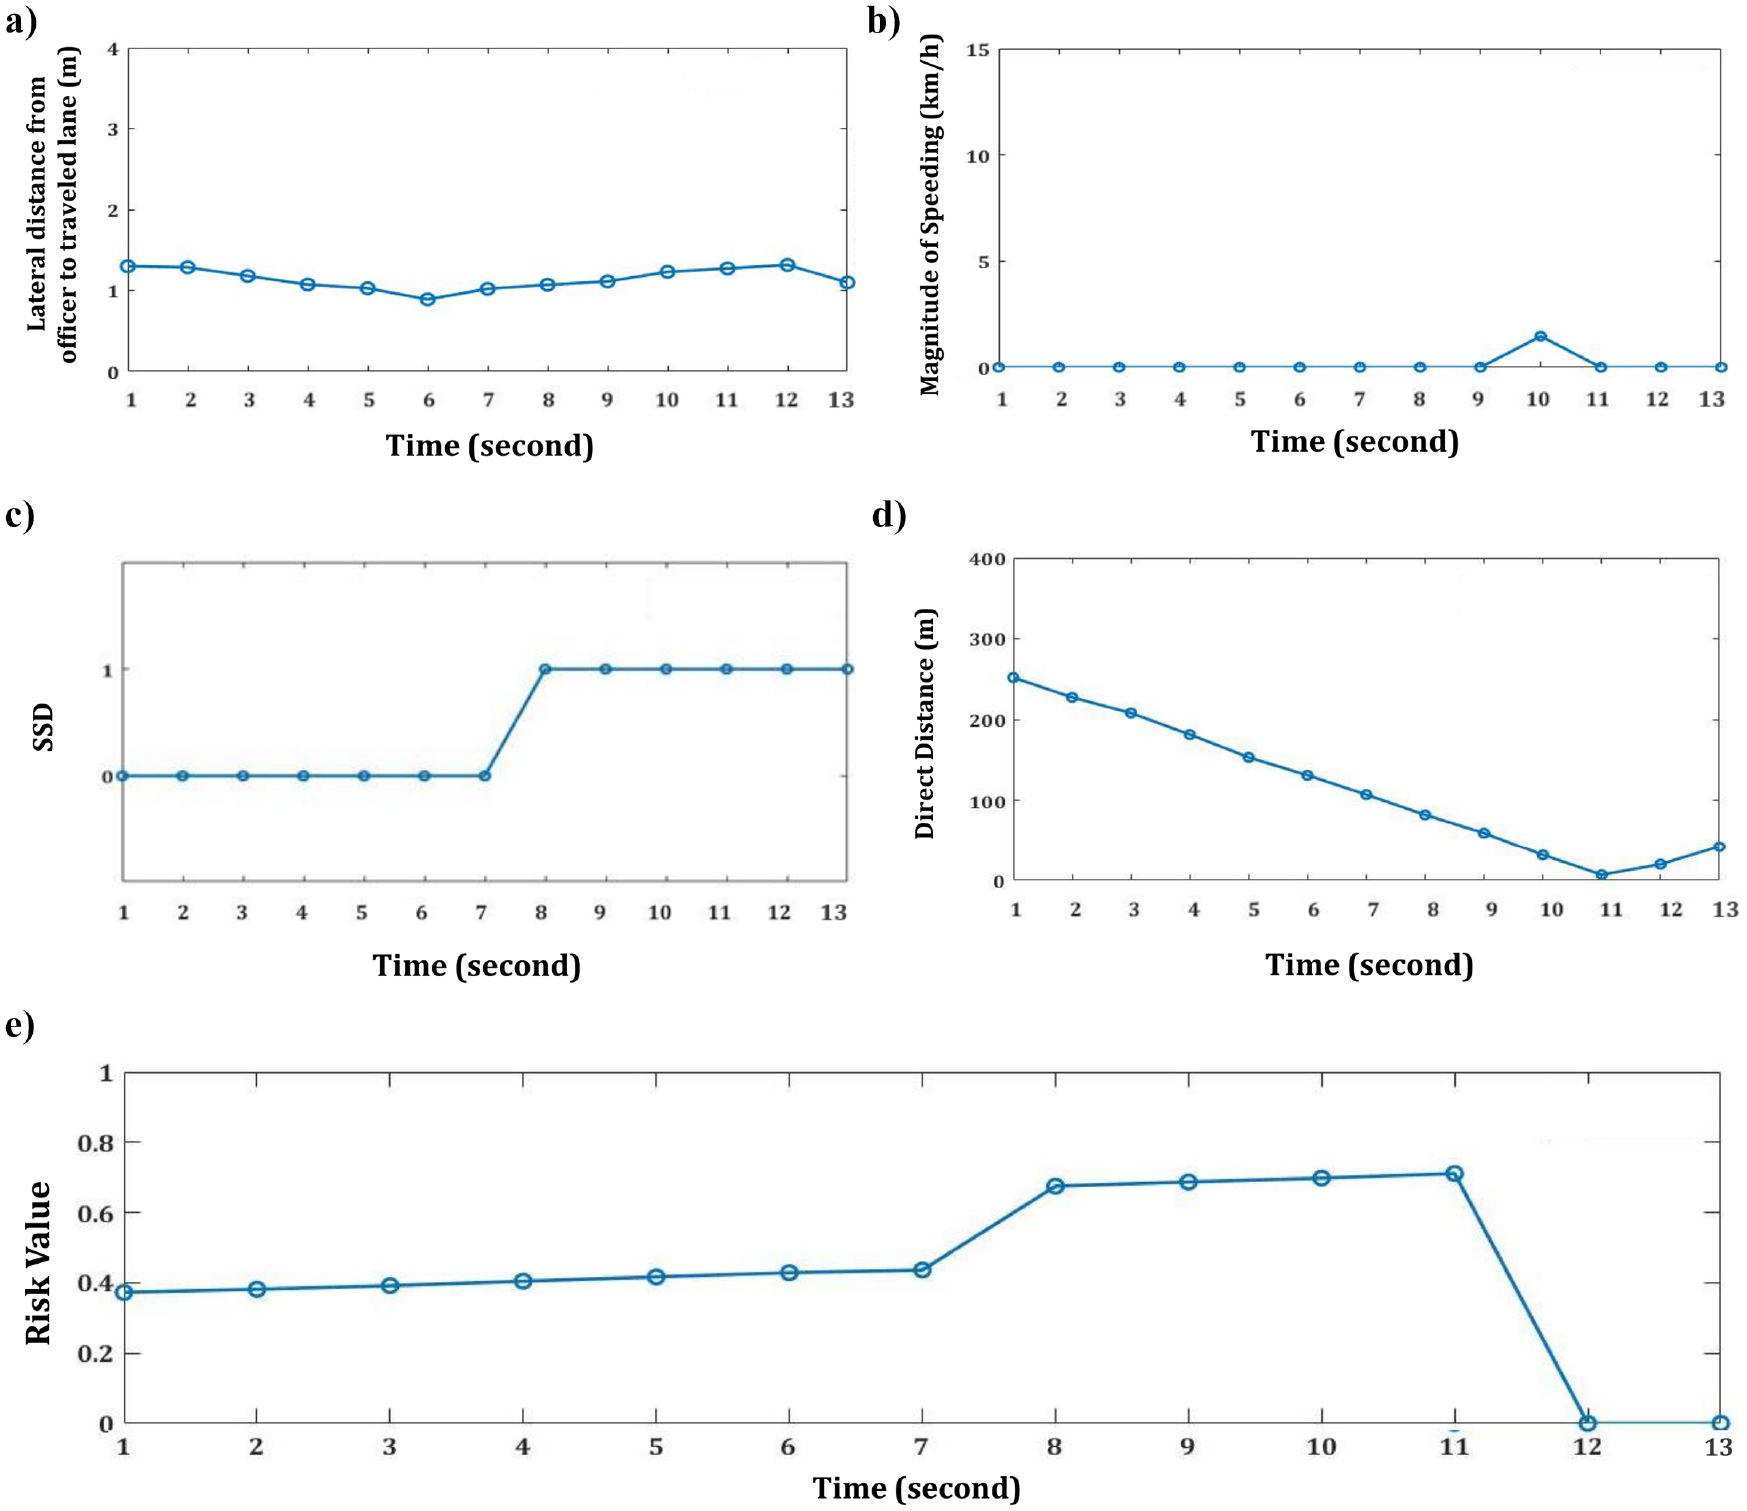
Risk analysis results: (a) Indicator A, (b) Indicator B, (c) Indicator C, (d) Indicator D, and (e) composite risk indicator.
Figure 7e shows the estimated risk value (composite risk indicator) for the person near the truck as the vehicle passes during the 13 s. As expected, the risk value increased for the first 11 s. At Time 8, the risk value jumped from 0.43 to 0.67. At this point, a collision could occur if the passing vehicle cannot stop in time to miss someone positioned within the traveled lane or if the driver loses control of the vehicle (see Indicator C). The highest risk value was estimated as 0.69 at Time 11 when the vehicle was passing the person. At this second, the human was only 1.3 m away from the roadway.
The appropriate interpretation of the risk value and the matching appropriate warning strategy are part of Phase 3 (warning and communication system) and not a focus of this study, but can be briefly considered here. A warning message can be delivered to a police officer if the risk value is higher than a certain preset threshold (e.g., 0.67 or higher). The warning can be made using audio and/or vibration equipment. If the level of risk increases, audio/vibration equipment level could be increased.
In the particular example described in this paper, a warning would be initiated at around Time 8, only if the threshold value is 0.67. Phase 3 will need to deepen and broaden the analysis of the questions of the warning threshold and warning level and will need to take into account additional issues such as police officers’ perception and reaction times.
Task 5: Validate the Model
Model validation investigates how well a proposed system can estimate the risk involved in real-world situations (e.g., near-miss collisions). Several past studies ( 42 – 44 ) argued that a high-risk situation can be identified by investigating vehicles’ braking profiles. A hard braking profile (indicated by a severe deceleration rate) generally indicates the possibility of risk. For example, if a passing vehicle decelerates sharply when approaching a police officer on duty, it can be assumed that the driver of the vehicle realized that there was a high level of risk of hitting the officer and braked to avoid a collision. Different studies have suggested different thresholds for defining hard braking in a high-risk situation. For example, Wang et al. ( 42 ), Moon et al. ( 45 ) and Xiong et al. ( 44 ) suggested a deceleration rate of 1.5 m/s2, 2.0 m/s2, and 3.0 m/s2 respectively. This study applied 2.17 m/s2 (the average of the three values suggested) as the threshold for validating a high-risk situation using the proposed model.
To validate our model’s ability to identify high-risk situations, we analyzed the 51 real-world situations collected and found that 29 suggested a potentially risky situation, for example, a vehicle traveling on the shoulder-side travel lane while a person is moving on the same lane ahead. Following Xiong et al.’s approach ( 44 ), we further investigated these 29 risky situations to see whether a vehicle had shown a hard brake (i.e., 2.17 m/s2 or higher) in the 2 s immediately before reaching a person to avoid a collision. Almost half (14) of the 29 situations included a vehicle that hard braked. According to the braking profile model, these 14 real-world situations could be described as high-risk situations.
To determine the threshold for defining a situation as high risk using our fuzzy rule-based algorithm, we followed an approach used by Wang et al. ( 42 ) and Xiong et al. ( 44 ). Both studies used three categories (low-, medium-, and high risk). The estimated risk value generated by the fuzzy rule-based algorithm varies from 0 and 1. We divided this range into three equally sized categories (low [0 to 0.33], medium [0.33 to 0.67], and high [0.67 to 1.00]) and applied these categories to the 14 high-risk situations identified by the braking profile model.
The fuzzy rule-based algorithm identified 11 of the 14 instances as high risk, (i.e., 78%). This level of validity compares well with the results of other studies that validated their models’ assessments of the risk of a collision. For instance, Wang et al. applied a K-means clustering approach to analyze the risk of collisions and detected 66% of high-risk situations ( 42 ). Kluger et al. used the discrete Fourier transform algorithm combined with a K-means clustering approach ( 43 ). Their study detected 78% of high-risk situations. Xiong et al. proposed a fuzzy rule-based algorithm combined with K-means clustering and detected 87% of high-risk situations ( 44 ).
We are aware, however, that the braking profile model does not identify all high-risk situations. For example, some drivers suddenly and/or rapidly change lane to avoid a collision with an obstacle ahead (e.g., a pedestrian) without braking severely. This is also a high-risk situation, but would be missed by the driver braking profile model. We were unable to include such situations in our model’s validation exercise, and must leave the issue of the fuzzy rule-based algorithm’s detection of additional sources of risk to future research.
Discussion of the Analysis and Recommendations
To further illustrate the impact of the four input indicators on the estimated risk values, this study created two three dimensional (3-D) surfaces (See Figure 8). For each surface, only two of the four input indicators vary while the other two remain constant. For instance, Figure 8a shows how the estimated risk values change as Indicators A (lateral distance from officer to traveled lane) and B (magnitude of speeding) change. When Indicator A decreases and/or Indicator B increases, the risk value increases. This yielded what we expected. Figure 8b shows how the risk values change as Indicators D (direct distance) and C (SSD) change. When Indicator D decreases, the risk value increases. Note that indicator C is binary. We see a sudden increase in the risk value when Indicator C changes from zero to one. These results were also what we expected.
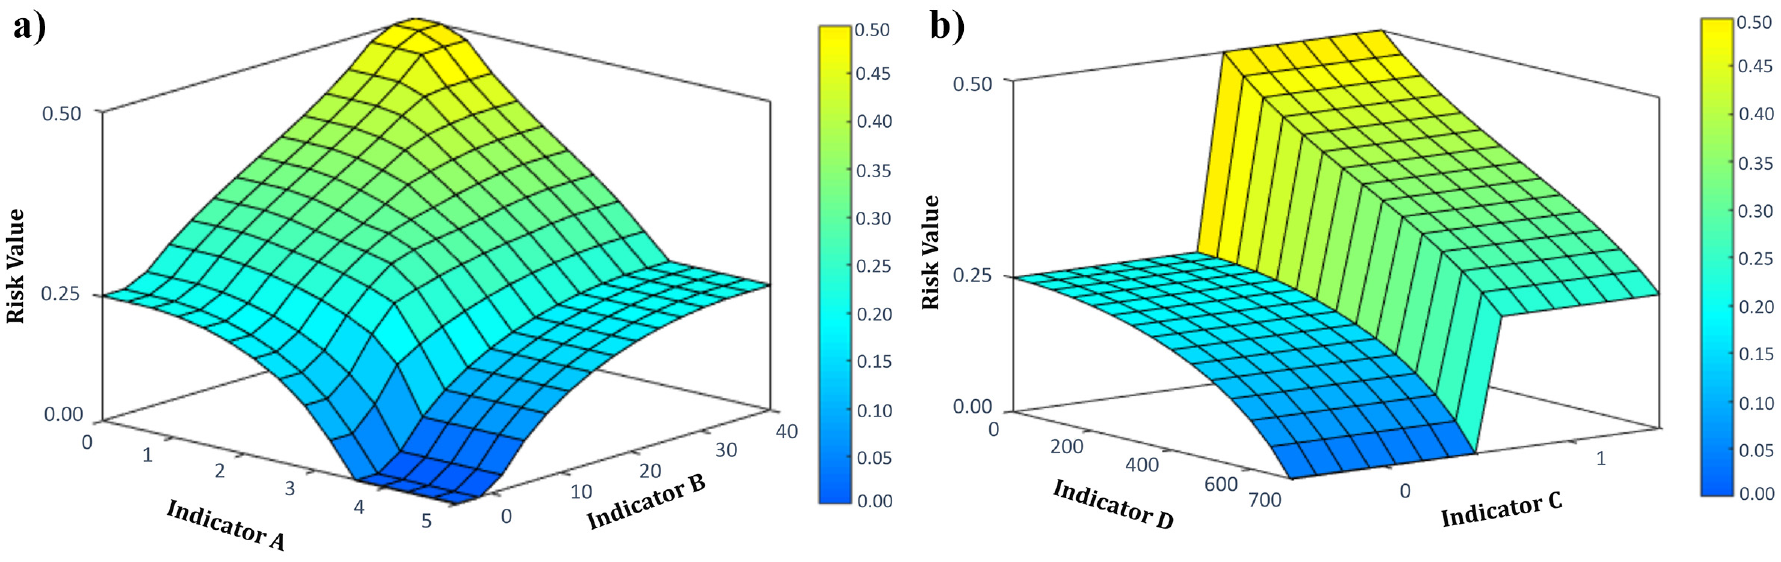
Varying risk values in 3-D surfaces: (a) estimated risk values as Indicators A and B change and (b) estimated risk values as Indicators C and D change.
Police officers have numerous duties on the roadway and these duties may absorb their attention and increase the risk of a collision with an approaching vehicle. This study developed a three-phase real-time risk assessment framework for an IoT protection system designed to improve the safety of police officers performing duties on a roadway. This study focused on the risk analysis phase (Phase 2) and used a fuzzy rule-based algorithm to combine four input indicators to generate a single risk value. Although the model was based on only a limited amount of data, a validation exercise showed that the approach successfully identified many high-risk situations (defined as situations that included a hard braking vehicle). Although the main focus of this study was on improving the safety of police officers, the proposed approach could easily be expanded to target other groups of people whose duties require activities on public roadways. Such groups include, but are not limited to, public roadway maintenance crews in temporary work zones and heavy commercial vehicle drivers who park at the side of roadways for vehicle checks or short-term rests.
If more data on the four input indicators could be collected, it would be possible to apply a more advanced method than the fuzzy rule-based algorithm used in this study. For example, future work may require collecting data on different types of high-risk situations (e.g., sudden lane change) in the field. If such data are available, a more advanced method (e.g., machine learning) might significantly improve the performance of the proposed IoT protection system. Such a study might consider applying different weights to the different input indicators instead of the equal weights used in this study. Searching for optimal weight values for the different input indicators would be an important objective of the study. The use of additional input indicators (e.g., weather conditions, time of day [nighttime/daytime], and work zone information about the presence/absence of temporary traffic control devices) might increase the accuracy of risk estimates. Identifying a valid method for an early warning system designed to save the lives of police officers on duty on the roadway is a critically important issue. This study focused on braking profiles, but additional data analysis from possible other data source (e.g., dashboard camera video clips showing near-miss collisions) would allow for broadening the validation approach to include, for example, steering and fast lane changing. Such studies would, however, require extensive and costly data collection. This study used 700 m as the maximum distance detectable by radar. Radar coverage is largely associated with the cost of the radar system. In general, a larger detection area involves higher cost.
Future research could consider some of the limitations of this study. For example, the Phase 2 analysis assumed that Phase 1 (detection) used an advanced radar system that delivered flawless data. In reality, the blocking of lines of sight is a well-known challenge affecting the continuous tracking of multiple moving objects by any existing radar system. Improvements in Phase 1 detection are important as our system requires reliable and simultaneous detection of the presence and approaching speed of one or more vehicles. Future work needs to resolve the many issues related to Phase 3 (warning and communication system). These issues include the selection of the most effective warning technologies to disseminate the varying levels of warning, and the determination of appropriate risk value thresholds for each level of warning. If the threshold is too low, a high number of warnings could cause unnecessary distraction/stress for police officers, but if the threshold is too high, the system may miss an emergency situation that requires a police officer to react. Eventually, the communication capability of the proposed IoT protection system should be enhanced to create a real Vehicle-to-Infrastructure system that could, for example, communicate with approaching vehicles and automatically reduce their speed, change path, or both to avoid possible collisions with police officers working on a road.
Footnotes
Acknowledgements
The authors thank Defence Research and Development Canada, the Natural Sciences and Engineering Research Council, and Ontario Research Fund for their financial and other support for this study.
Author Contributions
The authors confirm contribution to the paper as follows: study conception and design: A. Mohammadi, P. Y. Park, A. Asgary, A. Mukherjee, X. Liu; data collection: A. Mukherjee, X. Liu; analysis and interpretation of results: A. Mohammadi, P. Y. Park; draft manuscript preparation: A. Mohammadi, P. Y. Park, A. Asgary. All authors reviewed the results and approved the final version of the manuscript.
Declaration of Conflicting Interests
The authors declared no potential conflicts of interest with respect to the research, authorship, and/or publication of this article.
Funding
The authors disclosed receipt of the following financial support for the research, authorship, and/or publication of this article: This study was supported by Defence Research and Development Canada, the Natural Sciences and Engineering Research Council, and Ontario Research Fund Defence Research and Development Canada (CSS/CSSP).