
Abstract
This study aims to model pedestrian temporal violation behavior at signalized crosswalks. Video data of pedestrian crossing behavior were collected from three locations in China and were used to investigate the effect of several factors on pedestrian temporal violation behavior. The temporal violation behavior was analyzed using the relationship between pedestrian waiting duration and their endurance probabilities. A fully parametric duration model with Weibull distribution was used to model the temporal violation behavior, and the cluster-specific heterogeneity among the three study sites was accounted for using random intercepts. Six variables were identified to significantly affect the violation behavior: pedestrian gender and phone distraction status, location type, pedestrian volume, day of the week, and time of the day. The results show that pedestrians are likely to disobey traffic regulations when there are longer waiting durations. Male pedestrians have a higher violation tendency than females. Pedestrians distracted by their phones have longer waiting durations than undistracted pedestrians. Signalized road segment crosswalks are associated with higher temporal violation propensity than signalized intersection crosswalks. Pedestrians are more likely to commit violations at higher pedestrian densities. Weekdays are associated with shorter waiting durations and higher violation tendency than weekends. Pedestrians are more likely to violate traffic regulations in the morning than at midday and in the evening. These findings give insights into the pedestrian crossing behavior to better accommodate pedestrians and improve safety.
Keywords
Many cities have implemented policies to encourage people to use active transportation such as walking. Increasing the use of active transportation helps communities achieve sustainability goals, encourages road users to adopt a healthier lifestyle, and minimizes traffic-induced air pollution. However, active road users such as pedestrians have an elevated risk of being involved in road crashes which represents an obstacle to adopt active modes of transportation. As the most vulnerable group, pedestrians account for nearly a quarter (23%) of traffic fatalities globally ( 1 ). Pedestrian temporal violation behavior is attributed to a higher propensity of pedestrian crashes as such behavior is not expected to be encountered from other road users ( 2 , 3 ). Pedestrian temporal violation behavior is defined as committing crossing at improper traffic signal phases, for example, during the pedestrian red signal or “Don’t Walk” signal ( 4 – 6 ). The study of pedestrian temporal violations is important for improving traffic safety and efficiency at crosswalks. Pedestrian waiting duration is a key indicator of pedestrian waiting endurance and influences their temporal violation tendency ( 7 ). Therefore, understanding and analyzing the effects of influential factors, especially pedestrian waiting duration, on pedestrian temporal violation behavior can help policymakers and engineers protect and accommodate pedestrians at crossing facilities.
The majority of previous studies on pedestrian crossing violations utilized discrete choice models (i.e., binary logit or probit model) to analyze pedestrian temporal violation behavior ( 8 – 11 ). Analysis of variance (ANOVA) and Chi-square tests have also been frequently used to investigate the significance of several factors on pedestrian crossing behavior ( 12 , 13 ). A few studies have utilized the non-parametric survival analysis to model the violation probability and pedestrian waiting time ( 14 , 15 ). However, these methods suffer from several shortcomings. For instance, the discrete choice models cannot account for the trend of pedestrian violation behavior over time. The non-parametric duration model cannot accommodate the influential factors as covariates, and the distribution of pedestrian waiting duration is difficult to consider. Furthermore, the survival functions are piecewise constant. The unsmoothed survival function could lead to unrealistic predictions of the violation probability if the sample size is small. Moreover, in the ANOVA test, Chi-square test, and non-parametric duration model, it is challenging to quantify the impacts of influential factors on pedestrian violation behavior. The majority of previous studies have also ignored the between-site variances in modeling pedestrian temporal violation behavior, which was shown to be significant in several studies ( 16 , 17 ). Therefore, ignoring the unobserved site-specific heterogeneity could lead to bias and inefficiency of model estimates ( 18 – 20 ).
This study aims to model pedestrian temporal violation behavior at signalized crosswalks. A fully parametric survival model is proposed to investigate the relationship between pedestrian waiting duration and temporal violation behavior. The study makes several contributions: (i) examining the distribution of pedestrian waiting duration to give insights into pedestrian signal timing design; (ii) modeling pedestrian waiting duration using a fully parametric hazard-based survival model to investigate the relationship between pedestrian waiting duration and temporal violation tendency; (iii) quantifying the impacts of several factors on pedestrian temporal violation behavior, including pedestrian attributes, road environment, and traffic conditions; and (iv) capturing the cluster-specific heterogeneity among different study sites using random intercepts terms. The fully parametric duration model can examine pedestrian endurance probability over waiting time while quantifying the explanatory variables affecting the violation behavior.
Literature Review
Recently, there is a growing interest in analyzing pedestrian crossing behavior at urban crosswalks. Several previous studies demonstrated the importance of analyzing pedestrian crossing behavior for improving traffic safety ( 21 , 22 ). Pedestrians have a high risk of being involved in crashes while crossing streets as the risk of pedestrians interacting with vehicles is higher than in ordinary walking spaces. In addition, pedestrians are highly vulnerable when they cross signalized crosswalks illegally since their presence is not expected by motorists during the red signal ( 3 ). Therefore, analyzing pedestrian violation behavior and determining the influential factors of such behavior at signalized crosswalks is important.
Several previous studies investigated the factors that influence pedestrian violation behavior ( 11 , 12 , 23 ). For example, Russo et al. ( 11 ) studied pedestrian crossing behavior at signalized intersection crosswalks and found that pedestrians in a large group (i.e., five pedestrians or more) are more likely to commit temporal violations. Xie et al. ( 8 ) collected pedestrian crossing behavior data at seven signalized intersections from Hong Kong. The study found that a higher vehicle volume reduces the probability of pedestrian temporal violation. Zhu et al. ( 24 ) indicated that females have a lower tendency to violate traffic rules than males. Byington and Schwebel ( 25 ) studied the effects of mobile phone use on pedestrians’ crossing behavior. The study found that distracted pedestrians wait longer to cross than undistracted groups.
Moreover, the pedestrian waiting duration is considered an important factor affecting pedestrians’ temporal violation behavior and reflects their endurance and patience during waiting. Previous studies have shown that pedestrians are more prone to violate traffic rules and take risks with longer waiting durations ( 24 , 26 ). Brosseau et al. ( 3 ) determined the effect of waiting duration on the likelihood of pedestrian violations and found that the proportion of violations increases as waiting duration increases. The study highlighted the importance of considering pedestrian waiting duration while designing cycle length and effective green/red times at signalized intersections. Li ( 27 ) proposed a statistical model for pedestrian waiting times at signalized intersections and investigated pedestrian red-light running behavior. Yang et al. ( 28 ) analyzed the relationship between pedestrian waiting time and crossing behavior. The study found that pedestrians are more inclined to end their waiting duration and engage in temporal violation behaviors as the waiting time increases.
Most of the existing methods dealing with pedestrian violations are based on the discrete choice model. For example, Dommes et al. ( 9 ) developed a logistic regression model to analyze pedestrian red-light crossing behavior. Xie et al. ( 8 ) used a binary logit model to identify the influential factors associated with pedestrian illegal crossing behavior. Wang et al. ( 10 ) studied pedestrian red-light running behavior and injury severity by using random parameter probit models while accounting for the individual level heterogeneity. Aghabayk et al. ( 29 ) developed a generalized linear mixed model to analyze pedestrian temporal violation behavior at crosswalks. The study analyzed the effects of several factors on a pedestrian’s tendency to commit a temporal violation, such as pedestrian gender and age. Zhou et al. ( 30 ) used a structural equation model to evaluate pedestrians’ attitude and intention of crossing violation behavior. The study analyzed several factors of the violation intention, including conformity tendency and risk perception.
Survival analysis is a suitable approach for modeling the time-to-event data. Recently, this modeling approach has been widely used in the transportation field, such as modeling lateral interactions in mixed traffic ( 31 ), pedestrian reaction times at signalized crosswalks ( 16 ), and pedestrian crossing behavior ( 14 ). Moreover, many studies used this method to model pedestrian waiting durations. For example, Hamed ( 32 ) used the Cox proportional hazards model to study the hazard ratio of several factors on pedestrian waiting duration, such as crossing frequency and pedestrian group size. However, the study did not consider the distribution of pedestrian waiting duration and the censored data. Violation behavior (i.e., pedestrians crossing during red signal) is considered uncensored data, while normal crossing behavior (i.e., pedestrians end their waiting time after the red light ends) is identified as censored data in the modeling. Accounting for the censored data ensures data integrity and avoids biased estimation of model parameters ( 33 ). Tiwari et al. ( 14 ) used the non-parametric Kaplan-Meier method to analyze the relationship between temporal violation propensity and pedestrian waiting duration. However, a major shortcoming of the non-parametric duration model is that it cannot quantify the impacts of influential factors on the violation probability.
Data Preparation and Analysis
Study Locations
Video data were obtained at three signalized crosswalks in Chengdu, China (Figure 1). The selected sites are located in the city center and are characterized by high pedestrian density. The first location is the crosswalk in the eastbound direction of the First Ring Road and Wuhouci Street intersection. The intersection is a major thoroughfare in the nearby commercial district, with a high number of pedestrian violations. The second signalized crosswalk, a road segment crosswalk, is located on the First Ring Road. This road segment crosswalk is located close to Southwest Minzu University, where high pedestrian volumes are observed. The third crosswalk is located at the Second Ring Road and Dongxiu Second Road intersection. This location is a busy signalized intersection serving dense surrounding residential areas. Video cameras were installed on the nearby buildings and overpasses to record the traffic data from the study locations. Video data were collected for the morning (8:00–9:00 a.m.), noon (12:00–1:00 p.m.), and evening (6:00–7:00 p.m.) periods. The video data were collected for the first two locations in May 2018, and in January 2020 for the third location. The signal timing parameters were fixed at each location during the video collection period. In total, 9 h of video data were collected from the three locations.
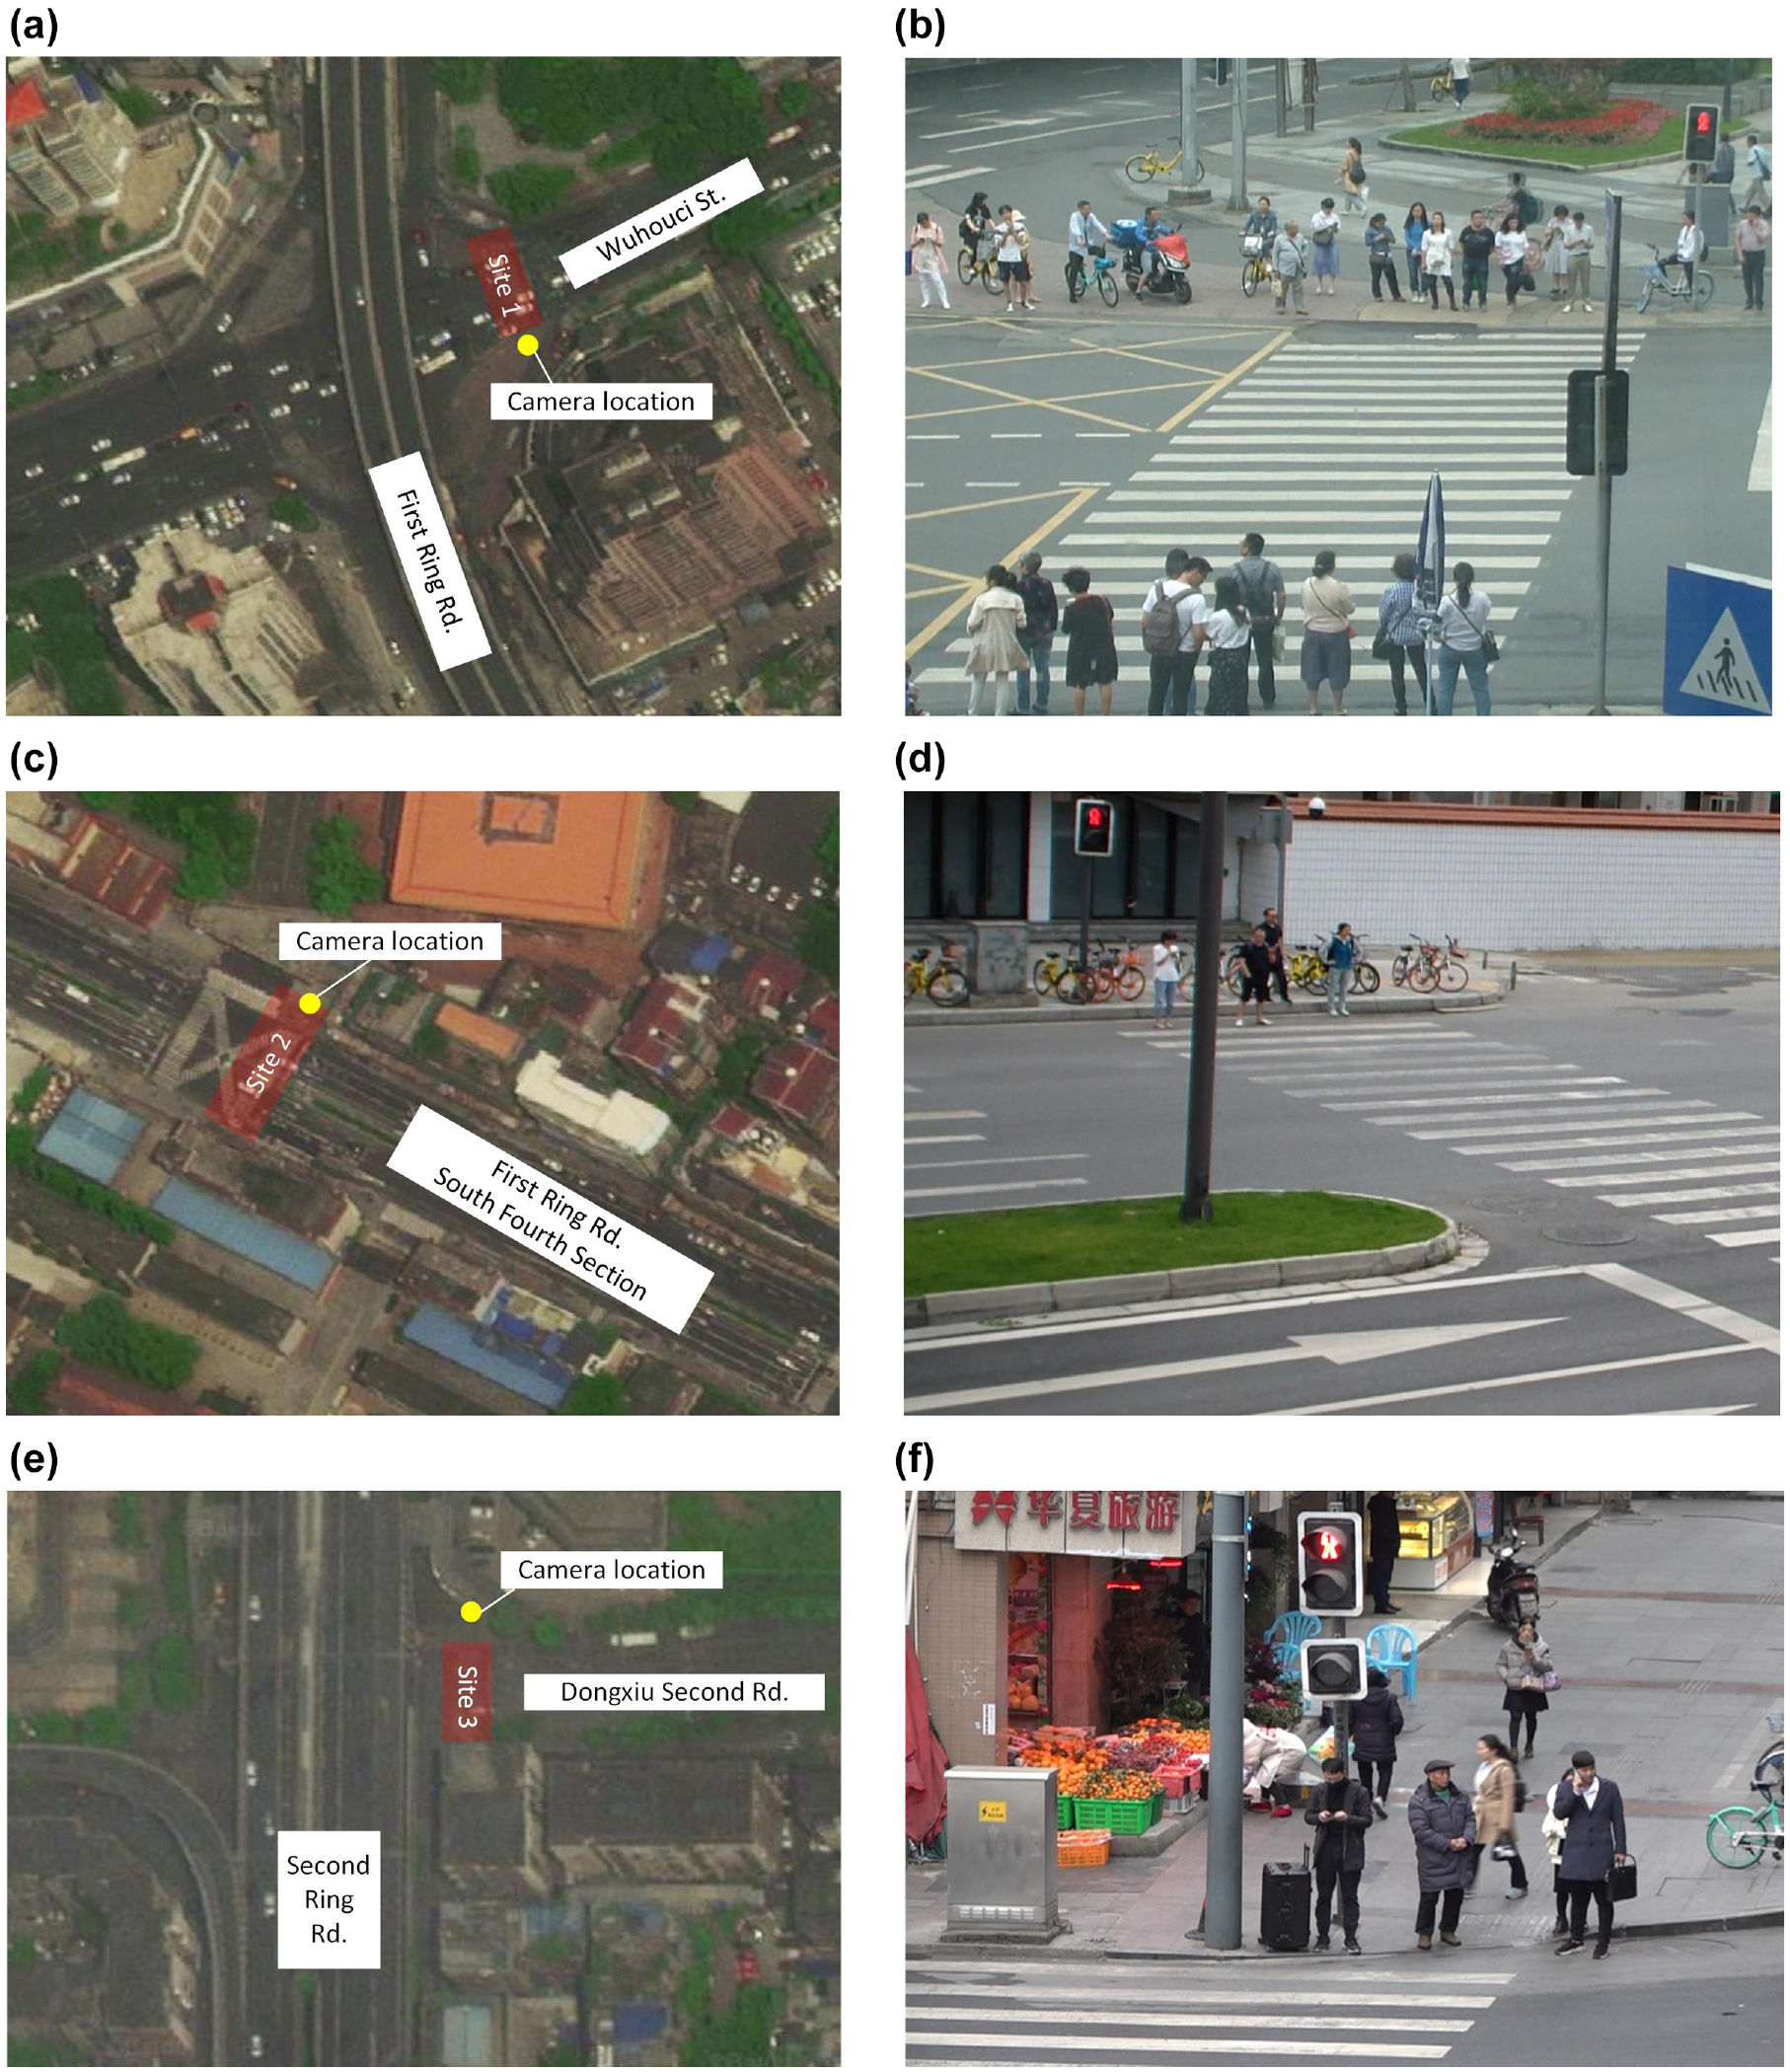
Illustration of the study sites. (a), (c), and (e) satellite views of study sites 1, 2, and 3; (b), (d), and (f) camera views of study sites 1, 2, and 3.
Extraction of Variables
A temporal violation refers to when pedestrians start crossing before the signal light turns green ( 11 ). In this study, video data were collected at a frame rate of 1/30 s, which enables capturing the detailed movement of pedestrians’ behavior. The set of influential factors that are used to describe pedestrian violation behavior in this study is based on previous studies on pedestrian behavior ( 34 – 37 ) and pedestrian violations ( 12 , 15 , 24 , 38 ). These variables include pedestrian waiting duration, individual pedestrian characteristics, environmental variables, and traffic condition factors.
The time between a pedestrian’s arrival at the curb and the initiation of crossing is measured as pedestrian waiting duration. The individual characteristics include the pedestrian’s gender, age, phone distraction status, and companion factor. Pedestrian’s age is determined by visual inspection, similar to previous studies ( 24 , 39 ). Pedestrian’s age factor is classified into three groups: less than 20 years, between 20 and 40 years, and more than 40 years, similar to previous studies ( 16 , 40 ). The phone distraction status refers to whether the pedestrian uses a phone (i.e., talking, texting, or viewing) while waiting. The companion factor represents whether the pedestrian moves with other persons or alone. The environmental variables involve the crosswalk location type (i.e., at intersection or road segment) and the crossing temporal attribute (i.e., day of week and time of day). Finally, the traffic condition factor includes the average pedestrian volume and vehicle volume in 5 min intervals, similar to previous studies ( 41 , 42 ). It is noteworthy that this study focuses on pedestrian temporal violation behavior, which is observed at each signal interval. Thus, this microscopic behavior is affected by the traffic volume (i.e., pedestrian volume and vehicle volume) at short intervals (e.g., 5 min).
A total of 659 pedestrian crossing behaviors were obtained from the recorded video datasets, including 302 violations and 357 non-violations. The descriptive statistics of the analyzed pedestrian behavioral variables are presented in Table 1. In the obtained dataset, 49.0% of the pedestrians are males (323 pedestrians). Pedestrians aged between 20 and 40 years were the majority during the observation period (72.7%); pedestrians older than 40 years and less than 20 years formed about 20.8% and 6.5% of the obtained dataset, respectively. The majority of the observed pedestrians were distracted by their mobile phones (61.1%). Most of the pedestrians were not moving alone (71.6%). The majority of the observed pedestrian behaviors were at urban intersections. Around 52.5% of the observed dataset was on weekdays. The morning period accounted for 44.9% of the observed pedestrian crossing behavior, while noon and evening were 31.1% and 24.0%, respectively. The average pedestrian and vehicle volumes were around 37 pedestrians and 95 vehicles per 5 min.
Descriptive Statistics of Variables
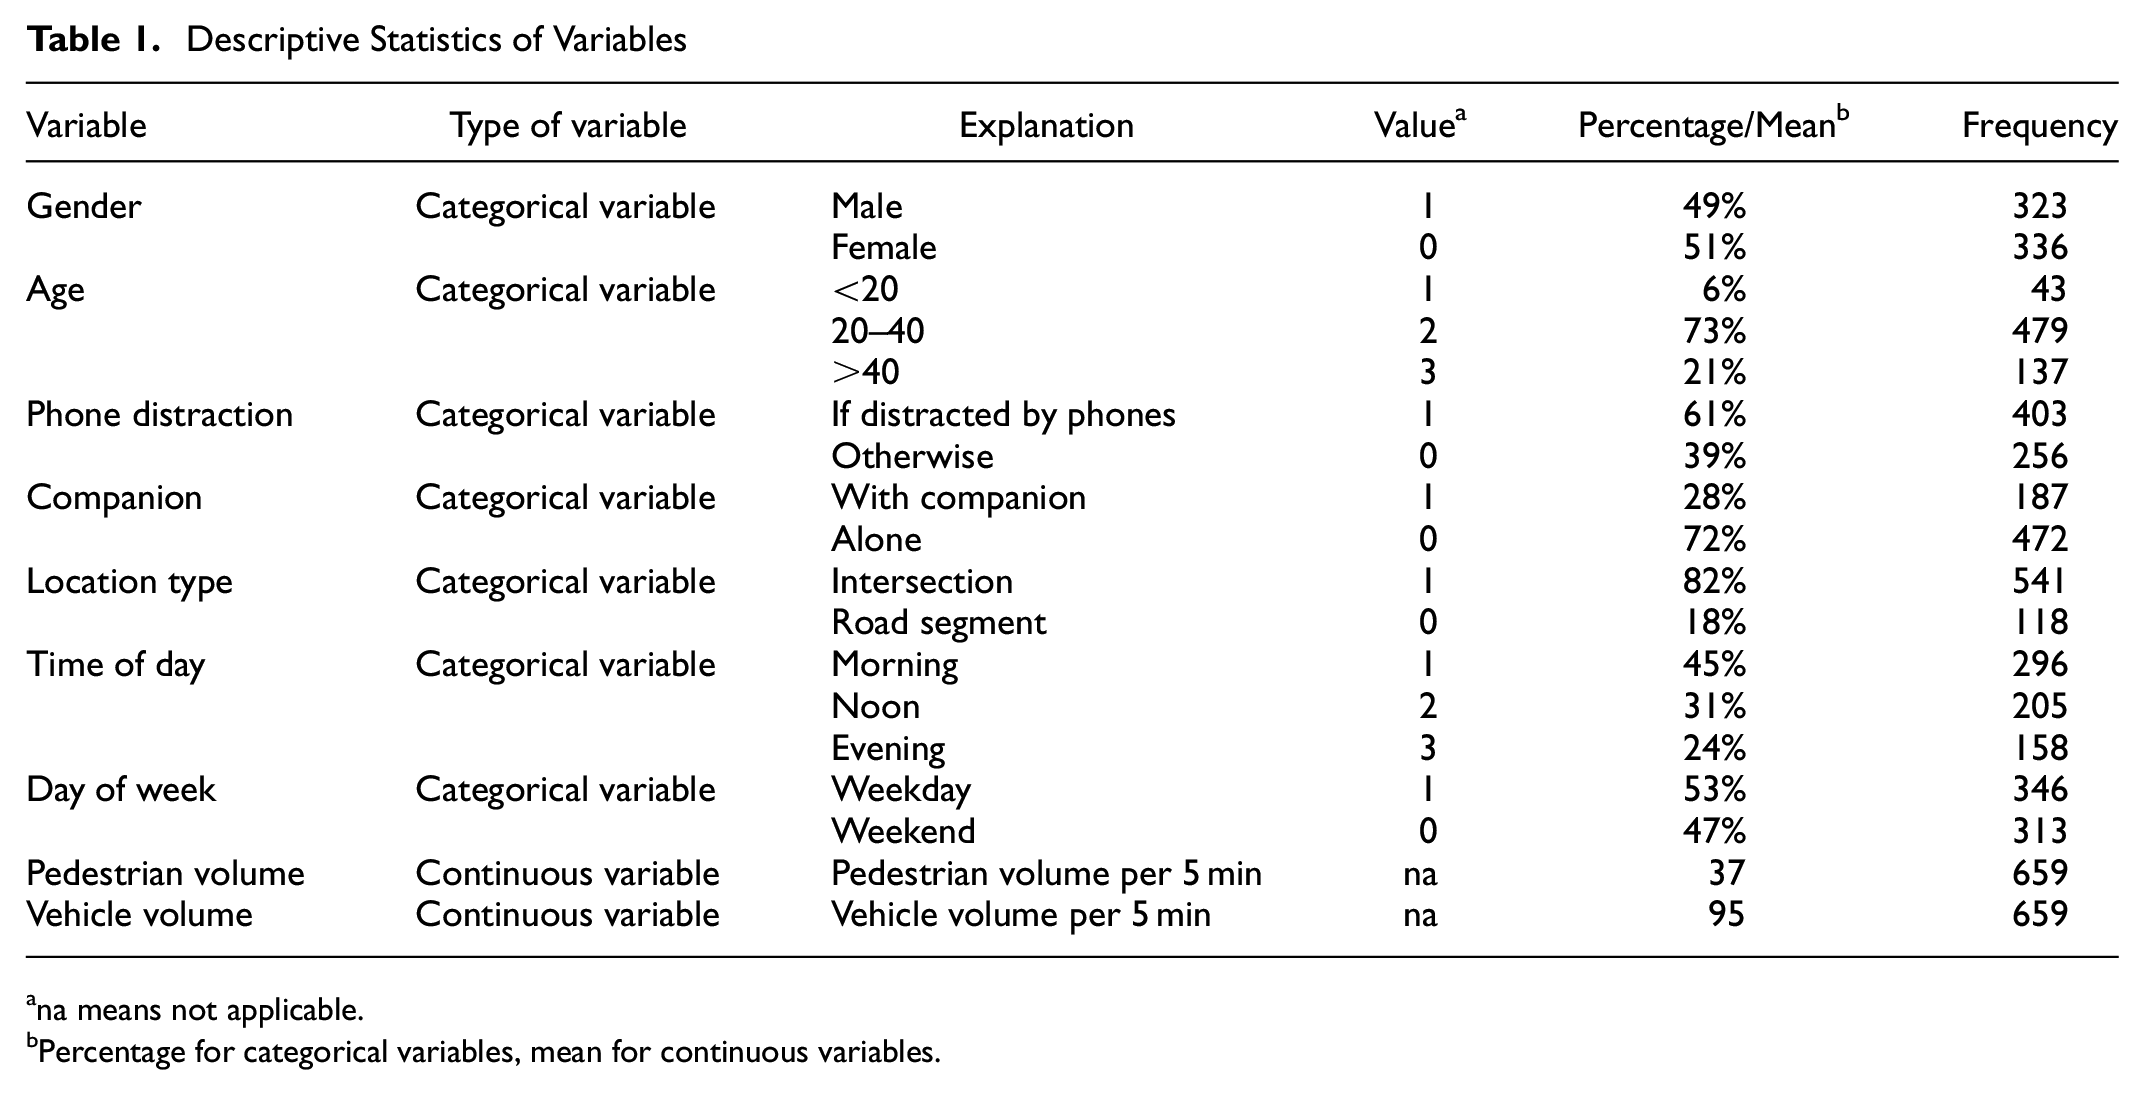
na means not applicable.
Percentage for categorical variables, mean for continuous variables.
Pedestrian Waiting Duration Description and Distribution
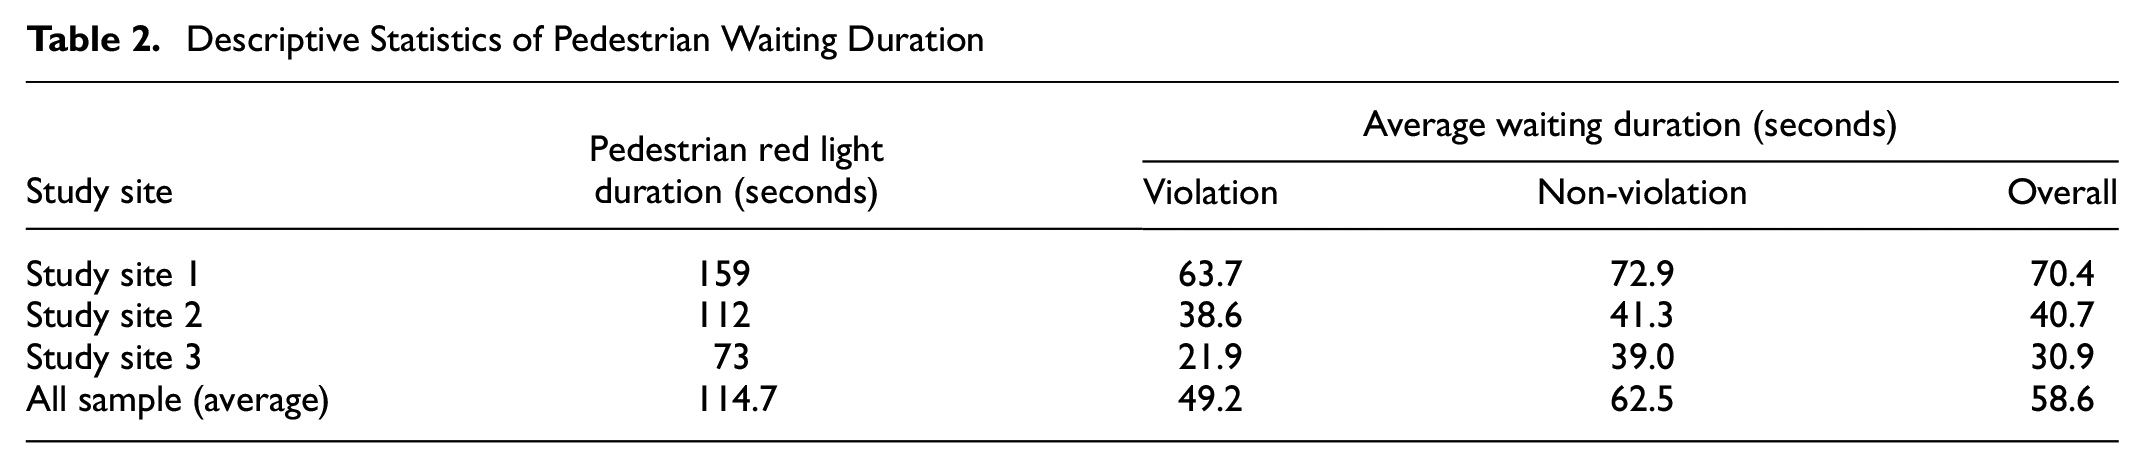
The descriptive statistics of the pedestrian waiting duration across the three crosswalk locations are presented in Table 2. It should be noted that the signal timings of the three study sites are fixed. The average waiting duration across the three study sites is 58.6 s, with an average waiting duration before executing a temporal violation crossing behavior of 49.2 s. The average waiting duration across the three study sites until the pedestrian signals turn green (i.e., non-violation crossing behavior) is 62.5 s. Table 2 shows significant differences in the average waiting durations among the three study sites. The overall average waiting duration in the first site is the longest, at 70.4 s, followed by the values from the second site (40.7 s) and the third site (30.9 s). These observational results are likely attributed to the diversity in pedestrian red light durations across the different sites. A longer waiting duration is associated with longer red light duration (
42
). ANOVA test was conducted to compare the average waiting durations among the three study sites and it further demonstrated the significant differences in the study sites (
Descriptive Statistics of Pedestrian Waiting Duration
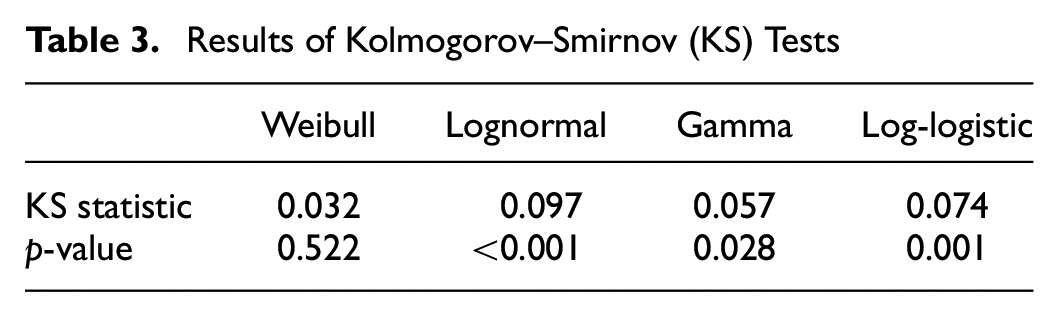
Based on the nature of waiting duration and previous studies on pedestrian violation crossing behavior ( 28 , 41 , 43 ), pedestrian waiting duration was fitted with four distributions: gamma, lognormal, Weibull, and log-logistic distributions. The maximum likelihood estimation method is used to estimate the distributions’ parameters. Figure 2 shows the four distribution curves of waiting duration. The Kolmogorov–Smirnov test (KS test) is used to compare the goodness-of-fit of the four distributions. The KS test is a commonly used method to examine whether the sample data comes from a population with a specific distribution ( 44 ). The null hypothesis (i.e., the sample data follows a specific distribution) is rejected at a given significance level if the test statistic is greater than the critical value ( 44 ). Table 3 shows the results of the Kolmogorov–Smirnov tests of the four candidate distributions. The fitting results show that the Weibull distribution fits the waiting duration best as it has the lowest KS statistic. Furthermore, the Weibull distribution has the lowest log-likelihood value (−3246.838) among the four distributions, which further supports the goodness-of-fit comparison result. The corresponding log-likelihood values of the lognormal, gamma, and log-logistic distributions are −3328.637, −3260.233, and −3307.273, respectively. The Weibull distribution’s shape parameter and scale parameter are 1.62 and 65.27, respectively, with standard errors of 0.05 and 1.65.
Results of Kolmogorov–Smirnov (KS) Tests
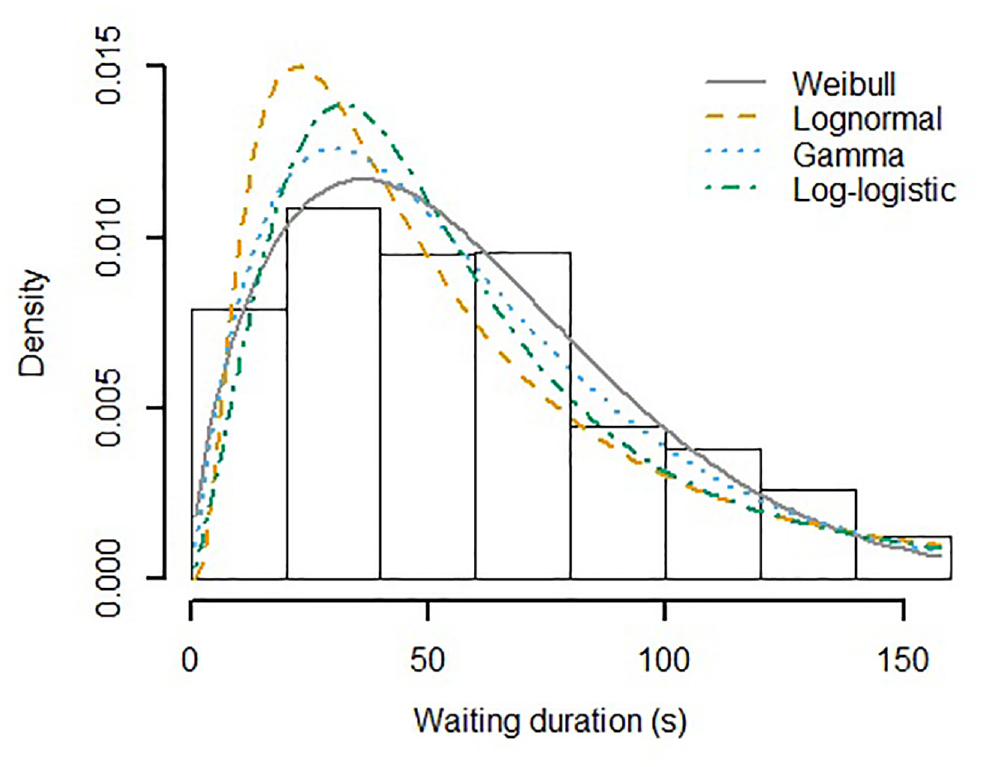
Four distribution curves of waiting duration.
Random Intercepts Parametric Duration Model
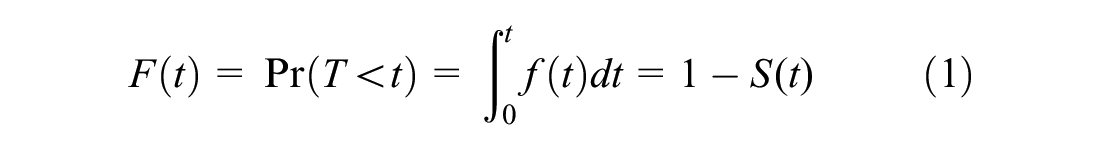
The survival model (i.e., hazard-based duration model) is used to model pedestrian waiting duration in this study. This model is a widely used probabilistic approach for evaluating the duration until a specific event occurrence (
45
). This model considers time as the variable of interest, which is pedestrian waiting duration in this study. The model describes the duration data as a continuous variable,
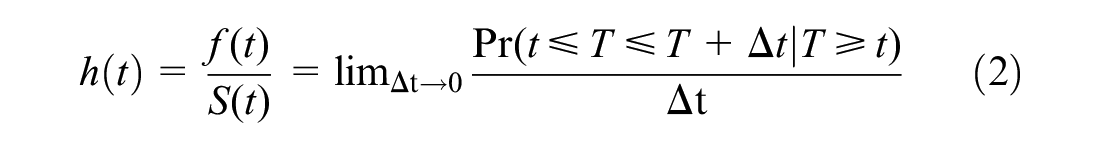
Furthermore, the relationship between
Two methods are frequently used to measure the influence of explanatory variables, including the accelerated failure time (AFT) model and the proportional hazard model. The assumption of the proportional hazard model is that the covariates act on the baseline hazard function, which does not include covariates, and the hazard ratio remains constant over time. The AFT model, on the other hand, assumes that the effects of covariates can rescale the time variable directly in the baseline survival function (i.e., all the covariates are set to zero in the survival function). This assumption simplifies the result interpretations since the estimated parameters can quantify the covariate’s effect on the mean survival times ( 49 ). Thus, the AFT model is utilized in this study to model pedestrian temporal violation.
The standard AFT model assumes that the effects of variables are fixed across observation sites. However, the individual’s behavior is influenced by the group to which they belong, and the different cluster has various effects on the individuals ( 18 ). Ignoring the between-group variance (i.e., cluster-specific heterogeneity) leads to biased parameter estimates ( 19 , 50 ). Therefore, the random intercepts are considered to capture the heterogeneity among the three sites.
In the random intercepts AFT model, the duration variable’s natural logarithm is treated as a linear function of the covariates, which is given by Equation 3.

where
The corresponding hazard function and survivor function are presented by Equations 4 and 5, respectively ( 48 ).


where
The distribution of the duration variable is required to be specified for estimating the hazard and survival function in the parametric model. As discussed earlier, the Weibull distribution is selected for its fitness of pedestrian waiting duration and suitability to the data with monotone hazard rates over time. The hazard and survivor functions of the Weibull AFT model are expressed in Equations 6 and 7, respectively.


where
The maximum likelihood method is used to estimate both the fixed-intercepts Weibull AFT model and the random intercepts Weibull AFT model (Weibull-RI AFT model). The goodness-of-fit values of these models are compared using the likelihood ratio statistics (LRS) and Akaike’s Information Criteria (AIC) ( 51 ). The impacts of covariates on pedestrian waiting duration are quantified by calculating the exponent values of the estimated coefficients.
Modeling Results and Discussion
Model Estimation Results
The Weibull AFT model and the Weibull-RI AFT model (i.e., Weibull AFT with random intercepts) are utilized to model pedestrian waiting durations at urban crosswalks. A likelihood ratio test is conducted to evaluate which model is more suitable for pedestrian waiting duration. The result yields a
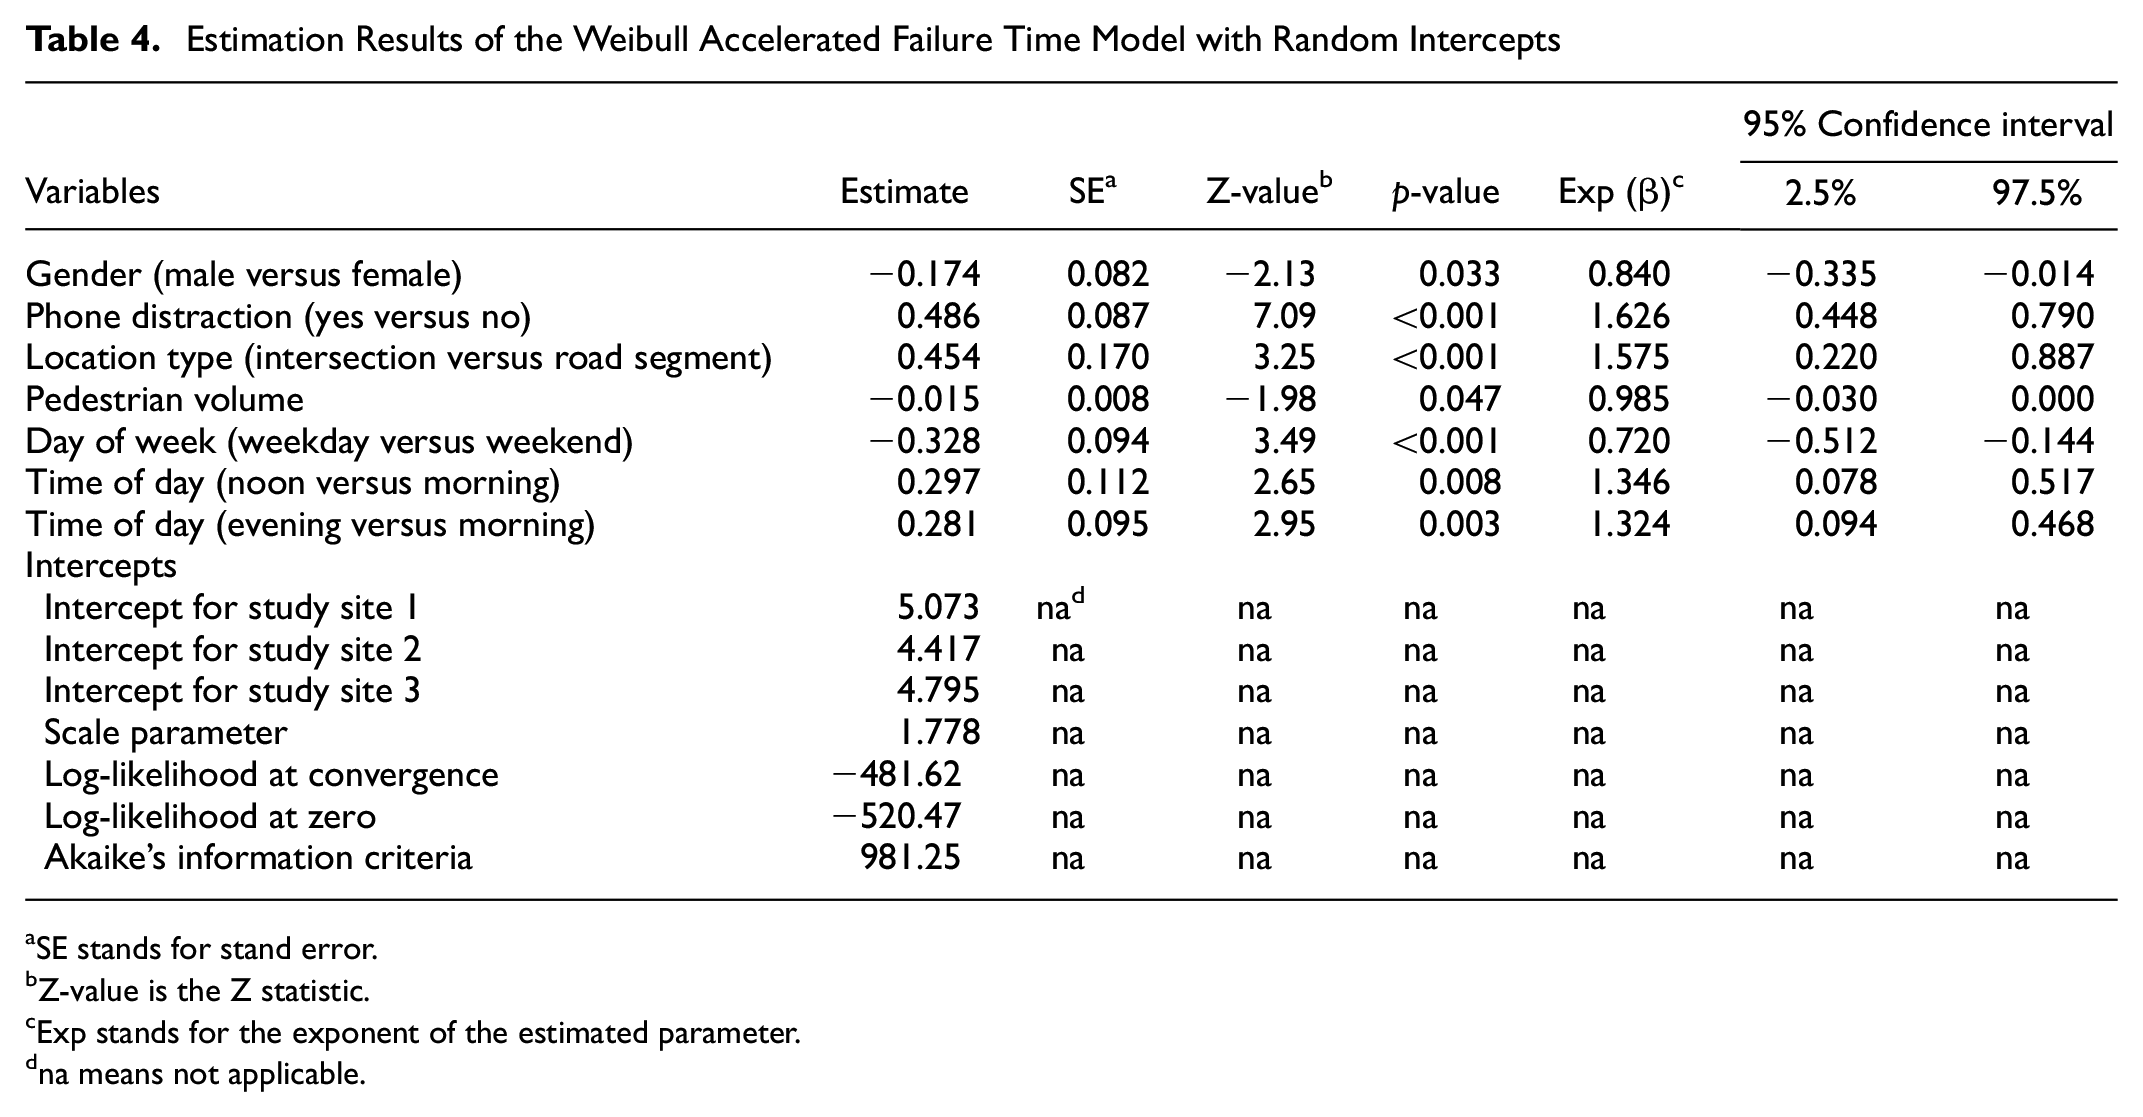
Table 4 shows the estimation results of the Weibull-RI AFT model. The scale parameter is 1.778, which indicates that the hazard is monotonically increasing with duration. This means that the likelihood of terminating the waiting duration increases while the waiting time elapses, that is, the probability of violation becomes greater as the waiting duration increases. This result agrees with the previous studies (
15
,
41
). For instance, the violation probability after 30 s is about 2.35 (i.e.,
Estimation Results of the Weibull Accelerated Failure Time Model with Random Intercepts
SE stands for stand error.
Z-value is the Z statistic.
Exp stands for the exponent of the estimated parameter.
na means not applicable.
In the developed model, six variables are identified to have significant effects on pedestrian waiting durations at 95% confidence level (i.e., 0.05 significance level), including pedestrian gender, phone distraction, the crosswalk location type, pedestrian volume per 5 min, day of the week, and time of day. The estimated coefficients reflect the impact direction of each variable on the result, with a positive value indicating that the covariate increases the likelihood of the outcome and a negative value indicating that the covariate decreases the chance of the outcome. The exponents of explanatory variables are calculated to quantify their effects on the waiting durations. The results show that male pedestrians’ waiting durations are 16.0% shorter than those of the females. Phone distraction leads to a 62.6% increase in the waiting duration compared with the non-distracted condition. Intersection crosswalks increase the pedestrian waiting duration by 57.5% compared with road segment crosswalks. Pedestrians are more likely to violate the traffic rules under a higher pedestrian density. For example, the hazard rate of terminating the wait increases by 1.5% on average with increased pedestrian volume per 5 min by one unit. Weekdays are associated with a decrease in pedestrian waiting duration by 28% compared with the weekend. The noon and evening periods are found to be associated with 1.346 and 1.324 times longer waiting durations than that in the morning, respectively.
Discussion
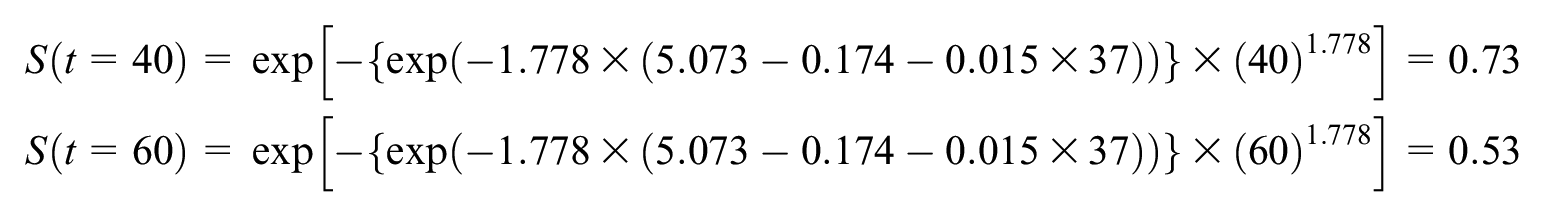
The survivor probability of not ending the wait can be calculated using the estimated parameters of the Weibull-gamma AFT model and the survivor function in Equation 7. The significant difference between the model’s intercepts (5.073, 4.417, and 4.795 for the first, second, and third study sites) indicates that pedestrian waiting duration varies among the three study sites. This result confirms the necessity of considering the site-specific heterogeneity in the analysis. The survivor probability reflects the likelihood of obeying the traffic rules and not executing a violation behavior while waiting. In computing the effect of a specific variable on the endurance probability (i.e., survivor probability), the other variables are considered as the mean values for the continuous variables and the reference categories for the categorical variables. Taking data from the first study site as an example, the endurance probabilities of male pedestrians after 40 s and 60 s of waiting durations are 0.73 and 0.53, respectively, and are calculated as follows:
Using this approach, the survivor probabilities of the three study sites at any given time can be calculated, and the survivor curves are presented in Figure 3. The endurance probabilities indicate that pedestrians are less likely to tolerate waiting at the curbside as time goes on. The three survivor curves indicate that pedestrians have different endurance probabilities at any given time among the three study sites. For example, pedestrians in study site 1 have 29% probability of committing temporal violation behavior after waiting for 50 s. However, the corresponding probabilities are 66% and 43% for sites 2 and 3, respectively. This result can be attributed to the difference in signal timing setting, crosswalk geometry, and other unobserved factors across the three study sites.
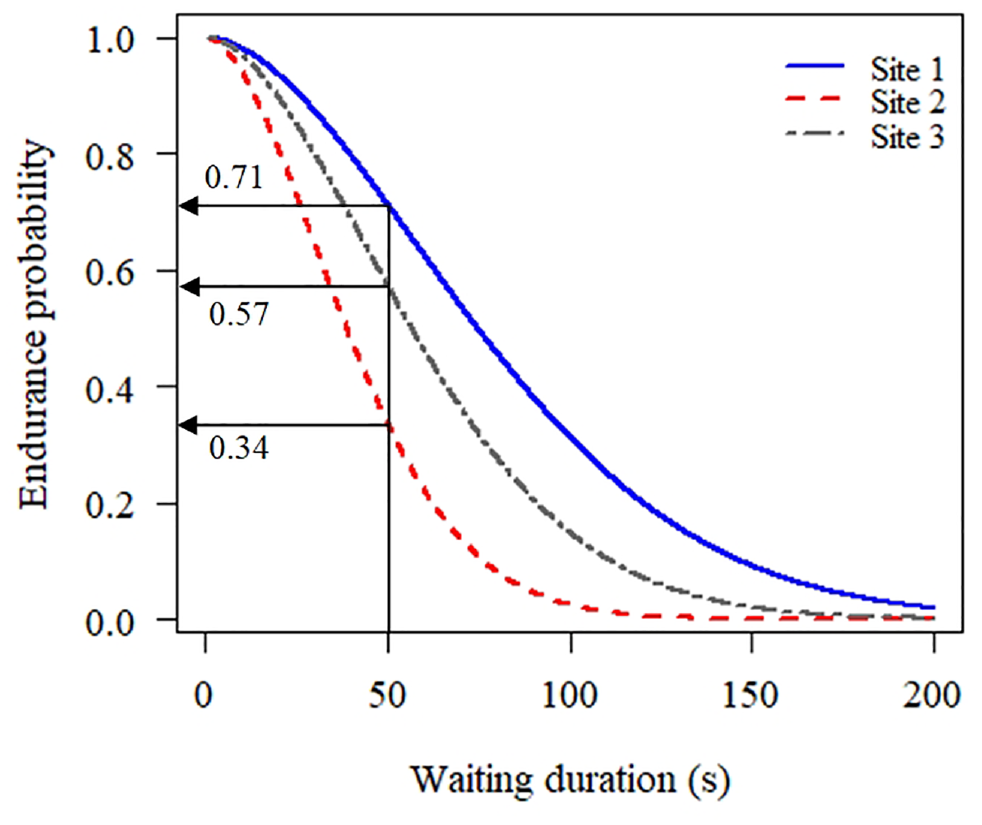
Pedestrian endurance probabilities across the three study sites.
The effects of the explanatory variables are discussed by using the intercept of the first study site as an example. Figure 4 illustrates the endurance probabilities related to different genders. The result shows that female pedestrians have a higher tendency to comply with traffic regulations than males. For example, at the waiting duration of 50 s, the endurance probability for females is 71% while the corresponding probability for males is 63%. This result indicates that males are less patient and associated with a lower propensity of rule compliance than females on average. Such a gender difference effect has been observed in previous pedestrian crossing behavior studies ( 3 , 8 , 12 , 24 ).
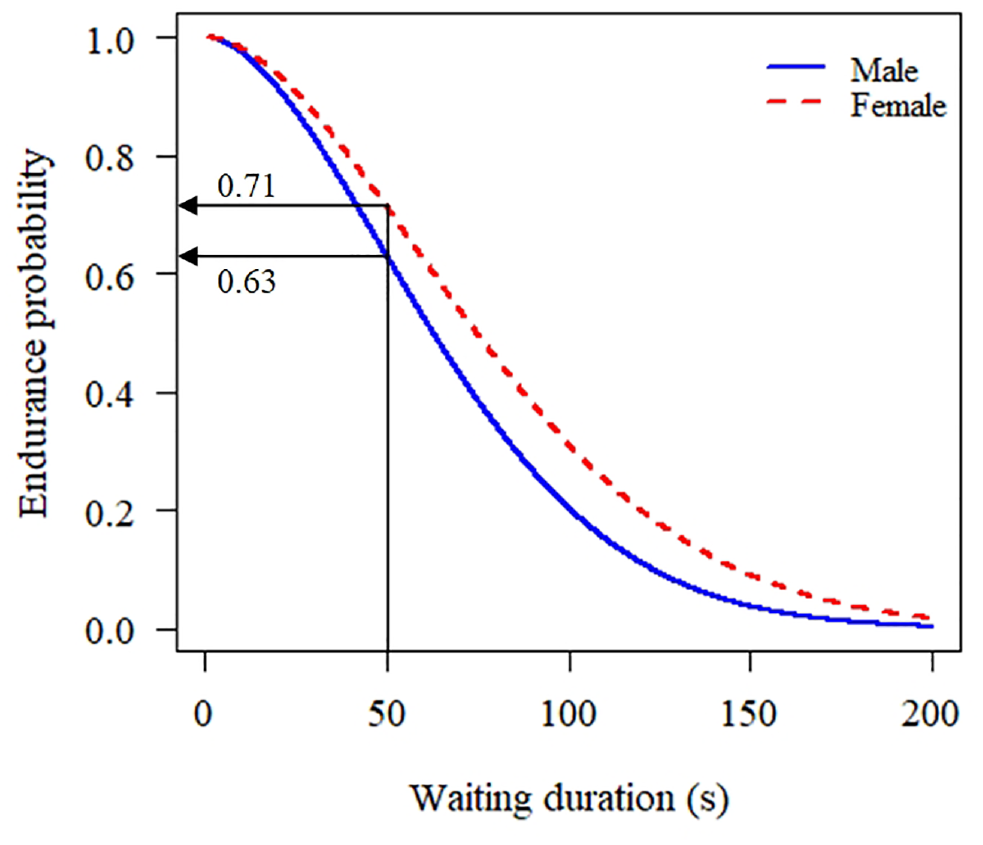
Pedestrian endurance probabilities across different genders.
The effect of mobile phone distraction on pedestrian waiting duration is presented in Figure 5. Mobile phone use distraction increases pedestrian’s endurance probability during waiting. Pedestrians distracted by mobile phone use have higher propensities to continue the waiting than the undistracted groups at a given time. For example, when the waiting duration lasts for 50 s, mobile phone distracted pedestrians have 87% probability of continuing waiting, while the corresponding probability for the non-distracted pedestrians is 71%. The result is consistent with the previous study ( 39 , 52 ). It can be attributed to the phone-distracted pedestrians allocating more attention to their phones and are less attentive to the traffic surroundings, and miss more safe crossing opportunities than the non-distracted pedestrians ( 53 , 54 ).
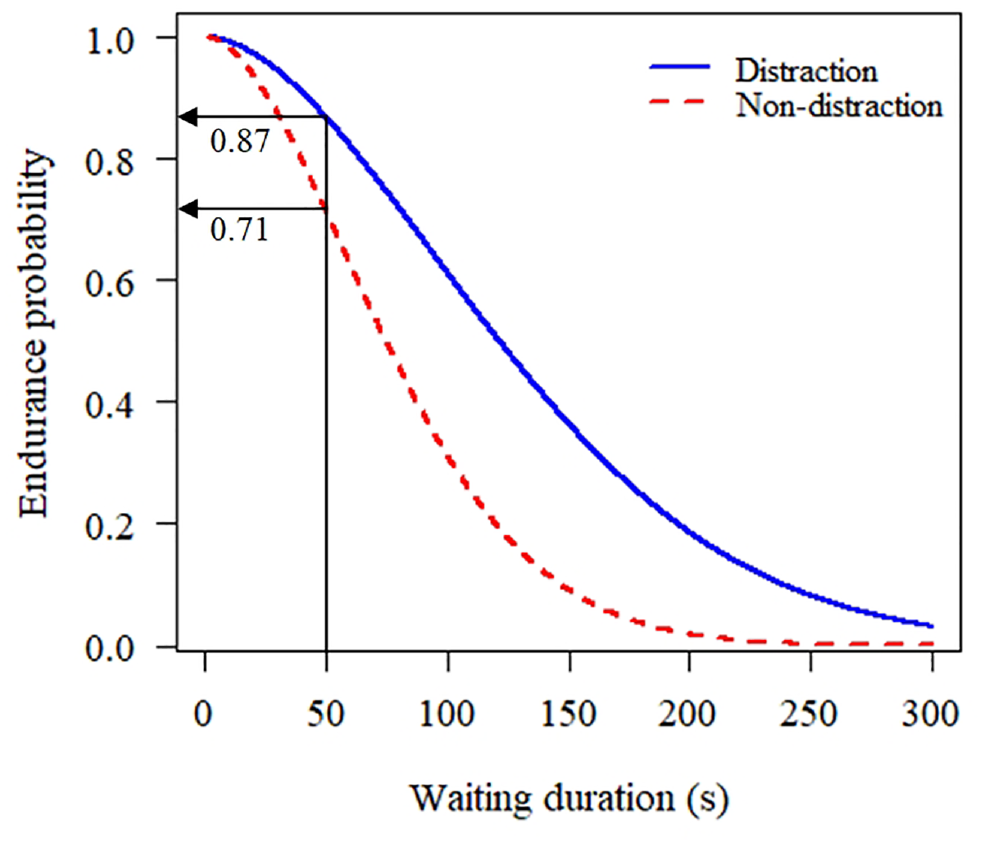
Pedestrian endurance probabilities across different phone distraction statuses.
Figure 6 presents the likelihood of pedestrian endurance at different types of locations (i.e., intersection and road segment crosswalks). The result shows that pedestrians have a higher endurance probability at intersection crosswalks than at road segment crosswalks, given the same waiting duration. For instance, the probability of pedestrians not ending the waiting (i.e., not executing a temporal violation behavior) after 50 s is 86% at signalized intersections while the corresponding probability at road segments is much lower and equals 71%. This result indicates that pedestrians have higher tendencies to end their waiting at the road segment. This can be attributed to the traffic condition difference between the two location types. Pedestrians could be more cautious and follow traffic regulations while waiting at intersection crosswalks than segment crosswalks since the traffic environment at intersections is more complicated and is usually associated with more conflicts than on road segments ( 55 ).
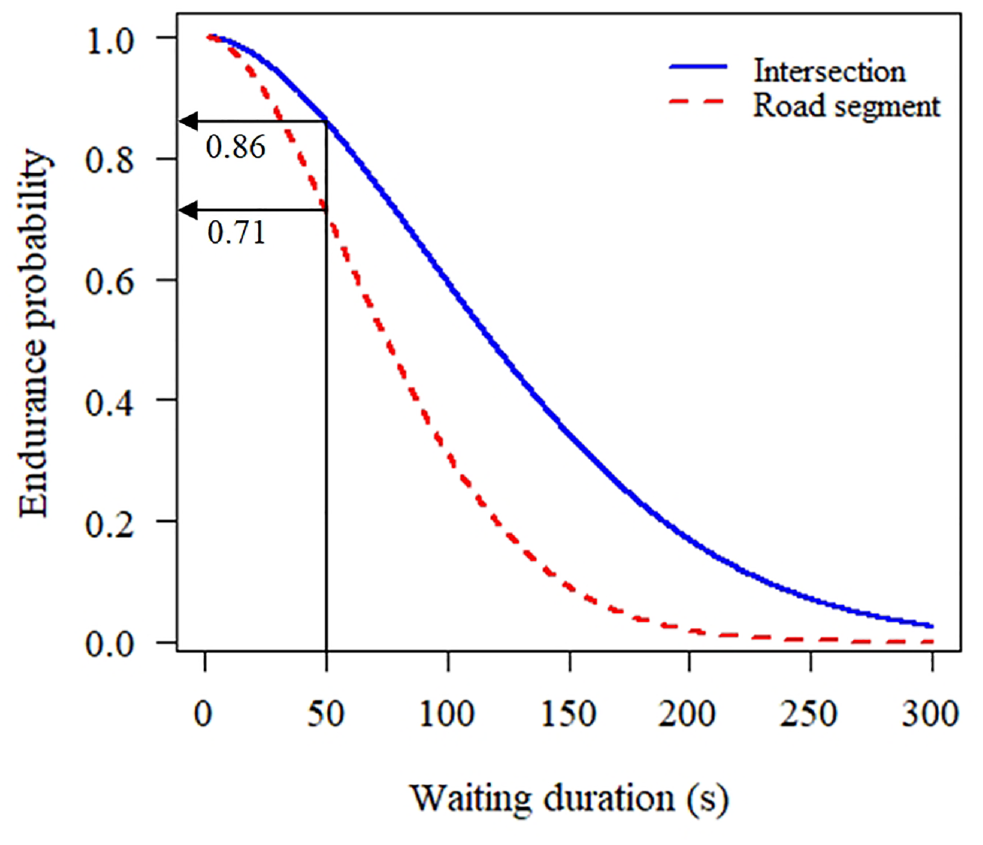
Pedestrian endurance probabilities at different crosswalk location types.
Figure 7 shows the endurance probabilities under different pedestrian volumes (i.e., pedestrian density) in 5 min intervals. The propensity to obey traffic rules decreases with higher pedestrian flow. For example, after a waiting duration of 50 s at the crosswalk, the endurance probability is about 80% if the pedestrian volume is 20 per 5 min. However, the probability decreases to 70% if the pedestrian volume increases to 40. This result suggests that as the pedestrian volume at the crosswalk’s waiting area increases, the pedestrian becomes more impatient and prone to disobey the traffic rules. This phenomenon was observed in many previous studies and can be attributed to the following two reasons: (i) pedestrians feel that it is safer when there are more people around, and the drivers are more likely to give groups of pedestrians the right of way than single pedestrians ( 32 , 56 ); (ii) conformity psychology affects the judgment of pedestrians ( 57 ). People tend to follow others’ behavior, so that pedestrians have higher propensities to violate the traffic regulations if other pedestrians have violated, and such a tendency could result in a higher violation rate under a high pedestrian density condition ( 13 , 15 , 38 ).
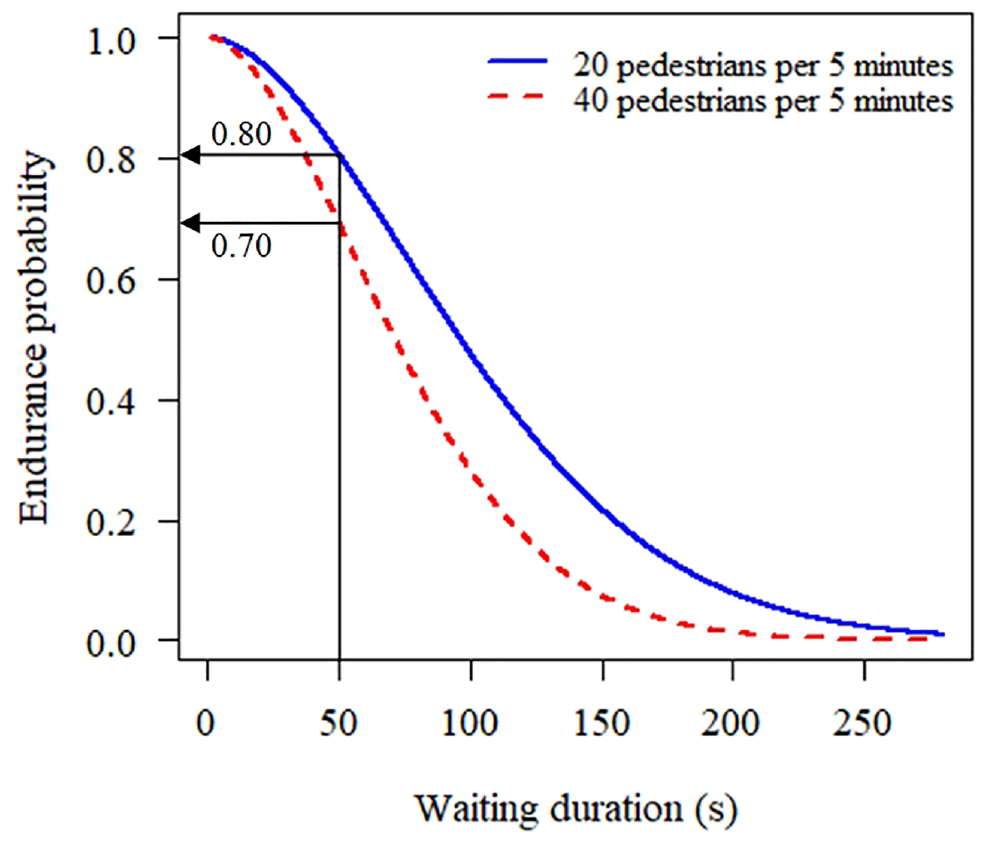
Pedestrian endurance probabilities at different pedestrian volumes per cycle.
The influence of the day of the week on the predicted endurance probability is presented in Figure 8. It shows that weekdays are associated with a lower endurance probability than weekends. For example, pedestrians tend to keep waiting after 50 s at a probability of 54% on weekdays, while the corresponding probability is higher and equals 71% on weekends. This result implies that people are more likely to end their waiting duration sooner and violate traffic regulations on weekdays. This can be attributed to individuals’ rush to get to work on weekdays, whereas they are more relaxed and have less need to violate the traffic rules on weekends.
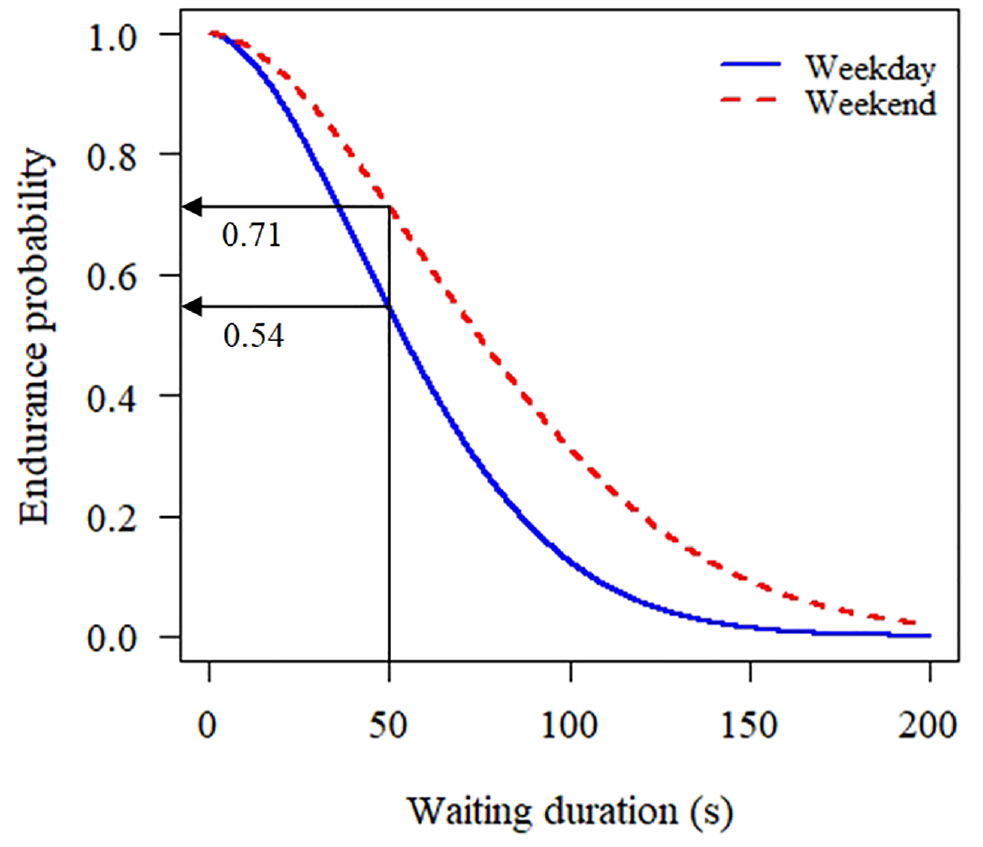
Pedestrian endurance probabilities on weekdays and weekends.
The periods of noon and evening have similar effects on pedestrian waiting durations (0.297 versus 0.281) which differ from the morning period. Taking the noon period as an example, Figure 9 presents the endurance probabilities at different periods of the day. The morning period is associated with a lower endurance probability compared with the noon and evening periods. For instance, the probability of pedestrians waiting after 50 s in the morning periods is about 70%. However, the corresponding probability at the noon period is significantly higher and equals 82%. Pedestrians are more likely to end the waiting during the morning than other times of the day. This result is similar to the influence of weekdays, as the morning time is usually when people rush to work. People are more likely to violate the traffic rules and cease their waiting time ( 32 ).
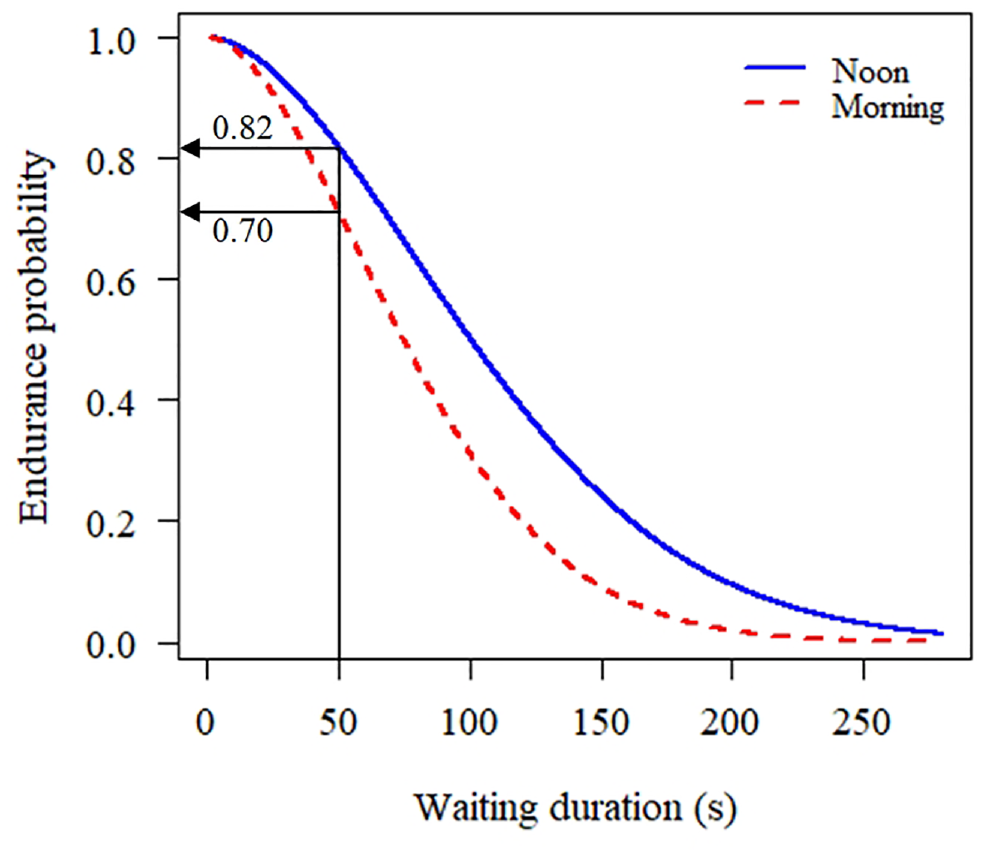
Pedestrian endurance probabilities at different times of the day.
Conclusion and Future Work
This study analyzed pedestrian temporal violation behavior at urban signalized crosswalks. Video data of pedestrian crossing behaviors were collected at three study sites in Chengdu, China. Factors that could potentially influence pedestrian temporal violation were considered, including pedestrian waiting duration, pedestrian characteristics, environmental variables, and traffic condition factors. The relationship between pedestrian endurance probability and pedestrian waiting duration was considered to present the violation tendency over time. The Weibull distribution was found to fit the waiting duration best, and the hazard-based duration model was used to analyze the violation behavior. The unobserved heterogeneity was captured in the survival model using gamma heterogeneity.
The model suggests that the probability of temporal violation becomes higher with waiting duration. Six explanatory variables were identified to affect pedestrian temporal violation significantly. Male pedestrians are found to have a higher probability of committing violations than females. Pedestrians under the condition of mobile phone distraction and at signalized intersection crosswalks have longer waiting durations than those who are non-distracted and at road segment crosswalks. Pedestrians are more likely to violate the traffic rules at higher pedestrian densities. Weekdays are associated with shorter waiting durations than the weekend. Pedestrians in the noon and evening periods have longer waiting durations than in the morning period. Studying pedestrian violation behavior and identifying its influential factors could help in better accommodating and protecting pedestrians at urban crosswalks and better designing pedestrian crossing facilities.
The findings of the study can be beneficial for several transportation applications. The distribution of pedestrian waiting duration can be considered in pedestrian signal timing schemes. The analysis of the relationship between pedestrian violation propensity and covariates can help traffic planners to better design pedestrian waiting areas and crossing facilities. For example, pedestrians are more likely to commit temporal violations under a higher pedestrian density. It is recommended that traffic planners consider the effect of pedestrian density on pedestrian violation behavior when designing waiting areas. Furthermore, the proposed random intercept parametric survival analysis approach can be used to model other pedestrian behavior such as pedestrian reaction time to green signal. The developed method can be expanded to model other types of road user microscopic behavior such as bicycle violations and vehicle violations at signalized crosswalks.
The study has several limitations, which can be considered as potential future research areas. The data used in this study were obtained from three locations in one city in China. Pedestrians’ violation behavior may vary among different traffic environments and cultures. Thus, future research should consider a larger dataset, including data from different driving environments (e.g., Europe, North America) and different intersection types. Moreover, the study can consider other distributions to fit the waiting duration, such as the mixture distribution ( 58 – 60 ). Furthermore, the data used in this study were collected in two different years. Thus, several external variables that could affect pedestrian behavior may change during the different periods. Therefore, using datasets collected within the same period for all locations is recommended. Finally, the study only focused on pedestrian violation behavior. Thus, the violation and interaction behaviors of other road user types such as cyclists ( 61 ), motorcyclists ( 62 ), and vehicles ( 63 ), can be considered in future studies.
Footnotes
Author Contributions
The authors confirm contribution to the paper as follows: study conception and design: Rushdi Alsaleh, Yan Liu, Tarek Sayed; data collection: Yan Liu, Rushdi Alsaleh; analysis and interpretation of the results: Yan Liu, Rushdi Alsaleh; draft manuscript preparation: Yan Liu, Rushdi Alsaleh, Tarek Sayed. All authors reviewed the results and approved the final version of the manuscript.
Declaration of Conflicting Interests
The author(s) declared no potential conflicts of interest with respect to the research, authorship, and/or publication of this article.
Funding
The author(s) disclosed receipt of the following financial support for the research, authorship, and/or publication of this article: This study was sponsored by National Key R&D Program of China (No. 2018YFE0102700) and Postgraduate Research & Practice Innovation Program of Jiangsu Province (KYCX19_0104).
Data Accessibility Statement
The data that support the findings of this study are from a third party. The data is not available from the authors.