



Abstract
Micromechanics, which can be used to relate the properties of a composite to the properties of individual constituents, is considered a good approach to understanding the fundamental mechanisms behind the behavior of asphalt materials. Compared with the semi-empirical and numerical micromechanical models, analytical micromechanical models do not need calibration factors. In addition, they can provide analytical solutions on the basis of a series of assumptions. Using these models, researchers have separated the effects of different stiffening mechanisms (i.e., the volume-filling reinforcement, the physicochemical reinforcement, and the particle-contact reinforcement) for mastic. However, similar research work has not been conducted for asphalt mixtures and, moreover, the characteristics of the particle-contact reinforcement have not been deeply analyzed by researchers. Therefore, this paper aims to understand the stiffness of asphalt mixture through micromechanics. The focus of this study was on porous asphalt mixture where particle-contact reinforcement plays an important role in its behavior. The stiffening effects of different mechanisms were separated using analytical micromechanical models. The effects of temperature/frequency and the properties of the matrix phase on the stiffening effect of the particle-contact reinforcement were analyzed.
Asphalt mixture is the material most commonly used on pavements. To guarantee the performance of pavement in designed traffic loading conditions, the mechanical properties of asphalt mixture, that is, stiffness, creep compliance, tensile strength, and so forth, have to meet certain requirements. The mechanical properties of an asphalt mixture can be measured directly through laboratory tests. However, these measured properties correspond to certain conditions and thus do not represent the overall mechanical behavior of the mixtures. Currently, along with the wide use of new materials, understanding the fundamental mechanisms behind the behavior of a mixture becomes more crucial to guide a new material design without the need to conduct many laboratory tests.
Asphalt mixture is known to be a heterogeneous system consisting of a gradation of aggregate particles, asphalt binder, and air voids. The mechanical properties of a mixture are largely dependent on the material properties of its individual constituents and their interactions. To develop the relationship between the mechanical properties of a mixture and its individual constituents, the theory of micromechanics can be used. In the past few decades, many efforts have been made to study the fundamental mechanisms behind the behavior of a mixture using different micromechanical models ( 1 – 6 ).
Commonly used micromechanical models include semi-empirical models (i.e., Hirsch model) ( 7 ), numerical micromechanical models (i.e., finite element model and discrete element model) ( 3 , 8 ) and analytical micromechanical models (i.e., the Mori-Tanaka model, the self-consistent model, the generalized self-consistent model, the Differential model, etc.) ( 9 – 12 ). Empirical micromechanical models are easy to implement; however, they always require calibration factors to fit the experimental results. Numerical micromechanical models can describe the complicated microstructure of a material; however, the establishment of a model requires many finite or discrete elements and thus it typically takes a quite long time to obtain the calculation results. Therefore, for the purpose of understanding the behavior of asphalt mixture, analytical micromechanical models, which do not need calibration factors and can provide analytical solutions, have been preferred by many researchers ( 1 , 13–17).
Using micromechanics as a tool, research studies have been conducted to understand the mechanisms behind the stiffness of asphalt materials. Researchers ( 1 , 18 ) have pointed out that the stiffening mechanisms of asphalt materials include the volume-filling reinforcement, the physicochemical reinforcement, and the particle-contact reinforcement. The volume-filling reinforcement refers to the stiffening effect caused by the addition of stiffer aggregate particles into a softer matrix (i.e., asphalt binder, mastic, or mortar). The stiffer aggregates affect the stress and strain fields of the matrix phase, leading to a material with higher stiffness. The physicochemical reinforcement indicates the stiffening effect resulting from the physicochemical interaction between the matrix and the particles. As a consequence, coating layers surrounding the particles are formed. Moreover, the particle-contact reinforcement is related to the direct contacts among particles. In a composite with a high concentration of aggregate particles, a particle-on-particle skeleton framework is expected to form and thus makes contributions to the load-bearing capacity of the composite.
Researchers ( 1 , 19 ) further pointed out that analytical micromechanical models can be used to estimate the stiffening effect of the volume-filling reinforcement. These models are developed on the basis the Eshelby’s solution ( 9 ) to an inhomogeneous problem where an inclusion is embedded into an infinite medium, and thus they can describe the effect of the inclusion on the stress and strain fields of the matrix. However, since these models do not consider the physicochemical interactions and the direct contacts among particles, they cannot account for the stiffening effect of the physicochemical reinforcement and the particle-contact reinforcement.
With the above realization, researchers ( 1 ) have proposed the use of analytical micromechanical models to separate the stiffening effects of different mechanisms from the total stiffness of mastic. The stiffening effect of the volume-filling reinforcement was obtained directly using the generalized self-consistent model. Furthermore, by modifying the generalized self-consistent model, the stiffening effect of the physicochemical reinforcement was also estimated. By subtracting the stiffening effects of these two mechanisms from the total stiffness, the stiffening effect of the particle-contact reinforcement was identified.
Although the separation of different stiffening effects in mastic was implemented, similar research work has not been carried out concerning asphalt mixtures. Comparing to the mastic, asphalt mixture contains a much higher concentration of aggregate particles. Therefore, it is expected that in asphalt mixture, the stiffening effects of different mechanisms should be different from those in mastic. Furthermore, previous work did not provide a deep analysis of the characteristics of the particle-contact reinforcement. Basic questions such as its dependency on temperatures/frequencies, whether it is affected by the properties of the matrix phase, and so forth., were not thoroughly investigated. Considering that until now there are no suitable models to predict the stiffening effect of the particle-contact reinforcement, investigation into its characteristics will be beneficial to the development of such models.
Based on the above discussions, the aim of this paper is to understand the stiffness of asphalt mixture throughout micromechanics. The focus of this study is on porous asphalt (PA) mixture where a stone-on-stone skeleton is formed and thus the particle-contact reinforcement plays an important role in the behavior of the mix. The scope of this study includes:
determining the stiffening effects of different mechanisms on the behavior of PA mixes;
analyzing the characteristics of the stiffening effect of the particle-contact reinforcement in PA mixes.
Background Knowledge
Differential Model
As introduced above, various analytical micromechanical models can estimate the stiffening effect of the volume-filling reinforcement. It was shown in the previous work of the authors ( 16 ) that among the commonly used analytical micromechanical models, the Differential model provided the most accurate predictions for the stiffness of PA mixes. Therefore, in this study, the stiffening effect of the volume-filling reinforcement was estimated using the Differential model.
In the Differential model, inclusion particles are added in steps. As shown in Figure 1, in the first step, inclusion particles with a small volume of V2(1) are added into the matrix phase with a stiffness tensor of
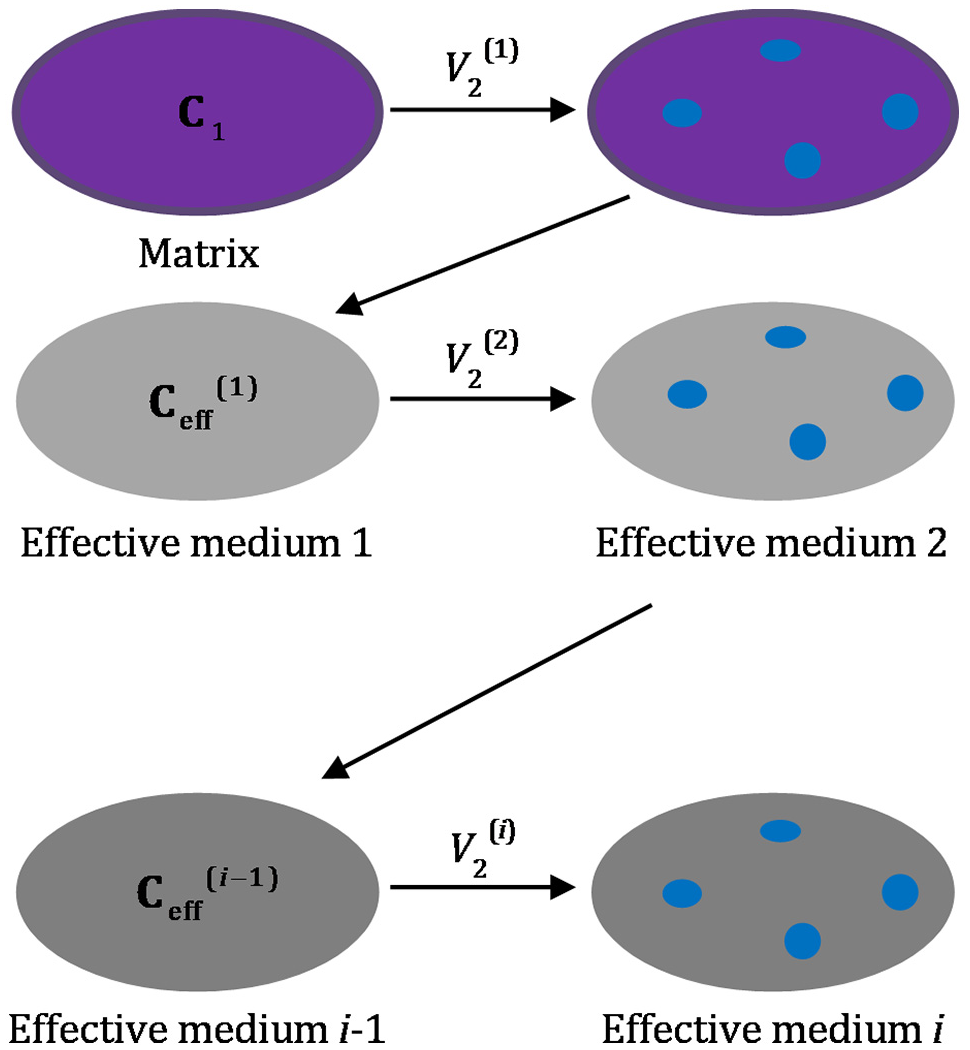
Illustration for the Differential model.
Using the Differential model, the stiffness tensor of a PA mix

where
the subscripts “a” and “v” represent the aggregate phase and the air voids phase, respectively,
the superscript “c” indicates the final composite,
ϕ is the sum of the volume fractions of the aggregate phase and air voids phase, ϕa+ϕv,

where
Equation 1 can be solved numerically by discretizing it as Equation 3:

with


where
the superscripts “i” and “i−1” represent step i and step i−1, respectively;
Δϕ is the increment of the volume fraction of the inclusion phase; and
In this research work, after the sensitivity analysis of the effect of different calculation steps on the predicted results, a total of 50 steps were finally conducted to calculate the value of
Materials and Tests
In this study, laboratory tests were conducted to measure the stiffness of the mortar phase in a mix. The stiffness of the mortar was used to calculate the stiffening effect of the volume-filling reinforcement. Moreover, the stiffness of a PA mix was measured to determine the stiffening effect of the particle-contact reinforcement. In this section, detailed procedures that were used to prepare and test the mortar and the mix are presented.
PA Mix
Material
The aggregates that were used for making PA mixes specimens consisted of crushed aggregates (2 to 16 mm) and crushed sand (0 to 2 mm). The filler was Wigro 60 K filler (25% to 35% lime). The asphalt binder had a penetration grade of 70 to 100.
The recipe for making PA mix specimens conformed to the Dutch standards specifications ( 20 ). The content of asphalt binder was 4.3% by the total weight of the mix. The aggregates gradation, which contained a high content of coarse aggregates, is shown in Table 1. The densities of each size of aggregate and filler were measured according to the AASHTO standard methods ( 21 , 22 ). The density of the asphalt binder was assumed to be 1032 kg/m3.
Aggregates’ Gradation and Densities in Porous Asphalt Mix

Specimen Preparation
PA mix specimens were prepared according to the AASHTO standard method ( 23 ). PA mix materials were compacted using a gyratory compactor to obtain initial specimens with a size of 170 mm in height and 150 mm in diameter. These specimens were further cored and cut to the test specimens with a height of 150 mm and a diameter of 100 mm.
Laboratory Tests
PA mix specimens were tested using the Universal Testing Machine (UTM), see Figure 2. Since the stiffness of the mix was measured under the tensile loading condition, specimens were glued on the steel plate and mounted to the fixtures. Forces were applied from the bottom of the specimens, and the force level was measured via the load cell on the top. Vertical displacement was measured using three linear variable differential transformers (LVDT), which were equally distributed around the specimens. The distance between the two end positions of each displacement sensor was 100 mm.

Set-up for the temperature and frequency sweep test of porous asphalt mixes.
Eight different test temperatures, −10°C, 4°C, 21°C, 30°C, 37°C, 45°C, 54°C, and 60°C, were used to measure the complex Young’s modulus of PA mixes. At each temperature, six frequencies of 20 Hz, 10 Hz, 5 Hz, 1 Hz, 0.5 Hz, and 0.1 Hz were used. The number of the loading cycles for each frequency, according to the AASHTO standard method ( 23 ), was 200 for 20 Hz, 200 for 10 Hz, 100 for 5 Hz, 20 for 1 Hz, 15 for 0.5 Hz, and 15 for 0.1 Hz.
The test was conducted in strain-control mode. The amplitude of the applied strains at all the temperatures and frequencies was chosen as 10 με. The selection of this strain level was on the basis of the consideration that the strain level has to be small enough to minimize the nonlinearity and damage of the mix. Apart from that, it is impossible with the available equipment to reliably measure the modulus of the mix at further small strain levels.
Mortar
Material
In this study, the mortar material was defined to include fine aggregates with sizes smaller than 0.5 mm and asphalt binder. The proportioning of fine aggregates was kept the same as that in the full mixture, but it was normalized with respect to the maximum sieve in the mortar (0.5 mm), see Table 2. According to the contents of the fine aggregates and the asphalt binder in the mix, the content of the asphalt binder in the mortar was calculated as 23%.
Aggregates’ Gradation in Mortar

Specimen Preparation
A special mold was designed to make mortar specimens, see Figure 3a. To clearly show the structure of the mold, a top view and a front view of the mold are given in Figure 3b. Mortar specimens are surrounded by a kind of silicone rubber that does not stick to asphalt materials. The steel frame, as a support, is used to hold the shape of the silicone rubber and prevent it from deforming.

Preparation of mortar specimens: (a) Mold; (b) a sketch of the mold; and (c) specimen size.
The obtained specimens have a diameter of 6 mm and a height of 12 mm, see Figure 3c. At the top and bottom of the specimens, steel rings with a thickness of 1 mm and a height of 4 mm were attached ( 24 ) to clamp the specimens on the Dynamic Shear Rheology (DSR) device. It is highlighted here that the geometry of these mortar specimens was designed for two main reasons. First of all, this geometry considered the limitation of the DSR device, such as the maximum height that the machine can be lifted, the maximum diameter that the clamping system is allowed, and so forth. Also, as mentioned above, the maximum size of the sand in the mortar material was only 0.5 mm. For mortar material with a fine aggregate gradation, the geometry used in this study was sufficient to ensure the homogeneity of the specimens. By contrast, the traditional geometry with a height of 50 mm and a diameter of 12 mm adapts to mortar material consisting of a coarse gradation of sand with a maximum size of as high as 2.36 mm ( 25 ).
Using the designed mold, mortar specimens were prepared following four steps:
mix the preheated asphalt binder, filler, and sand particles to obtain homogeneous mortar material;
heat the mortar material and the mold in the oven at 160°C for 30 min to ensure the fluidity of the material;
pour the mortar into the mold slowly and then place the filled mold back in the oven at 160°C for 10 min to remove possible air bubbles; and
cool the mold for 10 min at room temperature and around 24 h in the freezer and then remove the specimens from the mold.
It is noted that in this study, because of the high asphalt binder content, the air voids content of the mortar material was quite low (<1% according to the Nano CT scan result). Therefore, there was no need to control the density of the specimens during their preparations.
Laboratory Test
In the study, the shear modulus of the mortar specimens was measured. Since the mortar material is soft, the geometry of a mortar specimen is not easily changed in the shear mode (comparing to the compressive and the tensile loading mode). Therefore, in this case, the properties of the mortar can be accurately measured.
Using a DSR device with a so-called “column configuration,” temperature and frequency sweep tests were conducted for the measurement, see Figure 4. The test frequency ranged from 20 Hz to 0.1 Hz, at five different temperatures of −10°C, 4°C, 21°C, 37°C, and 54°C. At each temperature, constant small strains with amplitude ranging from 10 με at low temperatures to 200 με at high temperatures were applied to ensure the linear viscoelastic behavior of the material. To guarantee the reliability of the measured values, three replicates were used.

Column configuration.
Input Parameters for Differential Model
The experimental results of the mortar’s dynamic shear modulus |Gmor*| are shown in Figure 5. It can be seen that with the decrease of frequencies, the values of |Gmor*| keep decreasing. It is noted that this liquid-like behavior of mortar may be different from what was observed by other researchers ( 25 ), namely that the mortar showed an asymptotic trend at very lower frequencies. However, considering that the asphalt binder content of the mortar specimens used in this study was much higher than that used by other researchers ( 25 ), it is reasonable to obtain a more viscous material.
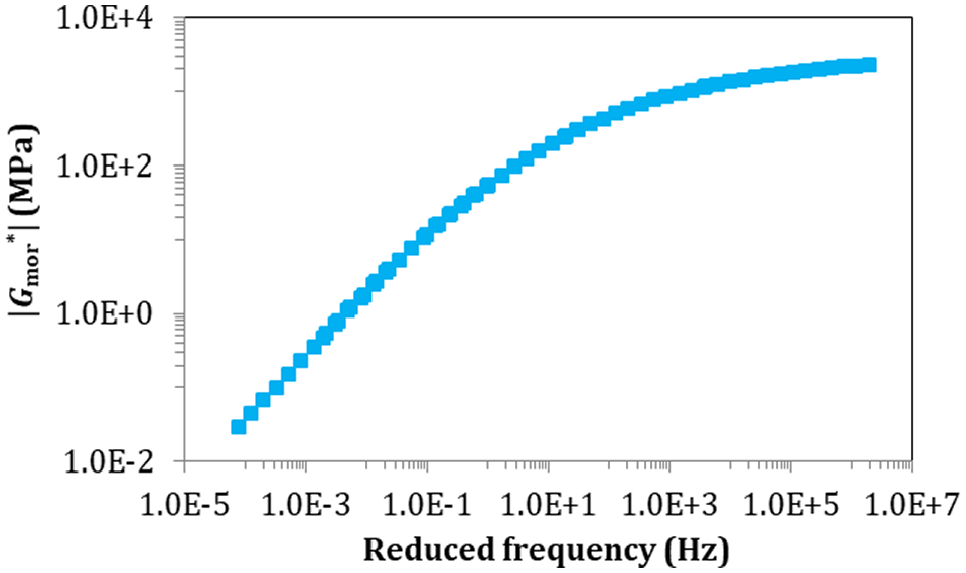
Experimental results of mortar’s shear modulus.
Except for the shear modulus, another material constant is required to calculate the stiffness tensor of the mortar phase
For the aggregate phase, its stiffness tensor
Results and Discussions
Stiffening Effect of the Volume-Filling Reinforcement
The stiffness resulting from the volume-filling reinforcement |Emixm|, which was predicted using the Differential model, is shown in Figure 6. It can be seen that at high frequencies, the values of |Emixm| match quite well with the experimental results of the total stiffness of the mix |Emix*|. However, with the decrease of frequencies, the difference between |Emixm| and |Emix*| increases, and at very low frequencies, the values of |Emixm| are significantly different from the values of |Emix*|. For example, at a frequency of 10−5 Hz, the value of |Emix*| is almost 100 times higher than the value of |Emixm|.
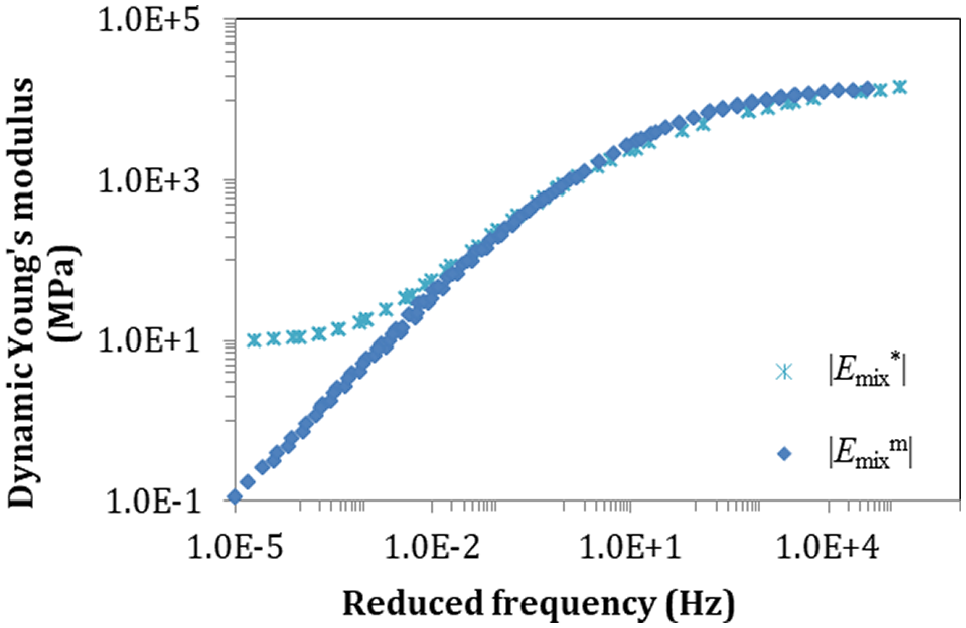
Stiffness resulting from the volume-filling reinforcement.
The above observations indicate that the stiffening effect of the volume-filling reinforcement dominates the behavior of the mix at high frequencies. With the decrease of frequencies, the contributions from the volume-filling reinforcement become less significant, and at very low frequencies, these contributions can even be neglected. In this case, the other stiffening mechanism, the particle-contact reinforcement, is supposed to take over the behavior of the mix.
Stiffening Effect of Particle-Contact Reinforcement at High Temperatures/Low Frequencies
As mentioned earlier, in this study, a PA mix was considered as a composite consisting of mortar, aggregate particles, and air voids. When upscaling is conducted from mortar to mix, the stiffening effect of the physicochemical reinforcement can be neglected because it is generally considered that physicochemical interactions occur between asphalt binder and filler particles. Therefore, the observed differences in Figure 6 between the values of |Emixm| and the values of |Emix*| at lower frequencies can be considered the contribution from the stiffening effect of the particle-contact reinforcement |Emixc|.
To separate the stiffening effects resulting from different mechanisms, previous research studies (1, 28) have proposed an assumption that the addition of the stiffnesses from different stiffening mechanisms yields the total stiffness of a mix. Using the same assumption here, the result that the value of |Emix*| is the sum of the values of |Emixm| and |Emixc| can be obtained, see Equation 8. Since the values of |Emixm| and |Emix*| are already known, the value of |Emixc| can be easily determined.

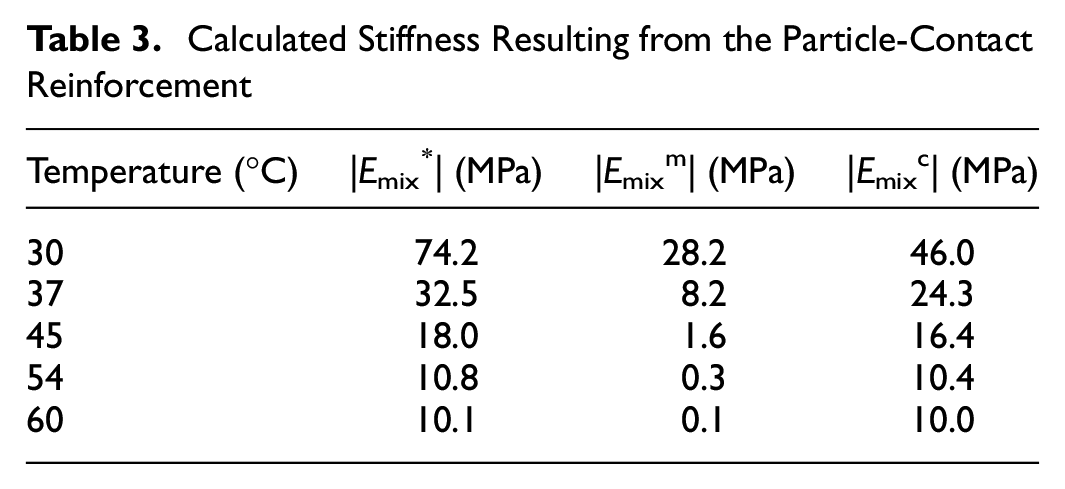
To investigate the effect of temperature/frequency on the characteristics of particle-contact reinforcement, the values of |Emixc| at a fixed frequency of 0.1 Hz but at different temperatures of 30°C, 37°C, 45°C, 54°C, and 60°C were calculated, see Table 3. The relationship between the values of |Emixc| and the test temperatures is plotted in Figure 7. It can be seen that the value of |Emixc| decreases with the increase of temperatures or the decrease of frequencies, and a simple power function, as shown in Figure 7, can be used to describe this relationship.
Calculated Stiffness Resulting from the Particle-Contact Reinforcement
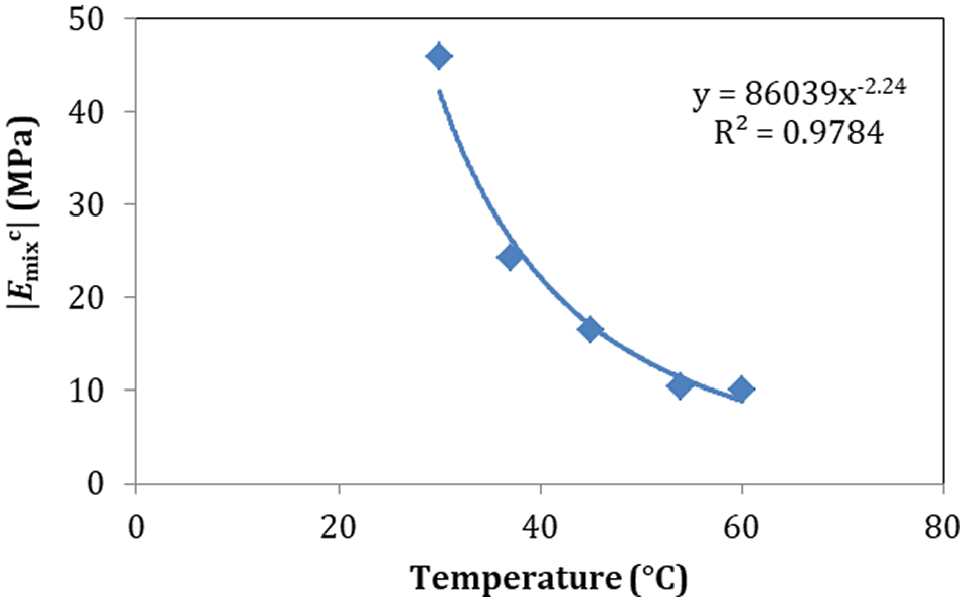
Effect of temperature on the characteristics of particle-contact reinforcement.
Relationship between the Stiffening Effect of the Particle-Contact Reinforcement and the Properties of the Matrix Phase
Further investigation was conducted into the relationship between the values of |Emixc| and the properties of the mortar. This investigation was motivated by the previous finding that the values of |Emixc| are temperature/frequency-dependent, together with that, in a mix, only the properties of the mortar phase change with temperatures/frequencies. Therefore, it was expected that the temperature/frequency-dependent characteristic of |Emixc| may be associated with the properties of the mortar phase.
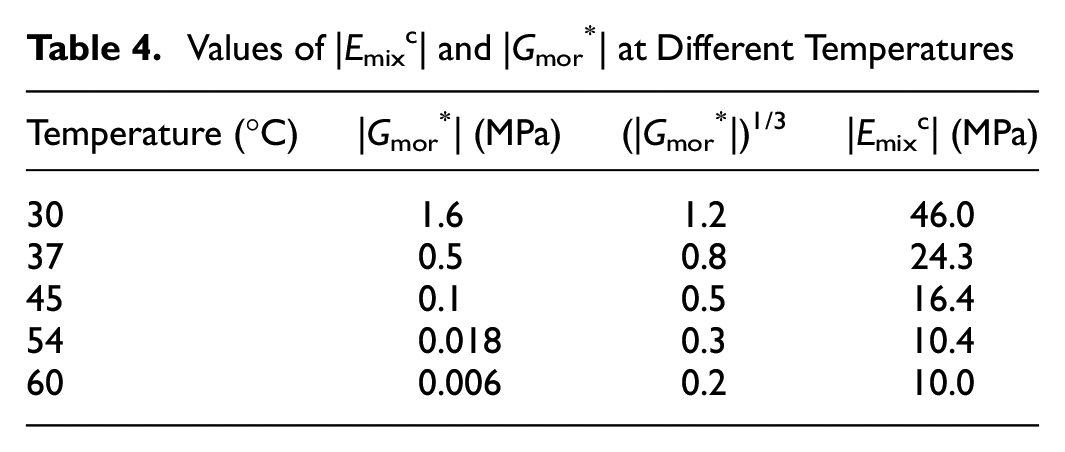
The values of |Gmor*| at the frequency of 0.1 Hz and the temperatures of 30°C, 37°C, 45°C, 54°C, and 60°C, which were directly obtained from laboratory tests, are listed in Table 4. The relationship between |Emixc| and |Gmor*| is plotted in Figure 8. It can be seen that the stiffness resulting from the particle-contact reinforcement is significantly affected by the mechanical properties of the mortar. The value of |Emixc| decreases with the decrease of |Gmor*|. In an extreme case, when the mortar is very soft and melts away, it is expected that the mix would collapse (point [0, 0]). Therefore, it can be stated that the mortar plays a crucial role in the stiffening effect of the particle-contact reinforcement.
Values of |Emixc| and |Gmor*| at Different Temperatures
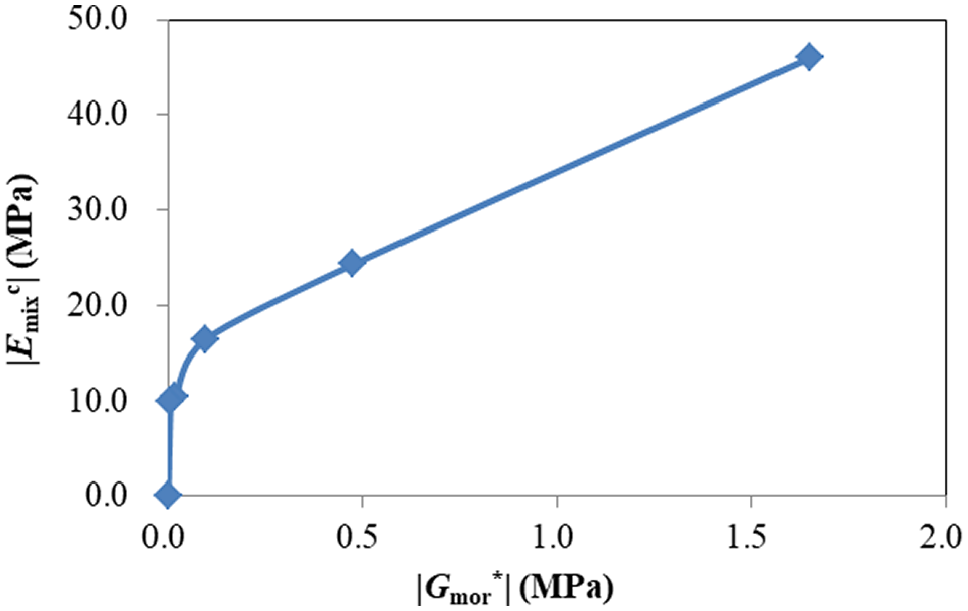
Relationship between |Emixc| and |Gmor*|.
According to the relevant theories for packing aggregate particles ( 29 ), it is known that the mechanical properties of an aggregates pack rely on its confinement. When there is no confinement, the aggregates pack could not stand any load and would just break down. This phenomenon is the same with that for an asphalt mixture when the soft mortar flows away at high temperatures. Therefore, it can be hypothesized that the role of the mortar is similar to the role of the confinement for packing aggregate particles.
Furthermore, for an aggregate pack, researchers ( 29 ) derived that the stiffness of the pack is in a linear relationship with the cube root of the confining pressure. Therefore, to further strengthen the above hypothesis, the relationship between the values of |Emixc| and the cube root of |Gmor*| is plotted, see Figure 9. It can be seen that all the points at different temperatures are approximately distributed around a line, and a linear function, see Equation 9, can be used to fit the relationship between the values of |Emixc| and the values of |Gmor*|1/3 quite well.
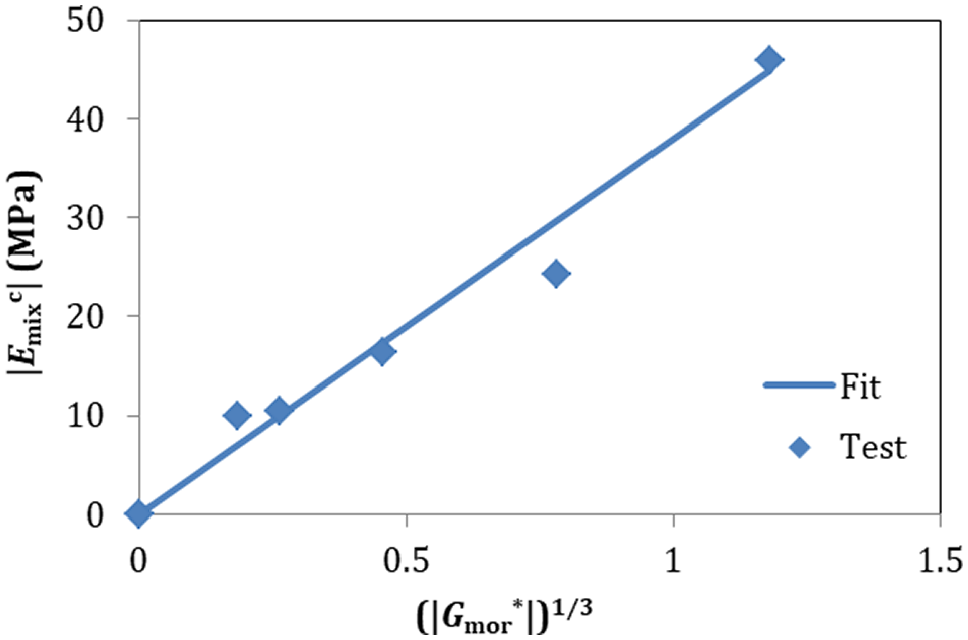
Relationship between |Emixc| and |Gmor*|1/3.
It is noted here that to the best of the authors’ knowledge, in the field of pavement engineering, there have been no other studies using the hypothesis that the role of the mortar in the mix is similar to the confinement for packing aggregate particles. Nevertheless, in other fields, using a similar concept that the behavior of the liquid provided confinement for the granular particles, researchers ( 30 ) have accurately predicted the properties of wet granular materials.

Predicted Stiffness of a PA Mix
On the basis of the relationship obtained between the values of |Emixc| and the values of |Gmor*| in Equation 9, the stiffness resulting from the particle-contact reinforcement in the whole frequency range can be obtained. Furthermore, by adding the values of |Emixc| to the values of |Emixm|, the total stiffness of the mix can be determined.
Figure 10 shows the predicted results of |Emixc| and |Emix*|. It can be seen that, with the decrease of frequencies, the value of |Emixc| decreases. According to the above hypothesis that the mortar provides the confinement for the packing aggregate particles in a mix, the decrease of |Emixc| with frequencies can be attributed to the decrease of the mortar’s stiffness and thus the confinement for the packing aggregates.

Predicted stiffness of a porous asphalt mix.
The comparison between the values of |Emixm| and the values of |Emixc| shows that both the volume-filling reinforcement and the particle-contact reinforcement make contributions in the whole frequency range. Nevertheless, as expected, at high frequencies, the stiffening effect of the volume-filling reinforcement is dominant over the particle-contact reinforcement, whereas at low frequencies, the contributions from the particle-contact reinforcement are much more significant.
By combining the stiffening effect of the volume-filling reinforcement and that of the particle-contact reinforcement, the predicted results of |Emix*| are in good agreement with the experimental results. This agreement, to some extent, verifies the established relationship between the values of |Emixc| and the values of |Gmor*| in Equation 9.
Conclusions
This paper has determined the stiffening effects of the volume-filling reinforcement and the particle-contact reinforcement for PA mixes using the theory of micromechanics. On the basis of the obtained results, the characteristics of the particle-contact reinforcement were analyzed in depth. From this study, the following conclusions can be drawn:
Both the volume-filling reinforcement and the particle-contact reinforcement make contributions to the behavior of the mix in the whole frequency range. At high frequencies, the stiffening effect of the volume-filling reinforcement is dominant over the particle-contact reinforcement, whereas at low frequencies, the contributions from the particle-contact reinforcement are much more significant.
The stiffness resulting from the particle-contact reinforcement decreases with the increase of temperatures or the decrease of frequencies, and a simple power function can be used to describe this relationship. Furthermore, this stiffness is significantly affected by the mechanical properties of the matrix phase (mortar). When the stiffness of the mortar decreases, the stiffness from the particle-contact reinforcement decreases as well.
The role of the mortar is similar to the role of the confinement for packing aggregate particles. The stiffness resulting from the particle-contact reinforcement is in a linear relationship with the cube root of the stiffness of the mortar.
The stiffness of a PA mix can be estimated by adding the stiffening effects of the volume-filling reinforcement and the particle-contact reinforcement. The stiffening effect of the volume-filling reinforcement can be determined using micromechanical models while the stiffening effect of the particle-contact reinforcement can be quantified using the calibrated relationship with the mortar properties.
This study has provided insight into how individual constituents affect the stiffening effects of different mechanisms and thus further the total stiffness of the mix. This information can guide the selection of individual components and the design of their proportions to obtain the desired mix properties. Also, for a certain mix design with given materials and their proportions, the approach provided in this study can be used to estimate the stiffness of the mix on the basis of the mechanical and volumetric properties of each component. As a result, this may avoid time and money being spent in laboratory tests for measuring the stiffness of the mix.
Moreover, the above findings could provide new guidelines for the design of PA mixes. At present, the commonly used method designed for PA mixes does not take the characteristics of the stone-on-stone skeleton into account. However, according to the above findings, together with the previous studies of other researchers ( 31 ), the behavior of PA mixes relies heavily on the stiffening effect of the stone-on-stone skeleton, especially at high temperatures (>30°C). Therefore, it can be suggested that the current design method for PA mixes could be improved by considering the stiffening effect of the stone-on-stone skeleton.
Future Research Work
Instead of back-calculating from laboratory tests, future research work will focus on developing an effective model to predict the stiffening effect of the particle-contact reinforcement through relevant packing theories.
Footnotes
Acknowledgements
The corresponding author would like to thank the financial support from China Scholarship Council.
Author Contributions
The authors confirm the contribution to the paper as follows: study conception and design: Athanasios Skarpas, Sandra Erkens, Kumar Anupam, Hong Zhang; data collection: Hong Zhang; analysis and interpretation of results: Hong Zhang, Kumar Anupam, Athanasios Skarpas, Cor Kasbergen; draft manuscript preparation: Kumar Anupam, Hong Zhang. All authors reviewed the results and approved the final version of the manuscript.
Declaration of Conflicting Interests
The author(s) declared no potential conflicts of interest with respect to the research, authorship, and/or publication of this article.
Funding
The author(s) disclosed receipt of the following financial support for the research, authorship, and/or publication of this article: China Scholarship Council.
Data Accessibility Statement
The datasets generated during and/or analyzed during the current study are available from the corresponding author on reasonable request.