
Abstract
This study is part of an environmental experimental program on the use of scrap automobile tires for geotechnical applications. Different types of laboratory tests were conducted to determine the elastic, plastic, and creep parameters of tire derived aggregate (TDA)-sand granulated mixtures. However, this paper emphasizes the plasticity parameters via the development of a critical state model based on the results of triaxial tests. This was attained by considering loose sand specimens, at a predetermined TDA volumetric content, subject to three different confining pressures under a constant axial displacement rate. The calculated deviatoric stress versus axial strain curves, obtained via the modified Cam Clay model, captured the non-linear elastoplastic response obtained in the tests. Results indicated that the level of the shear strength is highly dependent on critical state friction angle which in turn depends on the TDA content. For the loose TDA-sand mixtures used in the present study, the effect of the TDA content demonstrates a reinforcement of the sand matrix. However this reinforcement diminishes as the TDA content increases.
Environmental as well as economic conditions have given rise to the use of recycled tires as construction materials. There are various reasons for this. One of them is that stockpiles of discarded tires are on the rise and constitute a real fire hazard, not to mention a breeding ground for rodents. Another reason is that natural resources like sand, clay, gravel, and other mineral aggregates are being depleted throughout the world because of the opening of new quarries. Finally, when shredded, tire derived aggregate (TDA) could be mixed with traditional construction aggregate materials. The basic characteristics of such mixtures are that they are lightweight and frictionally resistant precisely as a result of the TDA. Another important property of sand-TDA mixtures is their low thermal conductivity. This constitutes an economic and engineering advantage over traditional materials.
Granular material mixed with TDA is increasingly used in geotechnical applications. In many of these operations, sand is mixed with TDA, at various volumetric ratios, in areas of applications such as highway embankments and bridge abutments ( 3 – 5 ). In northern regions, TDA-granular soil mixtures are also employed in pavement design. They primarily serve as an insulating layer to prevent frost heave and therefore degradation of the road surface ( 12 ).
A review of related past studies exposes a lack of experimental as well as numerical investigations on long-term time-dependent constitutive behavior of sand-TDA mixtures. A recent study on sand-TDA mixtures clearly indicates a primary creep phase that rapidly transitioned into a secondary stationary creep phase, never attaining the tertiary phase ( 8 ). The magnitude of the creep strain was strongly affected by the TDA volume fraction content ( 21 ). This observation conduced the adoption of the Norton-Bailey law as a possible constitutive model for creep of TDA-sand mixtures. Other studies such as Wartman et al. examined the immediate and time-dependent compression of tire chips and shreds ( 22 ). The time-dependent deformation of the mixture was also shown to be inversely proportional to the sand content. In another study, the one-dimensional compression of specimens, composed of sand and granulated tire rubber, was investigated ( 16 ). There again, results indicated that the time-dependent deformation is significant. However, a complete constitutive model must consider, in addition to time-dependent deformations, the shear strength of the sand-TDA mixtures.
In the past decades, most of the laboratory research with regard to shear strength was conducted on sand reinforced with tire chips (generally from 10 to 300 mm in size) (1, 5, 6, 9, 11). The direct shear box test and the triaxial test were the apparatuses mostly used to test these mixtures. The overall research emphasized that the shear strength of sand is increased by the tire chips.
Direct shear box tests by Bosscher et al. and Foose et al. show an increase in shear strength with a rubber content of up to 50% ( 4 , 9 ). Foose et al. also reported that the failure envelope of sand-rubber mixtures containing dense sand is non-linear ( 9 ). Yang et al. also observed a non-linear failure envelope of the shear stress, but in the cases of granulated rubber and not tire chips ( 23 ). However, most studies of sand mixed with granulated rubber, using the direct shear box, show inconsistencies in the results. For example, Anbazhagan et al. determined an increase of the shear strength when granulated rubber is mixed with uniform sand ( 2 ). However, the shear strength decreased when the granulated rubber was mixed with poorly graded sand. Ghazavi reported an insignificant increases in shear strength of the mix with an increase in granulated rubber ( 10 ).
Experimental studies on the shear strength measured in the triaxial apparatus also show considerable inconsistencies in the test results. A study by Noorzad and Raveshi, in which tire crumbs act as reinforcement of a sand-tire mixture, found that the shear strength decreases with increase in the amount of tire crumbs. A similar conclusion was obtained for mixtures of sand and granulated rubber by Youwai and Bergrado and Madhusudhan et al. ( 14 , 24 ). On the other hand, a study by Venkatappa and Dutta determined some improvement in strength on additions of rubber inclusions ( 20 ). Tire chips with an aspect ratio of 2 showed the best improvement for low confining pressures and chip content.
Numerous laboratory investigations have considered sand reinforced with tire chips, whereas few have considered sand-TDA granular mixtures. None have considered a critical state model for interpretation of the test results. This will be attempted in the following.
Sand-TDA Mixtures of the Triaxial Tests
For the triaxial tests in this study, the specimens consisted of mixtures of two granular materials. One of these materials is Ottawa sand whose granulometric curve is shown in Figure 1. From the shape of this curve and with calculated values of
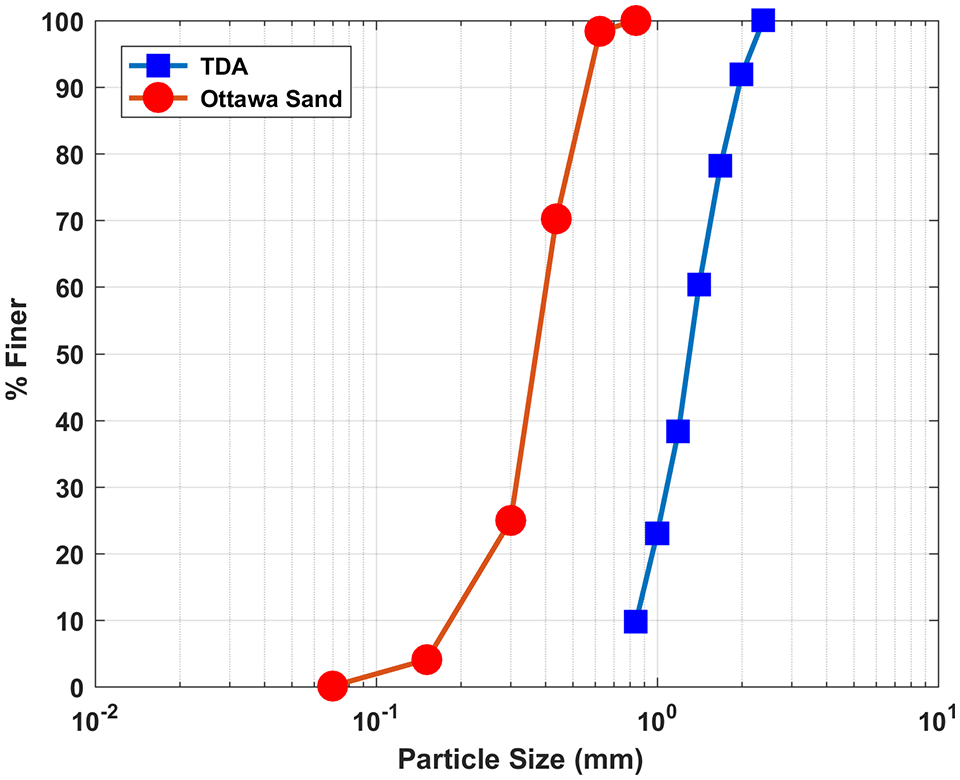
Grain-size distribution curves of materials used in the present study.
For the purpose of the tests these two materials were combined at three different volumetric ratios:
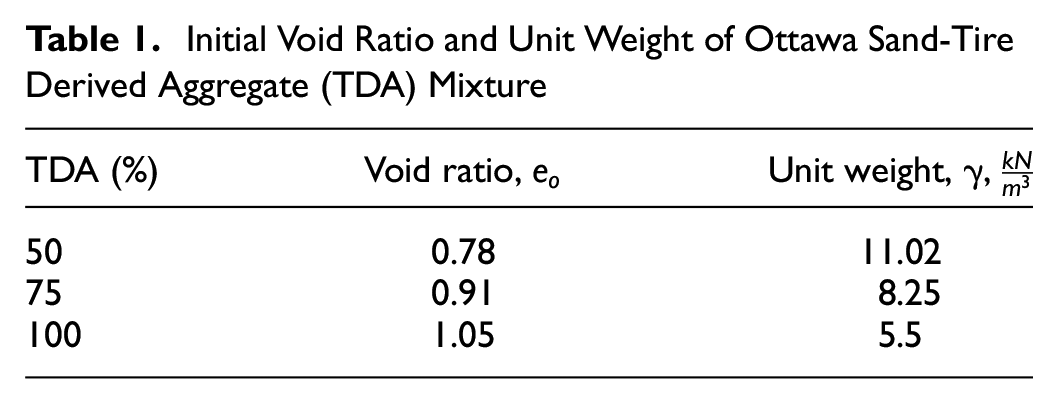
Initial Void Ratio and Unit Weight of Ottawa Sand-Tire Derived Aggregate (TDA) Mixture
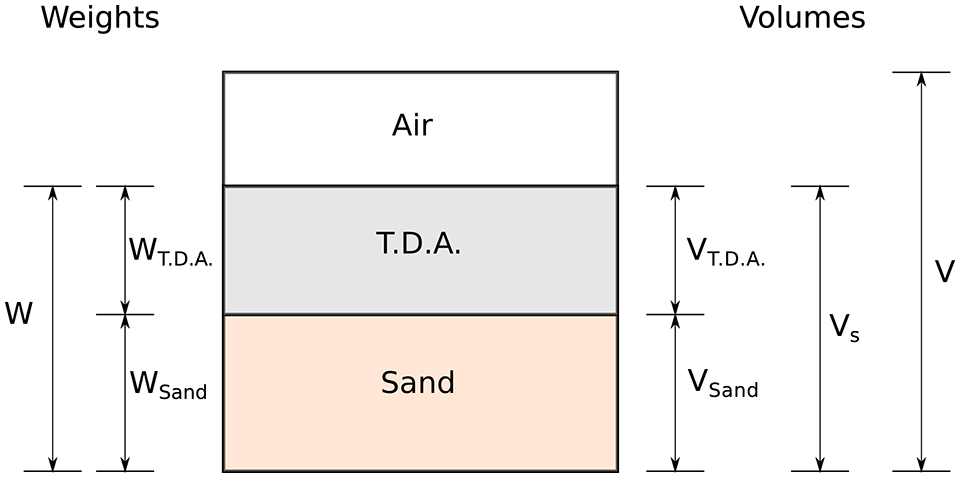
Phase diagram of tire derived aggregate (TDA)-sand mixture.
Test Equipment and Experimental Procedure
A standard triaxial apparatus, generally used for soils, was chosen for this study (Figure 3). The sand-TDA specimen measured 35.1 mm in diameter and 67.5 mm in height. A consistent procedure for preparing and testing dry samples of sand-TDA mixtures at a loose state was established. The required percentages of TDA were uniformly mixed with Ottawa sand in a dry condition. The sand was then poured into a rubber membrane inside a split mold former under vacuum. The sand-TDA specimens when sheared were subjected to confining cell pressures of 50, 100, and 150 kPa for each volumetric ratio
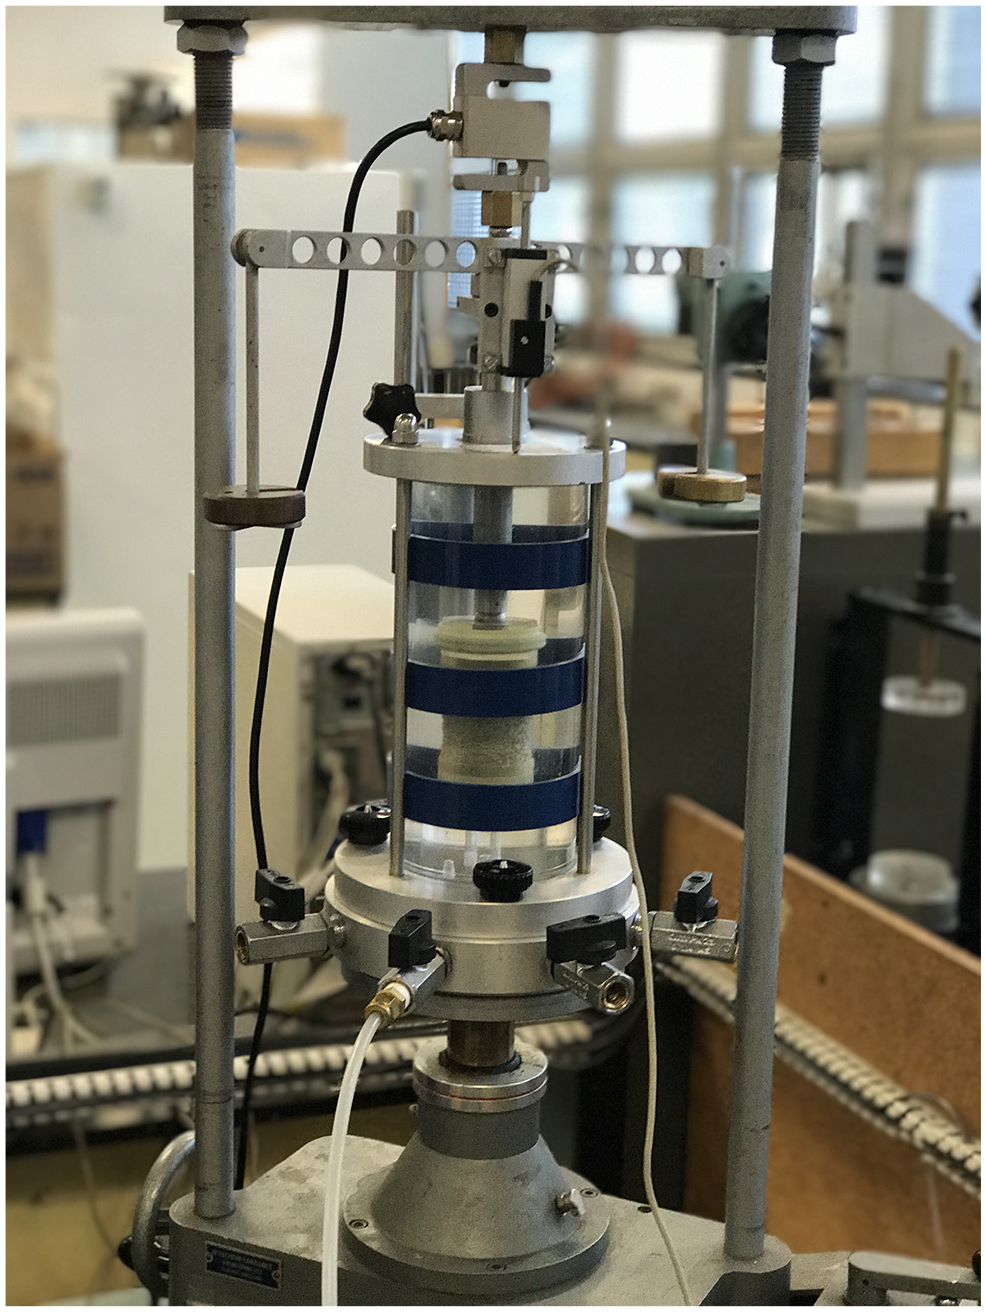
Triaxial test configuration.
Test Results and Observations
A total of nine triaxial tests on sand-TDA dry granular mixtures (at the three volumetric ratios and three confining pressures) were completed in the present study. Typical stress-strain curves for the cases pertaining to
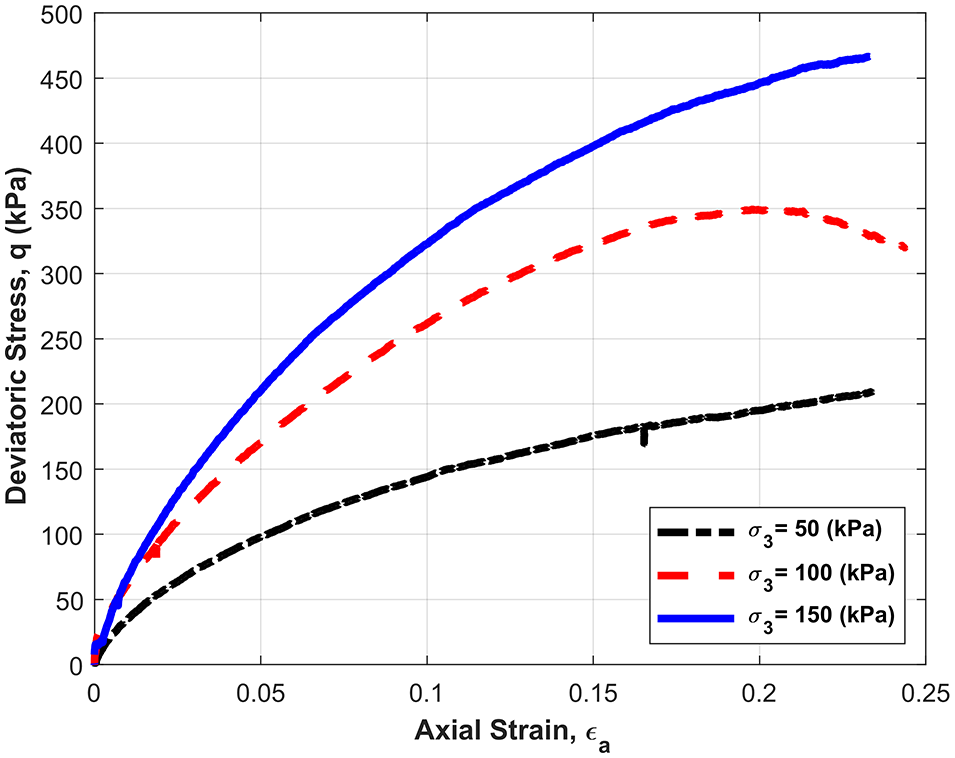
Test results of deviatoric stress versus axial strain at 50% tire derived aggregate (TDA).
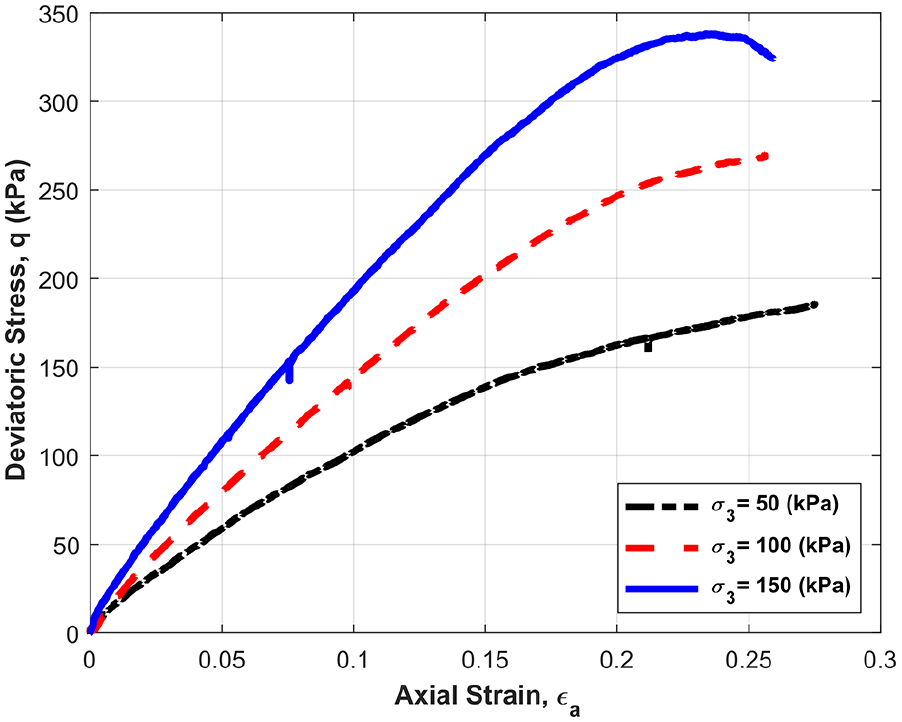
Test results of deviatoric stress versus axial strain at 75% tire derived aggregate (TDA).
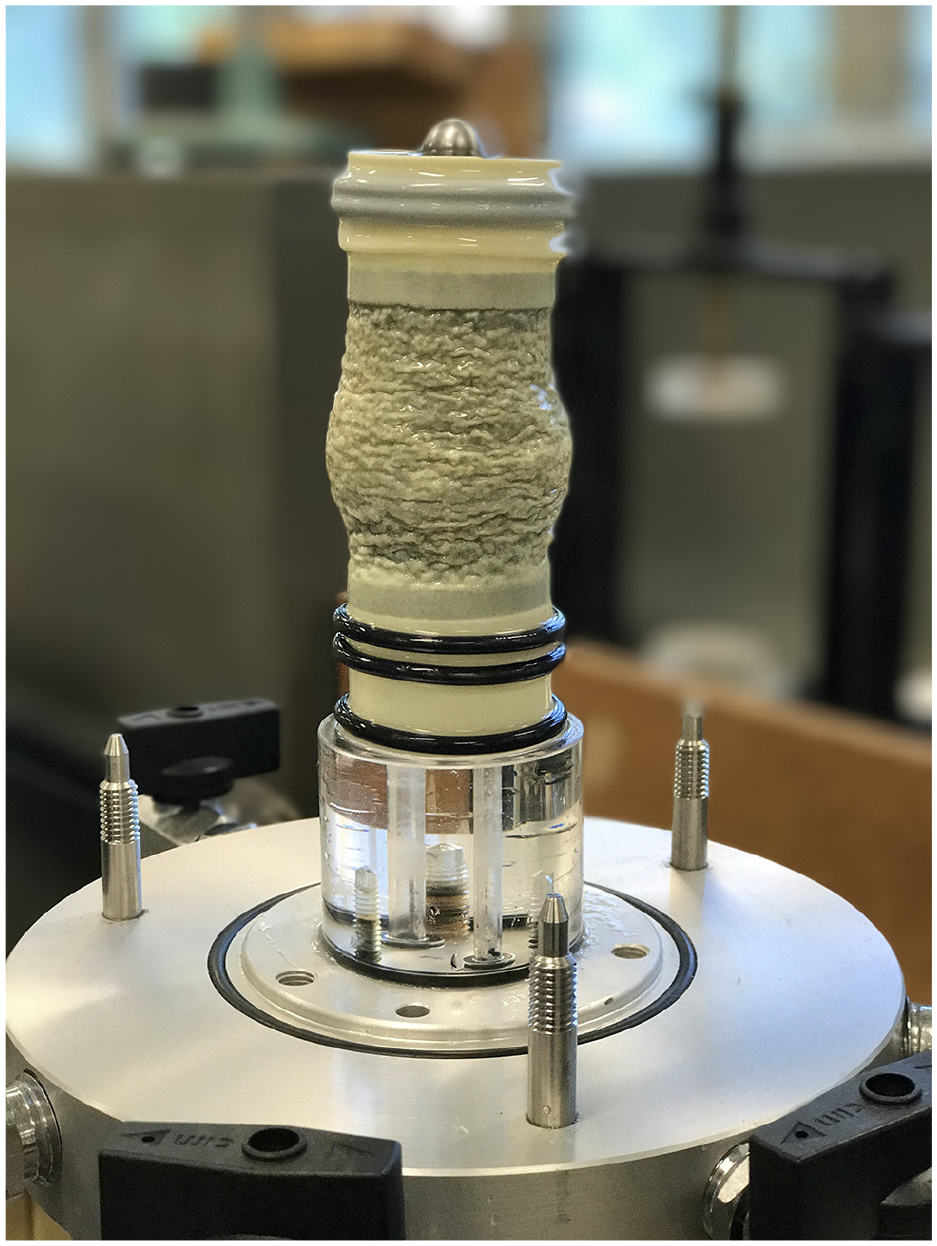
Sand-tire derived aggregate (TDA) mixture at the end of the triaxial test.
An interesting result for the triaxial tests with pure TDA particles
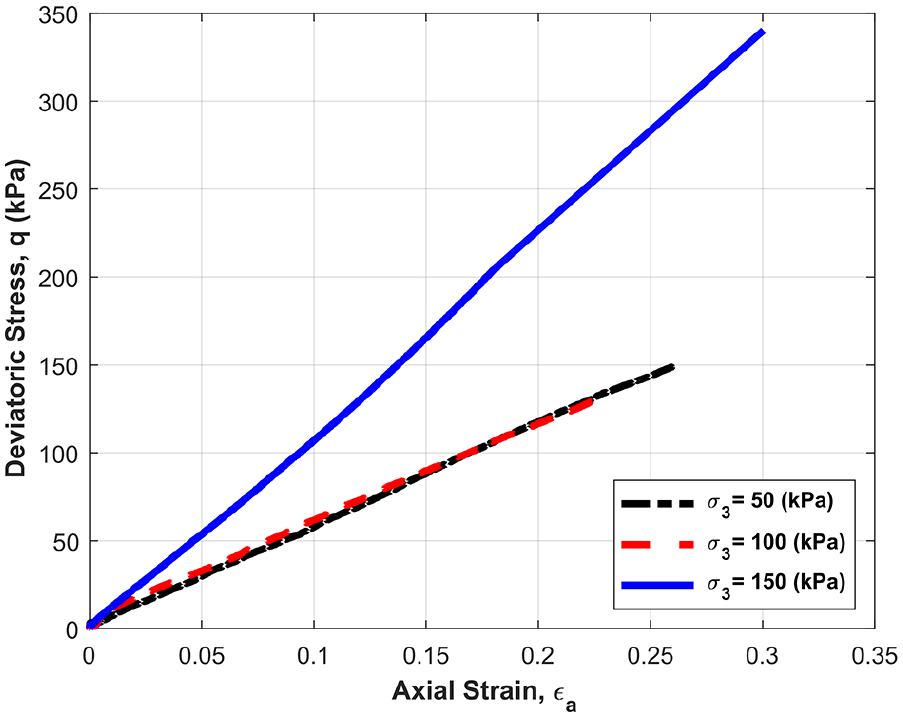
Test results of deviatoric stress versus axial strain at 100% tire derived aggregate (TDA).
In all of these tests, the value of the failure strain must be defined. At approximately 23% of the axial strain, the sand-TDA specimen is severely distorted, as previously mentioned (Figure 6). Therefore, the critical state, which is reached when no further changes in shear stress and volume occur under continuous shearing, cannot be attained. Several studies on triaxial testing have defined failure based on a predetermined strain in the range of 10%–20% (
17
,
23
). Thus, in this study, four different values of the axial strain (
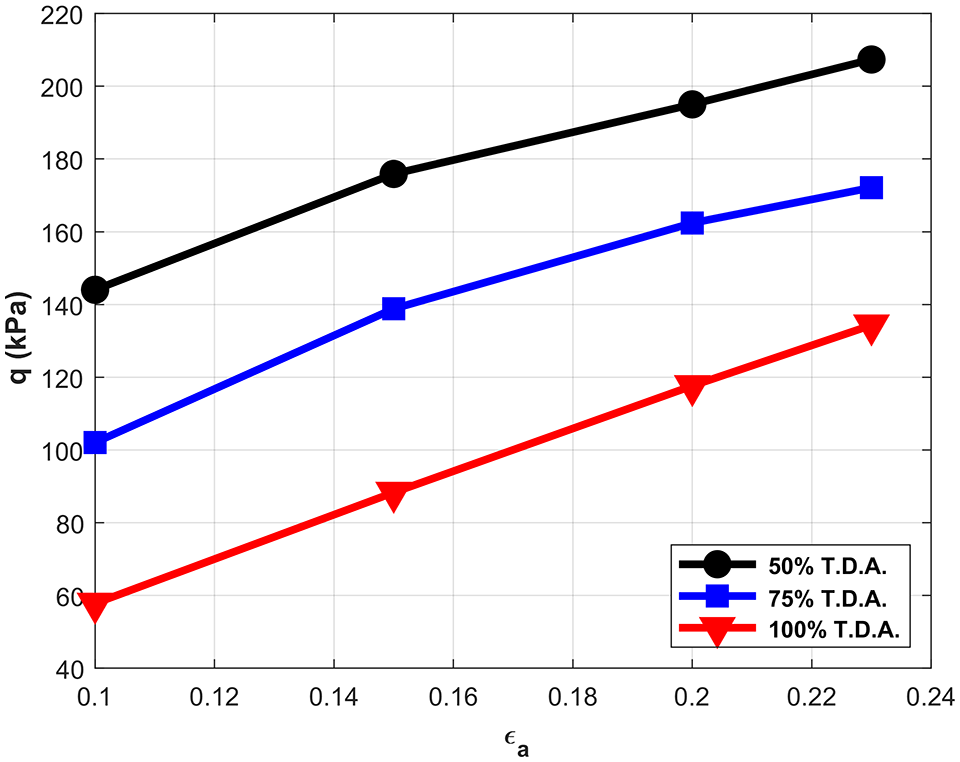
Deviatoric stress versus axial strain at failure for
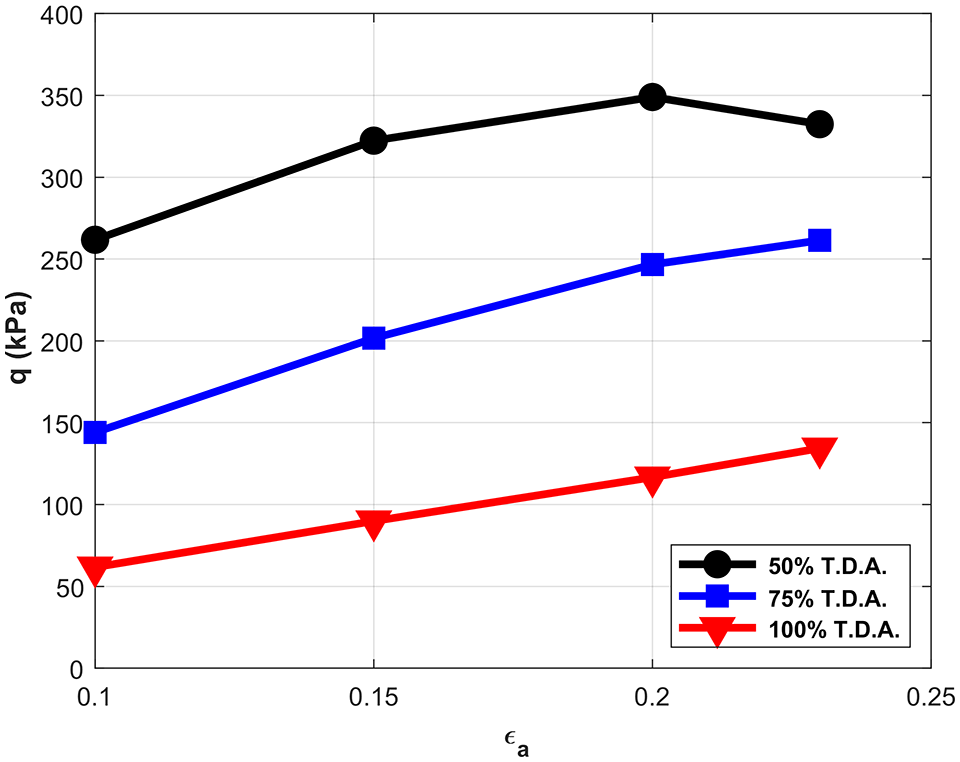
Deviatoric stress versus axial strain at failure for
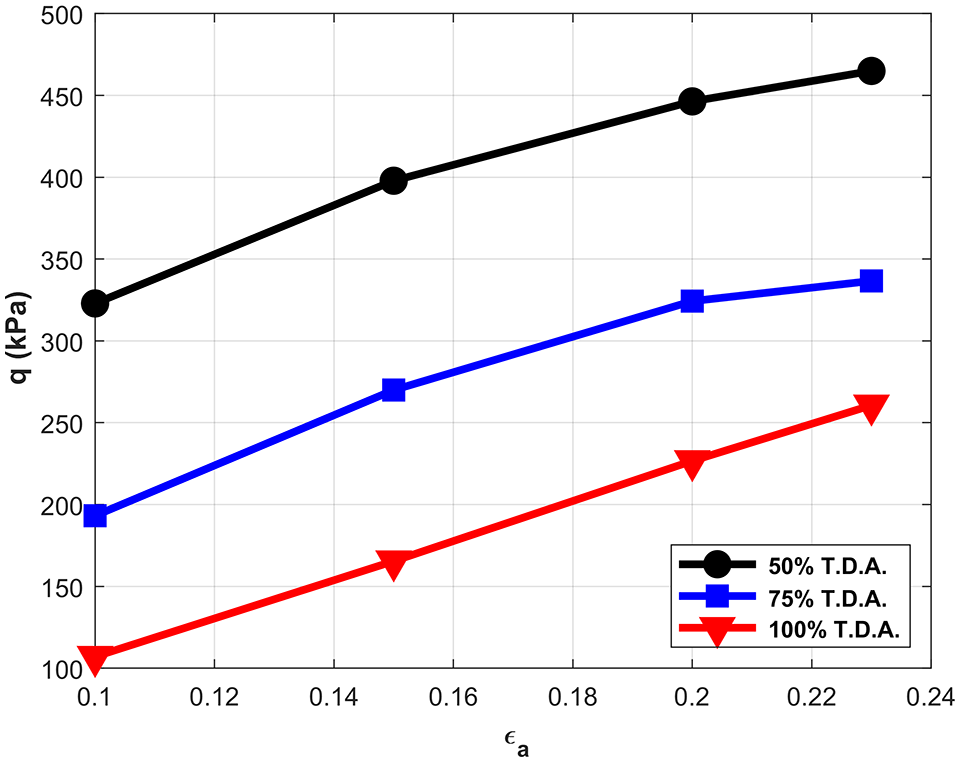
Deviatoric stress versus axial strain at failure for
The previous stress-strain curves (Figures 4, 5, and 7) showed a reduction in the stiffness of the sand-TDA mixtures as the TDA content increased. An average representation of stiffness for non-linear behavior is through the secant modulus. Figures 11–13 exhibit the secant modulus at the vertical failure strains previously cited. As confirmed by the previous results, the trend is analogous. The secant moduli decrease with an increase in TDA and a decrease of the confining pressure.
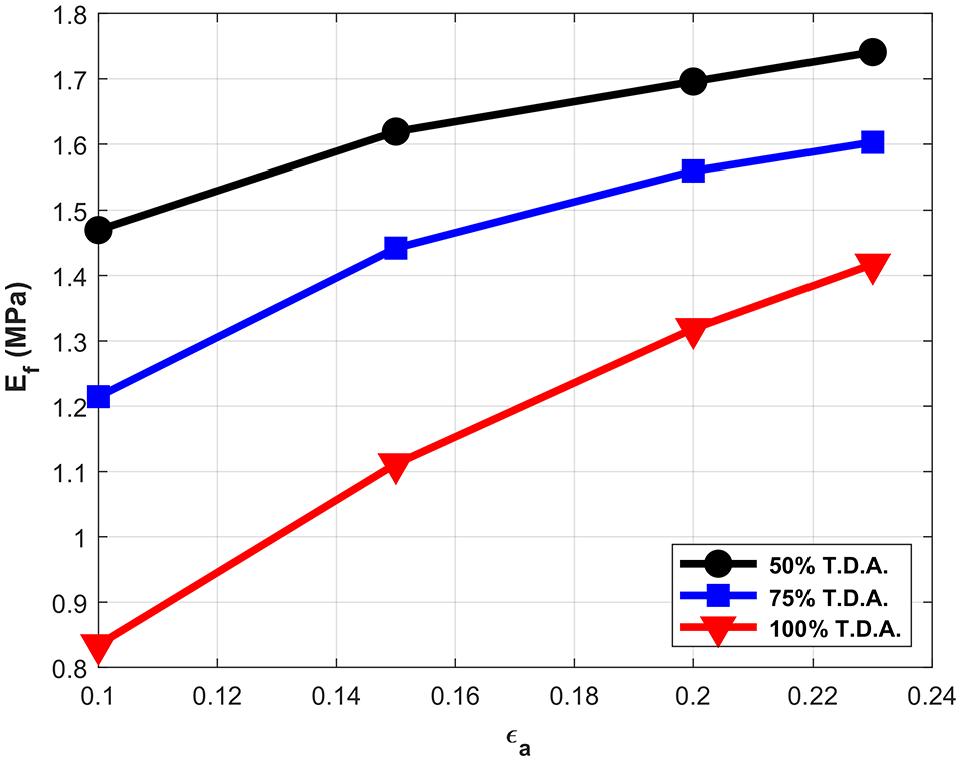
Secant elastic modulus versus axial strain at failure for
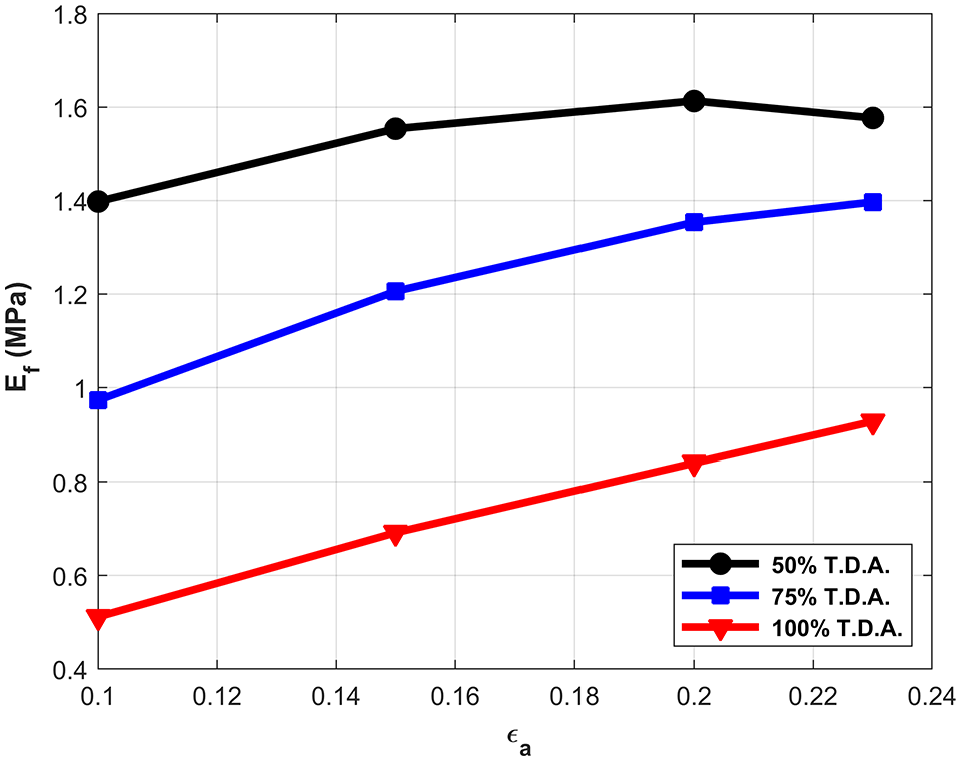
Secant elastic modulus versus axial strain at failure for
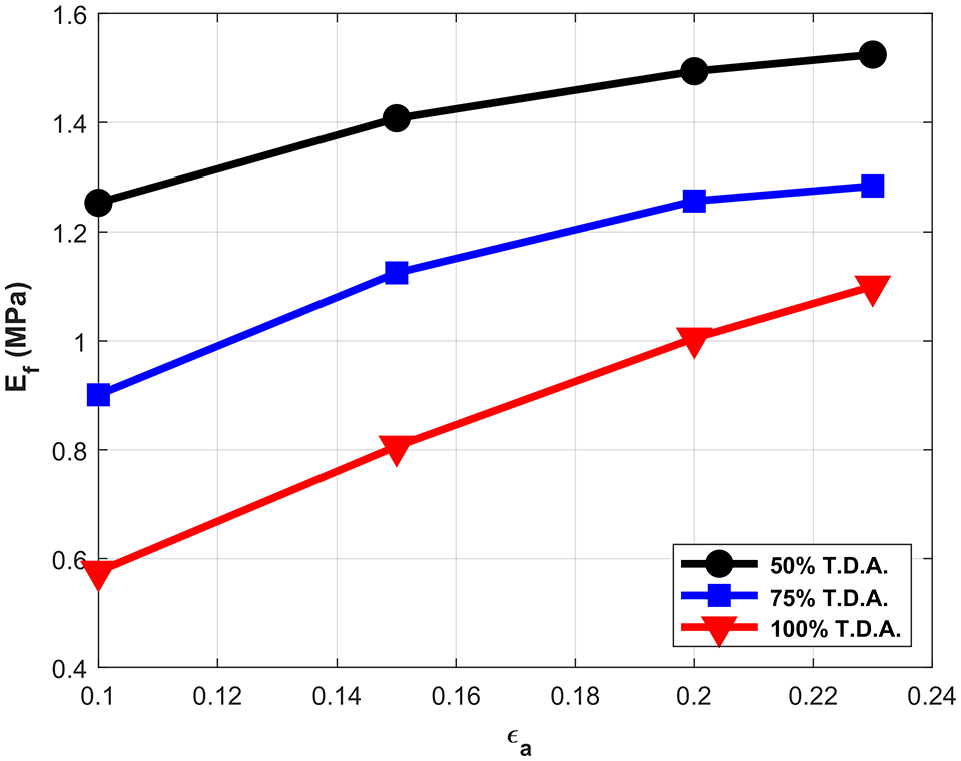
Secant elastic modulus versus axial strain at failure for
It is clear from the previous experimental results that the TDA volumetric ratio plays an important role as far as the behavior of the mixture is concerned. A constitutive equation is therefore needed that accounts for this. Consequently, the next section of this paper is devoted to the development of a simple framework capable of describing, interpreting, and anticipating the sand-TDA mixture response to loading.
A Critical State Model to Interpret TDA-Sand Mixtures
As a preliminary attempt in understanding TDA-sand mixtures, it is tacitly assumed that such mixtures are quasi-single phased. This means that deformation causes no change, or negligible change, in the phase ratio per unit volume. In this particular case, it refers to the sand-TDA phase ratio, implying that the TDA does not flow out of the sand matrix. Consequently, the term effective stress shall be indiscriminately used from hereon.
The fundamental concept of a unique failure surface is adopted in the present approach. Moreover, the terms failure and critical state are taken as synonymous. From hereon, the failure line will be referred to the critical state line (CSL) (
19
). The yield surface is an ellipse whose equation in

and is a function of the TDA volumetric content through the friction constant M. The other variables
The Mohr–Coulomb failure criterion is written in relation to the previously mentioned stress invariants as

where

where the critical state friction angle

The equation for the CSL in

where

where
To calculate the elastic response, the elastic modulus

And, since

Consequently, the elastic shear modulus, G, is also estimated as

Equations 7 and 8 indicate a non-linear elastic behavior because both are functionally dependent on the mean effective stress. Consequently, calculations must be carried out incrementally.
The total volumetric strain is the sum of the elastic and plastic volumetric strain and is written as

where the superscripts e and p indicate the elastic and plastic components. If the soil yields at a void ratio of
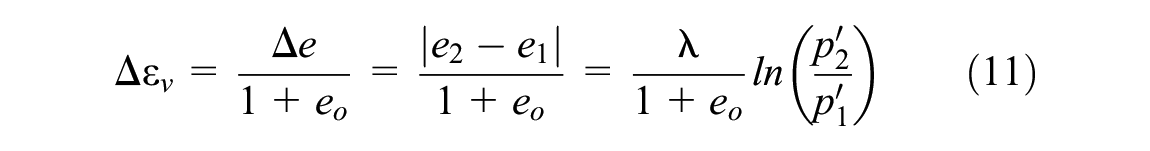
where

or via

by considering the unloading/reloading line associated with the maximum mean effective stress for the yield surface on which unloading initiates. The change in volumetric plastic strain is now calculated as

The shear strains are calculated from the representation of the yield surface. Furthermore, for the purposes of the present study, these strains are calculated by assuming that the plastic potential function and the yield function are the same. In other words, a normality condition is assumed. The resulting plastic deformation produces a volumetric and a deviatoric plastic strain component. The volumetric plastic deformation was given in (14), the deviatoric component of the volumetric plastic strain is obtained as

by considering the normal to the yield surface. Finally, the elastic deviatoric strains are obtained with

All the above strains (Equations 10–16) must be used in incremental calculations, because they are only valid for small changes in stress.
Calculation Procedure for the Stress-Strain Response of the Sand-TDA Mixture
From the equations of the last section, it is possible to determine the stress-strain response and the volume changes from the initial stress state. The required parameters are
The procedure used in this study to simulate the stress-strain response of the present triaxial tests results is as follows: (a) determine the TDA volumetric content
This procedure was coded and carried out numerically with the MATLAB software ( 7 ).
Comparison of the Critical State Model with the Triaxial Test Results
The TDA-sand mixture parameters
In general, for soils
As previously mentioned, in this study the failure state is synonymous with the critical state. Moreover, it is reiterated that establishment of the failure state of a sand-TDA mixture depends on a chosen strain criterion (
17
,
23
). To determine a value for the critical state friction angle, four different values of the axial strain (
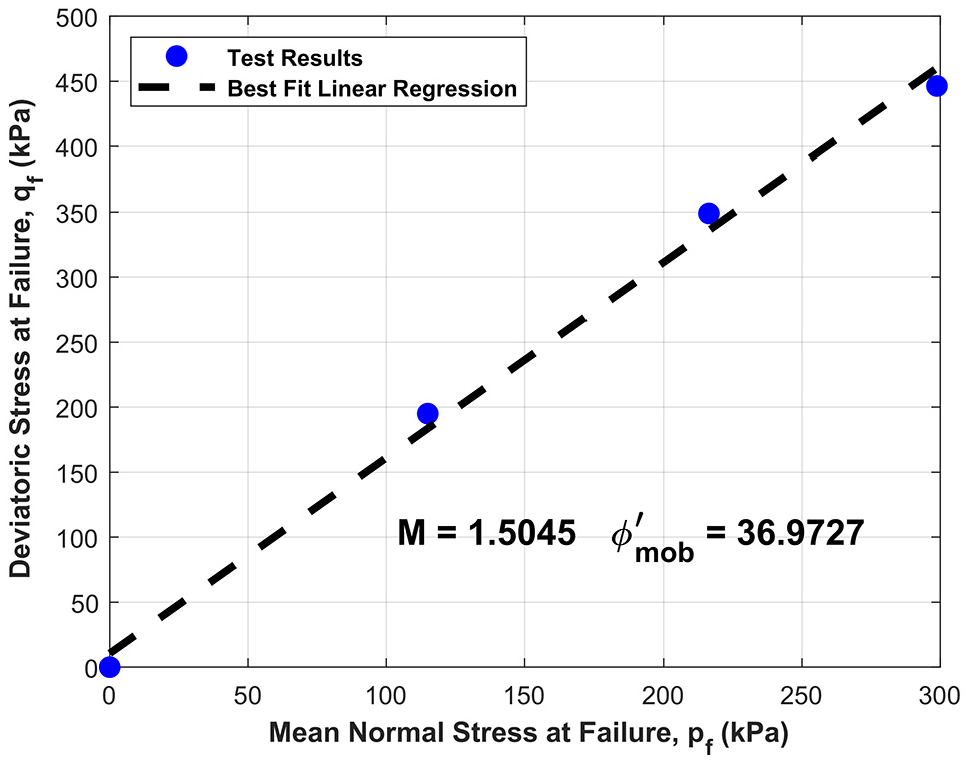
Determination of the frictional constant M at a tire derived aggregate (TDA) of 50% and
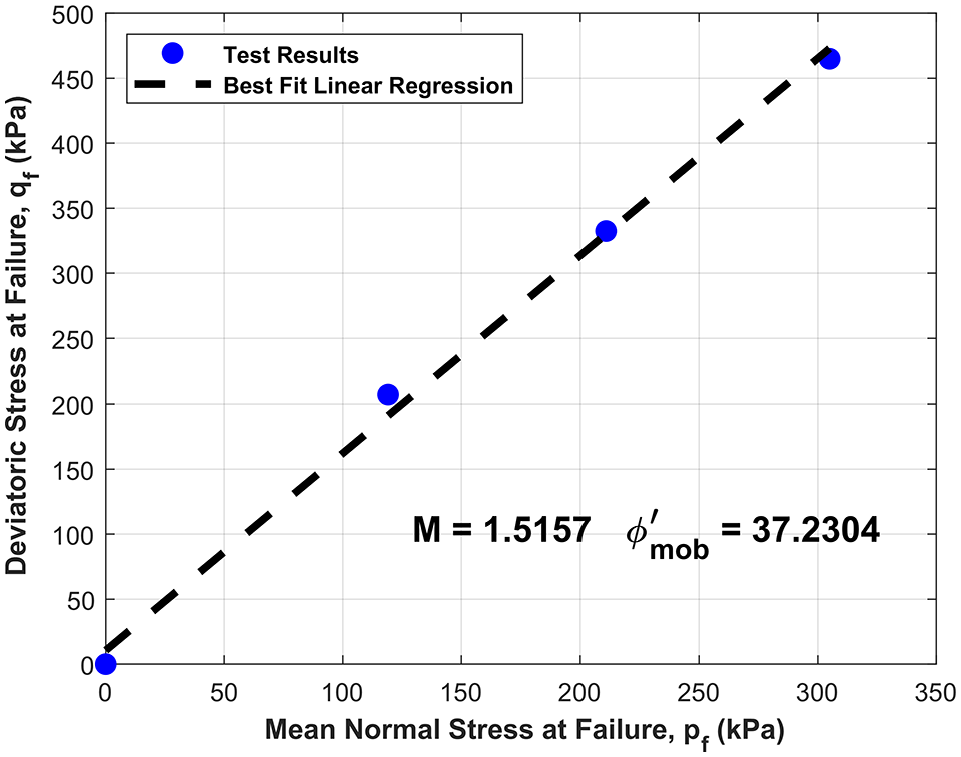
Determination of the frictional constant M at a tire derived aggregate (TDA) of 50% and
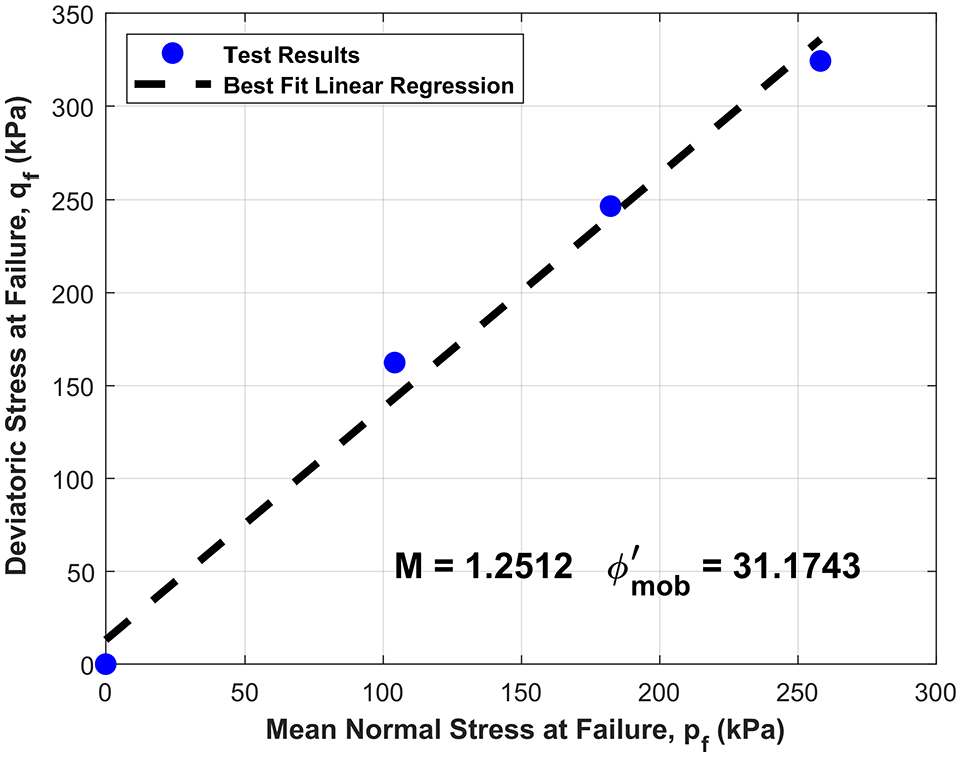
Determination of the frictional constant M at a tire derived aggregate (TDA) of 75% and
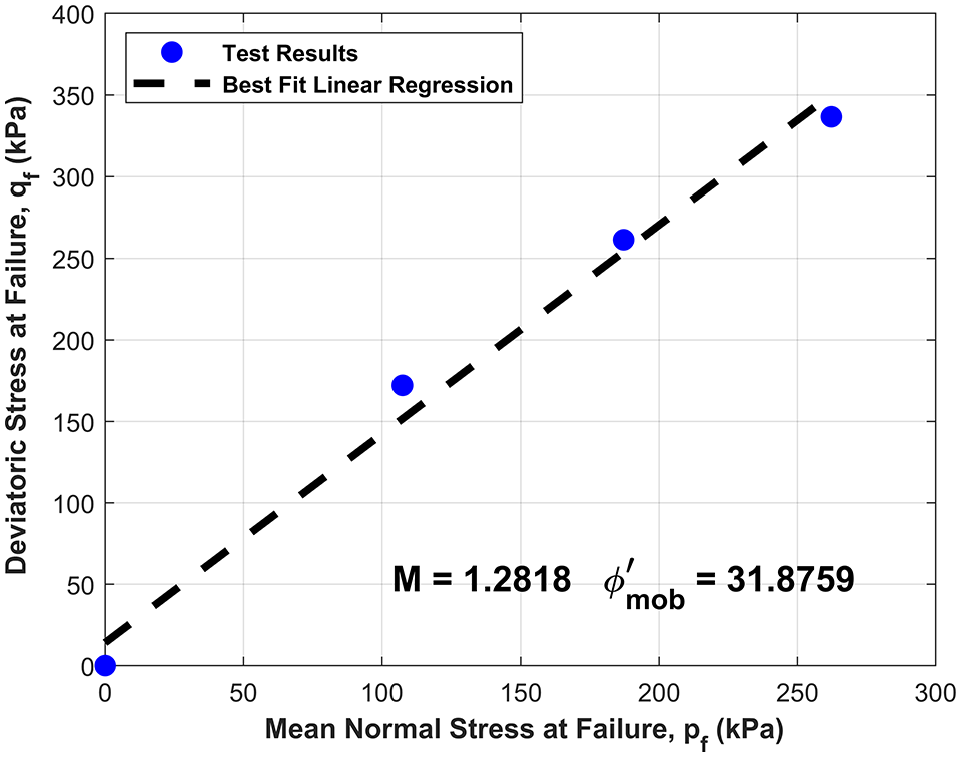
Determination of the frictional constant M at a tire derived aggregate (TDA) of 75% and
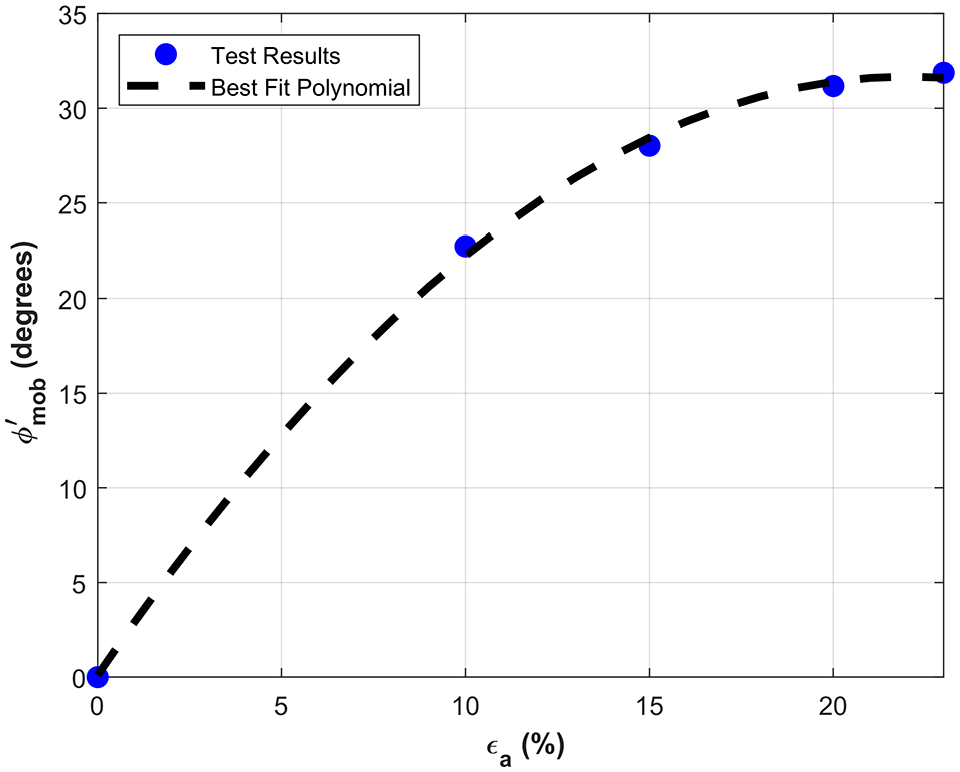
The critical state friction angle is determined from a plot of the mobilized friction angles versus the axial strains at which these mobilized values were obtained (Figures 18 and 19). As previously mentioned, the critical state was difficult to attain because of the excessive deformations achieved during the tests (Figure 6). The critical state friction angle is unique and generally obtained when the stress-strain curve attains a limiting value of the shear stress. Figures 18 and 19 show that a critical state friction angle is asymptotically approached at very high axial strains, where the value of the mobilized friction angles begin to level off. This leveling off of the mobilized friction angle depends on the TDA content. For a TDA volumetric ratio of
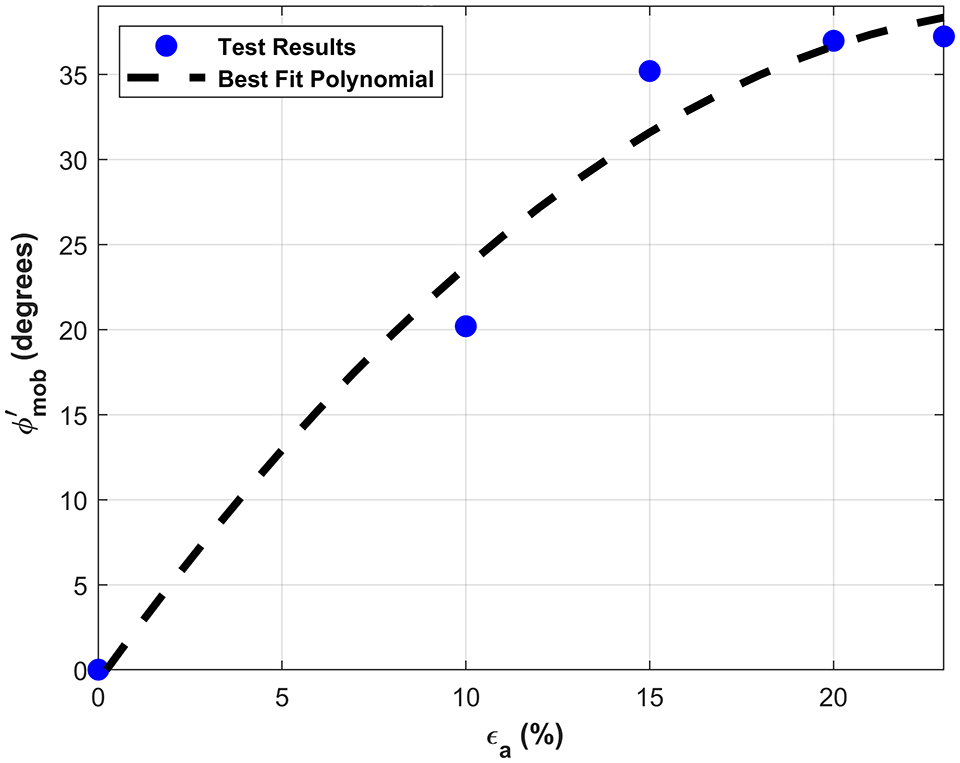
Mobilized friction angle versus axial strain at tire derived aggregate (TDA) = 50%.
Mobilized friction angle versus axial strain at tire derived aggregate (TDA) = 75%.
The MCC yield surface, as well as the CSL, for Ottawa sand and a typical Ottawa sand-TDA mixture at
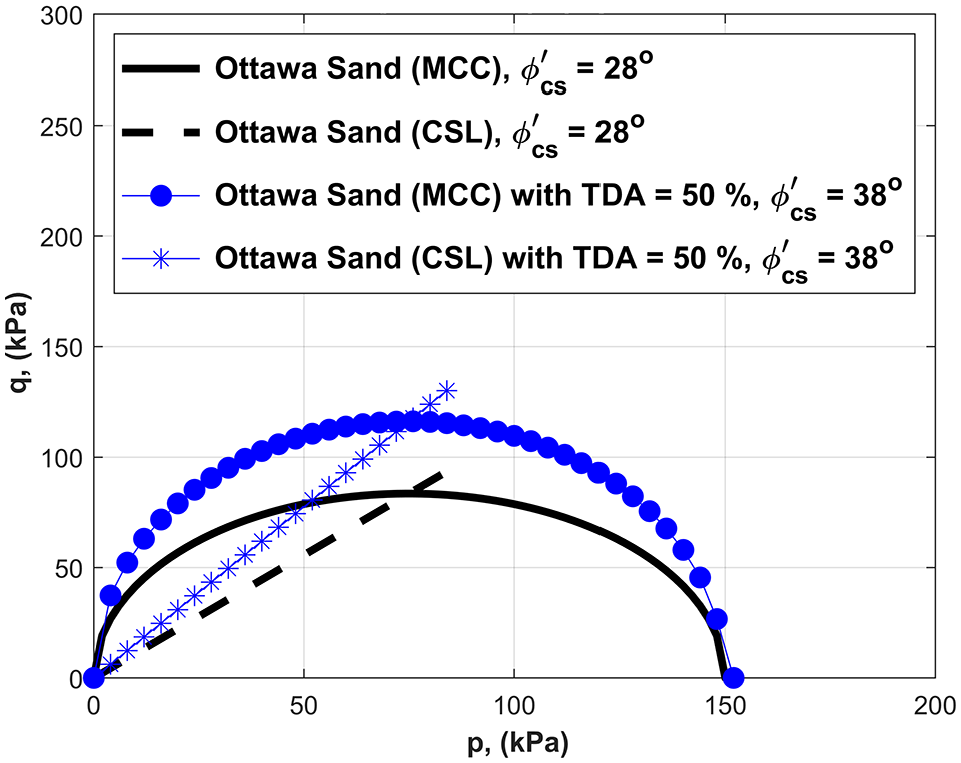
Modified Cam Clay (MCC) model in p-q space for Ottawa sand.
In all of the following simulations a sand-TDA sample is sheared at its current mean effective stress,
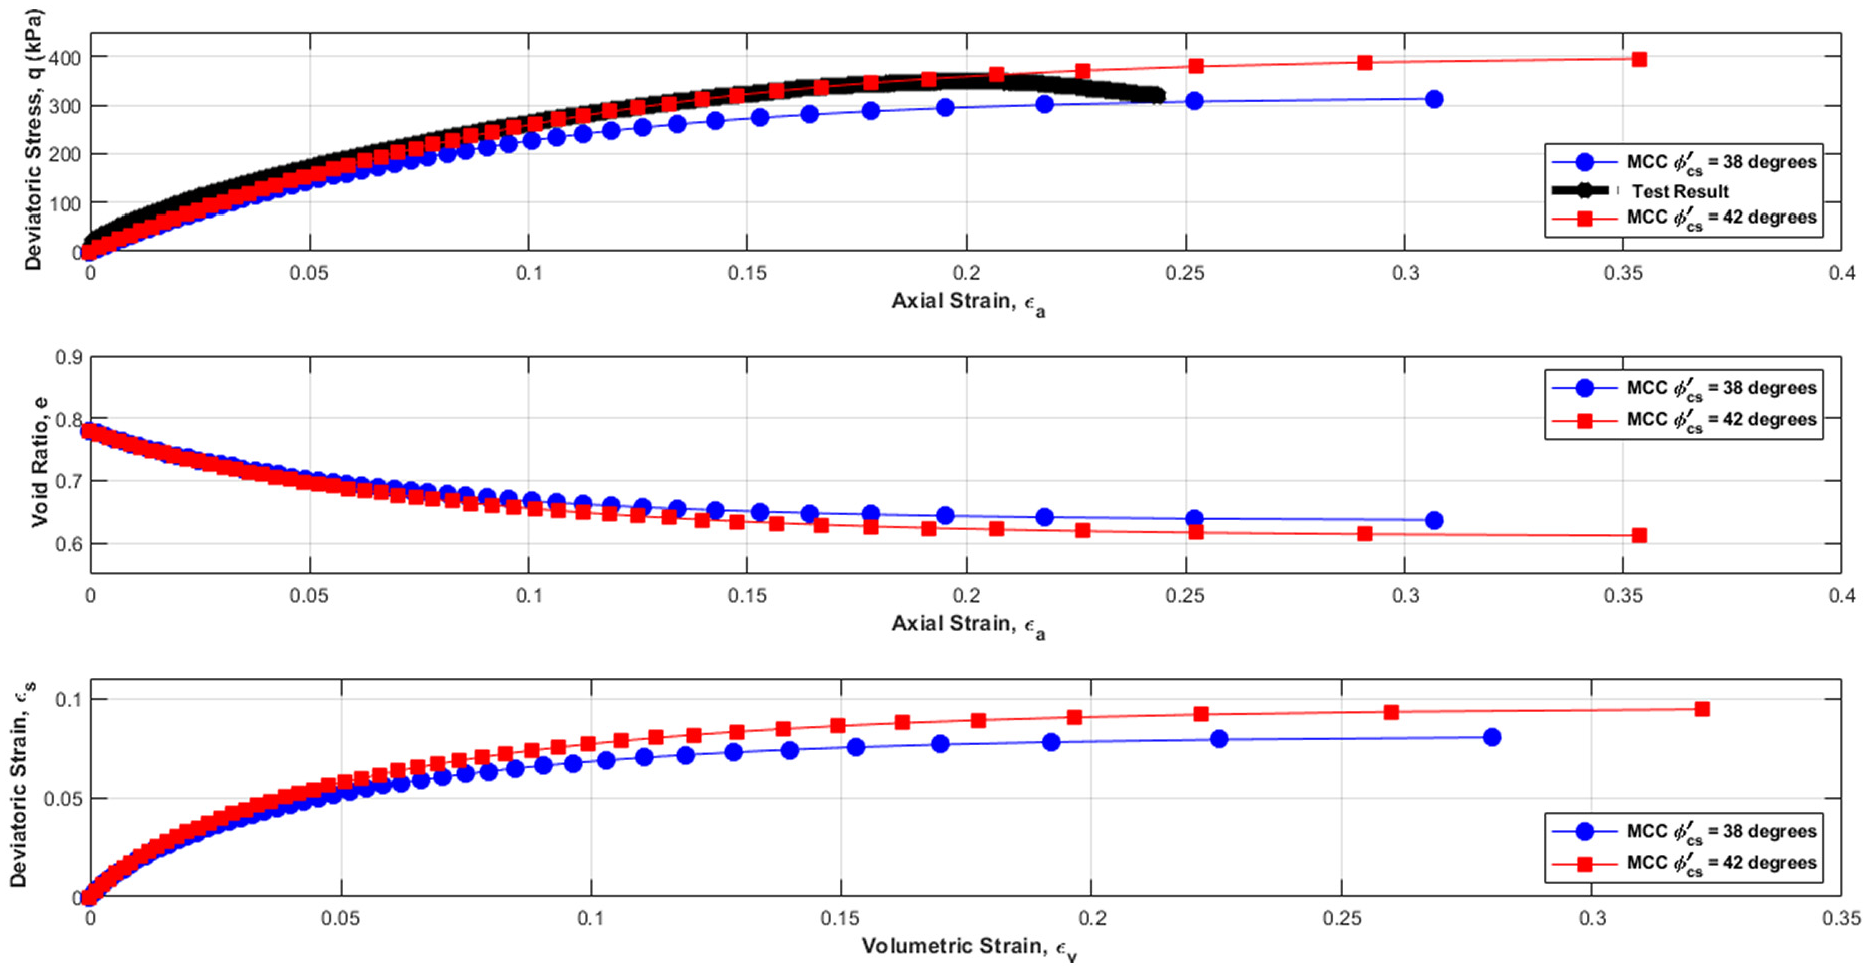
Deviatoric stress versus axial strain, void ratio versus axial strain, and deviatoric strain versus volumetric strain at 50% tire derived aggregate (TDA) and
Deviatoric stress versus axial strain, void ratio versus axial strain, and deviatoric strain versus volumetric strain at 50% tire derived aggregate (TDA) and
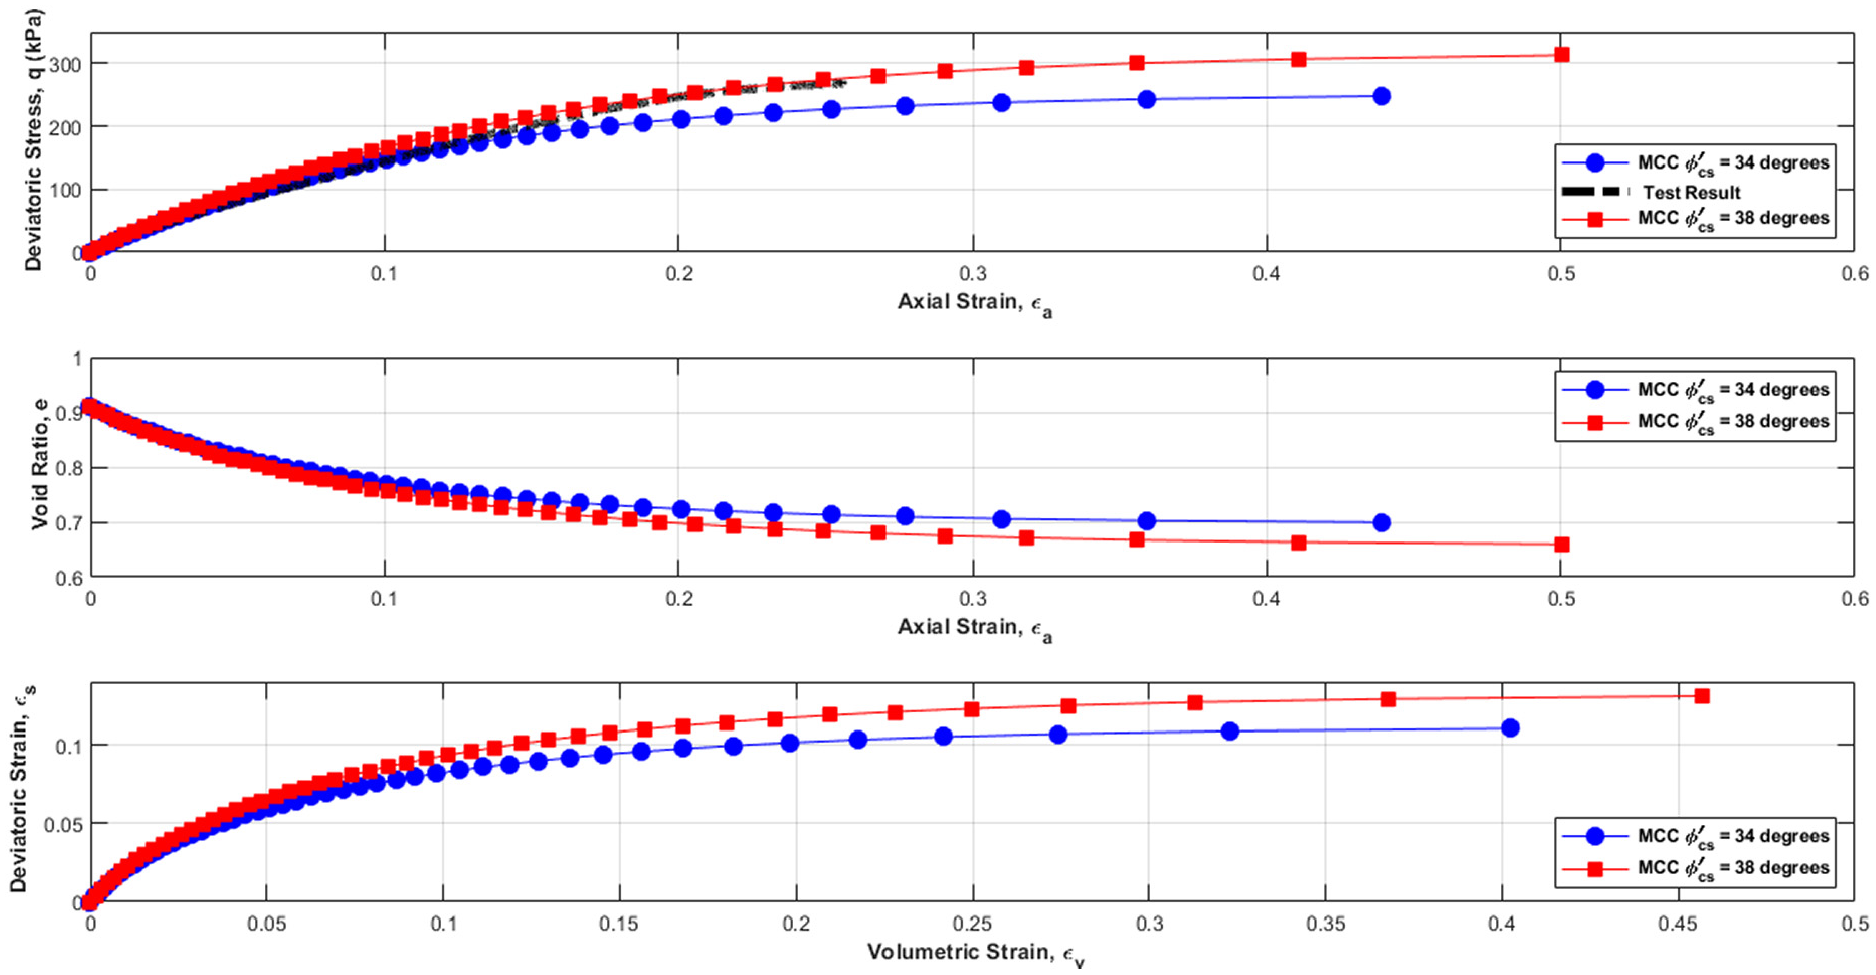
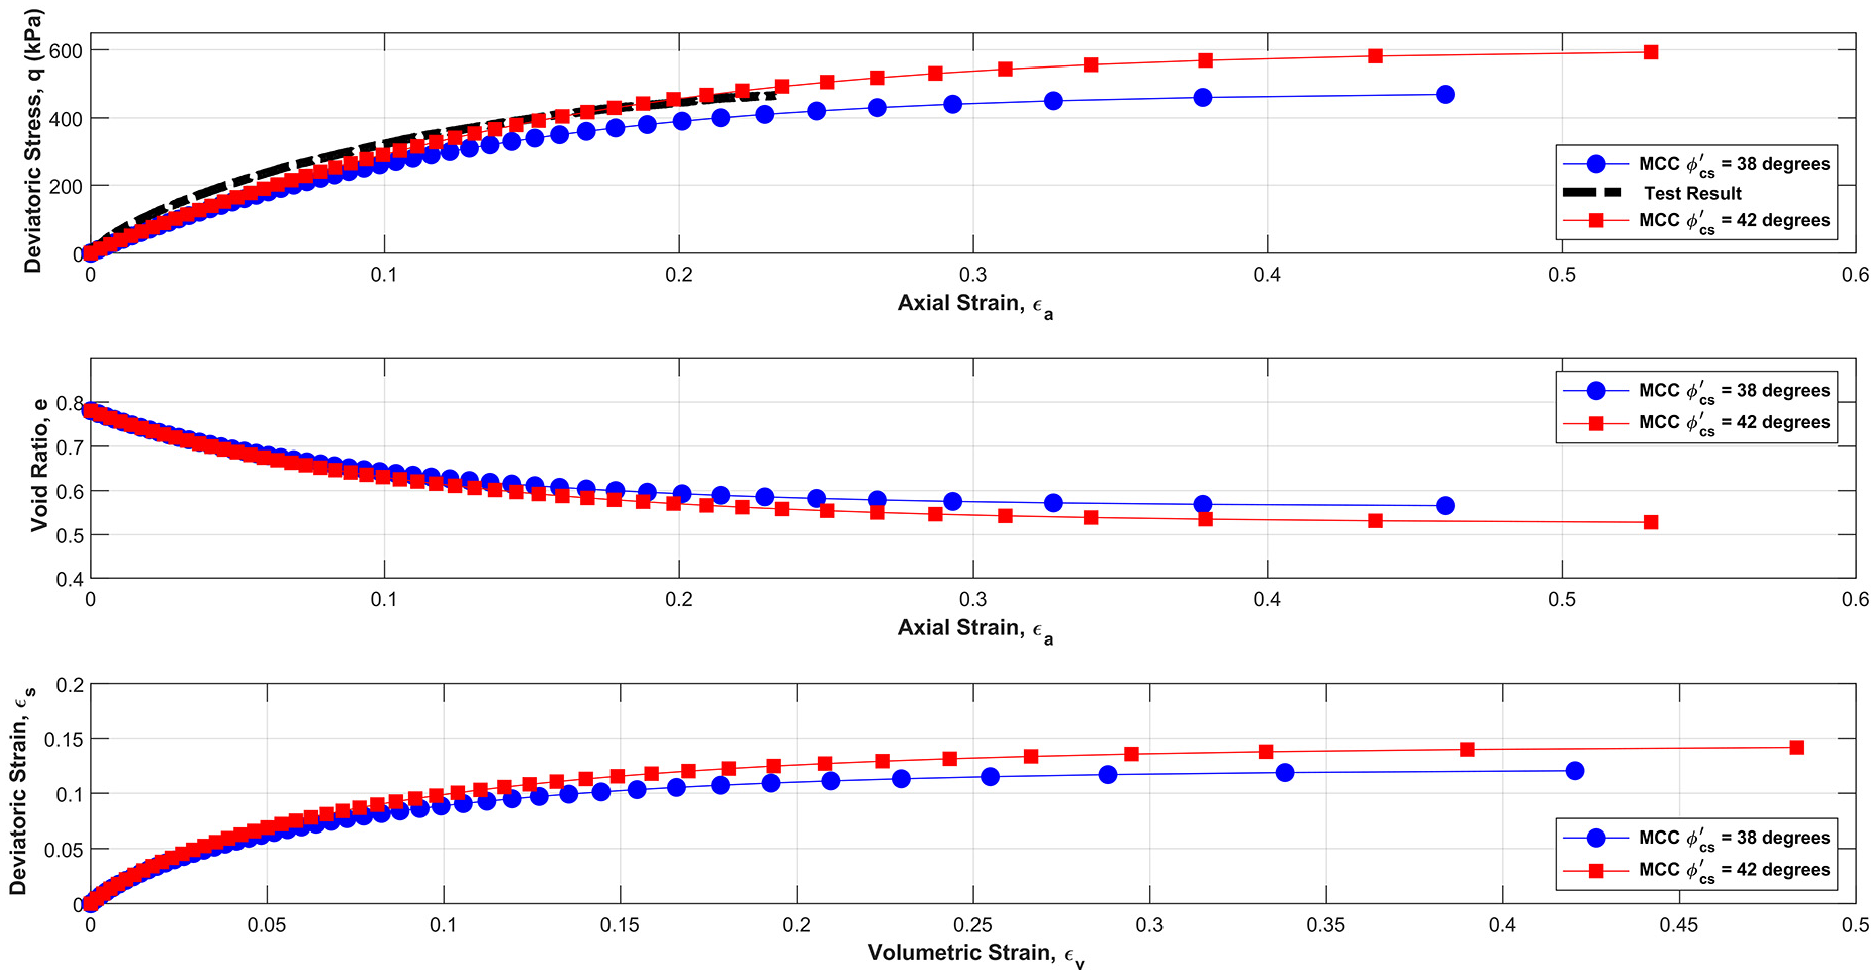
Deviatoric stress versus axial strain, void ratio versus axial strain, and deviatoric strain versus volumetric strain at 75% tire derived aggregate (TDA) and
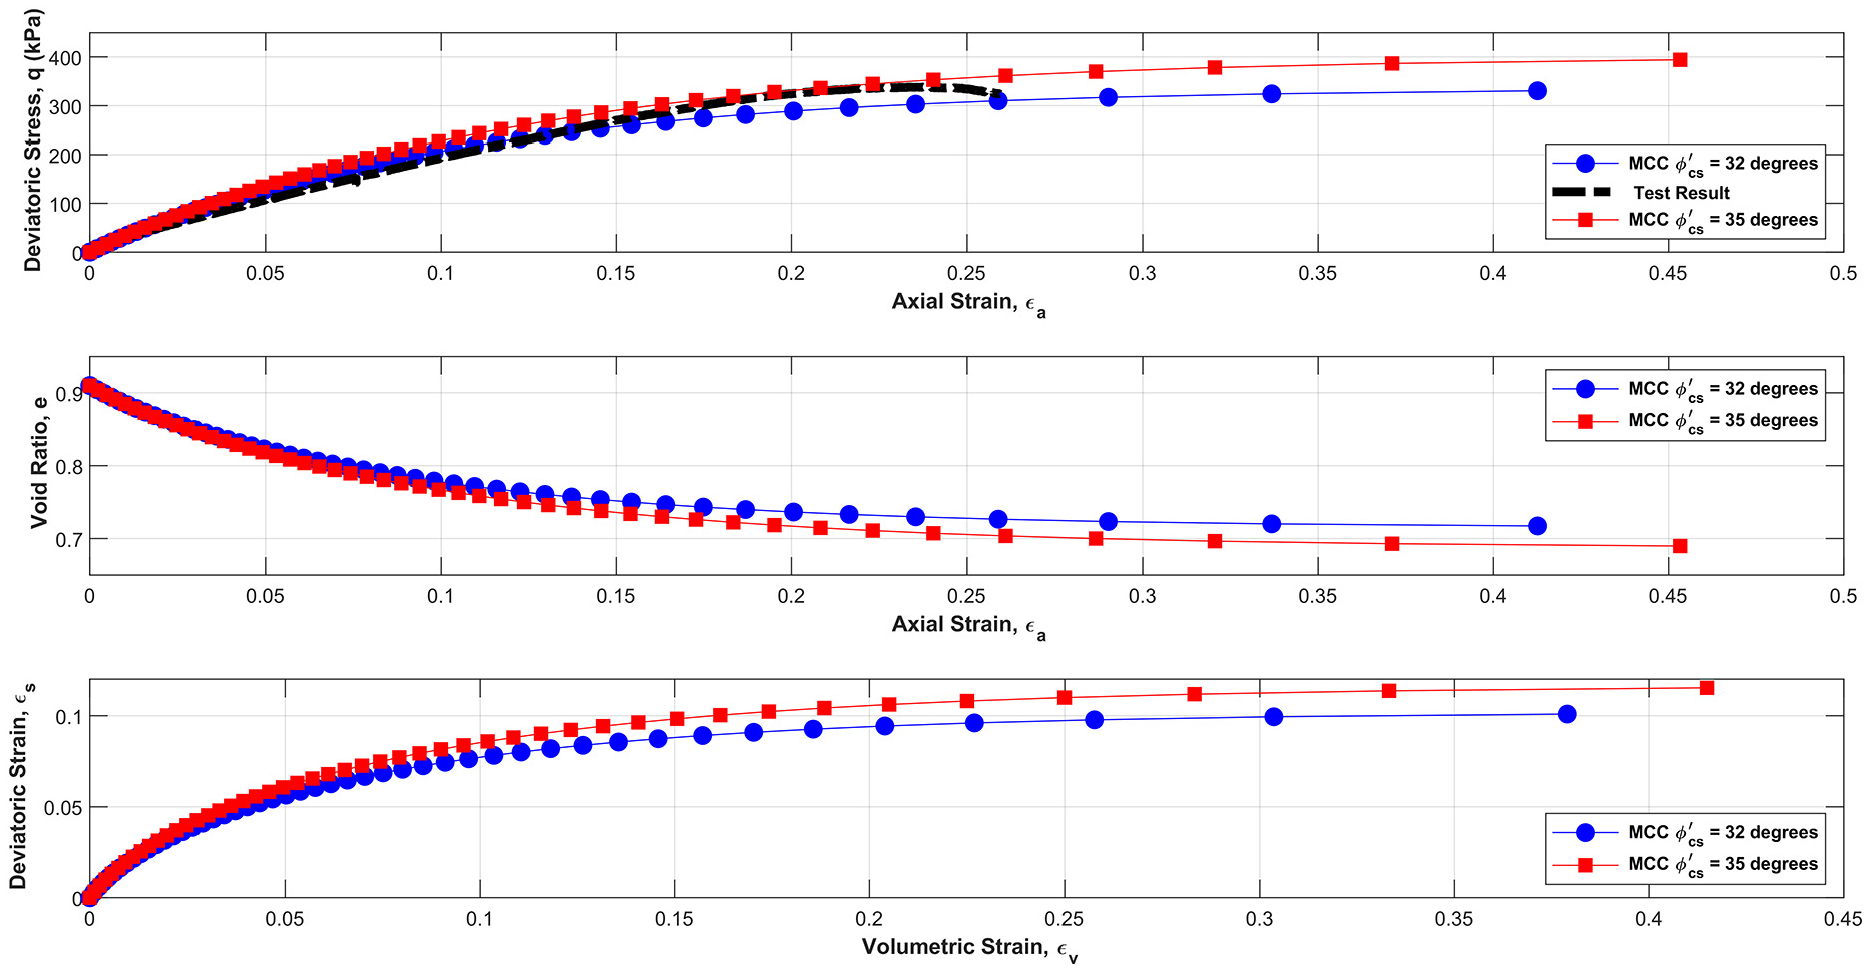
Deviatoric stress versus axial strain, void ratio versus axial strain, and deviatoric strain versus volumetric strain at 75% tire derived aggregate (TDA) and
Figures 21–24 depict, for each of the four tests, the calculated deviatoric stress versus axial strain, the void ratio versus axial strain, and the deviatoric strain vesus the volumetric strain in comparison with the test results. The initial yield surface expands and the stress-strain response is a curved path because the sand-TDA mixture behaves elastoplastically. As previously stated, the level of the shear strength is highly dependent on critical state friction angle which in turn depends on the TDA content. In all of these cases, the deviatoric stresses obtained in the tests are bracketed by the theoretical curves generated with the MCC.
In all simulations, the curves of the void ratio versus axial strain (Figures 21–24) show an overall compression of the specimen, the initial void ratio attenuating toward a critical void ratio. Again, this behavior conforms with that of loose granular materials ( 15 ). The resulting barrel-shaped specimen (Figure 6) at the end of the test is a manifestation of this type of behavior.
Finally, the curves of the deviatoric strain versus volumetric strain confirm that distortion increases with the volumetric strain, the curve assuming a non-linear shape with no peaks. In other words, no dilation is predicted by the MCC because all of the sand-TDA mixtures were in a loose state at the start of the test.
Overall, the critical state model is satisfactory if it is wished to predict the overall magnitude of the shear strength of initially loose sand-TDA mixtures. The model is highly dependent on the critical state friction angle,
Finally, triaxial tests on dense sand-TDA specimens are warranted because such samples will sustain higher stresses than loose samples. Moreover, it is expected that there will be a peak value of the deviatoric stress at low axial strains followed by a decrease with increasing strain, attaining a critical devatoric stress. The determination of the critical friction angle in such tests will be evident provided the critical state is attainable. Moreover, since it is well known in the literature that the MCC model performs less well when dilation is present, a new constitutive model capable of capturing this effect will be required ( 13 ).
Conclusions
Based on the triaxial test results obtained in this study, the following conclusions with regard to granular TDA arose. In general, TDA content reinforces a sand matrix when compared with the original sand. For loose sand-TDA mixtures, results show that, for a constant TDA volumetric ratio, the deviatoric stress increases with the confining stress. However, an increase in the TDA volumetric content tends to lower the shear strength of the sand-TDA mixture. A strain hardening behavior was confirmed by the stress-strain curves, and by the barrel shape of the specimen at the end of the test which occurred at an axial strain of approximately 23%. Consequently, the critical state is difficult to attain in such cases.
Test results also showed a reduction in the stiffness of the sand-TDA mixtures as the TDA content increased. In particular, the secant moduli decreased with an increase in TDA and a decrease of the confining pressure.
It is clear from the previous experimental results that the TDA volumetric ratio plays an important role as far as the behavior of a mixture is concerned. A constitutive equation based on a critical state model—MCC—is satisfactory in predicting the level of the shear strength offered by a sand-TDA mixture. The calculated deviatoric stress versus axial strain curves, obtained via the model, captured the non-linear elastoplastic response obtained in the tests. The level of the shear strength is highly dependent on critical state friction angle which in turn depends on the TDA content. In all of these cases, the deviatoric stresses obtained in the tests are bracketed by the theoretical curves generated with the MCC.
In all simulations, the curves of the void ratio versus axial strain show an overall compression of the specimen, the initial void ratio attenuating toward a critical void ratio. Again, this behavior conforms with that of loose granular materials.
Finally, the curves of the deviatoric strain versus volumetric strain confirm that distortion increases with the volumetric strain. The curves assume a non-linear shape with no peaks. In other words, no dilation is predicted by the MCC because all of the sand-TDA mixtures were in a loose state at the start of the test.
List of Symbols
Footnotes
Acknowledgements
The authors acknowledge and thank Shercom Industries Inc. in Saskatoon, Saskatchewan, Canada, for their provision of the TDA used in the laboratory tests. Finally the authors also acknowledge the technical support of Christian Juneault (Technicien en travaux d’enseignement et de recherche) of Département de génie civil et de génie des eaux, Laval University.
Author Contributions
The authors confirm contribution to the paper as follows: study conception and design: A. Foriero, N. Ghafari; data collection: N. Ghafari, A. Foriero; analysis and interpretation of results: A. Foriero, N. Ghafari; draft manuscript preparation: A. Foriero, N. Ghafari. All authors reviewed the results and approved the final version of the manuscript.
Declaration of Conflicting Interests
The author(s) declared no potential conflicts of interest with respect to the research, authorship, and/or publication of this article.
Funding
The author(s) received no financial support for the research, authorship, and/or publication of this article.