
Abstract
This paper presents the coupling of a state-of-the-art ride-pooling fleet simulation package with the mobiTopp travel demand modeling framework. The coupling of both models enables a detailed agent- and activity-based demand model, in which travelers have the option to use ride-pooling based on real-time offers of an optimized ride-pooling operation. On the one hand, this approach allows the application of detailed mode-choice models based on agent-level attributes coming from mobiTopp functionalities. On the other hand, existing state-of-the-art ride-pooling optimization can be applied to utilize the full potential of ride-pooling. The introduced interface allows mode choice based on real-time fleet information and thereby does not require multiple iterations per simulated day to achieve a balance of ride-pooling demand and supply. The introduced methodology is applied to a case study of an example model where in total approximately 70,000 trips are performed. Simulations with a simplified mode-choice model with varying fleet size (0–150 vehicles), fares, and further fleet operators’ settings show that (i) ride-pooling can be a very attractive alternative to existing modes and (ii) the fare model can affect the mode shifts to ride-pooling. Depending on the scenario, the mode share of ride-pooling is between 7.6% and 16.8% and the average distance-weighed occupancy of the ride-pooling fleet varies between 0.75 and 1.17.
The transportation sector is facing several challenges, especially in urban environments. Because of expected growth in general population and increased urbanization, offering a comparable level of mobility is likely to require reshaping urban mobility. Space, whether it refers to crowding in public transport, a location to park a private vehicle, or the streets that these vehicles drive on, will be an even more scarce resource.
Private vehicles are often identified as one of the problems. High parking demand combined with low occupancy during trips result in a high space consumption of private vehicles. Ride-hailing services (e.g., uber, Lyft, Didi) offer similar mobility to users while removing the necessity to look for parking; however, empty mileage increases the required space on the streets and causes congestion (1, 2).
The before-mentioned companies also offer ride-pooling, that is, multiple customers with similar itineraries share the same vehicle for a part of their trip. With higher vehicle occupancy, the system could make up for the empty mileage and the required space per person could decrease below the level of private vehicles. Furthermore, emissions per person kilometer (pkm) would also drop compared with private vehicle usage. Unfortunately, the ratio of pooled over non-pooled trips is rather small in the mentioned companies ( 2 ).
German regulation therefore considers different rules for ride-hailing and exclusive ride-pooling services. The effects of introducing exclusive ride-pooling systems are currently studied in small-scale pilots by public transport companies in the largest cities with limited fleet sizes (e.g., Berlkoenig in Berlin, ioki in Hamburg, Isartiger in Munich). Additionally, the private-sector company MOIA started operations in Hamburg and Hanover. In Hamburg, the company offers the biggest ride-pooling service for a city in Europe, having a fleet size of currently 330 vehicles. Up to 500 vehicles are allowed for the service by the regulating city administration.
Ride-pooling services have positive scaling effects: the larger the fleet sizes and demand for the service, the smaller the amount of empty travel and the larger the potential to pool trips. The overall effects of a ride-pooling service on the transportation system depend heavily on the modal shift. It can be expected that the outcome is quite different if all customers originate from the public transport sector or if private vehicle trips can be replaced.
Before ride-pooling systems will be permitted without fleet size limitations, simulations are necessary to predict the consequences. The status quo (with limited fleet size) needs to be captured by detailed demand and fleet control models to understand the current situation before large-scale and long-term effects are studied.
This study contributes to the research about ride-pooling by (1) combining two specialized software packages, one for demand modeling and one for the operation of a ride-pooling system, in a joint simulation that by design balances demand and supply of the ride-pooling service, and (2) testing sensitivities of fleet parameters like fleet size, pricing, and service model on travel behavior, modal shift, and traffic impacts. For this purpose, an example model of a small town (Leopoldshafen, Germany) is used.
Literature Review
Narayanan reviewed many relevant aspects for shared autonomous vehicle services ( 3 ). Many of the stated aspects are also valid for (non-autonomous) ridesourcing services with drivers, which can also be referred to as mobility-on-demand (MoD) services. This study focuses on demand modeling and fleet operation for such services.
Travel demand models are an essential tool to estimate the effects of measures and changes in transportation systems ( 4 ). Beginning with classical four-step models, travel demand was modeled very simply, targeting only the result of traffic while ignoring a lot of behavior-related effects (5, 6). The transition from result-based to reason-based modeling was enabled by disaggregation in travel demand, which is possible in various dimensions ( 6 ). First, individual persons can be modeled instead of groups or the whole population; these models are called agent-based ( 7 ). Second, the study area can be spatially disaggregated by using dedicated locations instead of traffic analysis zones. Third, the investigation period can be split into smaller chunks by using single hours or minutes instead of the whole day. While prior research focused on trip-based models, the findings of Kutter proved that travel demand is the amount of locomotion people do to execute activities ( 8 ). Those findings resulted in a broad spectrum of agent-based, activity-based, or both, combined travel demand models. In most of those models, the relationship between demand and supply focuses on private individualized traffic in relation to route choice. The main goal of these models is to capture the interrelation of increased travel times induced by congestion and travel demand. For the other modes, such as pedestrians, bicycles, and public transport, the capacity constraints seldom affect the solution, or network capacities have no direct effect on the travel time of all passengers. Therefore, a lot of assignment algorithms for macroscopic or microscopic models have been developed. Nevertheless, most of those traffic assignment models lack a direct feedback loop or integration into decisions other than route choice. This issue is addressed by agent-based models such as MATSim, SimMobility, POLARIS, and mobiTopp (9–16). They provide the potential to integrate demand directly into destination or mode choice decisions of single agents and thus allow a much closer integration of demand and supply.
On the supply side, the operation of MoD systems is studied as part of the class of vehicle routing problems ( 17 ). Different subclasses of vehicle routing problems have already been studied for more than 40 years ( 18 ). Because of a high degree of dynamism—that is, demand information is revealed to the operator over time—policies are unlikely to find an optimal solution (that could be achieved if all demand information was available). Rule-based and optimization-based strategies have been developed and evaluated in simulation frameworks that model the operation of a fleet with flexible routes (19–21). Several vehicle-request assignment policies for fleets of thousands of vehicles were compared for ride-hailing, for example, by Hörl et al. and Hyland and Mahmassani (22, 23). The problem of matching various requests into tours for vehicles is computationally far more challenging. Key contributions for scaling optimization-based solution approaches were made by Santi et al. and Alonso-Mora et al., and computationally further improved in Liu and Sumaranayake, and Engelhardt et al. (24–27). The developed advanced control policies for ride-pooling can generate substantial benefits over simpler heuristics; numerical experiments conducted in Engelhardt et al. and Ruch et al. quantify these benefits (28, 29). Moreover, the amount of possible matches depends on the offered service parameters, that is, reservation time, waiting time, and detour time (30, 31). The papers mentioned in this paragraph typically assume exogenous demand and aim to serve this given demand as efficiently as possible.
There are several approaches that combine demand and MoD supply modeling. Typically, these are based on stochastic user equilibrium approaches, where travelers’ mode choices are adjusted day-to-day, where the adjustments are based on within-day simulations of the service ( 32 ). Djavadian and Chow extended their framework to model the impact of elastic supply, where drivers also adjust day-to-day in a two-sided platform ( 33 ). Liu et al. integrate a heuristic ride-hailing control algorithm into an activity- and agent-based MATSim simulation model, in which travelers make plans before the simulation of a day and score their travel utility afterwards ( 34 ). A co-evolutionary process is used over multiple iterations to reach an equilibrium. This approach in MATSim was improved by Hörl et al. with a more advanced fleet control and a mode-choice model after iterations of daily network simulations ( 35 ). A similar approach is available in SimMobility, which models a transportation system in three timescales ( 36 ). Activity planning and mode choice—including the choice to use MoD systems—are determined pre-day and the MoD system is simulated in a stage called supply. Similarly to MATSim, these stages are iterated in a learning loop. Liu and Samaranayake extend this endogenous demand loop by an operator loop to find an optimal fleet composition of vehicles with passenger capacity of 1, 4, and 10 ( 26 ). The latest versions of commercial transportation software packages include mobility services in their demand models and contain fleet operation modules that work similarly to the described approaches (37, 38).
An idea to reduce the amount of required iterations or remove them completely utilizes mode choice models based on real-time information of various mobility options, for example, public transport, private vehicle, and MoD systems (39, 40). Dandl et al. use a rather simple demand model, whereas Wilkes et al. employ rather simple ride-pooling control algorithms (39, 40). The goal of this work is to combine the very detailed travel demand modeling framework mobiTopp with the fleet simulation and ride-pooling control algorithms from Engelhardt et al., where ride-pooling demand and supply are regulated by the availability of real-time information ( 27 ).
Approach
The main idea behind the developed approach is the joint simulation of ride-pooling demand and supply in one simulation layer without iterations. mobiTopp applies destination and mode choice models, and simultaneously the fleet simulation mimics the operation of the ride-pooling service to guarantee realistic ride-pooling choice alternatives.
Being implemented in different programming languages, both frameworks are not integrated into each other but coupled at various points during simulation. First, the input data is fed into both frameworks at the start. As shown in Figure 1, structural data, such as demography of the inhabitants and the attractiveness of different parts of the study area, is used by mobiTopp to generate the population and to feed further choice models. The transportation network data is used by both frameworks. Second, the exchange of dynamic data during the simulation takes place during mode choice where mobiTopp uses static information for all modes except ride-pooling. For ride-pooling, it requests dynamic information of the fleet simulation, that is, the ride-pooling operator makes an offer based on the current fleet state. Therefore, the demand to the ride-pooling system is inherently limited by the fleet, as no new offers can be made when the fleet operates at full capacity. Third, control commands are transferred at various points during the simulation to synchronize both frameworks with each other.
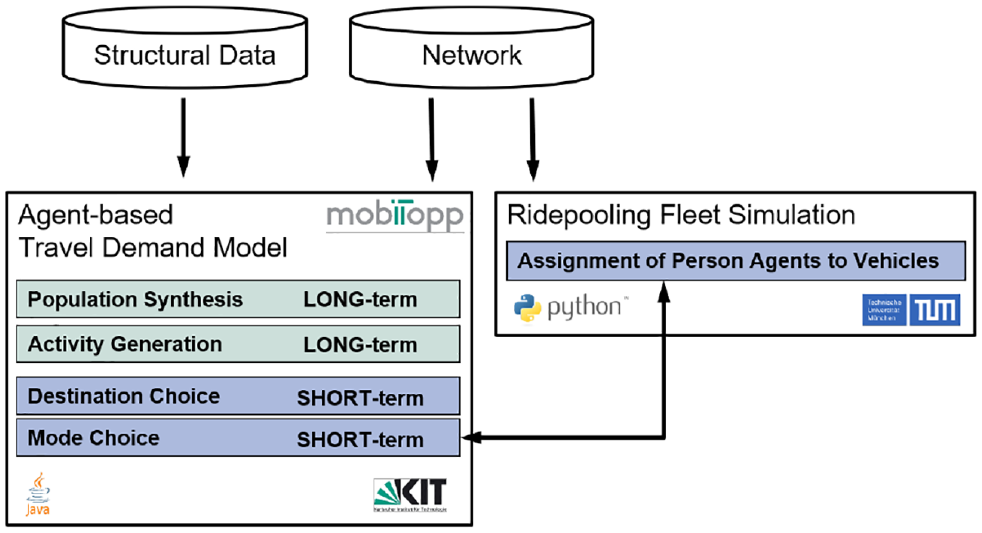
General overview of the simulation environment.
All together, in contrast to other modeling methods, it is not necessary to run many simulation runs (iterations) with the selected approach. This is because the mode choice is undertaken based on live parameter values combined with discrete choice models, and, consequently, a self-regulating demand-supply balance for the ride-pooling service is created. In the following, each part of the coupling is explained in more detail.
mobiTopp
mobiTopp is an agent-based travel demand modeling framework that models every person, household, and car of the study area (15, 16). It is written in Java. The population of the study area is modeled as agents following the definition of Bonabeau ( 7 ). Agents are “autonomous decision-making entities,” which “individually assess their situation and make decisions on the basis of a set of rules.” Moreover, mobiTopp is based on the concept of “simulating activity chains” ( 41 ). Activity programs in mobiTopp are modeled for a whole week either by gathered programs from representative empirical data or by programs generated synthetically ( 42 ). While agents carry out their activity programs, they decide where an activity will take place and which mode to use. The modular nature of mobiTopp allows to switch between different models for destination and mode choice. Current implementations are based on discrete choice models, namely logit and nested logit models ( 43 ). These implementations take into account sociodemographic attributes of agents and households as well as network characteristics such as travel time and cost. To distinguish between different times of the day, travel times can be modeled on an hourly basis. Route choice is currently only available for public transport ( 44 ). For other modes, external tools such as Visum and MATSim can be used ( 45 ).
mobiTopp consists of two stages: initialization (long-term module) and simulation (short-term module). For initialization, the long-term mobility aspects of agents and households are defined. This includes population synthesis, generating all agents and households based on structural and empirical data. Also, locations for fixed activities (home, work, and education), the activity programs, the ownership of private cars and public transport passes, and the membership at various mobility providers are modeled for each agent. These long-term decisions form the foundation for the simulation of travel demand in the short-term module. While all agents are simulated simultaneously during this stage, the short-term module applies the destination and mode choice models sequentially for each trip of an agent. The destination choice differentiates between two types of destinations: activities at fixed locations (work, education, and home) and at flexible locations (e.g., leisure and shopping). Fixed locations are determined in the long-term module and are therefore kept fixed during the short-term module, while flexible locations are undefined after the long-term module and have to be selected in the short-term module. The destination choice itself is separated into two parts. First, the discrete choice model selects a traffic analysis zone where the activity can be carried out. Second, a distinct location inside the traffic analysis zone is selected. mobiTopp by default supports fives modes: walking, cycling, public transport, car as driver, and car as passenger. One of those modes is selected using a discrete-choice model considering the travel time and cost as well as the current situation of the person in the household ( 15 ). In particular, a car can only be selected if the household owns one and it is not currently used by another member of the household. mobiTopp’s modular nature allows to replace destination and mode choice models depending on the study area.
Because of its modular and open-source fashion, mobiTopp has been extended several times. First, by introducing electric and hybrid vehicles into a model of the region of Stuttgart, which allows to replace all vehicles either private or shared to be powered by electric or combustion engines (46, 47). Further on, sharing systems for cars have been introduced allowing inhabitants to use cars other than their own ( 48 ). With the detailed modeling of car passenger trips, pooling of car trips in the context of the same household has been introduced ( 49 ). Combining both methodologies allows a microscopic model of on-demand mobility systems as described by Wilkes et al. ( 40 ).
For the present study, mobiTopp was extended in several aspects, partially building on the work presented by Wilkes et al. ( 40 ). First of all, a new transport mode is added to be capable of identifying trips performed by the ride-pooling mode. Next, modifications to the handling of these trips were required. This is because the regular transport modes in mobiTopp use static travel time and cost matrices and the values required for mode choice parameters thus can be based on a query to these matrices. For the present work, however, methods for dealing with dynamic time and cost values are required. Furthermore, to handle the requests and responses, and to provide interfaces to communicate with the fleet simulation, modifications were needed.
Interface
The communication between mobiTopp and the fleet simulation framework is triggered at various points during the simulation. At the beginning, mobiTopp verifies that the fleet simulation framework is set up and the socket communication is ready. During the simulation, there are event- and time-triggered communications between mobiTopp and the fleet simulation as illustrated in Figure 2.
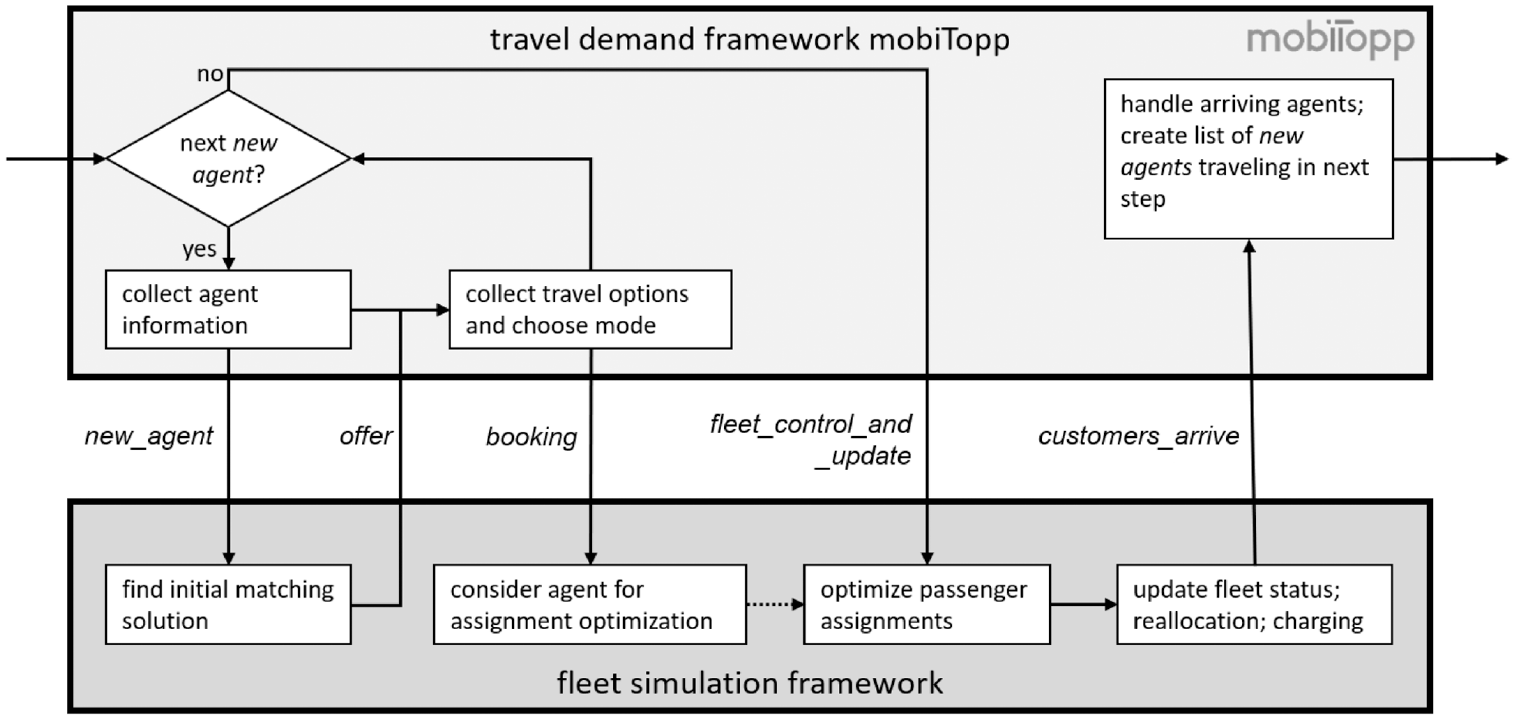
Communication between the mobiTopp and fleet simulation framework.
Each time an agent is about to perform a mode choice, mobiTopp sends a request to the fleet simulation. This request contains information on the origin and destination of the agent. The fleet simulation’s response contains information about the required travel time (split in access, waiting, riding, and egress time) and costs offered by the provider. This information is evaluated by mobiTopp and the mode choice is performed, considering all available modes for the upcoming trip. In case the agent’s decision is to use ride-pooling, a binding booking is communicated to the fleet operator.
Further communication takes place after each simulation time step. mobiTopp communicates to the fleet simulation that a time step has finished and the next is about to start. Then, the fleet simulation optimizes the current fleet assignments. After that, the vehicles of the fleet move according to the current assignments and customers board and disembark the vehicles in the fleet update step. As a result of this step, the list of agents, which are about to arrive in the following time step, is sent to mobiTopp.
Because of the separation of booking requests and optimizing all requests, the fleet simulation is able to respond to various requests with realistic, utilization-dependent offers, and optimize them in conjunction. This two-stage approach enables mobiTopp and the fleet simulation to balance ride-pooling demand and supply in a single run.
Fleet Simulation
The fleet simulation module is implemented in Python and represents an additional travel mode accessible for each agent within mobiTopp. The task of the module is to simulate the detailed interaction between agents using ride-pooling for a certain trip and a ride-pooling fleet operator offering the service. A travel request is defined by a request ID
Within this framework, a routing task
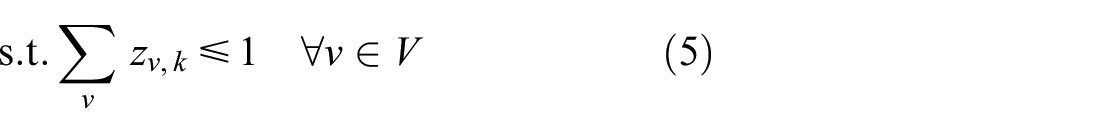
The following policy is applied to compute routing tasks for vehicles: First, routing tasks have to fulfill a maximum waiting time constraint for each agent that should be picked up on the route, that is, the duration between each agent’s request and pick-up is smaller than or equal to
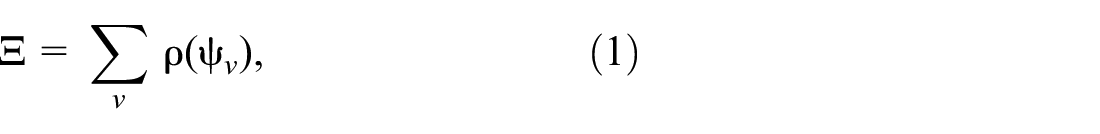
with the objective function value of a single vehicle routing task
In this study, an objective function is implemented, which rewards serving as many requests as possible while minimizing the overall service time of fleet vehicles:

At each simulation time step, a new set of agents sequentially queries offers from the ride-pooling fleet simulation module. Not all of these agents will later choose the ride-pooling service as their travel mode. A naive approach to deal with this issue could be to calculate new vehicle assignments, for example, by using the algorithm described in Engelhardt et al., for the whole request batch ( 27 ). After that, the operator creates offers for the agents based on the the new assignment solution and re-calculates the assignments once all agents confirmed or declined the booking of an offer. However, if the batch size is large and only few of these agents will later choose the ride-pooling service, a mutual optimization might block capacity of the ride-pooling fleet preventing the optimization algorithm from finding offers for some agent requests. The employed strategy to circumvent this blocking of capacity is to deal with new requests sequentially: for one request after another a new assignment solution is computed while the old solution is kept in memory. Based on the new solution, an offer is created. In line with the mobiTopp process flow, the agent’s mode choice function is called directly after. If the agent chooses ride-pooling as its travel mode, the assignment solution is updated, otherwise the assignment solution is reset to the old one and the request is removed from the solution space.
Re-running a computationally complex and time-consuming global optimization algorithm for each new request is not tractable. To deal with the computational complexity, the following two-stage approach is introduced: in a first stage, a local optimization solution is calculated with a fast insertion heuristic for each new request. An offer is created based on the solution of this heuristic. Once all agents executed their mode choice decisions and ride-pooling customers are fixed, a global optimization is executed to improve the decisions for assigned routing tasks. As long as the batch size of new ride-pooling customers is small, the insertion heuristic builds on the solution of the global optimization from the last optimization time step. Therefore, close to optimal results can be expected. Both stages are described in the following, starting with the insertion heuristic.
Let

resulting in a local optimization of the global objective function from Equation 1. The mode choice parameters access, waiting, riding, and egress time, as well as the fare, are extracted from this new assigned routing task and the mode choice is called after providing these parameters to mobiTopp. If the agent decides for ride-pooling, the routing solution
While this procedure provides fast and tractable solutions for the mode choice interaction with mobiTopp, optimal assignments for routing tasks of vehicles cannot be expected. Therefore, once all request interactions are processed, a global optimization algorithm is called to improve the current assignment solution. The algorithm applied is based on the algorithm proposed by Alonso-Mora et al. ( 25 ). The concept of the algorithm is described in the subsequent paragraphs. A detailed description of the applied algorithm is out of the scope of this paper and the reader is referred to Engelhardt et al. for additional information ( 27 ).
The idea of the algorithm is to divide the ride-pooling assignment problem into easier-to-tackle sub-problems. In a first step, all feasible routing tasks any vehicle is able to take to serve an arbitrary set of requests, which is denoted by request bundle, is determined. This step is followed by an optimization step where an integer linear problem (ILP) is solved to assign the best routing tasks to vehicles. If both steps are computed until termination, the optimal solution for the static assignment problem can be found. Nevertheless, a naive exhaustive search approach for calculating all feasible routing tasks in most cases is not tractable because the search space increases exponentially with the system size.
Therefore, the applied algorithm directly exploits the time constraints
First, any routing task for vehicle
Second, any routing task for an arbitrary vehicle for serving request
Third, the resulting feasible routing tasks are created within a certain order. Therefore, let a vehicle-to-request-bundle (V2RB)
Combining all three rules, a guided search can be applied by creating all feasible V2RBs iteratively starting from grade 1 until no more can be found.
After computing all feasible V2RBs, each V2RB is rated by the minimum objective function value of all routing tasks included in this V2RB. This V2RB is also represented by this routing task. By defining
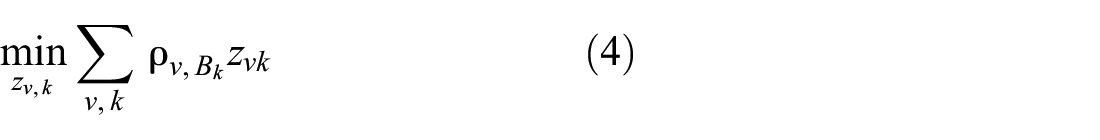

In Equation 4
In general, this algorithm finds the global optimum of the static ride-pooling assignment problem. Nevertheless, to overcome peaks in computational time, a time limit of 5 s is employed for building feasible V2RBs for each vehicle. Additionally, a time limit of 30 s is applied for solving the ILP. These time limits are triggered only on rare occasions during the simulations and evaluations, showing that the solution deteriorates only marginally.
Simulation Results
Case Study Description
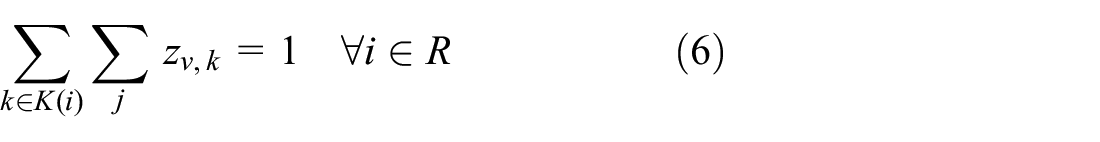
The simulation framework is applied to a mobiTopp example project, the Eggenstein-Leopoldshafen case. It contains the small city of Eggenstein-Leopoldshafen (Germany). The model spreads over a total area of 12.4 km 2 , and includes areas with residential and industrial land use. Concerning transport infrastructure, it includes different road categories up to federal highway, as well as urban rail lines. Figure 3 shows the transport network.
Area and transportation network used in this case study.
The case study area contains 20,639 inhabitants represented as person-agents. The modeled travel demand generated by the inhabitants contains 70,518 trips during the course of a day. Compared with other studies, a rather small number of trips is performed, which enables testing new modeling algorithms or modules and performing many simulation runs to test the sensitivity of different parameters. While the population is based on actual demography by the inhabitants of the area, and the activities performed by the agents is based on long-term study data from the German Mobility Panel, further parts of this model are not calibrated.
By default, the model includes the modes public transport, walking, bicycle, car as driver, and car as passenger. For the present work, the set of available modes was extended by adding the mode ride-pooling. All inhabitants can use the modes walking, bicycling, public transport, and car as passenger. Car usage is restricted to agents having a licence and living in a household with a car—around 73% of the agents have access to a car. Mode choice is performed using a multinomial logit model. To keep the model simple, the valuation parameters (betas) are the same for each mode and only travel time and costs are set to influence mode choice in this model (
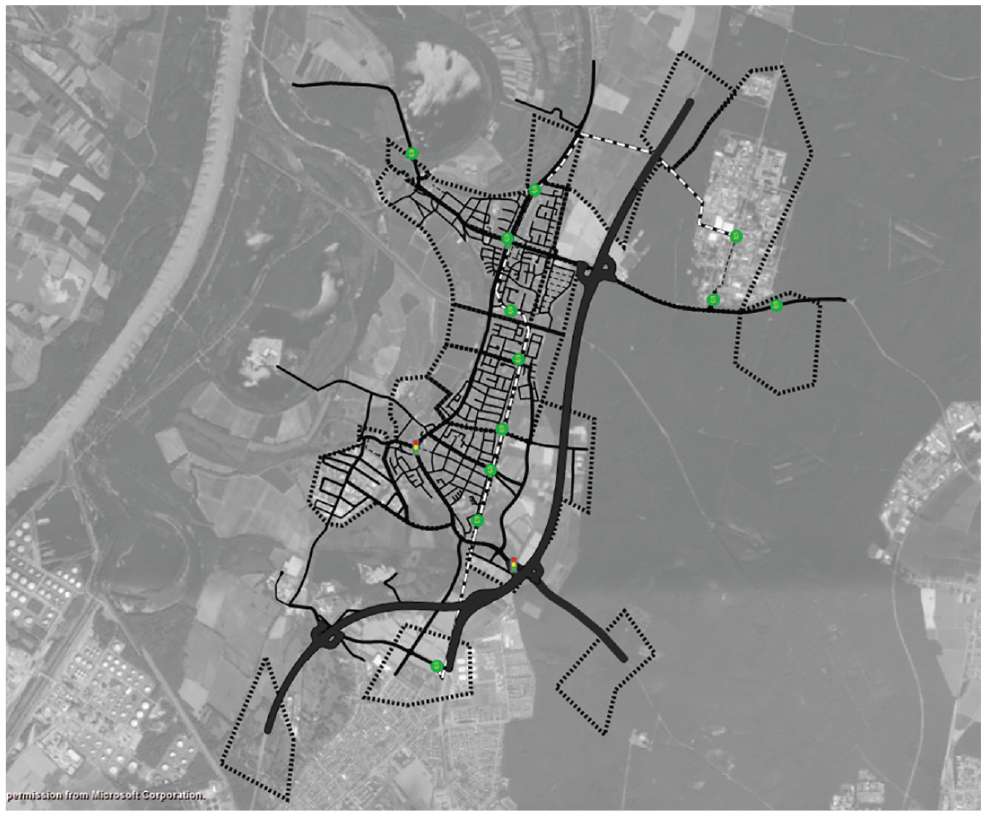
Several simulation runs were performed with varying individual parameters of the fleet simulation framework. All other parameters (e.g., all travel demand-model-related parameters) were held constant. The varied parameters are fleet size, accepted waiting time, and accepted detour factor, as well as price-related parameters. The price for the ride-pooling system consists of a base fare component
Base Scenario and Variation of Parameters
Note: na = not applicable; ct = abbreviation for Eurocent (1/100 Euro).
Simulation Results
In a first step, the ride-pooling fleet size is varied from 0 to 150 vehicles (see Figure 4). Figure 4a illustrates the modal share of ride-pooling services, Figure 4b the fraction of agents that received a ride-pooling offer, and Figure 4c the driven distance of ride-pooling service. All figures show similar trends: an approximately linear increase for small fleet sizes with a saturating behavior for large fleet sizes. This observation can be interpreted by the operation of the ride-pooling services in two different realms: for small fleet sizes demand exceeds supply. The fleet reaches its capacity limit and cannot serve additional customers. Increasing the fleet sizes makes the service accessible for customers that did not receive an offer from the ride-pooling service. This results in a higher mode share but also additional fleet mileage. Nevertheless, after reaching a fleet size of approximately 75 vehicles, ride-pooling demand is saturated at a mode share of around 16%: the supply of the ride-pooling fleet exceeds demand. With the ride-pooling service not operating at its capacity limit, the service can be offered to nearly all agents. With more vehicles but no additional users, the implemented control algorithm can even slightly reduce the fleet mileage in the saturated regime. As baseline for the following analysis, a fleet size of 50 vehicles is used (base scenario).
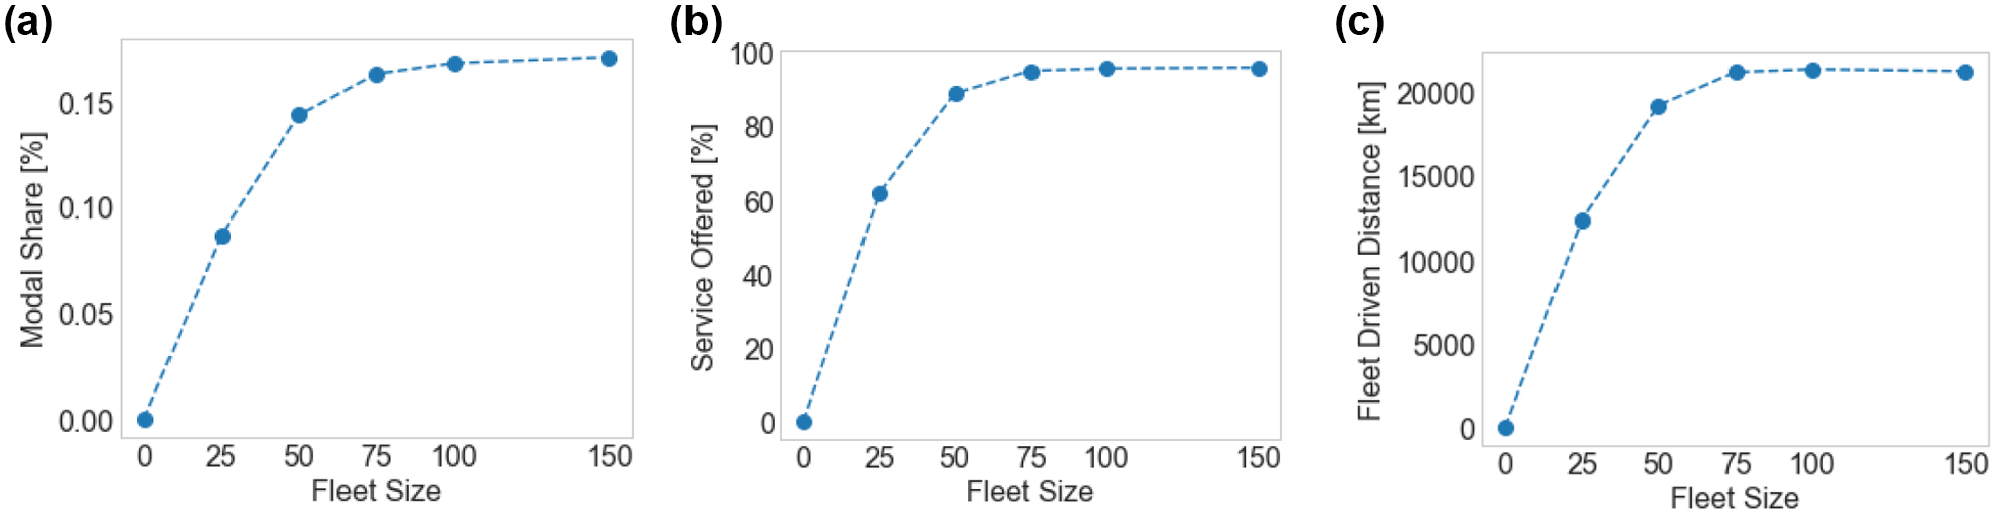
Simulation results for varying fleet sizes.
The demand for ride-pooling implies a decreased number of trips at all other modes. The comparison of modal shares for the scenario without the ride-pooling service and the scenario after introducing the mode ride-pooling with the operation defined by the base scenario is shown in Figure 5. Ride-pooling gains a mode share of 14.4%. The low fares estimated for an autonomous ride-pooling service (base fare of 100 Eurocent [ct; 1/100 Euro] and a distance fare of 25 ct/km in the base scenario) attract demand from all traditional modes. Relative to the scenario without ride-pooling, with the exception of the special mode “car as passenger,” the decrease in modal share of the other modes is between 10.6% and 16.6%; the highest absolute decrease can be seen with “pedestrian” trips. (The mode “car as passenger” as being very simply modeled is left out from the further analysis.)
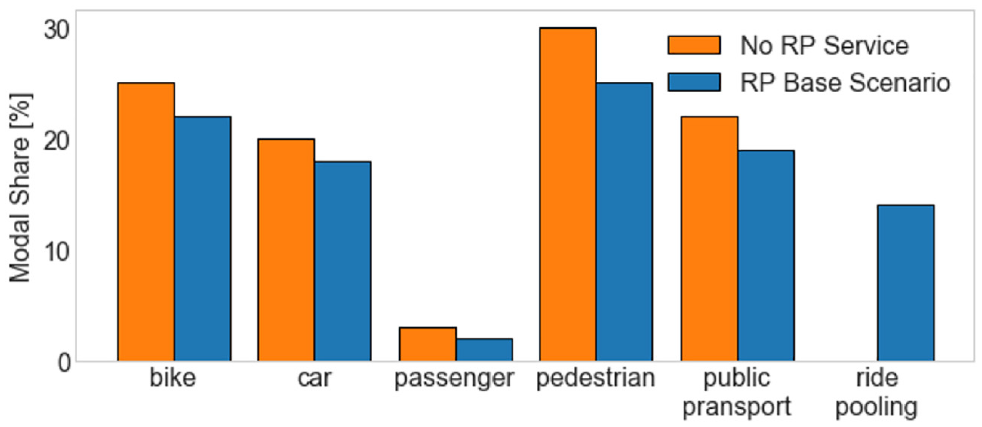
Comparison of modal share with and without an offered ride-pooling service.
The high amount of prior pedestrian trips raises the question how the other different modes are affected by different pricing schemes, that is, variation of base and distance-based fare independently. The modal split at different costs is depicted in Table 2. The following analysis is always relative to the base scenario.
Trip-Based Modal Split in Base Scenario and Cost-Related Variations
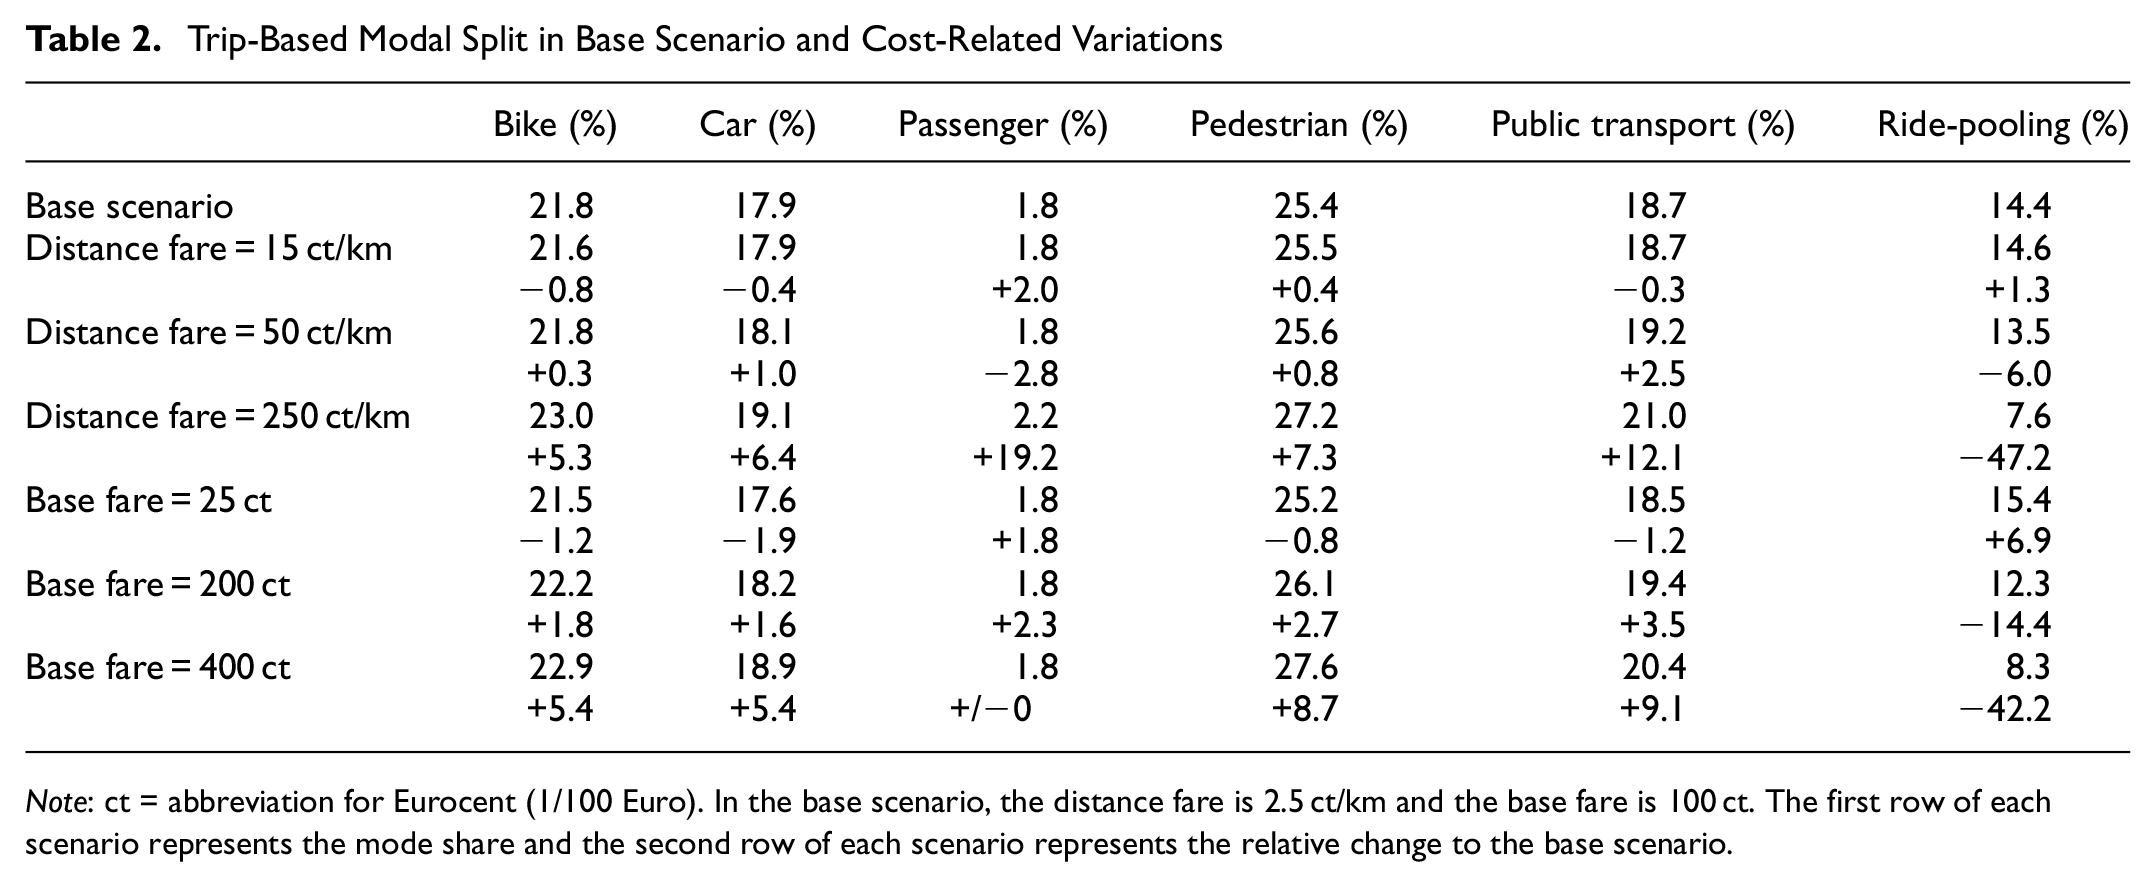
Note: ct = abbreviation for Eurocent (1/100 Euro). In the base scenario, the distance fare is 2.5 ct/km and the base fare is 100 ct. The first row of each scenario represents the mode share and the second row of each scenario represents the relative change to the base scenario.
Having a lower fare for ride-pooling, the demand for this mode increases by between 1.3% and 6.9% in the analyzed scenarios. Relatively, bike trips decrease most with a reduced distance fare, and car trips are reduced most with a lower base fare.
If the distance or base fare are doubled, the demand for ride-pooling trips decreases by 6.0% and 14.4%, respectively. The usage of other modes increases with changes between +0.3% and +3.5% in these two scenarios. In both scenarios, public transport gains most trips. However, this effect is most dominant with the high distance fare scenario (+2.5%, while the other modes have increases of up to 1.0%), while in the high base fare scenario all modes show a similar relative increase of trips (between +1.6% and 3.5%).
More insight can be gained from the scenarios with the highest fares. As their change concerning ride-pooling trips is of similar magnitude (−42.2% and −47.2%), the changes on other modes can be directly compared between these two scenarios. It can be seen that with a higher distance price, public transport trips, especially, increase (more than car trips, compared with their original value). Contrarily, the number of pedestrian trips is higher at the high base fare variation.
The different effects of the fare models on the modal split changes indicate that mean mileage per trip should be analyzed further. As can be seen in Table 3, the mean mileage is decreased by 43.1% for ride-pooling trips at the variation with highest distance fare, compared with the base scenario. This also has an impact on the other modes: since ride-pooling serves more of the short-distance trips, the other modes’ mean distance per trip increases, especially for pedestrian trips where mean distance per trip increases by up to 5.5%.
Mean Trip Distance in the Base Scenario and Change of Mean Trip Distances between Base Scenario and Cost-Related Variations
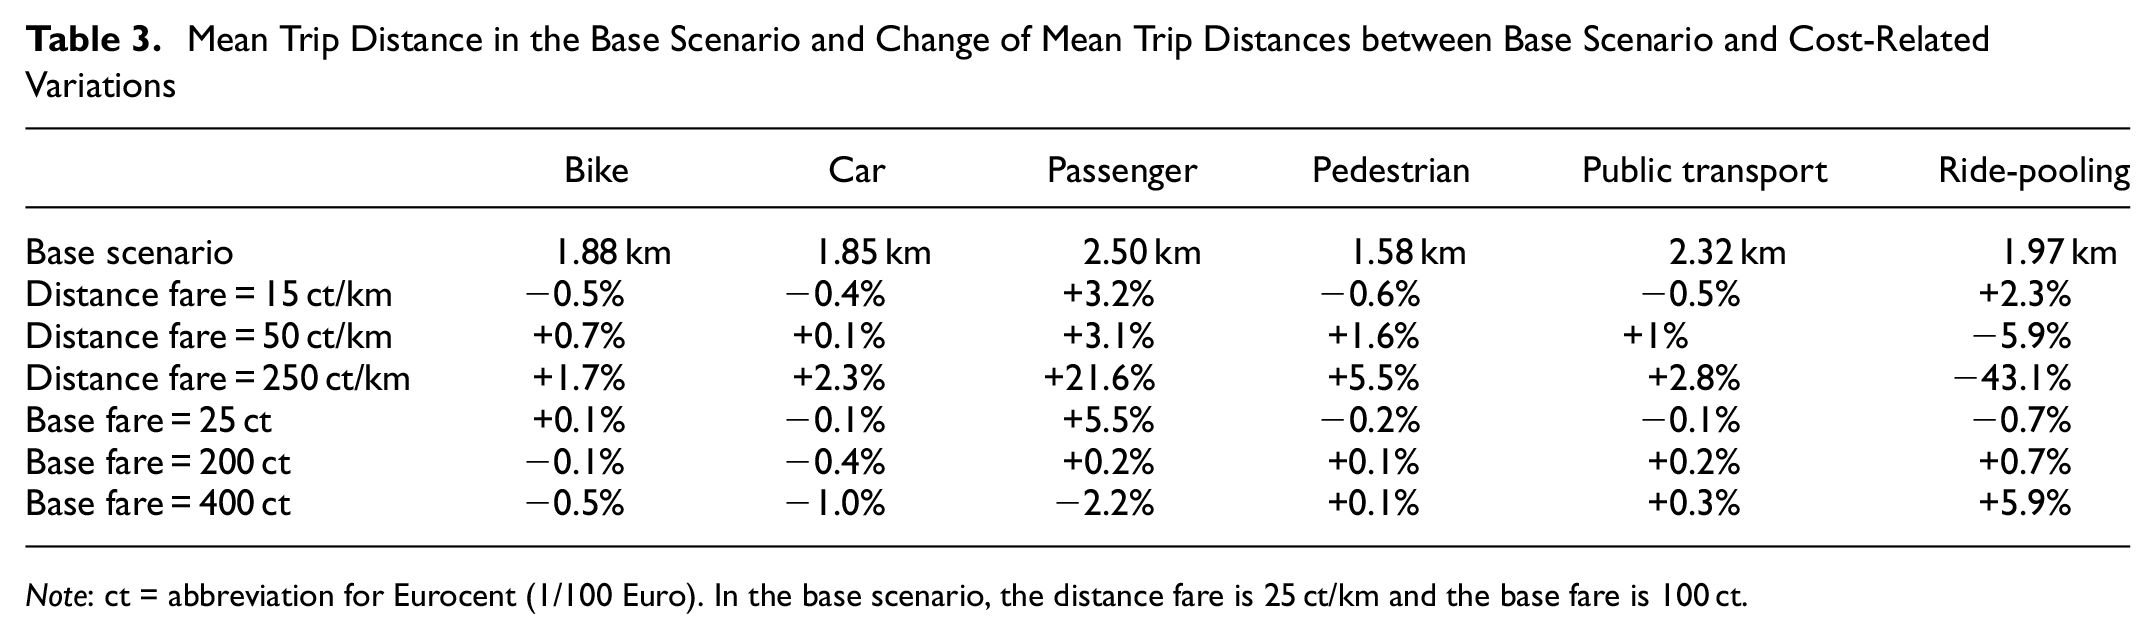
Note: ct = abbreviation for Eurocent (1/100 Euro). In the base scenario, the distance fare is 25 ct/km and the base fare is 100 ct.
The opposite effect can be seen in variations with highest base fare: ride-pooling becomes less attractive for short trips. While the mean distance for ride-pooling trips increases by 5.9%, the mean trip length by other modes decreases up to 1.0%. Interestingly, the mean distance of public transport trips increases. This could be explained by the consistency of private vehicle trips in the demand model: people who previously used a car for making a relatively long round trip might now switch to ride-pooling to their intermediary destination and return home by public transport.
Finally, the impact of different fleet control parameters is studied. Figure 6 shows stacked plots of vehicle occupancy states at different times of the simulation period. The maximum value on the y-axis indicates the fleet size. White spaces therefore correspond to idle vehicles.
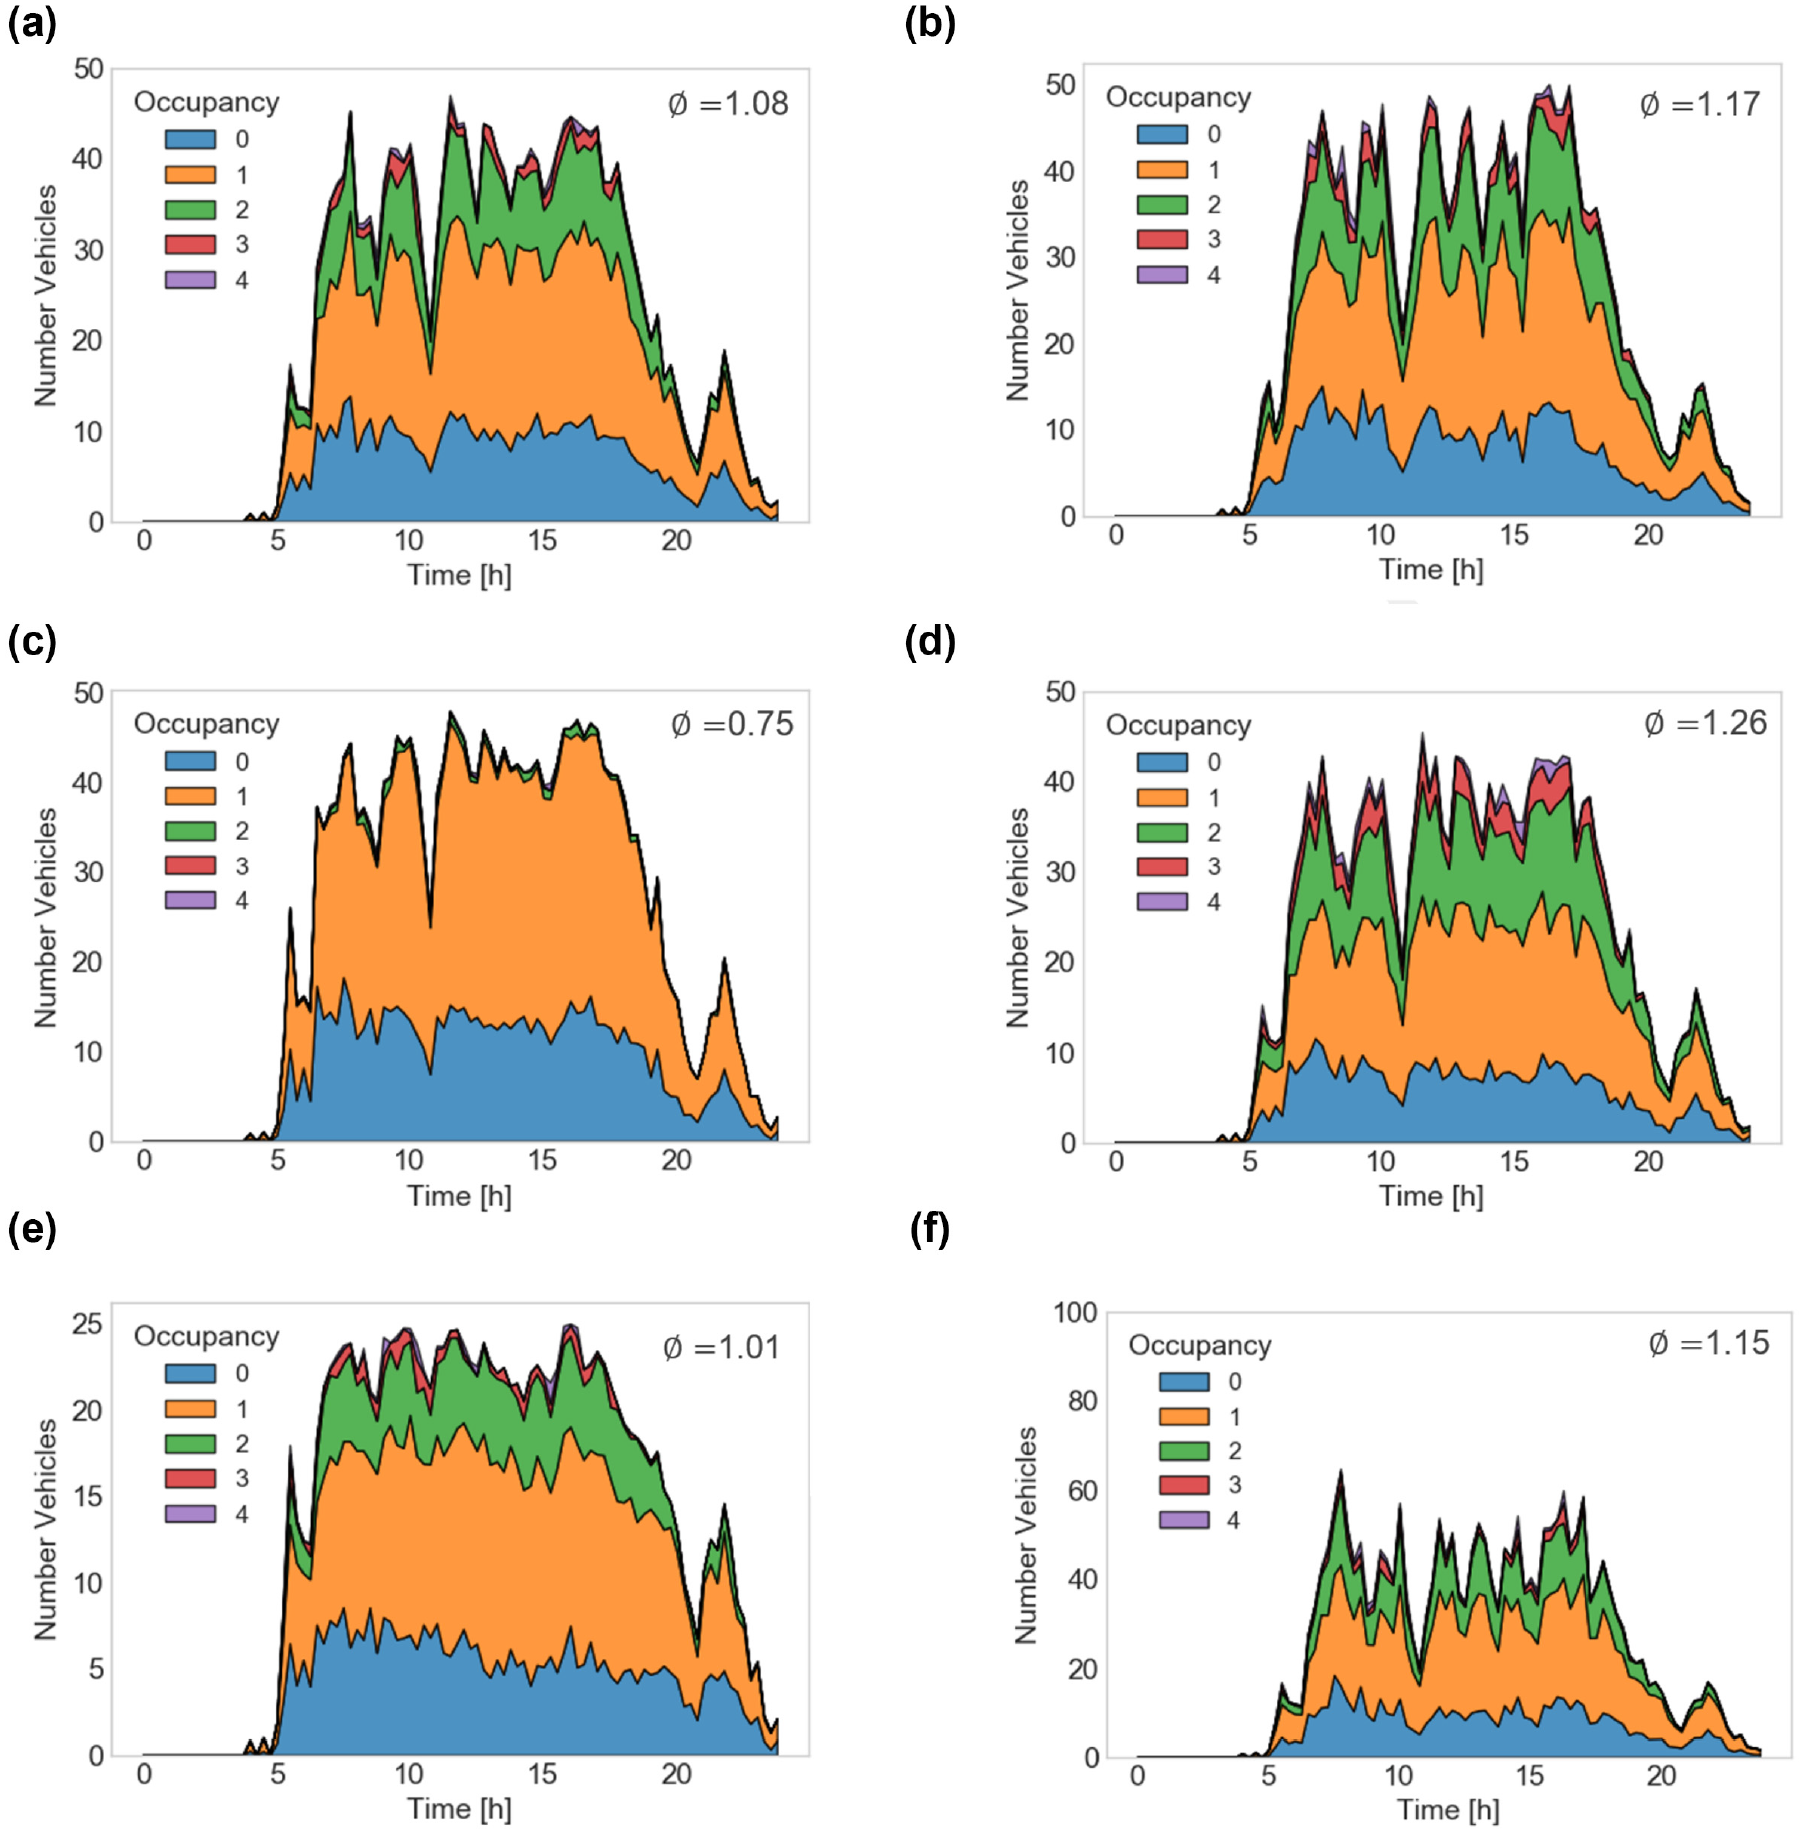
Time-dependent vehicle occupancy for the ride-pooling fleet by varying one parameter in comparison with the base scenario. (a) base scenario: modal share 14.3%; (b) a
Figure 6a displays the base scenario. Until 5 a.m. only a few agents are active in the system resulting in nearly all vehicles being idle. With rising demand, vehicles start moving. During the course of the day, roughly 10 of the 50 vehicles perform empty pick-up trips. The largest amount of vehicles is occupied with one customer. Only a few vehicles reach occupancy states of three passengers or higher. Overall, a distance-weighted average occupancy of 1.08 is observed in this scenario.
In Figure 6b a simulation with an increased maximum waiting time of
Figure 6, c and
d
, show variations in the allowed detour parameter from
Finally, Figure 6, e and f , depict scenarios with different fleet sizes. Analogously to the discussion of Figure 4, the two realms are shown, where demand exceeds supply (for 25 vehicles), and supply exceeds demand (for 100 vehicles). In the first case, only a few idle vehicles can be observed during times of demand. In the second case, even during times of high demand, many vehicles are idle.
As stated in the case study description, the result values do not reflect the real situation of Eggenstein-Leopoldshafen as the model is not calibrated. Therefore, the results are only indicative and show trends (e.g., for different pricing strategies). The case study rather shows evaluations of impacts of a ride-pooling system (with various fleet settings) on travel demand, which can be analyzed with the developed software frameworks.
Performance
The framework is not yet optimized for computing speed. At the current state, the computation times for more than 70,000 requests and fleet re-optimization after every simulation minute (24 h simulation) in the 50 vehicles scenarios range between 1:26 h and 2:46 h on a modern 3.3 GHz CPU (single threaded). Influencing factors are mostly the number of bookings and the degrees of freedom at the fleet simulation, such as allowed detours and allowed waiting time.
Conclusion
Summary
This paper presented the coupling of mobiTopp with an advanced fleet simulation module. The coupling works on an agent-based level, which is naturally suitable to model ride-pooling because of the involved online matching of vehicles and passengers.
The resulting simulation framework allows analyzing transportation networks in the presence of a ride-pooling system. Transportation planners and fleet operators can use the framework as a tool to (1) determine the elasticity of demand on the fleet setting (fleet size, prices, service quality) or how certain parameters constrain the supply and thereby the realized demand, and (2) predict and analyze mode shifts from the traditional modes to the new mobility option. The introduced simulation framework represents a progress of travel demand models with new mobility modes, as the used mode-choice model together with the selected simulation flow generates a self-regulating demand-supply equilibrium of the ride-pooling system and therefore does not require extensive simulation run iterations.
The coupled framework is applied to an example case study. Even though the example region is a non-calibrated model, valuable insights could be derived. Analyzing demand for varying fleet sizes clearly shows when (elastic) demand and when supply are limiting the realized demand and the utilization of ride-pooling vehicles. The fare system of the ride-pooling system obviously affects the demand elasticity; however, the model allows to quantify how much increasing base and distance-based fare affect the average ride-pooling trip length and the modal split. As a result, regulators can ask ride-pooling companies for a certain base fare to reduce the mode transition from active transportation modes.
Future Work: Case Study of MOIA in Hamburg
The scale of Hamburg and the ride-pooling service MOIA are much larger than the example of this paper and will show scaling effects of ride-pooling for more demand and larger fleet sizes. It is likely that fleet control heuristics and parallelization will be required to achieve tractable computation times. Furthermore, the model will consider that MOIA employs a fully electric vehicle fleet. Demand side parameters of the Hamburg case will be estimated from a large survey with more than 10,000 participants and Mobility in Germany survey data. More performance indicators from city, operator, and user view will be evaluated and their sensitivities analyzed. After implementing the status quo in Hamburg, other use cases will be simulated to study the transferability, for example, by introducing governmental regulations or simulating other cities.
Methodological effort will be necessary to implement intermodal ride-pooling trips. Moreover, the differences in relation to wait and detour time between ride-pooling offers and realized trips will be analyzed to account for differences between available information for mode-choice and actual customers’ experience. Models to adjust offers and realized trips and the development of long-term private vehicle ownership models will be interesting challenges. Furthermore, the authors will improve the implementation of the algorithms and employ parallelization to decrease computation time.
Footnotes
Author Contributions
The authors confirm contribution to the paper as follows: study conception and design: G. Wilkes, R. Engelhardt, L. Briem, F. Dandl, P. Vortisch, K. Bogenberger, M. Kagerbauer; data collection: G. Wilkes, R. Engelhardt, L. Briem, F. Dandl; analysis and interpretation of results: G. Wilkes, R. Engelhardt, F. Dandl; draft manuscript preparation: G. Wilkes, R. Engelhardt, L. Briem, F. Dandl. All authors reviewed the results and approved the final version of the manuscript.
Declaration of Conflicting Interests
The author(s) declared no potential conflicts of interest with respect to the research, authorship, and/or publication of this article.
Funding
The author(s) disclosed receipt of the following financial support for the research, authorship, and/or publication of this article: This framework was developed as part of the project “Accompanying Research of MOIA” which is funded by MOIA GmbH.
Data Accessibility Statement
The raw output of the simulations is available from the authors on request.