
Abstract
Several municipal transit agencies have partnered with transportation network companies to provide a range of services, but data restrictions have limited research on trip-level observations of transit-integrated ridesourcing users. The goal of this study was to understand how users’ trip-making behaviors adapted to a transit-integrated ridesourcing pilot in Waterloo, Ontario. This research conducted a longitudinal analysis of 178 unique users and temporal analyses of their 4,536 ridesourcing trips (rides) taken throughout the pilot from November 2018 to December 2019. Trip type and frequency changes over time were measured for frequent, average, and infrequent users. Transit, walking, and cycling alternatives to the pilot rides were generated and characterized based on their complementarity with transit. The number of unique users and daily ridership increased over time, as new users made their first trips and existing users made trips more frequently. Frequent users shifted toward less transit-competitive trip types whereas average and infrequent users had a sporadic but larger share of more transit-competitive trip types. The pilot was mostly used during off-peak service periods, when transit was less frequent, which suggests these systems are valuable for nonwork trips. Transit trip alternatives were not temporally competitive with rides. Cycling was competitive with 5% to 10% of rides and was consistently faster than walking and transit alternatives. Walking was not a practical alternative to rides in most cases. This analysis may inform other agencies of performance evaluation techniques for their transit-integrated ridesourcing pilots and the unique characteristics of trips taken by users of this mode.
Third-party mobility services such as taxis have coexisted with mass transit since its inception. Taxi services from the 1630s ( 1 ) predated the development of mass transit in the early 19th century ( 2 ). The emergence of transportation network companies (TNCs) in the last decade, including Uber and Lyft, has rapidly diversified the urban transportation landscape with affordable, app-based, on-demand services. Ridesourcing services offered by TNCs have already contributed to an estimated 6% net reduction in American transit ridership since 2009 ( 3 ), pressuring transit agencies to adapt to a shared mobility ecosystem.
Several municipal transit agencies have partnered with TNCs to provide a range of novel services to their users, including the sale of transit tickets in the Uber app ( 4 ), transit credit rewards from taking pooled Lyft rides ( 5 ), and the complete replacement of public transit services with Uber ( 6 ). Previous researchers have found that ridesourcing facilitates first- and last-mile connections to transit, thereby improving fixed-route transit efficiency ( 7 ). So-called transit-integrated ridesourcing programs have been studied for their impacts on user behaviors, but data restrictions have limited research on trip-level observations of transit-integrated ridesourcing users.
The goal of this study was to understand how users’ trip-making behaviors adapted to a transit-integrated ridesourcing pilot in Waterloo, Ontario. This study pursued three research objectives: (1) to determine the changes in the number of new and unique users and their associated trip-making frequencies over time, (2) to compare the temporal (when) and spatial (where) characteristics of these users’ trips across operating periods, and (3) to assess the pilot’s complementarity with other modes (transit, walking, and cycling) and whether it changed over time as users joined and adapted to the system. This is the first study to conduct a temporal analysis of trips taken in a transit-integrated ridesourcing program and a longitudinal analysis of its users. Results suggest that most trips had either supportive or neutral impacts on transit and at least 23% of passengers used the service to augment their public transit trips.
This paper first reviews the current state of research on ridesourcing user behaviors. Data sourced from the ridesourcing pilot in Waterloo, Ontario, are described next, followed by the methods used to analyze these data and generate competitive transit and active trip alternatives. Results are presented in the context of the three research objectives and subsequently discussed in the context of the existing literature and this study’s limitations. The conclusion summarizes key findings and provides an agenda for future research.
Literature Review
Shared Mobility and Ridesourcing
Shared mobility is a broad category of transportation modes in which deliveries, vehicles, or passenger rides are shared between multiple users ( 7 ). Historically, taxis represent the most popular service offering shared rides, but smartphones have enabled newer shared ride services through peer-to-peer sharing platforms. Ridesourcing differs from the taxi by using digital matching services (typically operated by TNCs) that connect passengers to service-registered drivers. Some literature uses “ridesplitting” to refer to ridesourcing services that offer shared rides with strangers by default (e.g., UberPool, Lyft Line [7, 8]) but ridesourcing is used throughout this paper to refer to both arrangements.
Transit-integrated ridesourcing is a form of demand-responsive transit, among other modes like dial-a-ride services, and accessibility-oriented paratransit. Unique to transit-integrated ridesourcing is that services are provided through TNC–agency partnerships, about which researchers have attempted to consolidate learnings. Westervelt et al. developed a set of recommendations for transit agencies partnering with TNCs, which included actively experimenting with new mobility models, prioritizing accessibility, prioritizing trips connecting to the broader transit network, and integrating diverse payment methods for people without bank accounts ( 9 ). The Transit Cooperative Research Program (TCRP) developed a “playbook” for TNC–agency partnerships, detailing a step-by-step checklist for agencies to complete ( 10 ). Both sources encourage the development of best practice for TNC–agency partnerships to improve benefits to the public.
A Data Desert: Challenges in Tracking User Behavior
TNCs that operate ridesourcing systems generally protect their data for privacy and competitive reasons ( 10 ), obscuring researchers from empirical trip- and passenger-level data. This data sharing hesitancy extends to TNC–agency partnerships. A TCRP report covering 20 case studies of TNC–agency partnerships ( 10 ) reported that only 16% of agencies surveyed had signed data sharing agreements with their TNC partners. Although 60% of agencies had access to partner data, many declined to share the specifics regarding data characteristics and whether it could be shared. The authors contend that research in data sharing may expand the transit industry’s ability to assess, plan, and manage TNC partnerships.
Researchers also experience challenges retrieving longitudinal datasets with discrete user- and trip-level observations. These data would provide a means to track user behaviors across the operational state changes of ridesourcing services. There are few readily available datasets that contain trip-level information about TNC rides (11–13). Those that exist vary in detail, omitting information such as precise origins and destinations ( 12 ) and the destination entirely ( 11 ). Several datasets do not contain unique user identification numbers, making inferences about individual user behavior impossible. Le Vine et al. suggest the use of multiday travel diaries to improve the behavioral understanding of car sharing and ridesourcing users ( 14 ). Dias et al. also argue the need for the explicit incorporation of ridesourcing as a mode within disaggregate choice models, implying the need for discrete observations ( 15 ).
Unfortunately, studies of ridesourcing user behavior (e.g., mode switching, trip frequency) rely on travel diary surveys (3, 15, 16), cross-sectional trip information ( 17 ), datasets with incomplete trip information ( 18 ), and interviews with transit agency staff (9, 19). None of these datasets connect trip-level information (i.e., trip time, origin/destination addresses) with longitudinal observations of user behavior. Within the TCRP report ( 10 ) about TNC–agency partnerships, no TNCs provided agencies with trip-level observations taken by unique users, leaving their analyses with only temporally aggregate figures (e.g., total unique users per week, user trip frequency per month). For example, Boston’s paratransit-integrated ridesourcing pilot included unique user trip frequency over time but no departure times or origin/destination points for the trips ( 18 ). Although researchers found that trip-making frequency stabilized after a 2-month period, there is no information on the types of trips made or whether trip-making frequency was connected to specific user groups in the pilot. Ridesourcing studies that do not observe discrete, longitudinal behaviors risk overlooking how behavioral outcomes evolve, especially alongside operational changes in ridesourcing services.
Data
In 2018, the Region of Waterloo, Ontario, Canada (west of Toronto) launched three shared mobility pilots over a period of 1 year in areas with low transit demand but high requests for service, where no fixed-route service was planned before 2021 ( 20 ). These pilots allowed the agency to experiment with different shared mobility services in underserved areas without the budget required by traditional fixed-route services. The focus of this study is the ridesourcing pilot (903 Flex), which was designed such that passengers could schedule a ridesourcing trip between “virtual stops” in the network (ridesourcing-only stops) and fixed-route bus stops through using an app produced by the pilot TNC partner, RideCo. Users were able to take trips between any two virtual/bus stops for the price of a standard Grand River Transit (GRT) fare or with a transfer. The service was available on weekdays, and there were no limitations on the number or types of trips taken or who was able to schedule a trip.
This research conducted a longitudinal analysis of 178 unique users and a temporal analysis of their 4,536 ridesourcing trips (rides) taken throughout the entire 903 Flex pilot from November 2018 to December 2019. Table 1 outlines the changes made to the pilot and the transit network over the pilot’s operation. Three broad operating periods are defined, which are used for the remainder of this research. Owing to the relatively low trip count in each subperiod for Period 1, these subperiods were consolidated for temporal analysis. The third period is split into two subperiods (3a and 3b) for temporal analysis because of the high volume of trips taken in the final 4 months of the service.
903 Flex Operating Periods, Including Major Milestones and Trip Counts
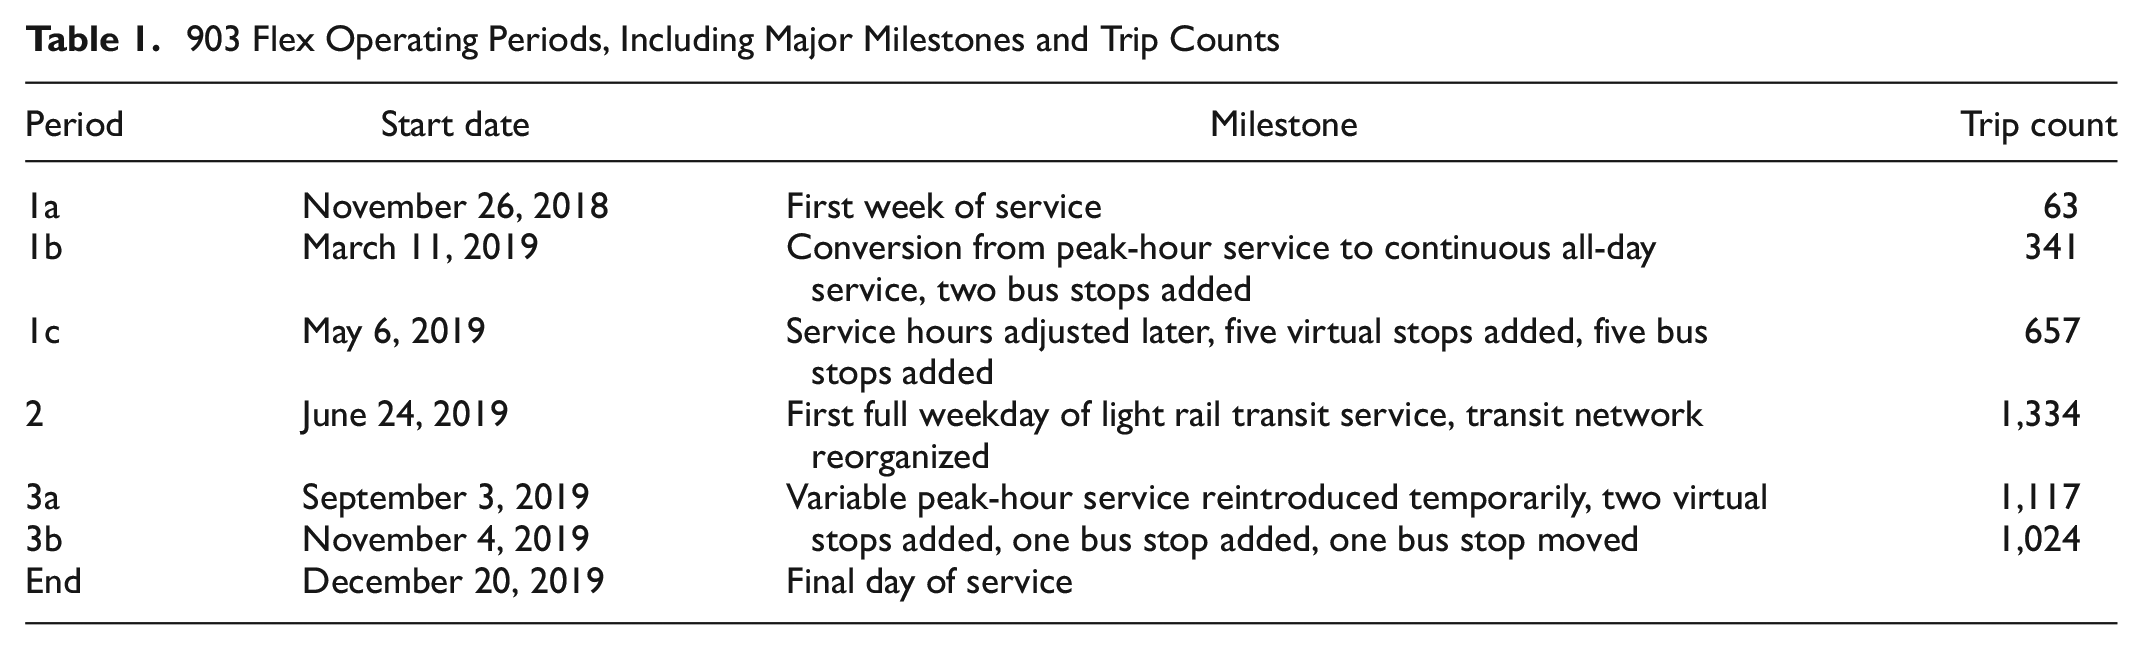
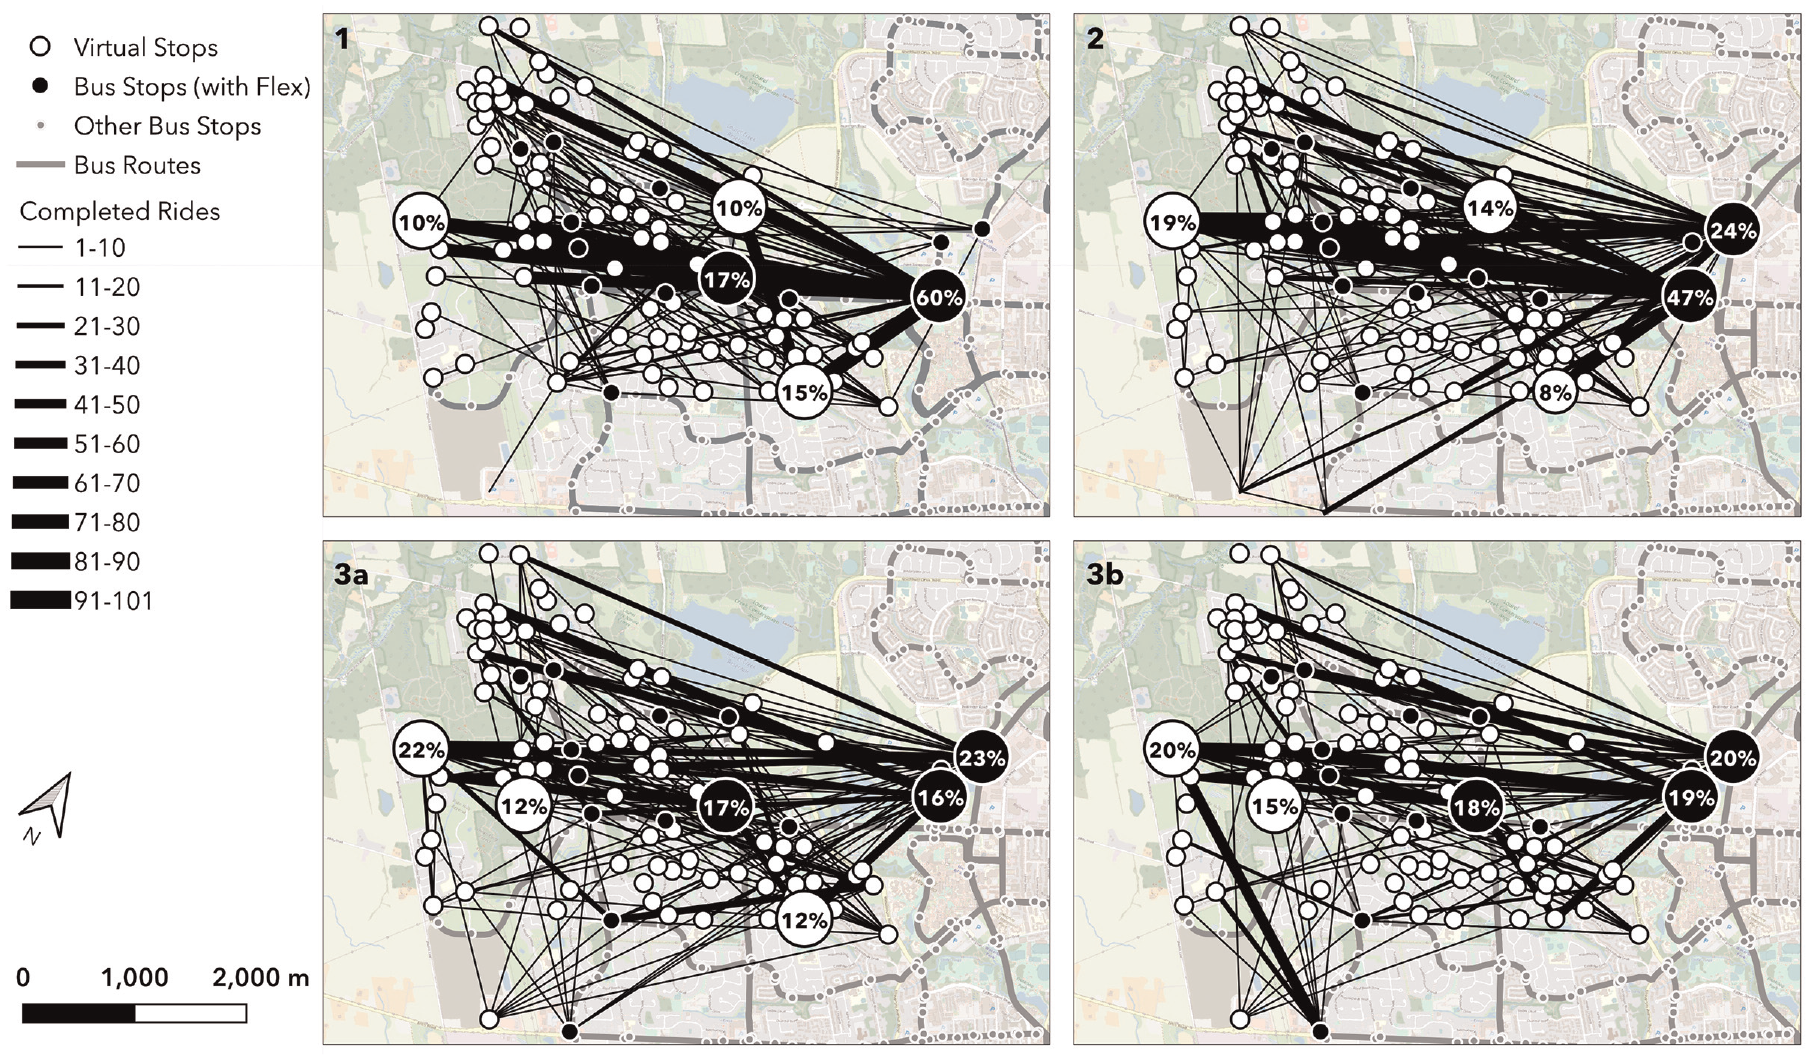
Figure 1 shows the origin–destination (O-D) pairs representing all 4,536 trips in the pilot, separated by operating period (1, 2, 3a, and 3b). Virtual stops (white circles) were placed to achieve a maximum 5-min access and egress walk to the transit network in northwest Waterloo to increase coverage in areas where existing fixed-route services (gray lines) were poor. Some bus stops (black circles) were part of the 903 Flex pilot. The O-D pairs (black desire-lines) for each period connect virtual stops and bus stops in the network, with thickness weighted by trip frequency throughout the operating period. The top five most popular stops in each period are identified in larger circles with their share of trip origins/destinations.
The attributes used for analysis from GRT’s trip database included pickup and drop-off locations (to generate trip alternatives), pickup time (for time-of-day analysis and trip alternative generation), travel time (for comparison against other modes), unique user IDs (for temporal user analysis), and payment methods (for inferences into multimodal transit use).
Methods
This paper extends the framework proposed by Terry and Bachmann who studied the first 6 months (Periods 1a, 1b, and parts of 1c) of the 903 Flex pilot ( 24 ). Although the previous study was focused on the spatial characteristics of trips taken by early adopters, this paper’s analysis focuses on the temporal changes in the pilot. This analysis consists of three major steps. First, multimodal alternatives to the pilot rides were generated, which were used to determine changes in the competitiveness of a passenger’s other travel options (at the time of their ride). Second, the spatial characterization framework was extended and applied for all trips in the pilot, which was used to determine whether the pilot encouraged more integration or competition with fixed-route transit as it matured. Third, temporal passenger-level trip-making behavior and changes in spatial characteristics, trip frequency, and other available ride characteristics were measured, to comprehensively examine what factors may have influenced user trip-making frequency and trip types throughout the pilot.
Generating Multimodal Alternatives
Multimodal alternatives were generated for each ride to temporally assess the most competitive options that each user could have taken instead of using the ridesourcing pilot. Trip times for transit, walking, and cycling alternatives were used to determine how competitive each mode was against the pilot over time. All alternatives were generated with OpenTripPlanner 1.4.0 using GTFS files from OpenMobilityData for transit stop, route, and schedule data ( 25 ), OpenStreetMap for road and trail network layers, and Python 3.6 for API requests. Five GTFS feeds were used, corresponding to GRT’s seasonal schedules. OpenTripPlanner required the coordinates of the start and ending points of the journey, the date of the journey, and the time the passenger had requested to be picked up.
Transit alternatives were generated using default settings in OpenTripPlanner to produce transit trip components, including access time, travel time (including transfers), and egress time. Walking times for transit access and egress use a walking speed of 1.33 m/s, which converts to 400 m over 5 min, and empirically aligns with average walking speeds in this area from other trip planners like Google Maps. If more than one itinerary was returned, the preferred transit alternative was selected by minimizing the combined access and egress walking time (which in turn reduced walking distance), reflecting the trip that would be most spatially competitive with the pilot ride. A maximum number of transit transfers was not set because spatial characteristics were of greater importance in this study. Driving itineraries were generated from the ride origin to the ride destination, and the ride origin to transit origin, for determining trip types that could fall under a direct feeder or nontransit-trip structure.
Walking alternatives used a walking speed of 1.33 m/s. Cycling alternatives used the “balanced” option in OpenTripPlanner, which equally weighs bike-friendliness, speed, and elevation when generating a cycling itinerary. This option was selected because the preferences of passengers were unknown, making the most balanced option the least presumptive.
Trip components from the generated transit alternatives were used to characterize the transit context operationally and spatially. The number of transfers taken, wait times, and travel times were extracted from OpenTripPlanner for transit service analysis. For active transportation alternatives, travel time was the only trip component extracted and analyzed. Access and egress walking times are key descriptors of the transit context and can be spatially characterized like ridesourcing trips.
Extending the Spatial Characterization Framework
The spatial characterization framework assigned trip types to rides based on the proximity of ridesourcing trip ends (virtual stops) to the nearest transit stops that would otherwise connect them. Terry and Bachmann describe the development of trip types in further detail ( 24 ). Figure 2 simplifies the nine trip types into five aggregate trip types and adds a tenth (nontransit trips). Each trip type is based on the categorization of access and egress distances. Access and egress distances fall within four categorizations: at a transit stop (a negligible walk), convenient (400 m away or less by walking), inconvenient (401 to 800 m away by walking), and remote (more than an 800 m walk away). Every 400 m represents an estimated 5 min of walking time.
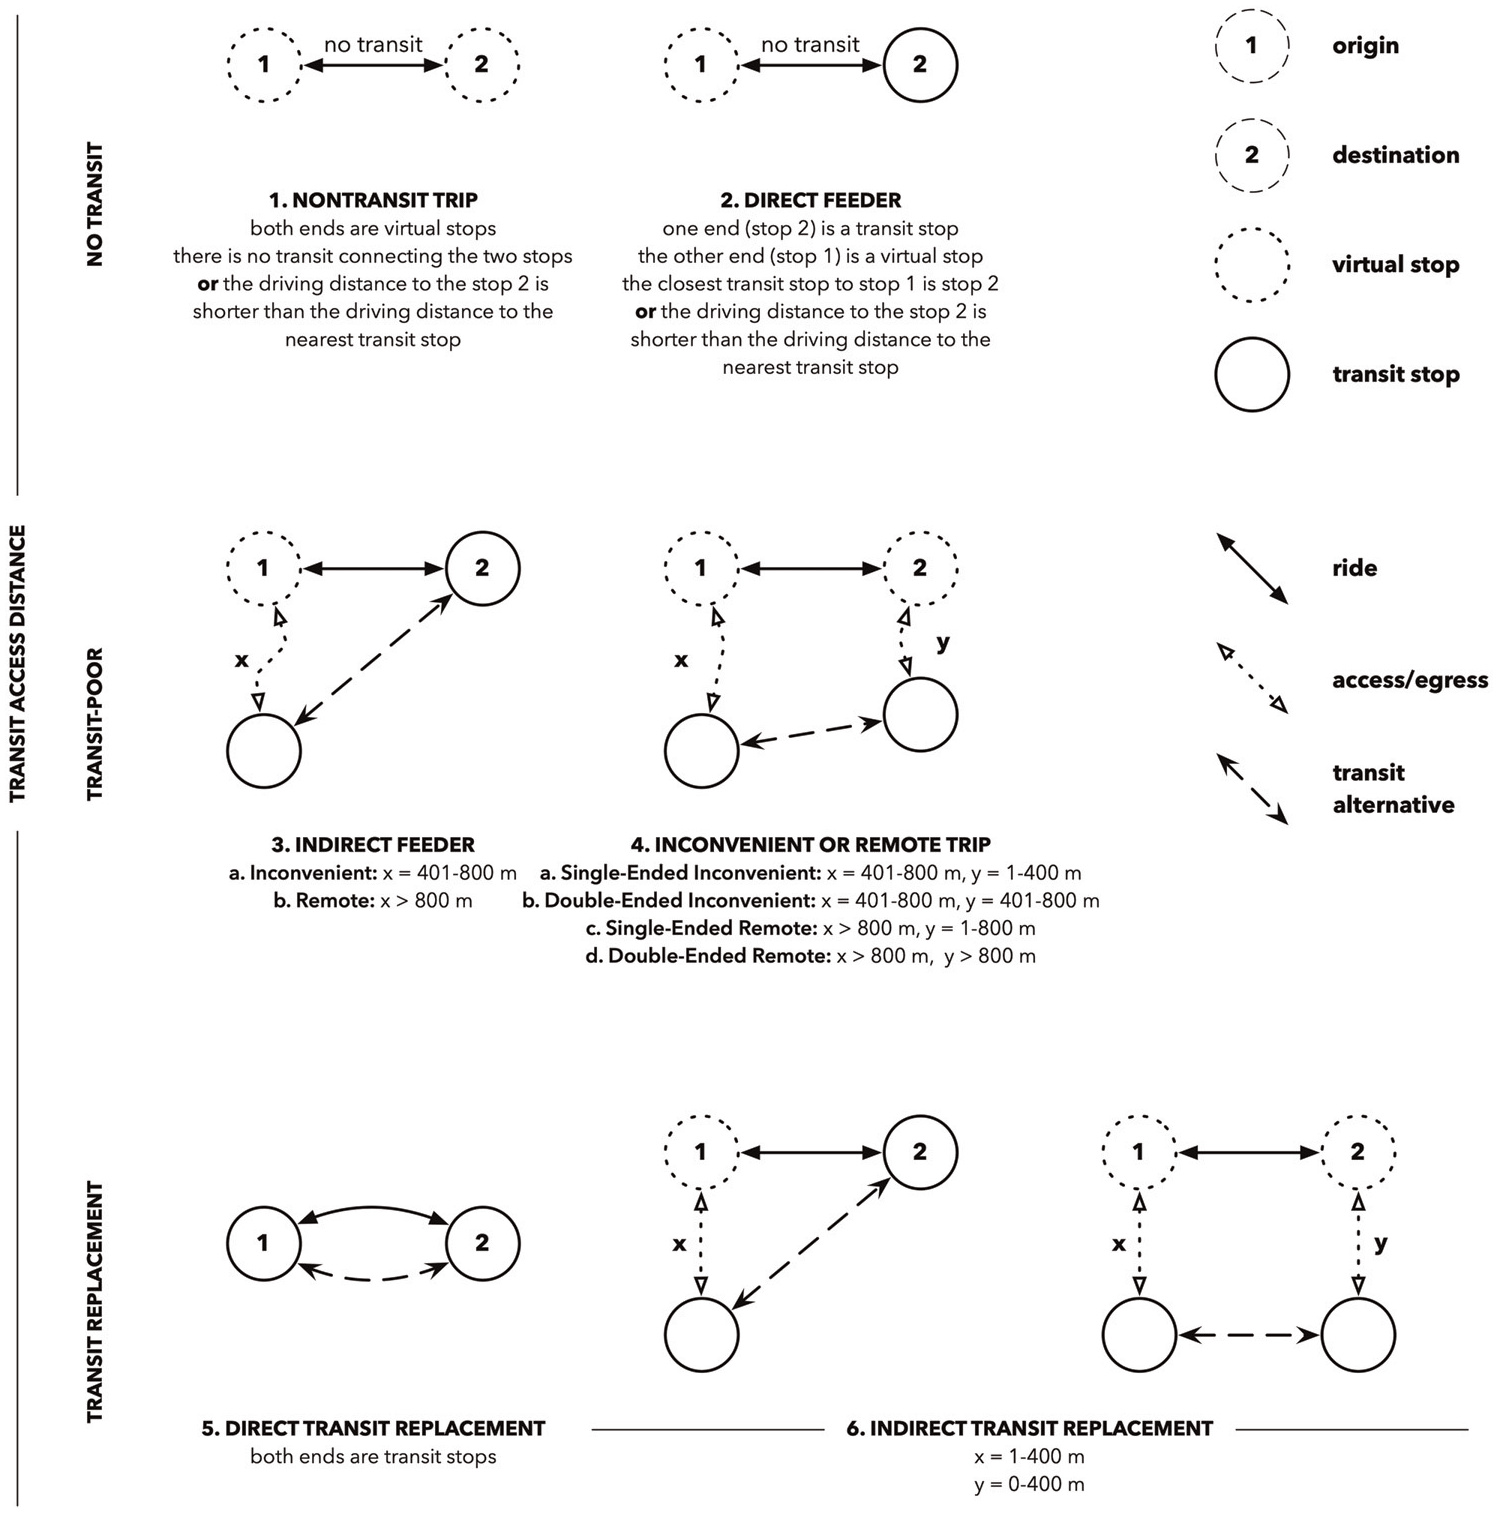
Simplified ridesourcing trip types based on transit access/egress distances.
Trip types are a useful tool for describing how the ridesourcing trip competes with or complements transit. For example, transit replacements imply a duplication of services, remote trips imply poor transit access, and direct feeders imply that service connects immediately to the nearest transit stop. In addition, trip types are useful when analyzing user choices over time, effectively connecting user preferences with ridesourcing services.
Two changes were made to the previously defined nine trip types owing to outliers occurring in the latter part of the pilot. In addition to access and egress times, nontransit trips and direct feeders were given an additional qualifier based on driving distance. Nontransit trips were introduced because several trips taken toward the end of the pilot connected origins and destinations that had no transit option between them. The driving distance qualifier addressed the incorrect categorization of direct feeders as transit replacements or indirect feeders when the nearest transit stop by walking was different from the nearest transit stop by driving (because of vehicle-free routes such as pedestrian trails). A qualifier for direct feeders and nontransit trips comparing driving distance to the nearest transit stop with driving distance to the destination reduces these mischaracterizations, and cases in which people are taking a trip between two spots in the same neighborhood. This follows the original intent of the typology, which was to determine whether people are making transit-supportive trips. If a user is unable to walk to the nearest transit stop, then a “good” trip for the user to take would be the one that is nearest by driving (i.e., by ridesourcing) because transit is not accessible. Generally, the categorization scheme for nontransit trips and direct feeders is restrictive and represents a conservative estimate of trips that have no transit option.
User Trip Behavior Classification
Users were classified by trip-making frequency to identify trip-making behaviors and patterns throughout the ridesourcing pilot. The three user groups include frequent, average, and infrequent users, which represent three levels of pilot adoption and corresponding trip sample sizes. Criteria for user groups were chosen using engineering judgment to ensure that characterizations of user groups reflected sustained trip-making behaviors and considered sample sizes within each group. Frequent users (53 users, 3,697 trips) include those who took an average of at least one ridesourcing trip per week over a period of at least 2 months, ensuring they had some regularity in their ridership over a length of time roughly equivalent to the shortest periods (3a and 3b). Infrequent users (56 users, 75 trips) include anybody who had two trips or fewer throughout the entire pilot, which was about a third of the riders. Average users (69 users, 764 trips) include everybody between, that is, users who took three or more trips throughout the pilot but did not meet frequent-user criteria.
This study analyzed trip type and frequency changes over time using these user groups. First, total trips taken by each user group were split based on trip type. Comparing the trip-type splits of user groups can reveal whether certain trip types were typical or appealing for more frequent users. Second, the analysis examined whether trip types changed over time, that is, whether unique users changed trip-making behaviors. This analysis only tracked trips made by the frequent-user group because the average and infrequent groups did not have enough trips per unique individual to support an analysis across periods. Since frequent users captured a larger sample of trips per unique user, this group better represents behaviors over time than more infrequent user groups. Third, another longitudinal analysis of frequent users sought to understand whether individual trip frequency increased as the pilot progressed. The number of trips made by frequent users were compared across pilot periods (including 1a, 1b, and 1c) to understand how many users increased, decreased, or stabilized their use over time. The time of day that 903 Flex trips were taken was analyzed to make inferences about temporal user behavior. Trip times were binned into six categories corresponding to peak hours and peak periods for Waterloo, ON, based on the time the vehicle picked up the passenger from the origin: morning peak hour (7:30 to 8:29 a.m.), morning peak periods (6:30 to 7:29 a.m. and 8:30 to 9:29 a.m.), midday off-peak (9:30 to 2:29 p.m.), afternoon peak period (2:30 to 4:29 p.m.), afternoon peak hour (4:30 to 5:29 p.m.), and evening off-peak (5:30 to 10:00 p.m.).
Results
Changes in Users and Trip-Making Frequencies
Figure 3 shows the weekly ridership for the 903 Flex for the whole pilot (November 2018–December 2019), separated into new and unique users per week. The first user took their first trip in the last week of December 2018, and starting in mid-January 2019, there was at least one user per week. The number of weekly unique users increased rather steadily, starting in March, and peaking in late October and November. This increase was paired with a regular cadence of new users, which stabilized at between two and four new users weekly. The largest spikes in new users were in April (midway through period 1b, 13 users) and three times in Period 2 (11 to 12 users each time).
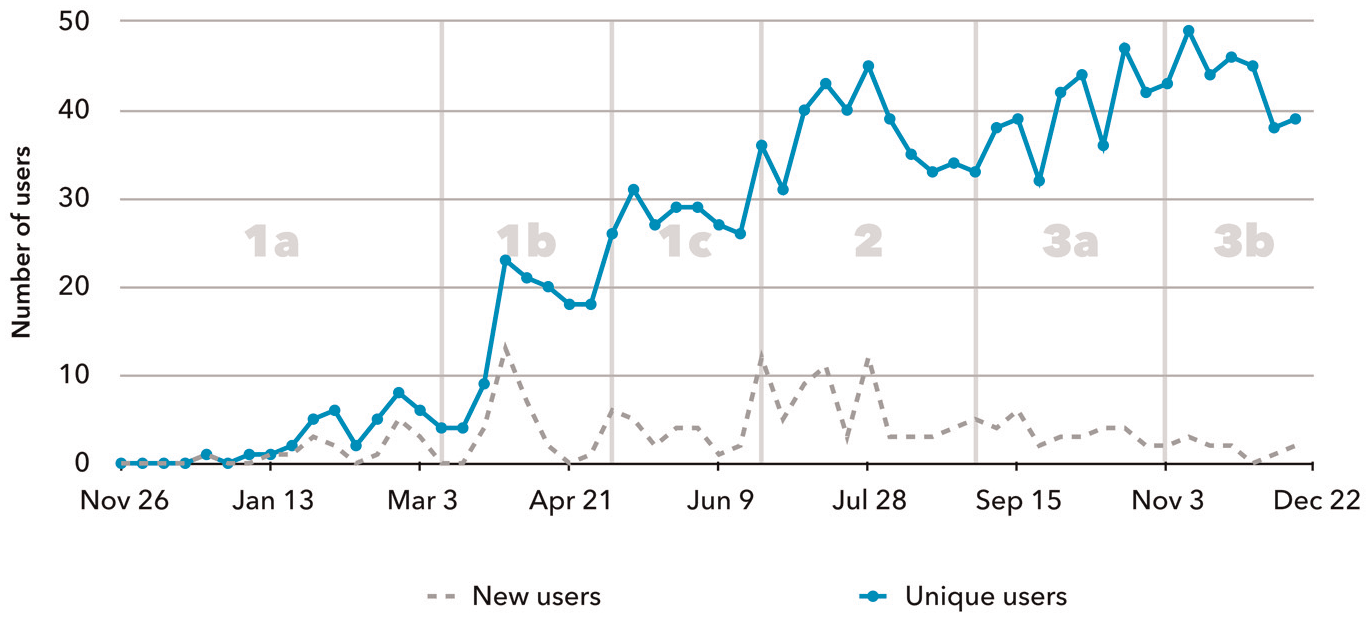
903 Flex weekly ridership statistics.
Figure 4 shows how trip types evolved across users with different trip-making frequencies over time. Users were binned into frequent (53 users), average (69 users), and infrequent (56 users), based on their trip-making frequency and their total number of trips. Total rides for each column are listed (e.g., 16 total rides by infrequent users in Period 1) to provide scale for comparison. Remote trips consist of single-ended and double-ended remote trips, and inconvenient trips consist of single-ended and double-ended inconvenient trips. Frequent users took a smaller share of transit replacements compared with the other two user bins (7% to 20% versus 11% to 52% of trips per period), infrequent users took a smaller share of indirect feeders (0% to 22% versus 39% to 72% of trips per period), and average users took a smaller share of inconvenient and remote trips (6% to 26% versus 16% to 62% of trips per period). Excluding Period 1, frequent users took a larger share of direct feeders and nontransit trips (9% to 12% versus 0% to 6% of trips per period). Generally, frequent users took a higher share of more transit-supportive trip types than users in the less frequent user bins.
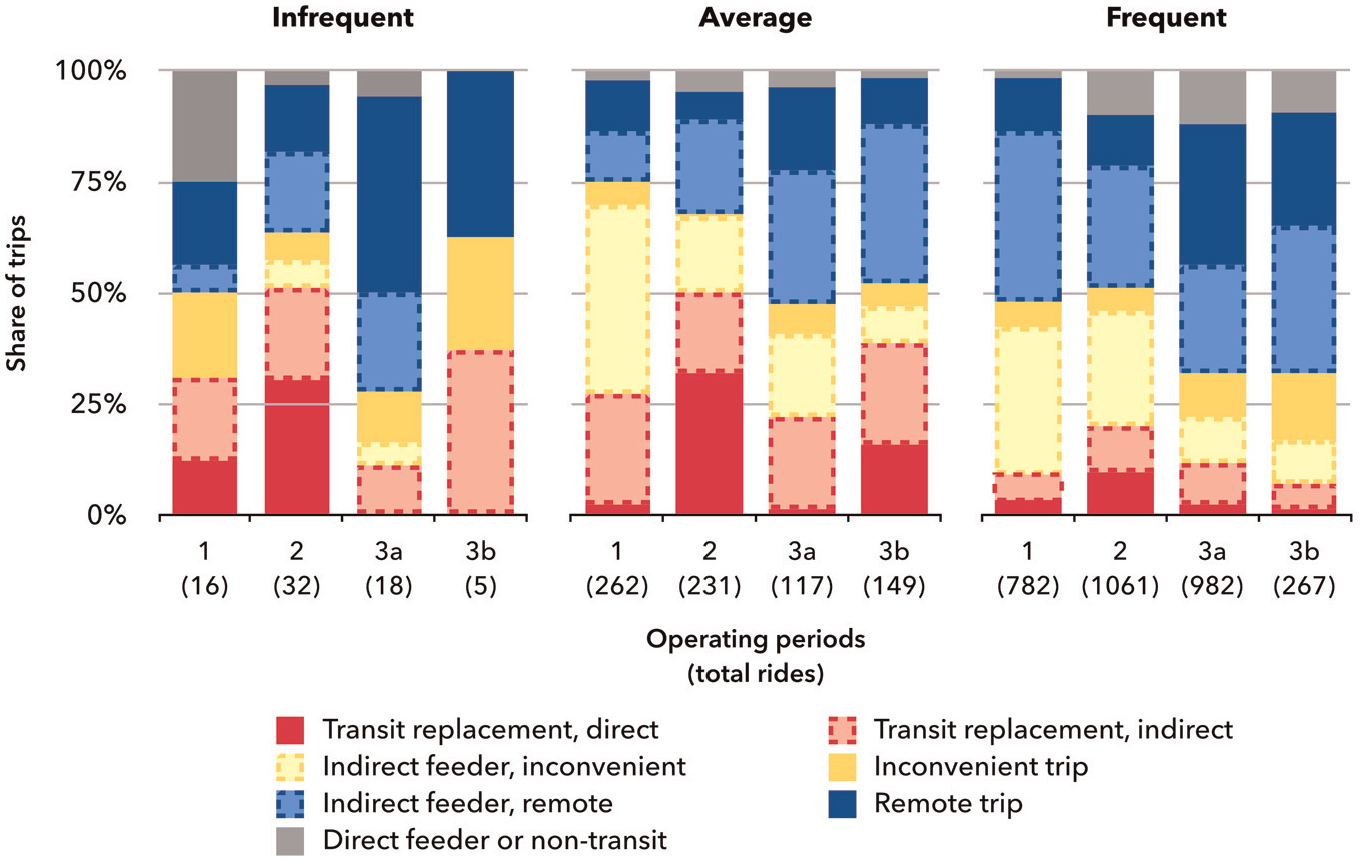
Trip types by trip-making frequency by period.
Figure 5 shows how magnitude of trips changed over time for frequent users. Frequent users were isolated from other groups because they took enough trips over a sufficiently long period (8 weeks or more with at least an average of one trip per week) to reveal changes in trip patterns. User behavior is categorized in each period based on the percent change in trips from the previous period. “Start” indicates that a user took trips in the current period but made no trips in the previous period. “Stop” includes users who took no trips in the current period but made a trip in the previous period (i.e., a drop of 100% since the previous period). “Stable” indicates a user had a percent change between −50% and 50%, and “Decrease/Increase” represents values below or above those thresholds, respectively. Period 2 represented the largest number of individuals reducing their trip frequency, but few users stopped using the service completely. In Periods 3a and 3b, most frequent users continued to increase or stabilize their number of trips.
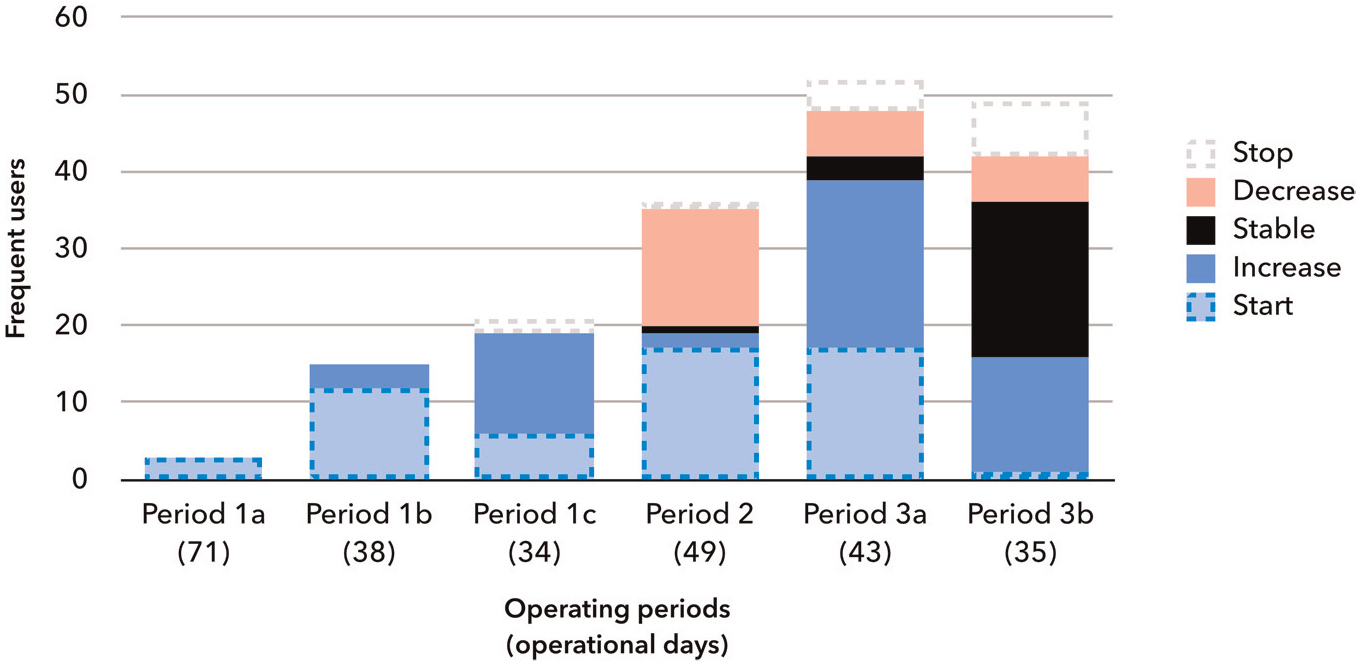
Changes in trip magnitude by trip-making frequency by period.
Changes in trip types for frequent users was also studied but did not reveal substantial changes in trip type over time: 55% of frequent users maintained the same dominant trip-type, and 89% of frequent users maintained the same trip-type class (transit-poor, transit replacement, or no transit).
Changes in Temporal and Spatial Trip Characteristics
Table 2 lists a summary of ridership and time statistics for the 903 Flex, as well as the most competitive transit, walking, and cycling alternatives. Daily ridership spiked in Period 2, then stayed relatively constant afterward. Shared rides and multiple passengers per booking identify two different ride statistics: a shared ride indicates that multiple bookings used the same ride, whereas multiple passengers per booking indicates a shared ride through one booking. The correlation between shared rides and daily ridership was fairly direct, probably because people were more likely to happen to book at the same time during the busier periods. People tended to book multiple people per booking at the same rate no matter the period in which they were using the service. Ride times and alternative trip times did not change greatly over the pilot: the median ride time and cycling trip time were fairly consistent, the median walking trip time was slightly longer at the start of the pilot, and the median transit trip time with or without estimated wait time was shorter at the start of the pilot. Mean values were also calculated, but showed similar results, falling within a maximum 8% change from the median value.
Ridership and Temporal Statistics for 903 Flex and Alternatives by Period
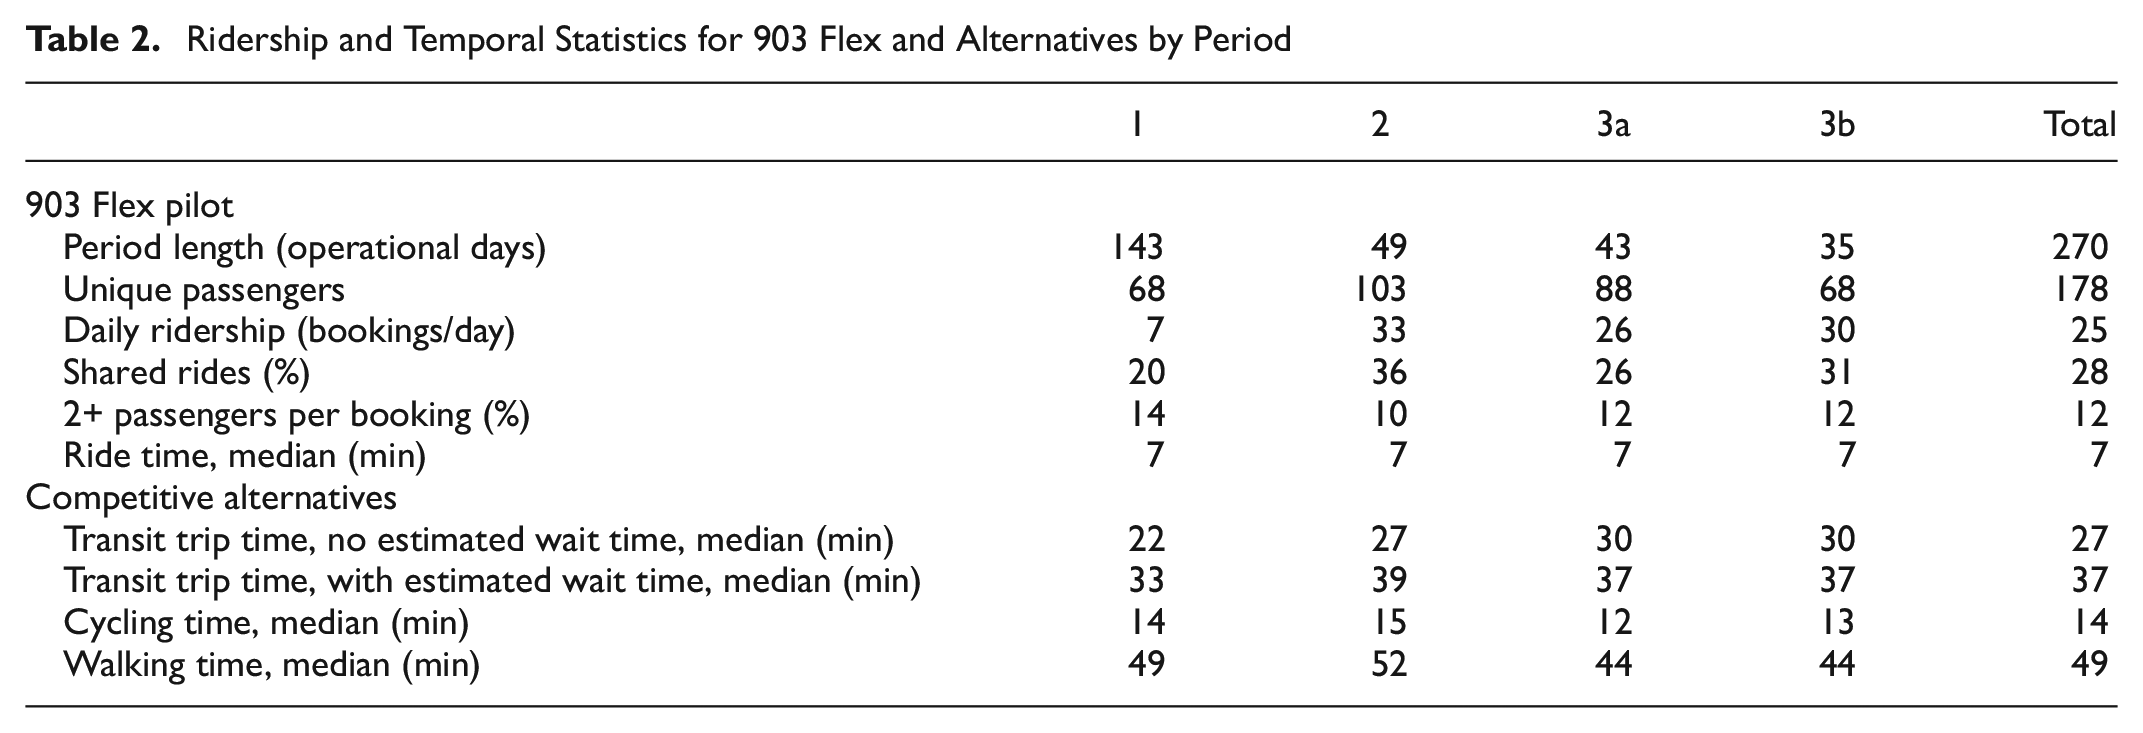
Figure 6 shows how trip pickup times varied by time of day across 903 Flex periods. Passenger behavior was relatively uniform across all periods. Off-peak trips were very dominant across all periods, consistently representing two-thirds of trips taken in each period. Midday off-peak trips were the most popular (33% to 44%), followed by evening off-peak trips (25% to 31%). For Periods 1b to 3b, these were also the longest segments in the day (5 h for midday, 3.25 to 4 h for evening). Trips during peak hours accounted for 10% to 16% of trips in each period.
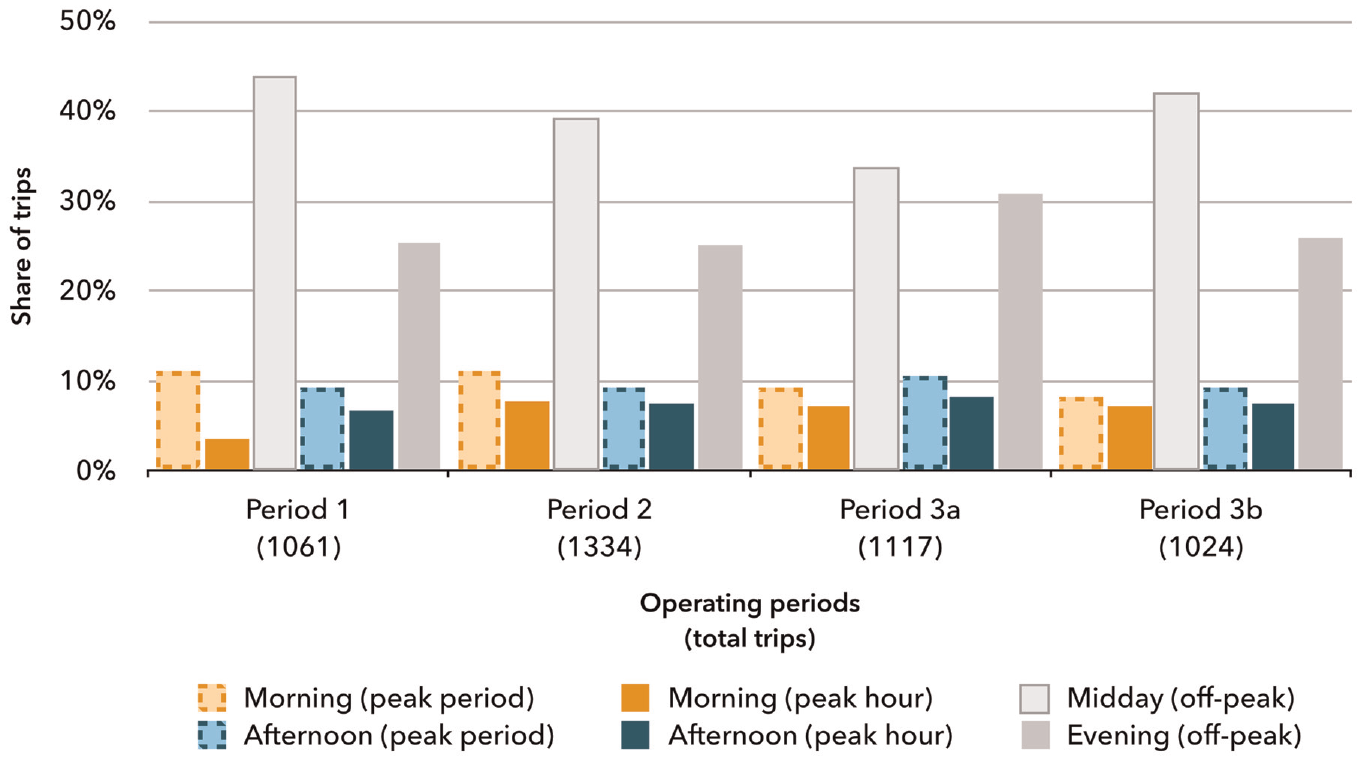
Pickup times by time of day by period.
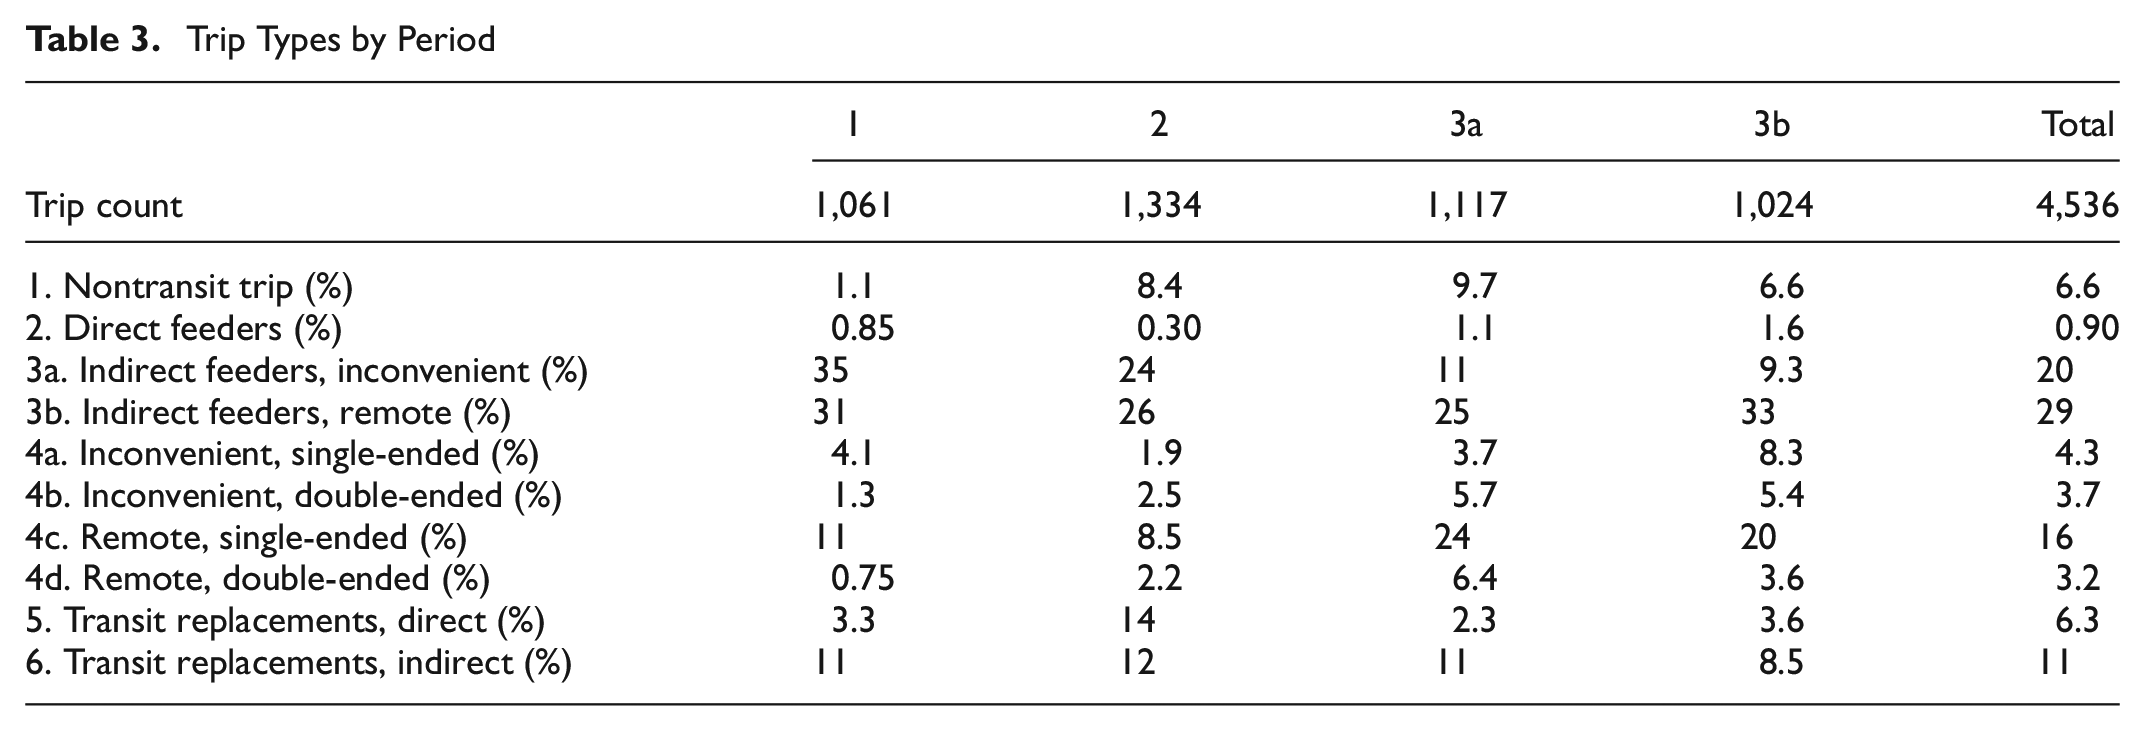
Table 3 lists the shares of trip types over time for each period. Indirect feeders consisted of over half of 903 Flex rides in Periods 1 and 2 and remained the primary trip-type in the latter periods. Transit replacements, which are the most transit-competitive types, peaked in Period 2, and were relatively stable in the other periods, with a very slight decline toward Period 3b. The peak in Period 2 could have been the result of free trips being made available during the period with the introduction of the light rail transit (LRT) service (see Table 1). In addition, during that time period, free coupons were handed out to users, which may have also contributed to transit replacements being taken more frequently. Direct feeders, nontransit trips, inconvenient trips, and remote trips, which are the least transit-competitive types, increased from 19% of all trips in Period 1 to 51% and 46% of all trips in Periods 3a and 3b, respectively. Notably, 85% of nontransit trips were taken by the second-most frequent user in the pilot between the same O-D pair. One of the more popular stops shifted location after Period 2, causing some former indirect feeders to turn into inconvenient or remote trips, but this shift was not solely responsible for the increase; the combined total of transit-poor trip types (indirect feeders, inconvenient trips, and remote trips) grew from 65% in Period 2 to 76% in Period 3a.
Trip Types by Period
Changes in Intermodal Competitiveness
Table 4 lists the competitiveness between rides and alternative trip options using transit, walking, and cycling. Transit and walking alternatives were almost never faster than the ride, although for very short rides, walking was potentially faster if the ride wait time was considered. Cycling was the only alternative that had a noticeable share of trips for which it was faster than ridesourcing, which increased after Period 1. Even though walking was the slowest option, there were more cases in Periods 3a and 3b for which it was faster than taking transit even without transit trip wait time being considered. When transit trip wait time is considered, walking was faster for a sizable percent of trips, especially in the first and last periods. In Periods 1 and 2, cycling was slightly less competitive against transit when removing wait time, which was because of the specific spatial/temporal characteristics of trips going to one transit stop (Hagey/Columbia). This stop was moved for other reasons in Periods 3a and 3b, resulting in the same percentage for those periods.
Intermodal Competitiveness Statistics by Period
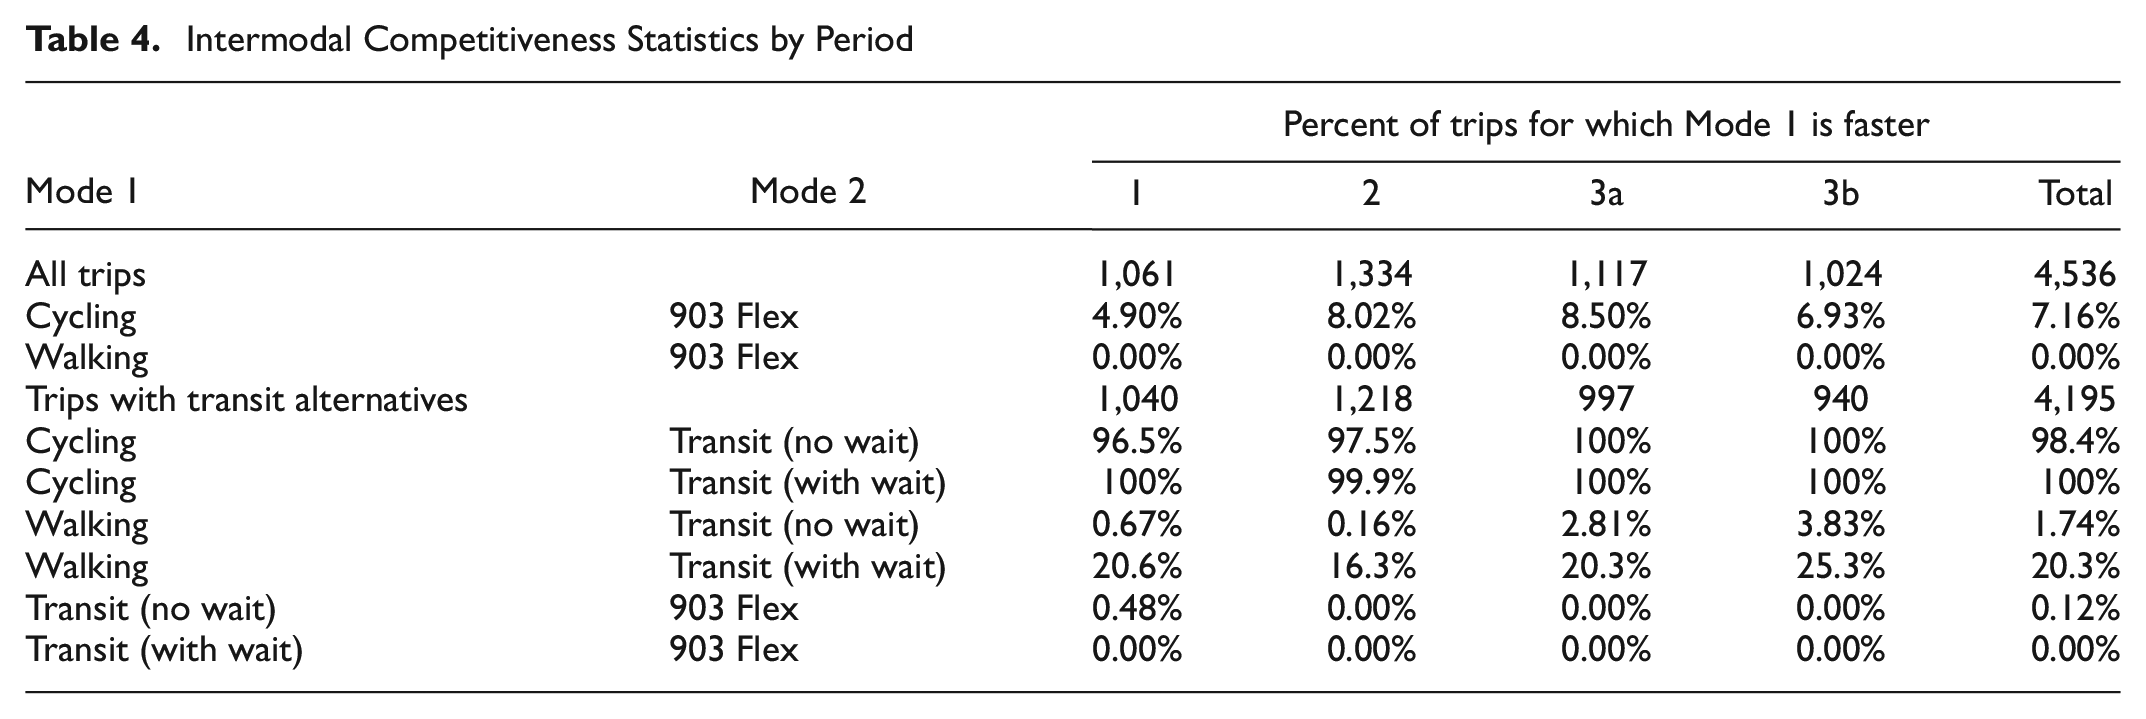
Figure 7 shows the trip types taken in each period, separated by the number of transfers required for the transit alternative. No alternative transit trip required more than one transfer. Direct feeders and nontransit trips were excluded since those trip types have no transit alternatives. The greatest difference between trip categories was that trips requiring a transfer had a higher share of transit replacements (13% to 63% versus 6% to 23% of trips per period). Trip types in the zero-transfer case generally mirrored the overall results since trips with zero transfers made up 82% of the overall transit alternative trips in the pilot.
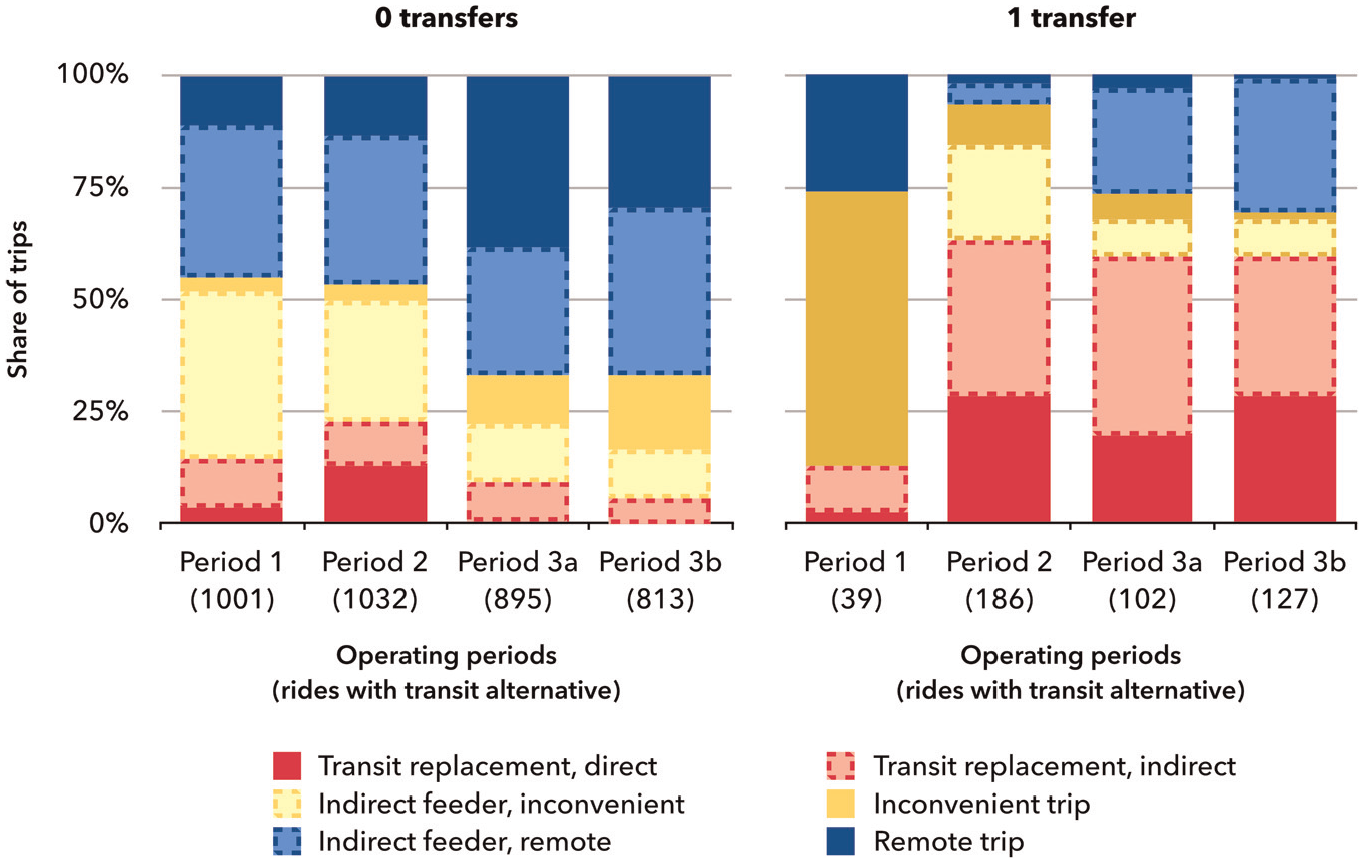
Trip types by number of transfers required by period.
Figure 8 shows the payment methods of users with different trip-making frequencies across each period. Stored-value transit cards were launched in March 2019 (Period 1) and became more dominant across all three user bins. In Period 2, two promotions (one for the LRT launch, one targeted at the 903 Flex) resulted in free trips being the dominant “payment” method. Other forms of payment, which include cash, credit card, and missing payment methods, were a larger share for infrequent users and almost negligible for frequent users. Transfers were present across all periods for all user bins: infrequent users paid with transfers as a higher share of their trips in some periods, average users used them at a fairly consistent rate, and frequent users used them more in later periods. Payments using transfers is an indicator of connectivity with transit: a transfer payment suggests that the ride was part of a greater trip chain that included fixed-route transit, and that it was likely these trips came after the fixed-route transit trip in the chain, since the users already had the transfer.
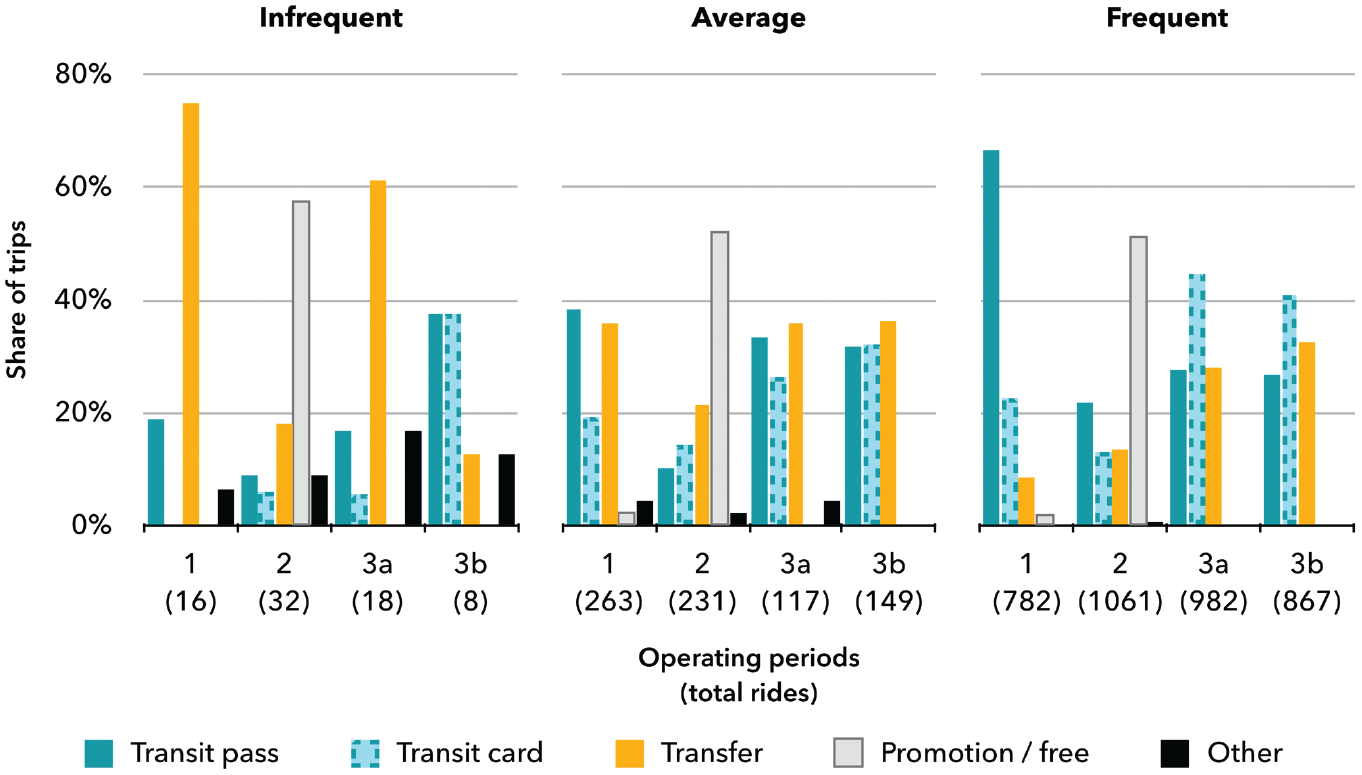
Payment methods by trip-making frequency by period.
Discussion
Daily ridership increased in the later periods of the pilot, suggesting that not only were users making more bookings in aggregate, but existing users were making more frequent trips over time. Consistent with previous findings ( 18 ), user trips appeared to fluctuate less in later periods as users adapted to the pilot’s operating parameters. Although individual frequent-user trip types did not change greatly, frequent users as a whole shifted toward less transit-competitive trip types, whereas average and infrequent users had a sporadic but generally larger share of more transit-competitive trip types. The higher share of transit replacements among less frequent groups could be the result of sporadic temporal issues more than spatial ones: users may have just missed a transit connection, or their bus may have been out of service, and they were looking for the next best option. These findings suggest that the 903 Flex may have gained success over time had it been continued, but ultimately it was not meeting the desired ridership levels of 7 to 14 passenger boardings per hour ( 26 ).
Rides and their alternatives had fairly stable trip times across all periods of the pilot. The biggest change was after the transit network redesign (which coincided with the launch of the LRT system) at the start of Period 2, which changed the frequency and trip types, but the lengths of those trips were fairly constant. The shift from peak-hour service to all-day service in Period 1 appeared to introduce a sharp increase in ridership, which makes sense when considering that most trips were taken during off-peak midday and evening service. Users may have been using the 903 Flex during periods when transit was less frequent, which indicates the pilot may have been valuable for nonwork trip-making. Spatially, trip types trended away from indirect feeders and more toward transit-supportive or complementary modes, suggesting that most 903 Flex trips competed less with transit network over time. There was a sharp increase in transit replacements in Period 2, which is likely because of the number of free promotions that were available during the period.
Trips that would have been made with one transfer using transit had a much higher share of transit replacements than those requiring no transfers. This finding suggests that transfers may be a large driver in transit replacements, since they extend the wait time between routes and introduce uncertainty in travel times. This finding is consistent with other literature ( 27 ), which indicates that transfers significantly deter transit use.
Twenty-three percent of users paid with transfers, suggesting that these users were connecting from transit. The high incidence of transfers among infrequent and average users suggests these users were using ridesourcing to address a gap in the transit system. Over time, frequent users began to pay with transfers more frequently, further suggesting these trips were specifically part of a fixed-route transit trip chain. Sixty percent of all users paid with transit passes in Period 1, shifting to 20% to 30% per period in the later periods, which may indicate that the initial user base consisted of more frequent transit users, and that from Period 2 onward, the pilot was able to reach people who may not regularly use fixed-route transit.
Across multimodal alternatives, transit trip alternatives were not temporally competitive with rides. Cycling was competitive with 5% to 10% of rides and was consistently faster than the corresponding walking and transit alternatives. Walking was not a feasible alternative to rides in most cases, and variably competed with transit. Improved cycling infrastructure in this area could potentially improve connectivity to transit.
Limitations
One limitation of the trip alternative generation method was that alternatives assumed passengers would take the trip with the least amount of walking time overall, which may not reflect true user preferences. For cycling alternatives an equal weighting was given to speed, bike-friendliness, and elevation, which may not have reflected the passengers’ preferences.
There was an inherent selection bias among users who were attracted to the pilot, limiting the generality of conclusions about travel behavior more broadly. The authors did not have access to demographic data about the 903 Flex service users outside of the voluntary survey. Metrics such as the age of users, gender, income, and disability status would have been useful in understanding the extent to which these factors influenced passenger behavior.
This study assumed that all trips started and ended at virtual stops. “Real” trip alternatives would likely be based off passengers’ true origins and destinations. Because the pilot was restricted to one neighborhood, there was also an inherent limit to which trips could be made. Although this pilot suggests that transit replacements were in the minority of trip types despite users having no restrictions on their trip-making behavior, this characteristic may not apply to larger pilots for which a greater service area is implemented.
Conclusions
This study conducted a longitudinal analysis of users in a ridesourcing pilot, considering trip types, payment methods, behavioral changes, and competitiveness with other modes. The data suggest that most trips taken across the pilot duration were complementary to the transportation network and progressed toward more transit-supportive trip types. Although the trends from the 903 Flex pilot were generally positive, over 16% of trips competed with transit, peaking during the promotional period. Agencies should take care in the future to avoid duplication in services, and to avoid detracting users away from existing transit infrastructure.
Ridesourcing projects show potential as supplementary services that can integrate with existing public transportation systems to expand mobility options. Better accounting for multimodal journeys, motivations for increasing user adoption over time, the spatial resolution, and expanding the temporal scope of study would improve the transit agency’s understanding of how to best implement ridesourcing projects. These findings could lead to the formulation of best practice for future transit ridesourcing-integrated systems, and motivate agencies to collect and share ridesourcing data for improved decision making and knowledge dissemination. Using the updated trip-type methodology, agencies engaging in partnerships in the future should limit or discourage transit replacements if they identify that passengers are taking too many of them.
Future research should continue to investigate which socioeconomic or service-related factors encourage people to become frequent users and improve estimates of how many passengers use ridesourcing as part of a multimodal journey.
Footnotes
Acknowledgements
The authors thank Will Towns of Grand River Transit for providing the ridesourcing pilot bookings for analysis, and his insights into interpreting the data.
Author Contributions
The authors confirm contribution to the paper as follows: study conception and design: E. Swarney, J. Terry, C. Bachmann; data collection: J. Terry; analysis and interpretation of results: E. Swarney, J. Terry, D. Feng, C. Bachmann; draft manuscript preparation: E. Swarney, J. Terry. All authors reviewed the results and approved the final version of the manuscript.
Declaration of Conflicting Interests
The author(s) declared no potential conflicts of interest with respect to the research, authorship, and/or publication of this article.
Funding
The author(s) received no financial support for the research, authorship, and/or publication of this article.