
Abstract
Three primary policy changes on truck size and weight occurred in Canada over the past five decades: the 1974 Western Canadian Highway Strengthening Program, the 1988 Roads and Transportation Association of Canada Memorandum of Understanding on Heavy Vehicle Weights and Dimensions, and ongoing special permitting of longer combination vehicles. These regulatory changes influenced the gross vehicle weight (GVW) of the predominant truck configurations operating on principal Canadian highways. Using a unique time-series of truck weight data, this retrospective longitudinal study contributes insights about the magnitude and timing of the impacts of truck weight regulatory changes on operating GVWs that address current knowledge gaps and persistent uncertainties in models used to predict and evaluate truck weight regulatory changes. The analysis reveals that carriers hauling heavy (i.e., weigh-out) commodities adapt immediately to increases in GVW limits if there is no need to purchase new vehicles. When a regulatory change coincides with the introduction of a new, more productive vehicle configuration, the uptake of the new vehicle lags behind the regulatory change by a few years. Finally, configurations exhibit different GVW distributions and responses to increased GVW limits depending on whether the configurations are well suited for hauling weigh-out or cube-out commodities. This differential response demonstrates how regulations facilitate fleet diversity within the trucking industry’s approach to the road freight transport task.
Over the past several decades, the trucking industry has responded to considerable growth and change in the demand for road freight transport, the availability of new technologies, and a complex and ever-evolving regulatory environment. Truck regulations define and control, inter alia, truck size and weight (mass), dynamic vehicle performance, safety requirements, vehicle and driver credentials, energy use, and emissions. Despite the ongoing need to modify existing or introduce new truck regulations, research and practice consistently demonstrate the difficulty of predicting and understanding the impacts of proposed regulatory changes regardless of the regulatory context (1–3).
Governments contemplate changes—usually increases—in truck size and weight limits to increase truck productivity and minimize regulatory barriers between jurisdictions. These outcomes must be considered alongside the positive or negative impacts on vehicle and system safety, infrastructure (bridges, pavements, and road geometry), energy use and emissions, modal competition and diversion, and regulatory compliance (4–8).
An ex ante analysis of the various impacts of truck size and weight regulatory change relies on the ability to model future truck activity in relation to the total distance traveled by prospective truck configurations, the networks on which such travel will occur, and the distribution of operating weights of these configurations (6, 7). Previous studies have developed truck activity estimates through a detailed characterization of freight transport demand, a modal diversion analysis, and the estimation of the number and nature of truck trips required to meet future demands (6, 7, 9, 10). The reliability of these methods for estimating the effect of policy changes has been questioned, calling for research that addresses methodological limitations and validates assumptions and predictions using empirical data (1, 11). Naturally, uncertainties in truck activity estimates propagate through to the analysis of the impacts of regulatory changes. In some cases, these uncertainties have precluded policy action ( 3 ). Consequently, the development of improved technical approaches to predict, validate, and understand the significance and outcomes of truck size and weight policy changes is both relevant and essential.
Given the limitations and uncertainties of ex ante analyses, a recent Transportation Research Board (TRB) Consensus Study Report calls for ex post research that documents empirical evidence of truck activity following truck weight regulatory changes ( 1 ). Citing an earlier TRB study published in 2002, the Consensus Study Report asserts that “responsible regulation is a process: the regulatory authority should do the best prior analysis possible, but once regulations have been changed, the consequences must be systematically observed and adjustments made where necessary” ( 3 ). While such systematic observation may be limited by the inability to control exogenous variables, given a suitable time-series of data, it could produce insights to help refine predictive modeling approaches.
This paper presents an ex post analysis of the impact of historic truck weight regulatory changes on the operating gross vehicle weight (GVW) of predominant truck configurations in Canada. In doing so, the article addresses the following research questions: How do operating GVW distributions change when axle and GVW limits are relaxed? How do these changes differ for predominant truck configurations? How long does it take for the trucking industry to respond to truck weight regulatory changes? In part, the paper answers the call issued by the TRB in 2002 and reiterated in its most recent elucidation of truck size and weight research needs (1, 3).
The retrospective analysis utilizes a longitudinal truck weight dataset collected in Manitoba, Canada over the past 45 years. In this time, Manitoba and its neighboring western Canadian provinces have experienced several major changes in truck weight policy. Thus, the analysis reveals observed changes in truck operating weights without attempting to model these changes. Although the results stem from data collected in Manitoba, the general trends and observations provide insight to policy makers in other jurisdictions.
The remainder of this paper is structured as follows. The second section synthesizes the literature on the impacts of truck weight regulatory change on truck operating weights. The third section outlines the historic truck weight regulatory changes in Manitoba, Canada. The fourth section describes the data sources and data screening procedures. The fifth section presents and discusses the results of the analysis of truck operating weights for predominant truck configurations. The sixth section outlines limitations of the analysis. The final section summarizes key contributions and presents concluding remarks.
Literature Review
In 2019, TRB published a Consensus Study Report ( 1 ) that comprised a research plan to address limitations in the data and impact models that had affected the reliability of previous national-scale truck size and weight study results (6, 7). The plan is the latest in a series of TRB Special Reports that have evaluated proposals and issues related to truck size and weight regulations in the U.S.A. ( 12 ).
In 1986, TRB Special Report 211 evaluated industry utilization of twin trailer trucks and their safety and infrastructure consequences. These vehicles became widespread in the U.S.A. in the early 1980s ( 13 ).
As a follow-on from the 1986 study, Special Report 223 examined the issue of access from terminals to the primary network for large trucks with regard to vehicle handling (safety) and pavement impacts ( 14 ).
In 1990, Special Report 225 examined the implications of eliminating existing grandfather provisions on highways, removing GVW and axle limits in favor of a bridge formula, adjusting the existing bridge formula, and modifying treatment of specialized hauling vehicles for seven alternative scenarios. The study recommended a new bridge formula, the implementation of special permit programs, the retention of grandfather rights, increased enforcement, and more standardized limits at a regional level ( 15 ).
Also in 1990, Special Report 227 presented the Turner Proposal, which envisioned new truck configurations that would reduce pavement wear and increase transportation efficiency by increasing the number of axles and GVW ( 16 ).
In 2002, Special Report 267 recognized that opportunities existed to improve the efficiency of the highway freight transport system by reforming federal truck size and weight regulations, which had remained unchanged for more than a decade. It noted that previous studies (e.g., 6, 15) had not produced satisfactory estimates of the effects of regulatory change, but determined that the inevitable uncertainty should not justify inaction. The study recommended organizational arrangements to promote change in the current regulations, including pilot studies, federal regulatory changes, and additional research ( 3 ).
A persistent shortcoming identified in these studies is the need to predict changes in truck configurations and weights, axle loadings, traffic operations, and the total number of trips and distance required to haul freight types resulting from regulatory changes ( 7 ). Comprehensive truck size and weight analyses rely on mode shift models (e.g., based on economic elasticities) to predict the future modal share of the freight transport task allocated to trucks. Such analyses subsequently distribute freight between prospective truck configurations based on available evidence (e.g., pilot studies) and stated preference surveys. However, the predicted allocation of freight to various truck configurations and the resulting operating GVWs are difficult to validate. This leads to uncertainties in the estimates of future activity and concomitant impacts on infrastructure (7, 17), operations and safety (7, 18), energy and the environment (19, 20), and regulatory compliance ( 7 ). Thus, despite considerable previous research, the 2019 Consensus Study Report reiterates the need for data and models that could more accurately estimate the impacts of changing truck size and weight limits and support more meaningful policy action.
While TRB’s research plan focuses specifically on needs in the U.S.A., it recognizes the potential value of drawing from international experience. Useful insights may be learned from thorough study of research and practice related to truck size and weight regulations in European nations, Australia, and elsewhere (4, 21, 22). However, a retrospective analysis of the Canadian experience—as will be provided in this article—is perhaps most instructive as a response to the call in the 2019 Consensus Study Report, given Canada’s geographic proximity to the U.S.A. ( 8 ).
In Canada, several truck size and weight regulation changes over the past five decades have affected the GVW distribution of trucks operating on primary highways across the country and especially in the Prairie Provinces. According to Woodrooffe et al. ( 8 ), the implementation of these policy changes has not only increased truck operating weights, but has also harmonized the regulatory environment, improved trucking productivity, and encouraged the utilization of configurations that meet dynamic performance requirements.
Previous studies on the Canadian truck regulatory changes have presented observations on changes in truck fleet, truck costs and rates, shipping sizes and initial trucking industry responses (23–25). Other studies examined the physical and loading characteristics of trucks between 1974 and 1984 ( 26 ) and developed models of the GVW and axle weight distributions as a function of weight limit over the 1972 to 1986 timeframe ( 27 ). However, none of this work examined the impacts of more recent changes in GVW distributions, as will be presented in this article.
Description of Regulatory Changes in Manitoba, Canada
In Canada, three primary truck size and weight regulatory changes have influenced trucking activity over the past five decades: (i) the 1974 Western Canada Highway Strengthening Program (WCHSP) (and its derivatives), (ii) the 1988 Roads and Transportation Association of Canada Memorandum of Understanding on Heavy Vehicle Weights and Dimensions (RTAC MoU), and (iii) regional policies in relation to routine special permitting of longer combination vehicles ( 24 ). In addition to these primary policy changes, the Province of Manitoba, like its provincial counterparts, has implemented changes to the allowable GVWs on specified portions of its highway network.
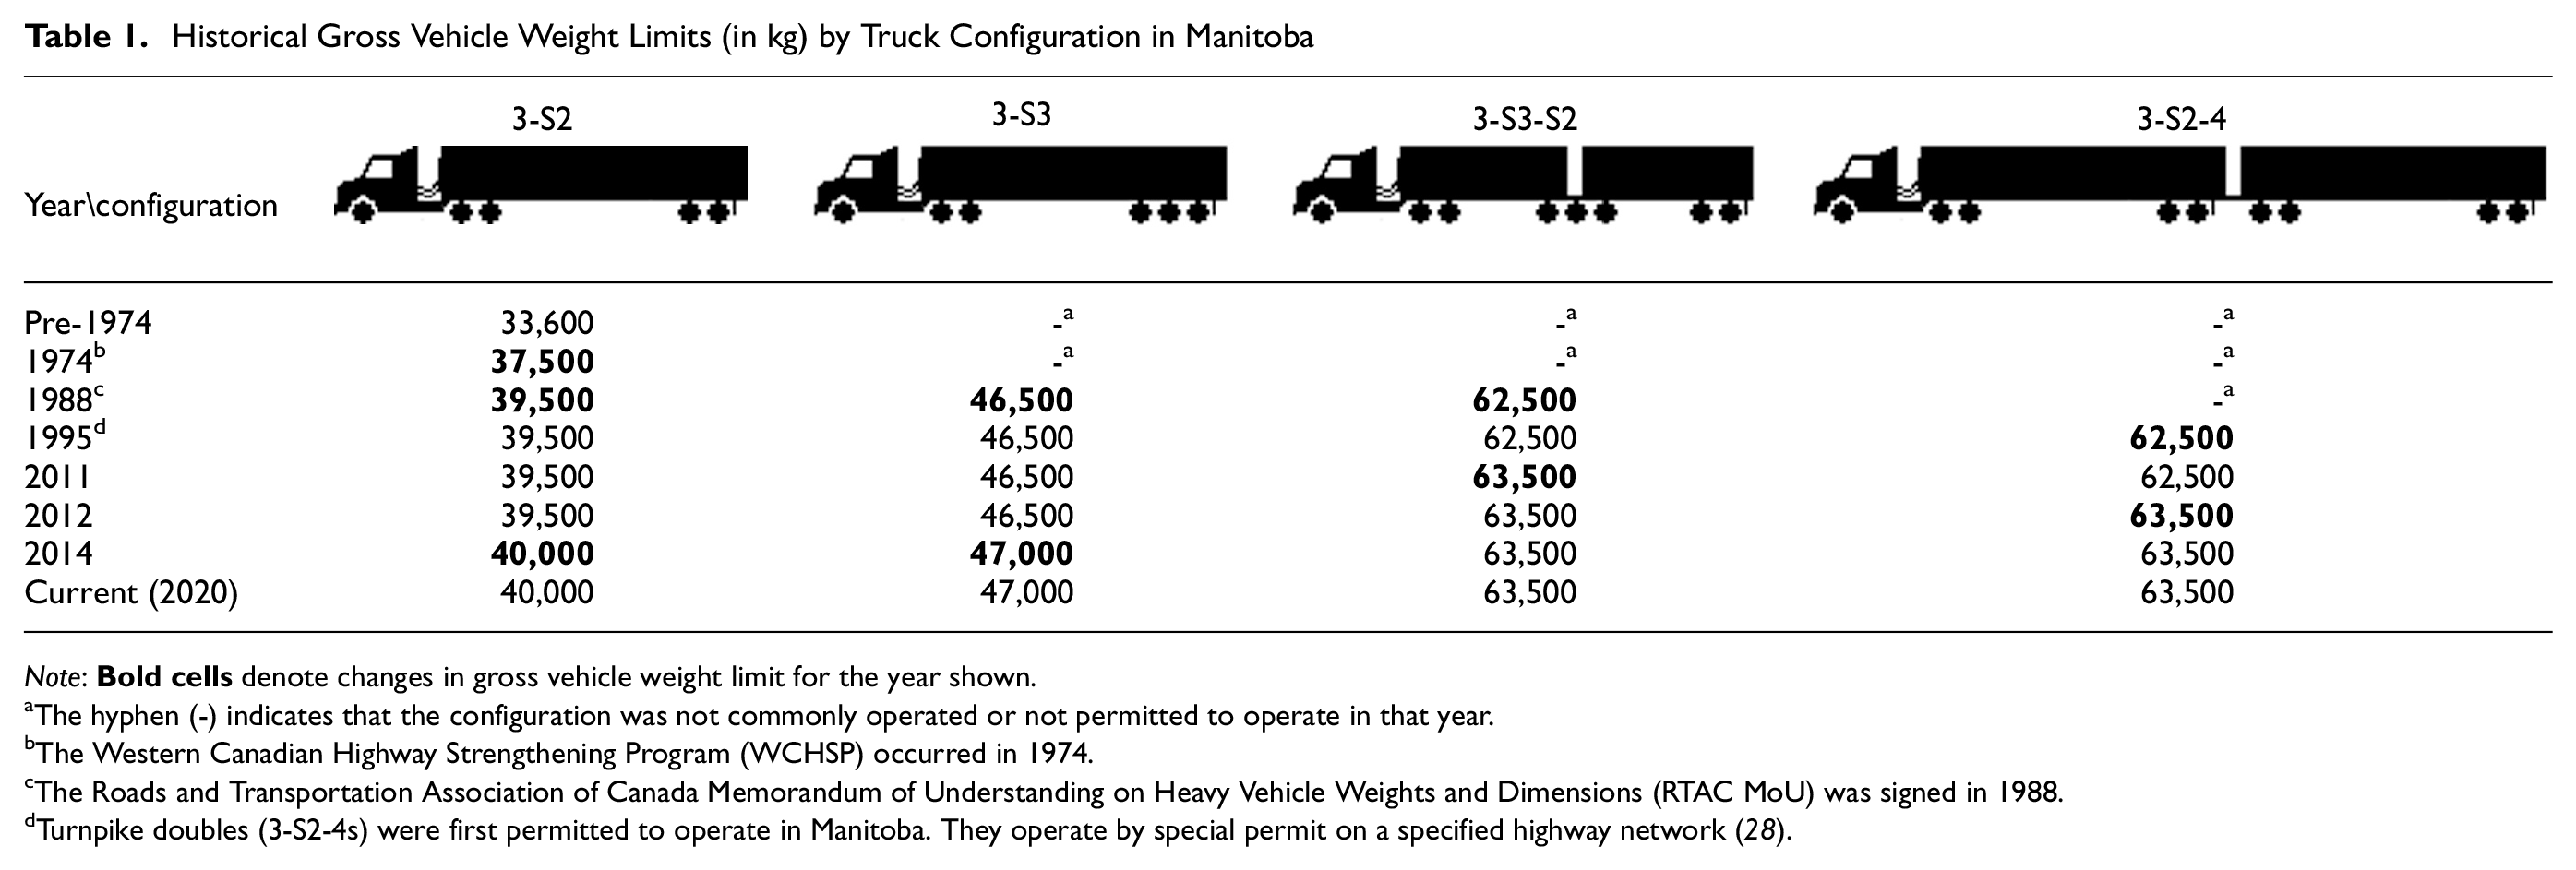
For the purpose and scope of this longitudinal study, this section provides a brief discussion of the allowable GVWs resulting from these regulations. Woodrooffe et al. ( 8 ) provide a detailed description of the Canadian experience with truck regulatory changes. Table 1 summarizes the maximum allowable GVWs over time and shows schematics of the four truck configurations studied in this article: a five-axle tractor semi-trailer (3-S2), a six-axle tractor semi-trailer (3-S3), an eight-axle B-double (3-S3-S2), and a turnpike double (typically comprising nine axles in a 3-S2-4 configuration, as shown). These four configurations were selected for the analysis because they represent a significant portion of the current truck fleet in Manitoba and have each been affected by truck weight regulation changes.
Historical Gross Vehicle Weight Limits (in kg) by Truck Configuration in Manitoba


Note:
The hyphen (-) indicates that the configuration was not commonly operated or not permitted to operate in that year.
The Western Canadian Highway Strengthening Program (WCHSP) occurred in 1974.
The Roads and Transportation Association of Canada Memorandum of Understanding on Heavy Vehicle Weights and Dimensions (RTAC MoU) was signed in 1988.
Turnpike doubles (3-S2-4s) were first permitted to operate in Manitoba. They operate by special permit on a specified highway network ( 28 ).
1974 WCHSP and Subsequent Derivatives
The 1974 WCHSP was the result of federal funding directed toward the Prairie Provinces (Alberta, Saskatchewan, and Manitoba) to assist in the strengthening of pavements and bridges provided that these provinces allowed increased size and weight regulations on a primary road network. Following this program, the Prairie Provinces replaced the single/tandem/GVWs of 8,200/14,600/33,600 kg with 9,100/16,000/50,000 kg on primary highways. This change had an immediate effect on 3-S2 configurations and also permitted six- or seven-axle double trailers. In 1982, further weight increases occurred on both primary and secondary highways. These increases affected seven-axle double trailers and eight-axle A and C-doubles, allowing them to operate at the full GVW limit obtained by summing the allowable axle weights. While somewhat prominent at the time, relatively few of these configurations remain operational today and therefore these configurations were not considered in this article or in Table 1 ( 24 ).
1988 Roads and Transportation Association of Canada Memorandum of Understanding on Heavy Vehicle Weights and Dimensions and Subsequent Derivatives
In an attempt to create national uniformity and facilitate interprovincial movement of freight in Canada, a Vehicle Weights and Dimensions Study was conducted to develop preferred vehicle weights, dimensions, and configurations that could be used on major highways across the country ( 29 ). Based on the conclusions and recommendations of this study, a memorandum of understanding (i.e., the RTAC MoU) was signed nationally in 1988.
To further increase axle weights beyond those allowed by the WCHSP, the technical study analyzed and ultimately recommended implementation of a tridem axle group, which was previously not recognized in the Prairie Provinces ( 8 ). The tridem axle was limited to a maximum weight of 21,000 kg for an axle spread of 2.4 m to 3.0 m, 23,000 kg for an axle spread of 3.0 m to 3.6 m, and 24,000 kg for an axle spread of 3.6 m to 3.7 m ( 30 ). It could be added to a semi-trailer (to form a 3-S3 configuration) or used as the coupling device for a double-trailer configuration (the eight-axle B-double, which is normally configured as 3-S3-S2). The study found this eight-axle B-double to have superior dynamic performance and therefore these configurations were given a weight advantage over A- and C-double configurations in the RTAC MoU ( 8 ). As a result, B-doubles became one of the more prominent configurations in the truck fleet after the RTAC MoU ( 24 ).
As shown in Table 1, two amendments to the RTAC MoU have increased allowable GVW limits in Manitoba since 1988. First, in June 2011, regulations under the Manitoba Highway Traffic Act were amended to allow a 1,000 kg increase to the allowable GVW on specified RTAC routes in Manitoba, including the entire Trans-Canada Highway. Before 2011, Manitoba was the only province in Canada that had not allowed the B-double GVW limit increase from the 62,500 kg specified in the RTAC MoU to 63,500 kg. Since 2011, an increasing number of routes have been added to the “Super-RTAC” network ( 31 ). Second, a June 2014 amendment allowed for a 500 kg increase to the maximum allowable steering axle weight. This increase was intended to offset additional weight for exhaust emission control technologies, wildlife protection, and other equipment added to the truck itself and therefore may not induce a meaningful payload response.
Ongoing Permitting of Longer Combination Vehicles
Longer combination vehicles (LCVs) are truck configurations consisting of a tractor and two or three trailers or semi-trailers that exceed basic vehicle length limits but remain in compliance with basic weight restrictions ( 28 ). This article focuses on turnpike double configurations only, which started operating in Manitoba after 1995 ( 32 ). These operations occurred on a specified portion of the divided highway network subject to the GVW limits identified in the RTAC MoU for vehicles with eight or more axles. Since that time, turnpike doubles have represented an increasing proportion of the overall LCV fleet operating on the Trans-Canada Highway west of Winnipeg ( 33 ) and are the most widely permitted LCV configuration ( 28 ). In 2012, an agreement between the governments of British Columbia, Alberta, Saskatchewan, and Manitoba developed standards for the operation of LCVs in those provinces, demonstrating the desire to create a more cohesive interprovincial transportation environment. This MoU allowed for A-, B-, and C-coupled turnpike double (3-S2-4) configurations to operate at a 63,500 kg GVW limit on a specified road network that connected most of the major urban centers in western Canada ( 28 ).
Data
Data Sources
The data presented in this longitudinal study include both published and unpublished on-road truck surveys conducted since the early 1970s by the Manitoba provincial government and the University of Manitoba Transport Information Group (UMTIG) at the Headingley and West Hawk weigh scales. These surveys were conducted for various research purposes (e.g., see 24, 26, 27, 34, 35) and, as such, had differing durations and data collection times typically designed to capture weekly and seasonal truck traffic trends. However, the general aim of the surveys was to establish a longitudinal truck weight dataset to monitor changes in truck operating weights.
As shown in Figure 1, the Headingley weigh scale is located approximately 7.5 km west of Winnipeg on the Trans-Canada Highway (PTH 1). This scale processes interprovincial and intra-provincial truck traffic and is a major link for turnpike double truck operations in western Canada. The West Hawk weigh scale is located approximately 1.2 km west of the Manitoba-Ontario border on PTH 1. Most of the traffic moving through this scale is interprovincial and trucks must comply with both the Manitoba and Ontario truck size and weight regulations. Because Ontario prohibits the use of LCVs in this region, no turnpike doubles were observed. A permanent, static weigh scale is also located in Emerson; however, this article focuses on the truck traffic movements on PTH 1.
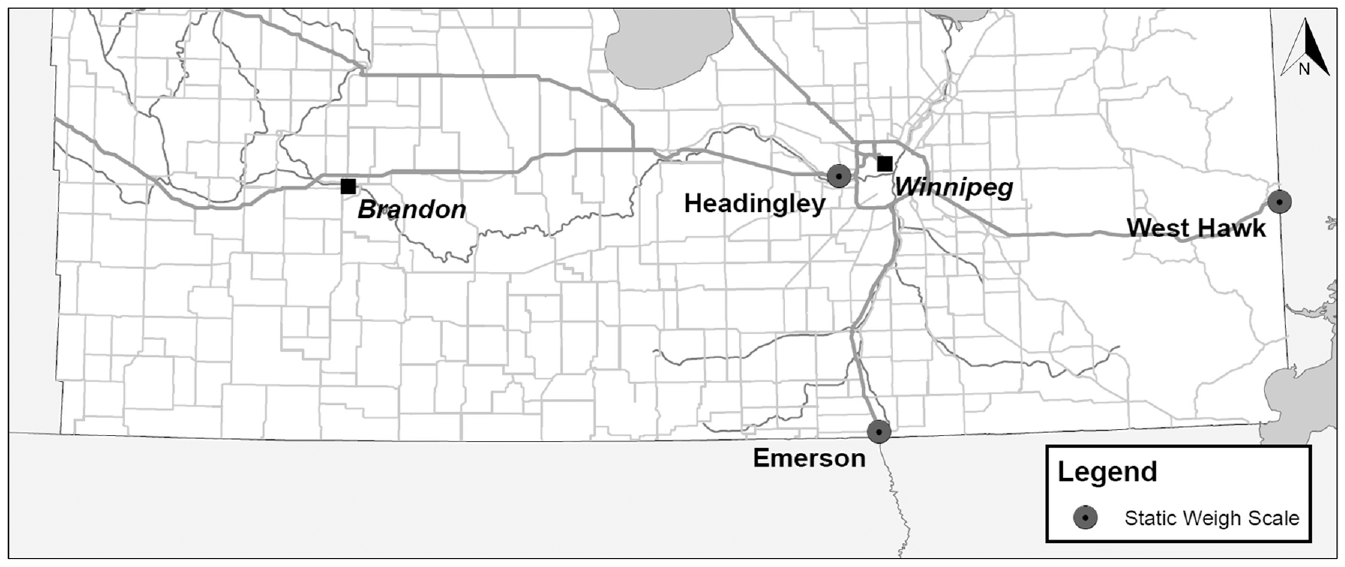
Static weigh scale locations in Manitoba, Canada.
For the analysis presented in this article, any truck survey dataset with more than 100 records for the sample year was included in the analysis, regardless of whether the data were collected at the Headingley or West Hawk scale. When available, the data collected in a given year were combined from these two weigh scales to provide a larger sample size. In total, the analysis included 32,147 GVW records collected over 17 sample years at the two scales. Table 2 presents the sample size at each static weigh scale location.
Number of Trucks Observed in Each Year Considered in the Longitudinal Study
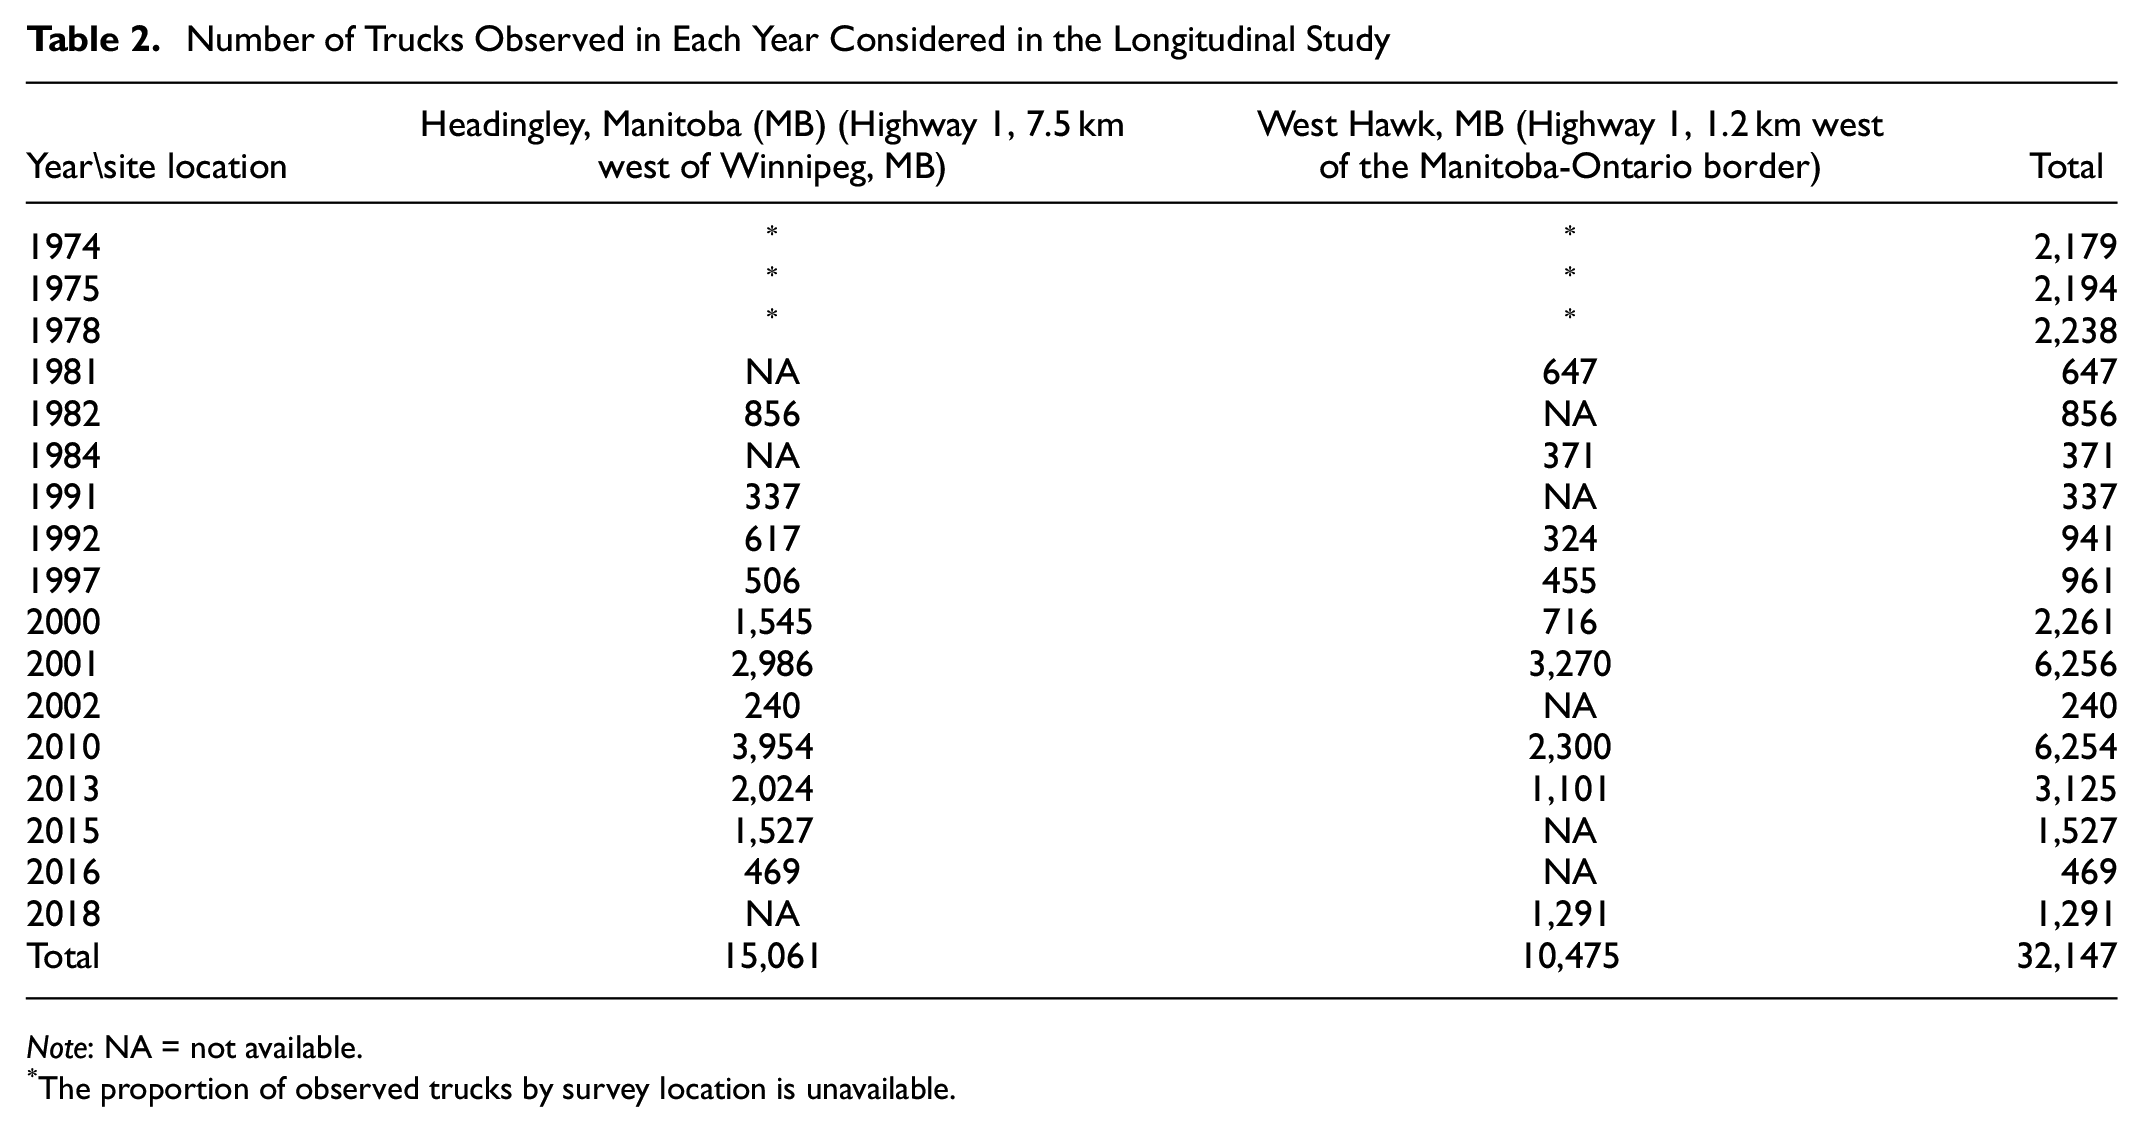
Note: NA = not available.
The proportion of observed trucks by survey location is unavailable.
Differences in the proportion of observed trucks at the two weigh scales over time are not expected to influence the findings relating to the recorded GVWs because the two locations are subject to the same truck weight regulations. In other words, for the purpose of examining regulatory impacts, the GVW distribution for 3-S2s observed at Headingley is not expected to vary significantly from the GVW distribution for 3-S2s observed at West Hawk. The dataset comprised 23,530 3-S2s, 5206 3-S3s, 2708 eight-axle B-doubles, and 703 turnpike doubles.
Data Screening and Analysis Methods
Throughout the study period, a truck’s GVW was consistently determined by recording and summing the weights of individual axle groups. These axle group weight readings require user input and are therefore subject to normal human error. The datasets were screened to prevent unrealistic values from skewing the GVW distributions. Following the same criteria used in previous studies ( 34 ), axle group weights less than 1,500 kg and more than 150% of the allowable load limit were deleted from the dataset. Only entries with valid axle group weights were considered in the analysis.
There is also potential for mistakes in classifying vehicles. For example, from 2000 to 2002, there were a small number of 3-S2s with unusually high rear tandem axle loads, suggesting that these may have actually been 3-S3s. Unless an error could be confirmed, records suspected of containing such errors remained in the dataset for subsequent analysis.
To test for differences between the GVW distributions, under a null hypothesis that both samples came from a population with the same distribution, the two-sample Kolmogorov-Smirnov test was used at a significance level of α = 0.05.
Observations and Insights
This section presents observations and insights about the impact of truck weight regulatory changes on the GVW distributions for the four truck configurations identified in Table 1, namely: five- and six-axle tractor semi-trailers, and eight-axle B-doubles and turnpike doubles.
GVW Distributions for Five- and Six-Axle Tractor Semi-trailers (3-S2s and 3-S3s)
In the early 1970s, 3-S2s (and other single-trailer configurations with five or fewer axles) comprised nearly the entire articulated truck fleet in Manitoba. While this configuration remains the most common type of articulated truck in Manitoba, it currently comprises approximately half of the trucks operating on the Trans-Canada Highway ( 24 ). The GVW limit for 3-S2s in Manitoba increased three times during the study period: in 1974, 1988, and 2014. Figure 2 shows the GVW cumulative frequency distributions from selected years ranging from 1974 to 2018 and Figure 3 presents the box-and-whisker plots for the available GVW data.
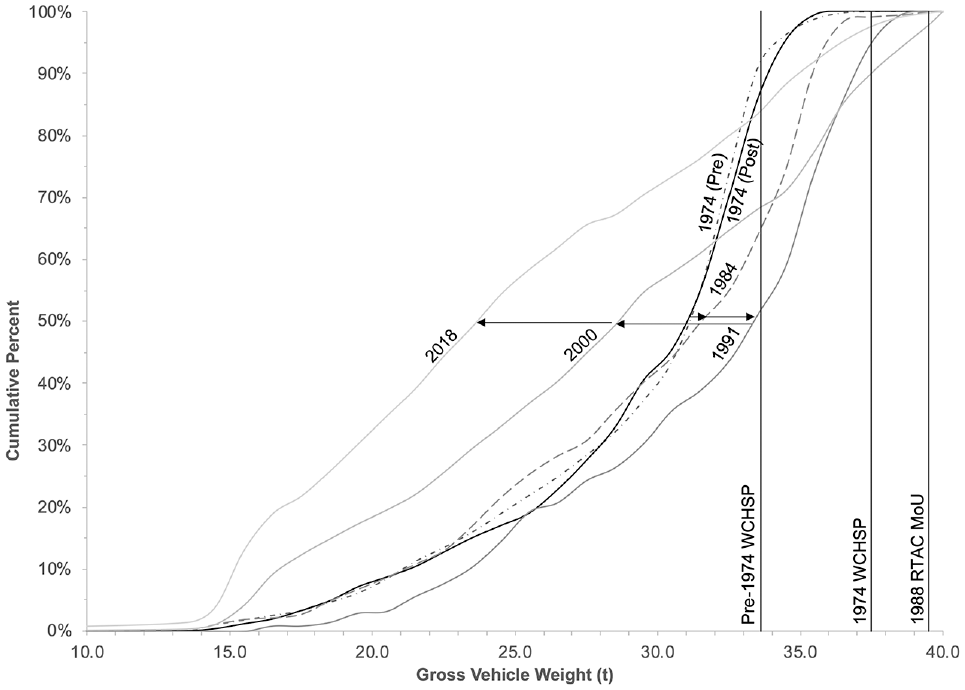
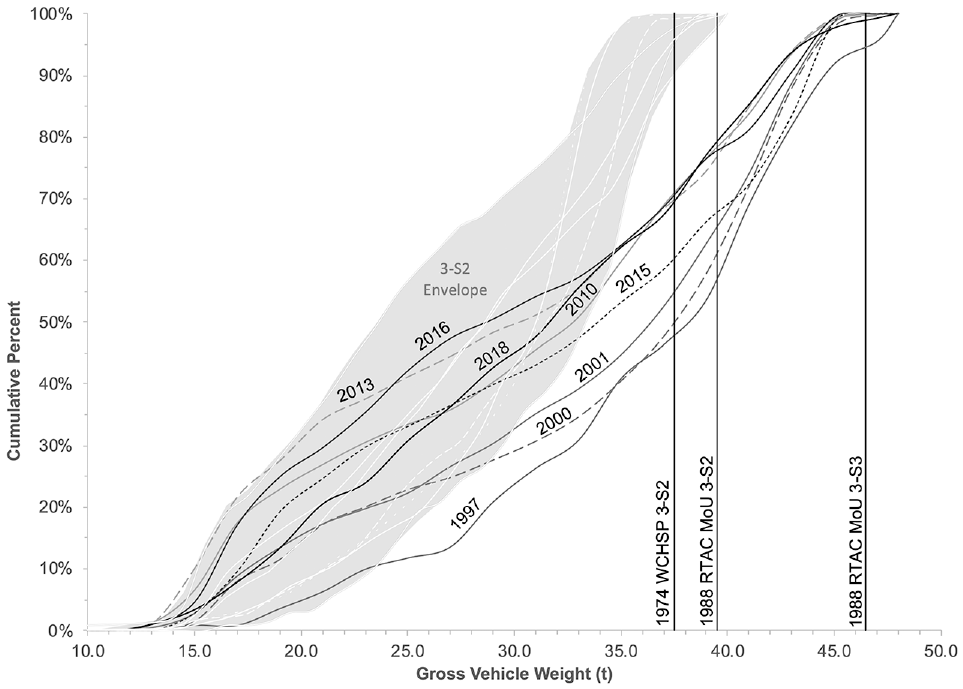
Cumulative frequency distributions for 3-S2 GVWs in Manitoba: 1974–2018.
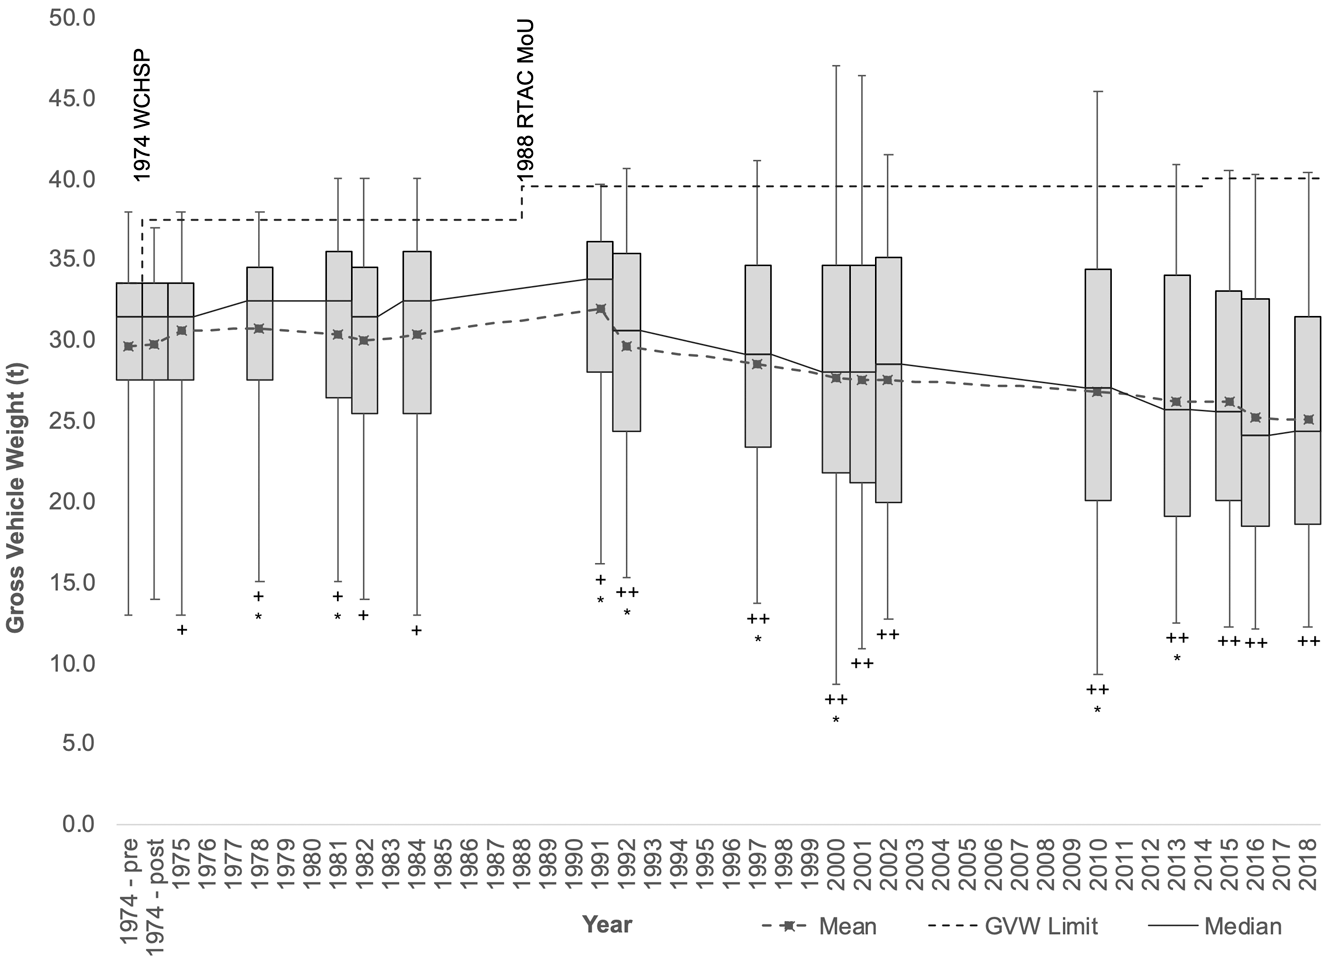
Box-and-whisker plots for 3-S2 GVWs in Manitoba: 1974–2018.
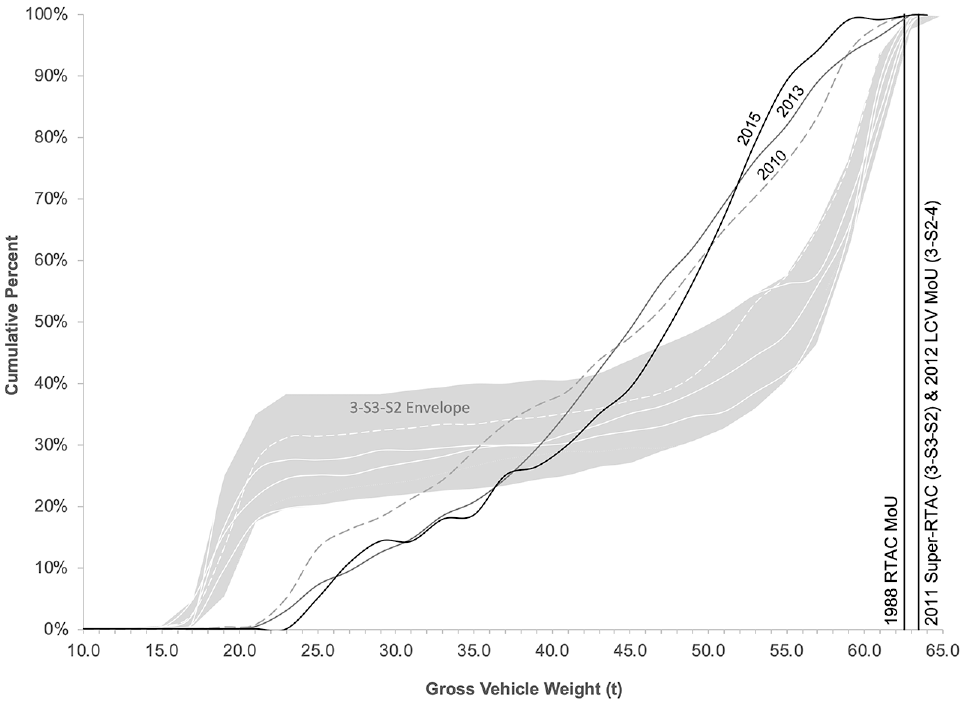
Unlike 3-S2s, 3-S3s only emerged in the truck fleet following the introduction of tridem axles pursuant to the RTAC MoU in 1988. Although data availability has limited the 3-S3 study period to the years 1997 to 2018, previous research showed the emergence of 3-S3s in 1989 and by 1997, 3-S3s represented approximately 25% of Manitoba’s articulated truck fleet operating on the Trans-Canada Highway ( 24 ). The GVW limit for 3-S3s has increased once since their introduction: a 500-kg increase in 2014. Figure 4 shows the 3-S3 GVW cumulative frequency distributions during the study period. To provide context, the figure includes the 3-S2 GVW distribution envelope and the relevant 3-S2 and 3-S3 GVW limits. The 3-S3 GVW limit shown in the figure indicates the absolute maximum GVW based on a tridem axle limit of 24,000 kg.
Cumulative frequency distributions for 3-S3 GVWs (labeled lines) in Manitoba: 1997–2018.
Figures 2–4 reveal the following observations and insights about changes in the operating GVWs of 3-S2s and 3-S3s throughout the study period.
Figure 2 reveals an immediate (though limited) response to the increased 3-S2 GVW limit following the 1974 WCHSP. Despite a statistically insignificant change between the two distributions, the response is apparent from the rightward shift of the heavier observations in the 3-S2 GVW distributions when comparing the pre-WCHSP distribution (data collected from January to August 1974) and the post-WCHSP distribution (data collected from September to December 1974). Since no change in configuration accompanied this GVW limit increase, it appears that carriers could immediately take advantage of the increase by adding payload when hauling freight that would previously have caused the truck to weigh-out (i.e., reach its weight capacity before reaching its cubic capacity).
As shown in Figures 2 and 3, the initial trend toward heavier 3-S2 GVWs observed in 1974 persists until circa 1991—three years after the RTAC MoU—when the 3-S2 GVW distribution reaches its heaviest position (i.e., the 1991 GVW distribution has the highest mean and median in the time-series dataset). This trend is consistent except for a temporary interruption in 1982, possibly owing to the regulatory changes applicable to certain configurations that occurred in that year. Nevertheless, by 1984, approximately 35% of all observed 3-S2s operated at GVWs exceeding the pre-WCHSP limit, and by 1991 this increased to approximately 50%. Figure 3 indicates the statistical significance of these GVW changes in relation to year-to-year comparisons and relative to the pre-1974 dataset. Statistically, while significant differences are evident between the 1975 and 1978 distributions and between the 1978 and 1981 distributions, it appears that the distributions observed in 1982 and 1984 are statistically similar to the 1981 distribution. No regulatory change occurred for 3-S2s during this latter period. However, every distribution from 1975 to 1991, inclusive, can be considered as taken from a population different than the one that existed before the 1974 WCHSP.
Since 1991, Figures 2 and 3 reveal a downward trend in the mean 3-S2 GVW, decreasing from its maximum of 32.00 tonnes in 1991 to 25.05 tonnes in 2018. Notably, the mean 3-S2 GVW from 1992 to 2018 is lower than it was before the 1974 WCHSP, despite the availability of higher GVW limits. As shown in Figure 3, the distributions from 2000 to 2002 and after 2013 show no statistically significant year-to-year changes; no meaningful regulatory changes occurred during these periods for 3-S2s. Moreover, there is evidence that each distribution observed since 1991 represents a population that is different than the 1991 population. In addition, Figure 2 reveals a transition toward a uniform distribution of 3-S2 GVWs across the available weight range through the study period.
At least three factors may contribute to the downward trending mean and the shift in the shape of the 3-S2 GVW distribution. First, and of most relevance to the objectives of this study, there is evidence that, in time, carriers hauling weigh-out commodities shifted this freight to the more productive 3-S3s (or possibly eight-axle B-doubles) once these configurations became available following the RTAC MoU (see Figure 4). Consequently, the 3-S2 fleet hauled a lower proportion of higher density weigh-out freight after 1988 than before 1988. However, unlike the immediate increase in the GVW of 3-S2s that occurred following the WCHSP, this shift appeared to lag behind the regulatory change by approximately three or four years, since carriers needed to purchase new trucks to take advantage of the increased GVW limits. This delay may also have been influenced by manufacturing capacity. Second, there has been a decline in the average density of freight and the increased use of packaging, resulting in reduced payloads for the same commodity over time (6, 36). Third, the tare weights of vehicles in some industries have decreased because of use of lighter weighted materials, such as aluminum and composites, for trailer body construction ( 6 ). This effect is referred to as down-weighting.
Figure 4 presents evidence of relative consistency in the upper portion of the 3-S3 GVW distribution compared with the 3-S2 GVW distribution, particularly in the last two decades. This consistency corresponds with a period in which only minimal changes to the 3-S3 GVW limit occurred. Similar to the 3-S2 distributions, there appears to be some indication of freight density reduction and down-weighting, evidenced by statistically significant changes in GVW distributions from 2001 to 2010 and 2010 to 2013. However, this effect is not consistently apparent after 2013. The 1997 3-S3 distribution shows a lower percentage of empty and lightly-loaded trucks compared with the 2000 to 2018 distributions; this may reflect the possibility that only laden vehicles were recorded during the 1997 survey. The limitations section of this article discusses the implications of this in further detail.
The percentage of overweight observations fluctuates over the years. A lack of data about the practical application of enforcement tolerances, possible existence of permit vehicles in the dataset, and uncertainty in the level of enforcement at the time of the surveys preclude further commentary concerning overweight observations.
GVW Distributions for Eight-Axle B-Doubles (3-S3-S2s) and Turnpike Doubles (3-S2-4s)
Canadian carriers adopted eight-axle B-doubles after the effective introduction of the tridem axle in the 1988 RTAC MoU. Today, these vehicles comprise up to 15% of the articulated truck fleet operating on the Trans-Canada Highway ( 24 ). Since their introduction, eight-axle B-doubles have been subject to one truck weight regulatory change in Manitoba: a 1,000 kg increase in the GVW limit from 62,500 kg to 63,500 kg in 2011. Figure 5 shows the GVW cumulative frequency distributions from 2000 to 2018 and Figure 6 presents the same curves magnified to display only the upper portion of the GVW distributions.
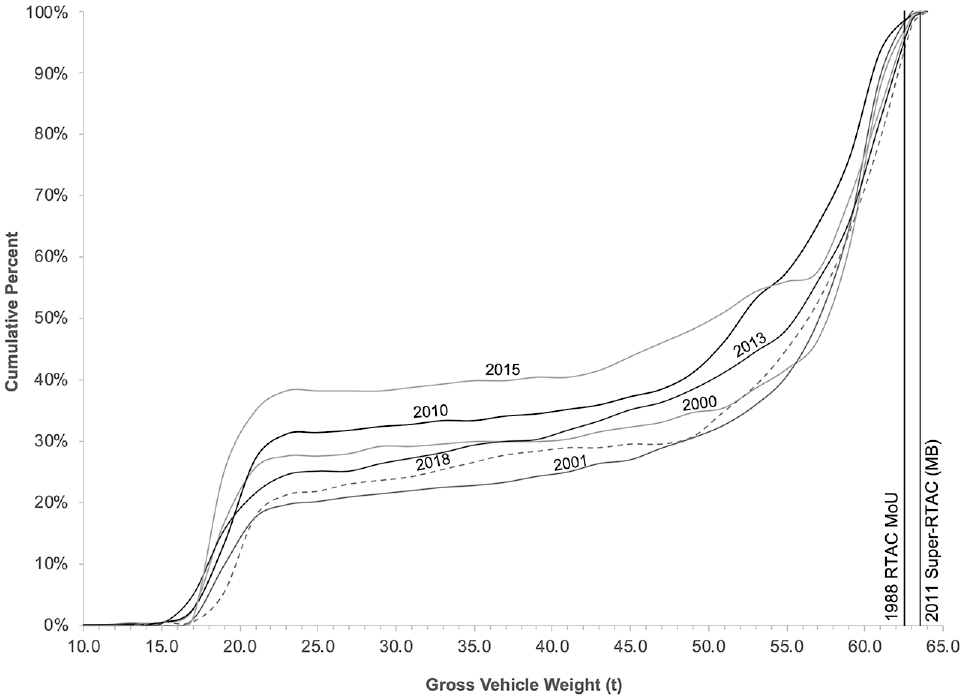
Cumulative frequency distributions for 3-S3-S2 GVWs in Manitoba: 2000–2018.
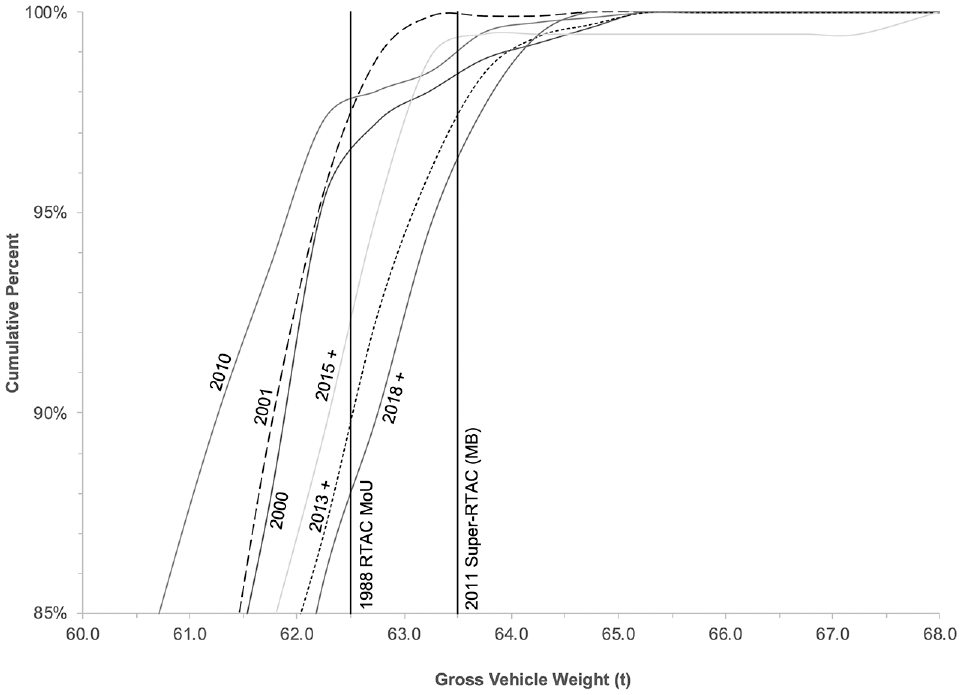
Upper portion of cumulative frequency distributions for 3-S3-S2 GVWs in Manitoba: 2000–2018.
Because of Ontario’s prohibition of LCVs on its highway network connecting to Manitoba, the Manitoba data presented for 3-S2-4 configurations has been collected at the Headingley weigh scale only and is representative of traffic on PTH 1 west of Winnipeg. Despite special permitting of turnpike doubles beginning as early as 1995, turnpike doubles only became evident in the Manitoba truck fleet mix operating on the PTH 1 after 2000 ( 24 ). Similar to the eight-axle B-double, turnpike doubles were also subject to one 1,000 kg GVW increase from 62,500 to 63,500 kg; however, this regulation change happened one year later following the LCV MoU in 2012. Figure 7 presents the cumulative GVW distributions of 3-S2-4s over the period of 2010 to 2015. To provide context, the figure includes the 3-S3-S2 GVW distribution envelope and the relevant GVW limits.
Cumulative frequency distributions for 3-S2-4 GVWs in Manitoba: 2010–2015.
Figures 5–7 reveal the following observations and insights about changes in the operating GVWs of 3-S3-S2s and 3-S2-4s throughout the study period.
As might be expected with minimal regulatory changes, both the 3-S3-S2 and 3-S2-4 distributions exhibit consistency over time, particularly in the upper portion of the distributions. There is some evidence of down-weighting and reduction in freight density for 3-S3-S2s. Limited data before the 3-S2-4 regulatory change precludes meaningful analysis of potential impacts.
Observed 3-S3-S2 GVWs consistently demonstrate a bimodal distribution, with the lower peak representing empty and very lightly-loaded trucks (with a mean around 20 tonnes) and the higher peak representing trucks operating close to the GVW limit (with a mean around 60 tonnes). The proportion of empty trucks is typically between 20% and 30% of the total, with a slightly higher percentage in 2015.
The upper portion of the 3-S3-S2 distributions (Figure 6) reveals the industry response to the 1,000 kg GVW limit increase in 2011. Statistically significant differences are evident in the upper portion of the distribution (i.e., considering GVWs greater than 60 tonnes as shown in Figure 6) when comparing the 2010 GVW distribution with the 2013, 2015, and 2018 distributions, but not when comparing the 2013, 2015, and 2018 distributions with each other. Moreover, the 2000 to 2010 distributions suggest that approximately 2% to 4% of trucks exceed the 62,500 kg limit (i.e., 96% to 98% of trucks are observed within the legal GVW limit). From 2013 to 2018 (i.e., following the increase in the GVW limit to 63,500 kg), the proportion of trucks over the previous 62,500 kg limit increased to between 8% and 12%. However, the proportion of trucks exceeding the new GVW limit remained within about 4%. The figure appears to demonstrate the industry’s immediate response to the relaxed GVW limit and the consistency in the proportion of trucks that exceed the GVW limit.
Unlike the bimodal GVW distributions for the 3-S3-S2s, the distributions for 3-S2-4s comprise GVWs across the available weight range, despite being subject to the same GVW limit. Moreover, relative to 3-S3-S2s, the 3-S2-4s exhibit little response to the increased GVW limit (from 62,500 kg to 63,500 kg), as no statistically significant differences existed between the GVW distributions. These contrasts demonstrate how the industry leverages the productivity benefits afforded by these two configurations. Specifically, 3-S3-S2s primarily haul bulk weigh-out commodities (e.g., grain, petroleum), whereas 3-S2-4s offer higher cubic capacity, ideal for hauling cube-out commodities (e.g., general freight).
Limitations
This paper reported observations and insights from data collected over the past 45 years. Although this provides a unique opportunity to conduct a retrospective longitudinal study of truck GVWs, the findings should be interpreted in the context of several unavoidable, data-related limitations.
Location and Availability of Data
The analysis combines source data from unpublished static weigh scale surveys conducted by UMTIG at the Headingley and West Hawk weigh scales in Manitoba. As the objective of the analysis was to include as much historical data as practical, there was no attempt to control the relative sample sizes in the dataset generated from these two locations. Consequently, the analysis disregards any spatial variations in truck weights and fleet mix and the bias these differences may impose.
The analysis generally excluded truck weight data collected at the Emerson weigh scale near the United States border, since the truck weight limits applicable in the U.S.A. uniquely affect trucks operating at this location. The GVW data collected in 1974, 1975, and 1978 contain data from any primary highway in Manitoba, including data collected at Emerson. However, before the RTAC MoU, there was less discrepancy between the GVW limits applicable in Canada and the U.S.A., so the inclusion of these data is not expected to materially bias the results.
Sampling Method
The principal sampling method limitation pertains to a change that occurred midway through the study period. Data collected from 1974 to 1984 represent laden trucks only, as the surveys conducted in those years excluded trucks with no payload. It was not specified whether the data collected between 1984 and 1998 included laden trucks or all trucks; however, based on the data it appears that only laden trucks were surveyed throughout this time as well ( 37 ). In 1998, a modified sampling procedure designed to gather a more representative sample introduced a requirement to weigh and record data for each truck passing the weigh scale during the sampling period, including empty trucks ( 36 ).
Table 3 presents the results of a sensitivity analysis conducted to assess the potential impact of this change in the sampling method. This involved removing records with GVWs less than an assumed tare weight and evaluating the 25th, 50th and 75th percentile GVWs compared with the original data presented for 3-S2s. Regehr et al. ( 35 ) reported mean tare weights for various 3-S2 body types in Manitoba, ranging from 13,400 kg to 15,700 kg; therefore, the assumed tare weight values for the analysis were 14,000 kg and 16,000 kg.
3-S2 GVW Statistics from the Original Data and with Presumed Empty Vehicles Removed
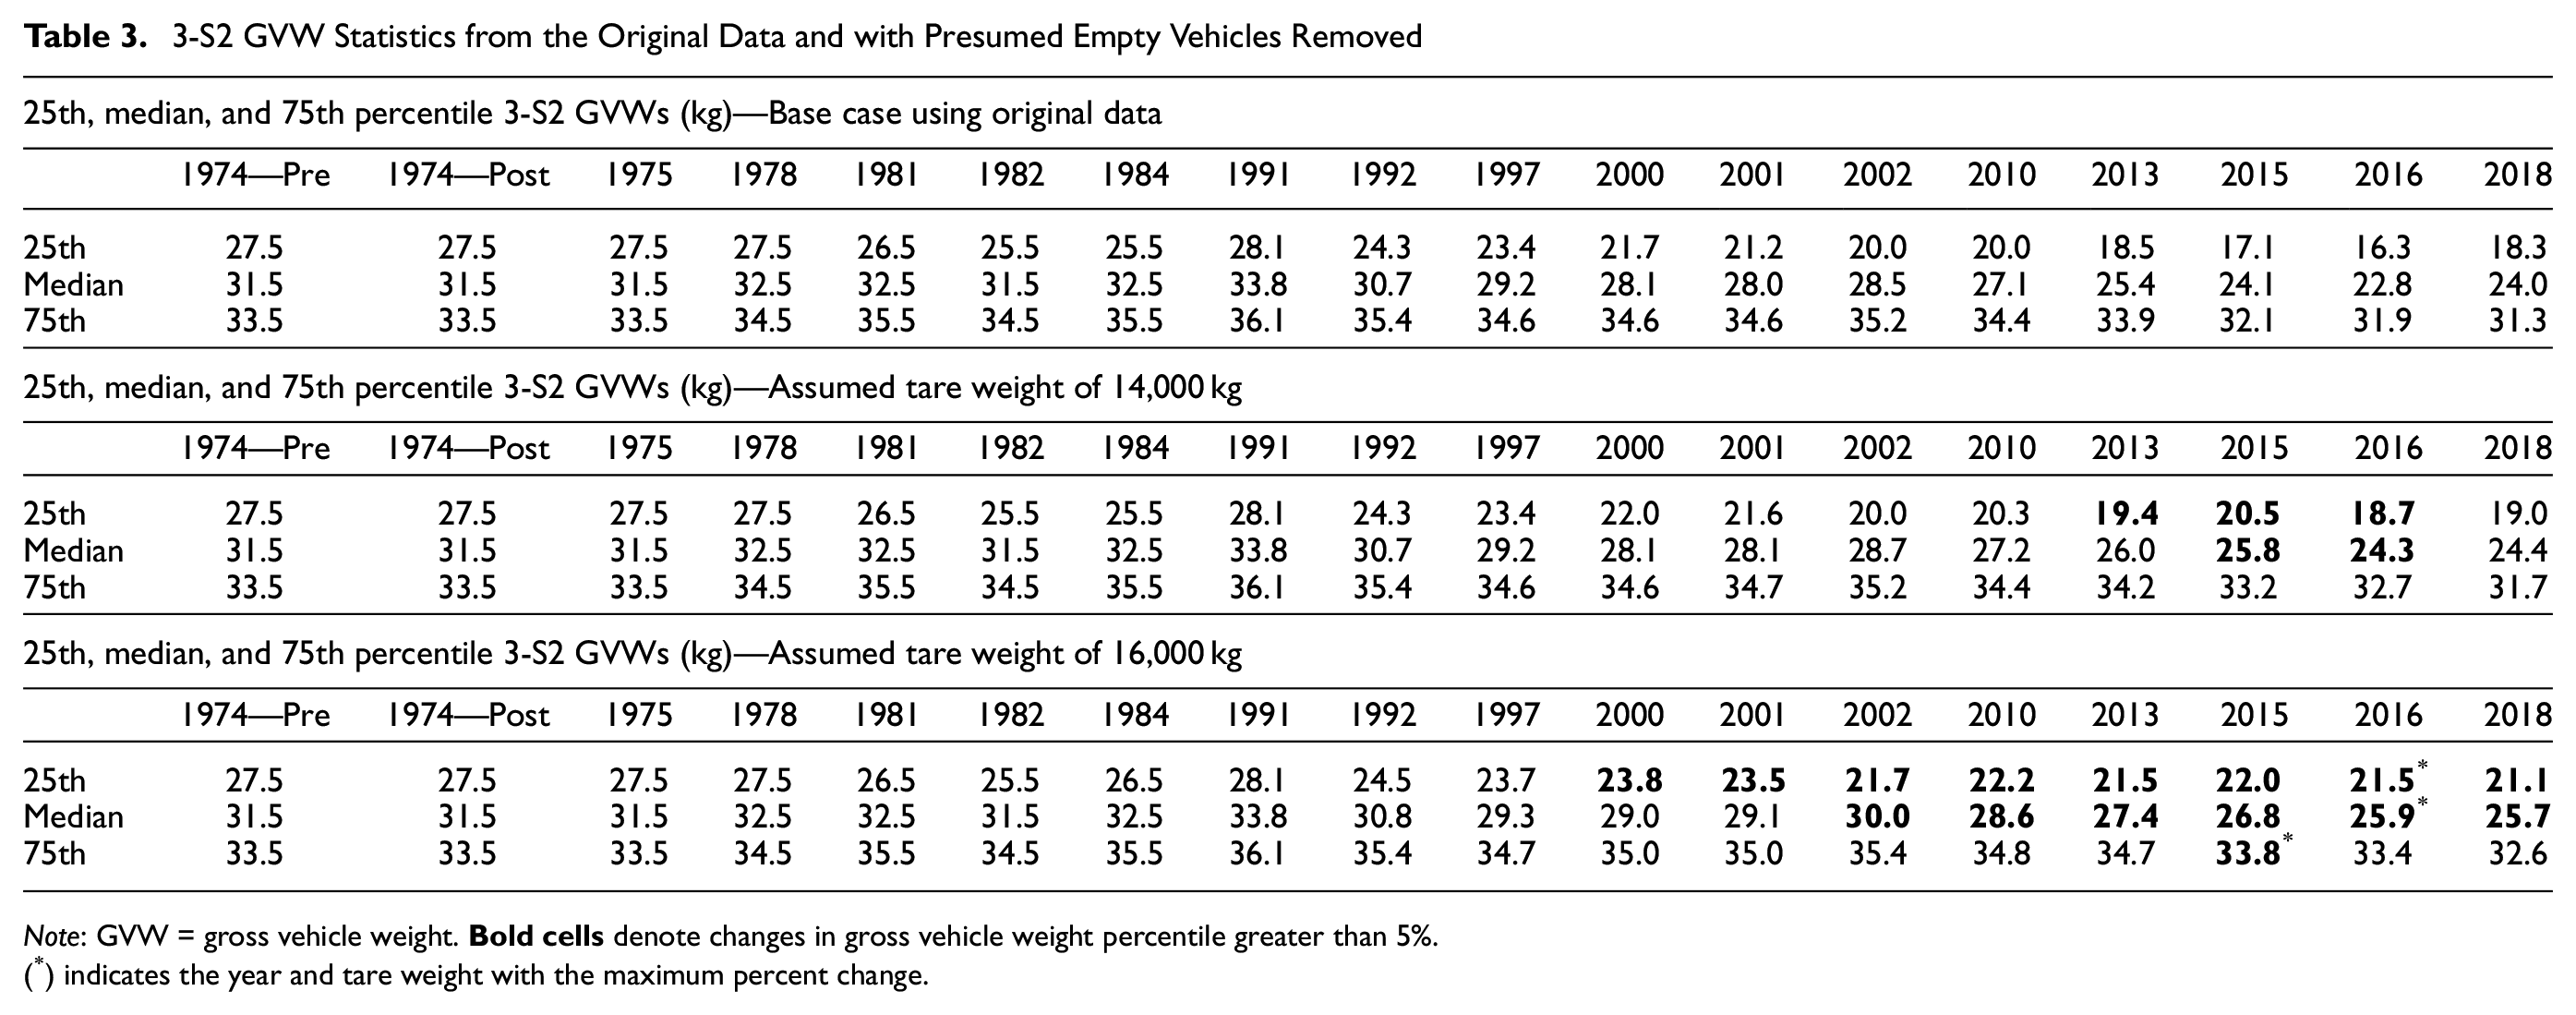
Note: GVW = gross vehicle weight.
(*) indicates the year and tare weight with the maximum percent change.
Before 2000, the 25th, median, and 75th percentile 3-S2 GVWs are insensitive to the removal of presumed empty vehicle records, regardless of the tare weight assumption. From 2000 on, the most significant change resulting from the removal of assumed empty vehicles occurs for the 25th percentile values. This effect intensifies as the assumed tare weight increases, with a maximum 32% difference observed for the 25th percentile 3-S2 GVW in 2016. By comparison, the median and 75th percentile GVWs are less sensitive, with maximum differences of 14% and 5% observed in 2016 and 2015, respectively.
Although the removal of assumed empty vehicles shifts the 2000 to 2018 GVW cumulative distribution curves toward heavier percentile weights, as indicated in Table 3, the effect of this change does not materially affect any observations related to the upper portions of the curves near the GVW limits, as illustrated by the minimal change in 75th percentile values. Despite some effect on the median values, the proportion of assumed empty vehicles for a tare weight of 16,000 kg remains between 10 and 16% for period from 2000 to 2018. The consistency in percent of removed vehicles over time leads to a near uniform shift in the post-2000 curves and does not impact findings related to the downward trend in median weights after 1991. As such, the observations and insights presented in this article are considered relevant despite the change in the sampling method over time.
Other Limitations
Finally, limitations surrounding the representativeness of the results because of the enforcement intensity at the time of the surveys could not be quantified. Previous research indicates that high levels of enforcement lead to near complete compliance ( 36 ) and changing enforcement levels throughout the study period may have impacted the GVW trends. However, this impact was considered minor and an analysis of enforcement levels was not completed. In addition, the effects of fuel price and local tax regulations were also considered to be outside the scope of this article.
Conclusions
Three primary truck size and weight policy changes occurred in Canada over the past five decades: the 1974 WCHSP, the 1988 RTAC MoU, and special permitting of LCVs. These regulatory changes introduced new truck configurations and influenced the GVWs of trucks operating on principal highways. This retrospective longitudinal study contributed unique ex post evidence of these changes for 3-S2s, 3-S3s, 3-S3-S2s, and 3-S2-4s using a time-series of weigh scale data collected on the Trans-Canada Highway in Manitoba, Canada. In particular, it sought to answer three questions: How do operating GVW distributions change when axle and GVW limits are relaxed? How do these changes differ for predominant truck configurations? How long does it take for the trucking industry to respond to truck weight regulatory changes?
The analysis revealed the following principal conclusions:
As a direct result of purposeful truck regulatory changes in Canada, trucks operating on many primary Canadian highways carry heavier and larger payloads today than they did five decades ago. Carriers adapted to regulatory change by adopting new configurations, diversifying their fleets, and when possible and advantageous, increasing the operating GVWs of their trucks. Likewise, periods of minimal regulatory change corresponded to relative stability of operating GVWs.
Certain configurations subject to effectively the same GVW limits exhibited markedly different GVW distributions and contrasting responses to regulatory change, depending on whether they typically haul weigh-out or cube-out commodities. Most notably, compared with 3-S2-4s, 3-S3-S2s featured bimodal distributions (i.e., either empty or fully-loaded) rather than uniform GVW distributions, and had an observable sensitivity to increases in the GVW limit. These contrasts demonstrated how the industry leveraged the productivity benefits (for weight and cube) facilitated by a diverse fleet mix.
Increasing the GVW limit for a particular truck configuration led to immediate increases in operating GVWs for the portion of those configurations used to haul weigh-out commodities. This effect was apparent for 3-S2s following the WCHSP in 1974, for 3-S2s following the RTAC MoU in 1988, and for 3-S3-S2s following the 1,000 kg increase in GVW in 2011. The timeliness of this response appeared contingent on the immediate availability of the configuration.
When regulations introduced a new, more productive configuration, the industry’s response lagged behind the regulatory change by approximately three or four years as carriers adjusted their fleets and logistics practices. The increasing 3-S2 GVWs between 1988 and 1991 provided evidence of this transition period and of the ongoing downward effect that 3-S3s had on the 3-S2 GVWs since 1991. Regulatory bodies interested in reducing this lag period could consider collaborating with industry through the development of targeted incentive programs or, more broadly, through the initiation of performance-based approaches for assessing vehicle designs and establishing truck regulations (e.g., as in Australia [ 38 ]). Such collaboration was found to be helpful during Canadian regulatory changes ( 8 ).
Two exogenous trends—namely the ongoing reduction in average freight density and the down-weighting of truck tare weight—appeared to influence the operating GVWs of all four truck configurations examined.
Despite the noted data-related limitations and the constrained geographic scope of the data collected, the evidence presented in the article contributes new insights that help address gaps and persistent modeling uncertainties applicable to the prediction and evaluation of the impacts of truck weight regulatory changes. In particular, the findings reveal how regulatory changes differentially influenced truck operating GVWs for an evolving and diverse truck fleet. Further research would be needed to compare the impacts theoretically predicted using an ex ante modeling approach to the observations presented here.
Footnotes
Acknowledgements
The authors gratefully acknowledge the financial contributions of Manitoba Infrastructure and the Natural Sciences and Engineering Research Council of Canada (NSERC). Two former directors of UMTIG, Professor Emeritus Alan Clayton and Dr Jeannette Montufar, were instrumental in creating the dataset used in this article. The authors are most grateful for their contributions.
Author Contributions
The authors confirm contribution to the article as follows: study conception and design: J.D. Regehr, A. Pushka; data collection: various researchers; analysis and interpretation of results: A. Pushka, J.D. Regehr; draft manuscript preparation: A. Pushka, J.D. Regehr. All authors reviewed the results and approved the final version of the manuscript.
Declaration of Conflicting Interests
The author(s) declared no potential conflicts of interest with respect to the research, authorship, and/or publication of this article.
Funding
The author(s) received the following financial support for the research, authorship, and/or publication of this article: Manitoba Infrastructure and the Natural Sciences and Engineering Research Council of Canada (NSERC).
Data Accessibility Statement
The authors compiled the truck weight data used from various published and unpublished sources developed and maintained by the University of Manitoba Transport Information Group (UMTIG), in collaboration with Manitoba Infrastructure. Data may be accessible on request, subject to consent provided by both parties.
The results and conclusions presented in this paper are those of the authors and no official endorsement by Manitoba Infrastructure is intended or should be inferred.