
Abstract
Assessments of interactions between road users are crucial to understanding comfort and safety. However, observers may vary in their perceptions and ratings of road user interactions. The objective of this paper is to examine how perceptions of yielding, comfort, and safety for pedestrian interactions vary among observers, ranging from members of the public to road safety experts. Video clips of pedestrian interactions with motor vehicles and bicycles were collected from 11 crosswalks and shown to three groups of participants (traffic safety experts, an engaged citizen advisory group, and members of the general public) along with questions about yielding, comfort, and risk of injury. Experts had similar views of yielding and comfort to the other two groups, but a consistently lower assessment of injury risk for pedestrians in the study. Respondent socio-demographics did not relate to perceptions of yielding, comfort, or risk, but self-reported travel habits did. Respondents who reported walking more frequently rated pedestrian comfort as lower, and respondents who reported cycling more frequently rated risk as lower for pedestrian interactions with both motor vehicles and bicycles. Findings suggest small groups of engaged citizens can provide useful information about public perspectives on safety that likely diverge from expert assessments of risk, and that sample representation should be assessed in relation to travel habits rather than socio-demographics.
Many cities have policies encouraging non-motorized, physically active travel modes to promote sustainability and public health. When promoting active travel, it is crucial to ensure a safe and comfortable walking experience, which requires an understanding of the perceived and objective risks associated with pedestrian travel ( 1 ). Analysis of crash data is a common approach to objective risk assessment, which can be used to identify unsafe locations and effective mitigation strategies ( 2 ). However, limitations of this approach for evaluating pedestrian safety include inadequacy of data because of underreporting of pedestrian crashes ( 3 ), limited availability of pedestrian volume data (4, 5), and small sample sizes because of rare crash occurrence ( 6 ). In light of these shortcomings, researchers have also used surrogate safety measures such as conflicts to complement crash data (7–10). Such surrogate safety assessments are typically applied, or at least validated, using observational assessments with input from traffic safety experts (11–15).
Beyond objective safety assessments, pedestrian comfort and perceived safety are key components of promoting active transportation. Comfort is an essential dimension of quality of service and a determinant of travel behavior. Comfort and perceived risk are typically assessed using first- or third-person evaluations of pedestrian activity and interactions with other road users (11, 16–20). Outside of research, cities receive unprompted feedback on perceived pedestrian risks from engaged citizens every day, as well as more formal prompted input from citizen advisory and advocacy groups on specific projects.
Thus, observational assessments of interactions among road users are important for evaluating both objective and subjective safety. However, we still have poor understanding of how dependent those assessments are on who the observers/reporters are. In research using traffic safety experts, the ratings of multiple experts are typically compared for consistency. But how do the perceptions of experts compare with those of the general public? Do the risks as perceived by a vocal group of engaged citizens represent broader safety concerns? And how important are the personal characteristics of the observers to assessments of comfort and safety? Past research suggests perceptions of interactions between road users and perceptions of risk can vary with age ( 20 ) and travel habits ( 21 ). What are the key attributes to consider in assessing the representativeness of a sample from the general population?
The objective of this paper is to investigate the differences in perceptions of pedestrian comfort and safety among observers. Three groups of stakeholders (traffic safety experts, an engaged citizen advisory group, and members of the general public) rated a series of sample interactions between pedestrians and other road users (in motor vehicles and on bicycles) on four scales of severity, evaluating yielding, comfort, and safety. Comparisons are made of the perceptions of interaction severity within and between rater groups, and regression analysis used to examine the relationships between personal characteristics of the respondents (socio-demographics and travel habits) and perceived interaction severity. This information is important for understanding how pedestrian comfort varies across the population, the generalizability of sample data on perceived comfort and safety, and the relevance of expert opinion to broader experience.
Literature Review
The literature on traffic conflicts, which aims to systematically evaluate objective risk based on observed interactions without collisions, tends to frame risk as “conflict severity,” where more severe conflicts represent greater likelihood of a collision (8, 9, 15, 22–26). The severity of a conflict is usually assessed as qualitative levels (e.g., low, medium, high) by human observers or quantitative bins based on objective conflict indicators such as time to collision (TTC) or post encroachment time (PET). Prevailing methods for collecting conflict data include: trained observers in the field ( 17 ); recording video data that are later processed by trained observers ( 13 ); and recording video data that are later processed by software tools ( 12 ). The advantage of observers processing video data over making observations in the field is that it allows repeated viewing of the interactions ( 15 ). Video processing by software can be less resource-intensive than processing by trained observers, but still requires expert observers for validation (7, 11).
Studies of subjective risk and perceptions of pedestrian safety and comfort have used a variety of methods, some similar to those of traffic conflict studies on objective risk. Traveler comfort study methods include: direct questions about a respondent’s imagined comfort in a video-recorded trip (19, 27) or hypothetical situation (28–30); post-trip interviews or intercept surveys eliciting first-hand experience (20, 31–35); on-road stress measurement using physiological sensors ( 36 ); and third-person evaluation of interactions (live or video recorded) by safety experts or members of the general public (17, 37, 38). Limited formal analysis comparing these methods has been reported, although Fitch and Handy ( 19 ) found that the comfort ratings of video-recorded trips were systematically lower than ratings of experienced trips.
Perceived safety and comfort are sometimes used interchangeably in the literature on pedestrians and cyclists, and two recent studies report that they were essentially indistinguishable (19, 39). A common wording to measure perceived safety is to ask travelers if they “would feel comfortable” in a certain situation ( 29 ). Comfort has been evaluated in diverse ways, be it as a safety concern, fear of traffic, concern about traffic, or concern about conflicts with vehicles (16, 18, 31, 40, 41). Less often, comfort can also refer to other factors such as weather or hills.
A key feature of road user interactions related to comfort and safety is whether or not one road user yielded to another. Definitions of yielding are inconsistent and often vague in the multi-modal road user literature, and even compliance is not always strictly defined (11, 33, 34, 42, 43). Yielding is sometimes simply assessed as which road user passed first, and sometimes based on subjective indicators of slowing or avoidance maneuvers, which depend on the reporting of an observer. Relating comfort to yielding, Moody and Melia ( 34 ) asked whether pedestrians “feel [they] have more, less or equal priority” than other road users.
In summary, a large body of literature focuses on analysis of the environmental and operational factors that influence comfort and both objective and subjective safety. A variety of methods are used to elicit perspectives on traveler comfort and safety, often involving observational assessments of interactions among road users. Socio-demographic variables are sometimes included as interpersonal factors influencing the reported perception of safety (17, 30, 37, 40), but usually in first-person measurement methods or in reference to pedestrian characteristics. We still have poor understanding of how safety perception varies across observers, particularly for third-person reporting methods. This understanding is needed both to enhance research methods, and to provide context for practitioners processing input on safety from a variety of sources including safety experts, citizen advisory and advocacy groups, and the general public.
Methods
Sample Pedestrian Interactions
Video data were collected at 11 crosswalk locations in the city of Vancouver, Canada for three consecutive weekdays at each location between September 25 and December 5, 2019, inclusive. Only data from six peak hours per day (08:00–10:00, 11:00–13:00, and 16:00–18:00) were used in the study. All locations were marked, uncontrolled crosswalks at intersections on minor and collector streets with substantial pedestrian, motor vehicle, and cycling activity. Seven of the locations were located in the 10th Avenue Hospital District, a recently re-designed street corridor and the focus of a broader study on road user interactions. The other four locations were selected as comparison sites in the city with similar operational characteristics. Average hourly volumes across all locations were 104 (13–298) crossing pedestrians, 109 (21–180) motor vehicles, and 54 (5–79) bicycles.
The video data were reviewed to identify a target sample of 50 pedestrian crossings with interactions at each location. Interactions were defined based on PET, which is defined for two road users on intersecting paths as the time gap between when the first road user exits the conflict point and when the second road user enters it ( 44 ). No single conflict measure best captures all types of interactions and risks, but PET has been used successfully and frequently in the past for non-motorized traveler interactions (22, 24). We use a threshold of 5 s PET to define interactions, based on past research (7, 9, 10, 24). Pedestrian interactions with only one direction of motor vehicle and bicycle traffic at each location were considered, so that the vehicle approach was included in the camera scene.
The average interaction rate across all locations was 40 pedestrian–vehicle interactions per hour and 16 pedestrian–bicycle interactions per hour. A total of 3,176 vehicle interactions and 1,252 bicycle interactions were recorded at all locations, from which a random sample of 536 interactions were extracted. These 536 interactions were separated into nine strata, given in Table 1, based on the PET and interacting road user types. We then took a stratified random sub-sample of 84 interactions from the 536, over-sampling interactions with bicycles and interactions with PET <2 s. After pilot testing videos we: 1) excluded interactions with PET of 4–5 s because of consistently low perceived severity; and 2) substituted videos where the interaction was not clear and dominant in the video scene with other randomly selected interactions from the same stratum (for example, a goose crossing the road or a distracting event in some other part of the scene).
Sample Pedestrian Interactions (84 Video Clips in Nine Strata)
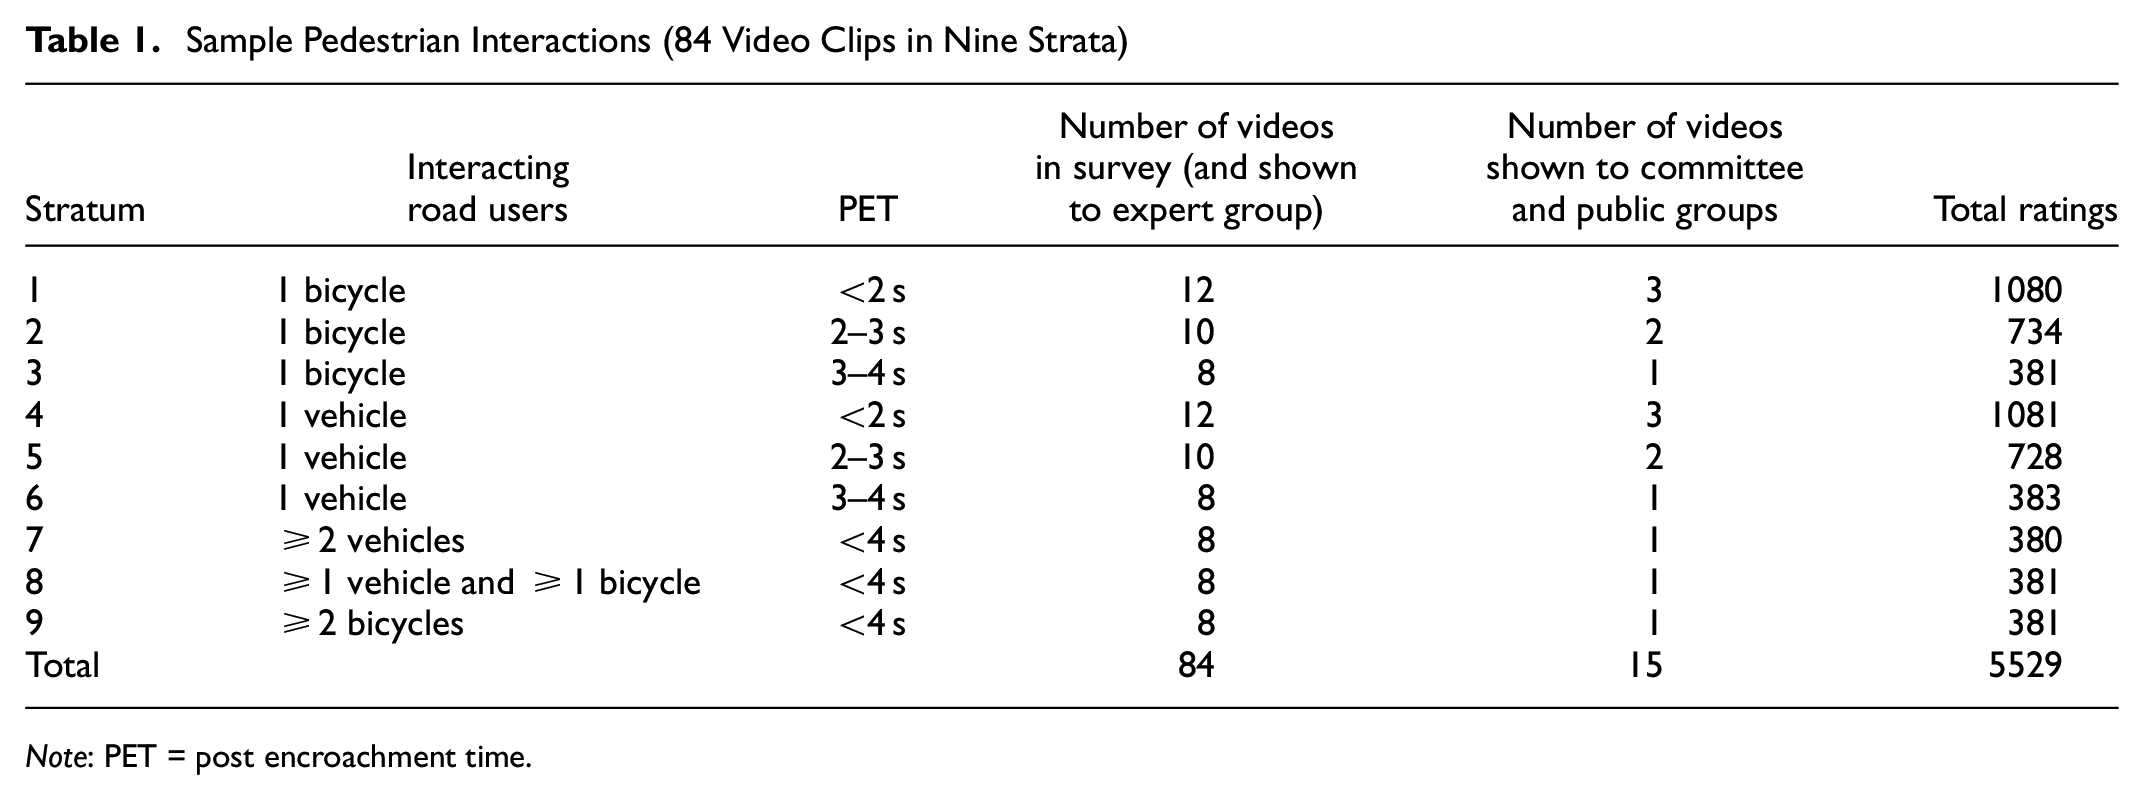
Note: PET = post encroachment time.
Rating Survey
Three groups of participants were recruited to rate the sample interactions. The Public group was defined as persons with experience traveling alone in Vancouver, recruited through advertisements on Facebook and online posts. The second group, Committee, consisted of all members of a citizen advisory group convened by the city of Vancouver to provide feedback on the 10th Avenue Hospital District project. They were recruited through direct email from the city of Vancouver. The third group, Experts, was defined as transportation professionals who had previously taken part in traffic safety evaluations involving pedestrians or cyclists, from North America but outside of British Columbia. The Experts were selected by and recruited through direct email from the researchers. As incentives, the Public and Committee groups were entered into a draw for four gift cards of Can$25 each; the Expert group was offered an honorarium of Can$300. The research methods were approved by the Behavioral Research Ethics Boards of the University of British Columbia and Simon Fraser University.
An online questionnaire was implemented in Qualtrics survey software to collect the interaction ratings. A consent form was followed by a short, single-page set of travel habit and demographic questions: frequency of travel by different modes, age, gender, home postal code, educational attainment, and household income. Risk aversion was self-assessed with the question “Overall, how would you place yourself on the following scale?” with a seven-point response scale from “Extremely comfortable taking risks” to “Extremely uncomfortable taking risks,” based on Glanz et al. ( 45 ). Participants were then shown a series of randomly ordered pages, each with a short (7–18 s) video clip of a sample interaction followed by a prompt to indicate their agreement with four statements about the interaction shown in the video (see Figure 1). The number of video clips from each stratum shown to the participants of each group are given in Table 1; the Experts rated all 84 videos, while the Public and Committee groups rated 15 (randomly selected, without replacement, from each stratum).
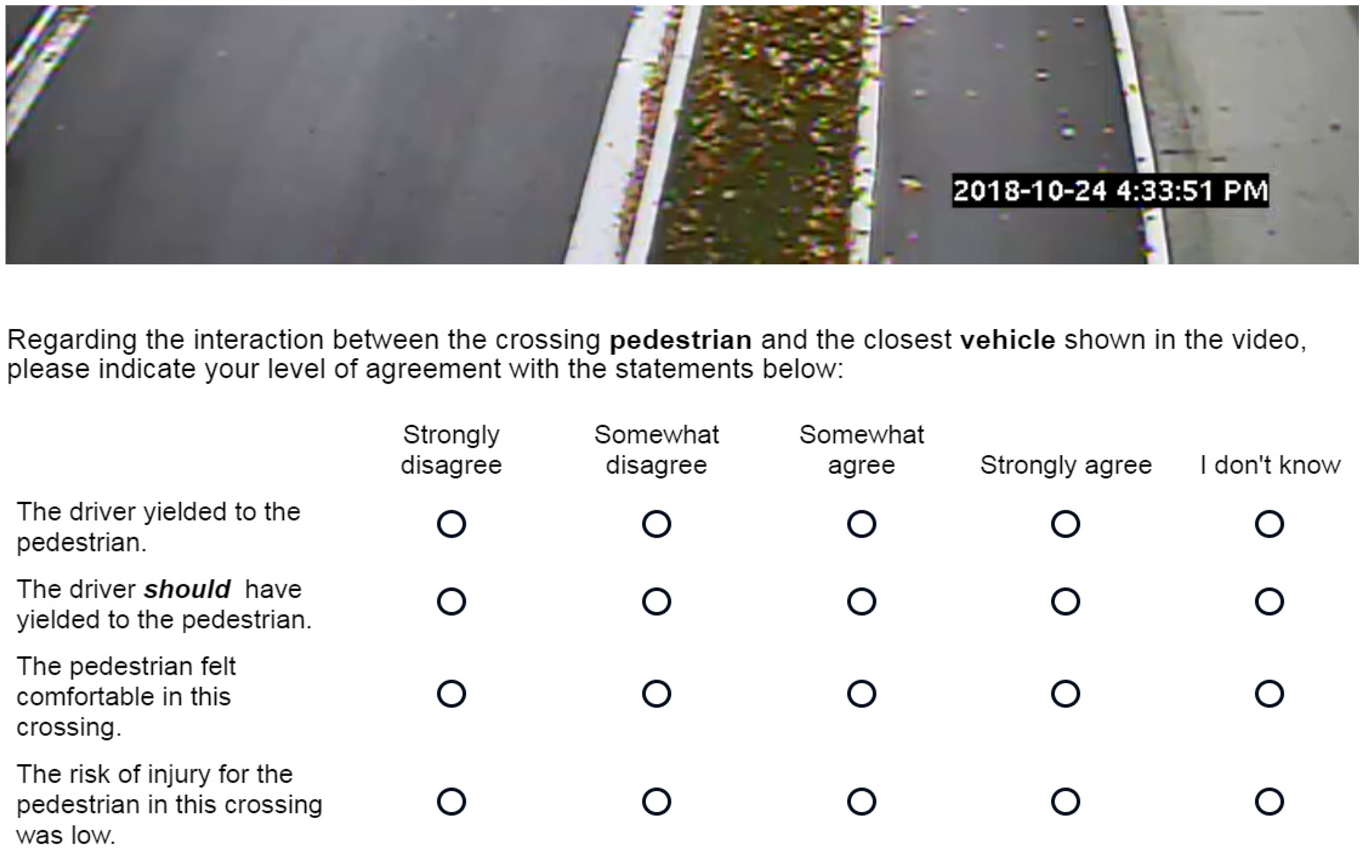
Screenshot of video rating in questionnaire.
The four severity statements were:
The [driver/cyclist] yielded to the pedestrian.
The [driver/cyclist] should have yielded to the pedestrian.
The pedestrian felt comfortable in this crossing.
The risk of injury for the pedestrian in this crossing was low.
with response options of: “Strongly disagree,”“Somewhat disagree,”“Somewhat agree,”“Strongly agree,” and “I don’t know.” The wording of the severity scales was selected after extensive consideration of the existing literature, with input from professional and academic colleagues, a citizen’s advisory group, and pilot testing.
Responses from the online survey were collected over 41 days, from March 15 to April 24, 2019. Participants who declined consent, rated fewer than four videos, or spent less than 12 s on more than one of the video pages were excluded. Of 451 submitted responses, 84 Public (71 incomplete, 11 low timing, and two declined consent) and one Committee (incomplete) were excluded, leaving a final sample of 366 (343 Public, 17 Committee, and six Expert). The total number of video ratings in each stratum are given in Table 1. Time spent on each video page was similar across groups, with median times of 43, 49, and 38 s for the Public, Committee, and Expert groups, respectively (no differences by group are statistically significant at p < 0.05 based on a two-tailed t-tests).
Response rates do not apply to the Public sample because of the open recruitment method. For the Committee group, 17 complete responses were received out of 59 invitations from the city (29% response rate). Of 11 invitations, six complete responses were received from the Expert group (55% response rate): one employed in academia, three in government, and two in consulting from four U.S. cities (Boston, Corvallis, Portland, Seattle) and one Canadian city (Montreal).
Analyses
All data analyses were performed in the statistical software package R ( 46 ). Sampling weights were applied to the Public responses to match the age (nine-level factor), gender (woman binary), education (five-level factor), and income (six-level factor) marginal distributions from census data for the city of Vancouver ( 47 ). Survey weights were created by raking ( 48 ), using the “survey” package in R ( 49 ). Missing respondent socio-demographic data were maintained as a synthetic marginal category in the comparison population data ( 50 ). Weights were trimmed (strictly) at lower and upper bounds of 0.3 and 3.0 times the median weight, respectively (0.14 and 1.36). This led to trimming of 102 (30%) of the weights and a final median weight of 0.997.
A weighted mixed ordered logistic regression model for each outcome (“yielded,”“should have yielded,”“comfortable,” and “low risk”) was estimated using the “clmm” package in R ( 51 ) to explore the relationships of participant characteristics and interaction features to perceived severity. The models included random effects for each video (84) and each respondent (366). Independent variables included respondent group, socio-demographics, travel habits, and risk aversion from the survey, as well as objective features of the location and interactions. To determine what interaction features could reliably be extracted for all 84 survey video clips, a draft set of 29 features was developed and independently coded by four members of the research team for 10 randomly selected interactions. Features with high reliability based on the kappa statistic ( 52 ) (threshold of >0.6) were maintained and coded for all 84 video clips. Other features were discarded because of unreliability, including distracted pedestrians, elderly pedestrians, and whether the cyclist stopped pedaling. The final set of interaction features coded and included in the model development were: PET; whether the pedestrian or interacting road user passed the conflict point first; pedestrian location when the road user entered the crosswalk (sidewalk, curb ramp, on-street); total numbers of pedestrians; motor vehicles and bicycles in the scene; motor vehicle type (passenger car); pedestrian type (mobility-assisted, child); whether the pedestrian and interacting road user were isolated or in a group; yielding-related maneuvers by the pedestrian and interacting road user (full stop, speed deviation, path deviation); and turning movements by the road users. Location features included number of general purpose and bicycle lanes and whether the crosswalk was in the 10th Avenue Hospital District. Independent variables were tested by step-wise addition, and retained at p < 0.05.
Results and Discussion
Participant characteristics are summarized in Figure 2. The Public sample is younger and has higher educational attainment than the city-wide population, likely as a result of the online recruitment method and some self-selection of those interested in participating in a transportation study. The Committee sample had a lower proportion of women and older people, and higher income and educational attainment than the Public. Of all groups, the Experts responded as being the most risk-averse (“uncomfortable taking risks”), followed by the Committee and the Public.
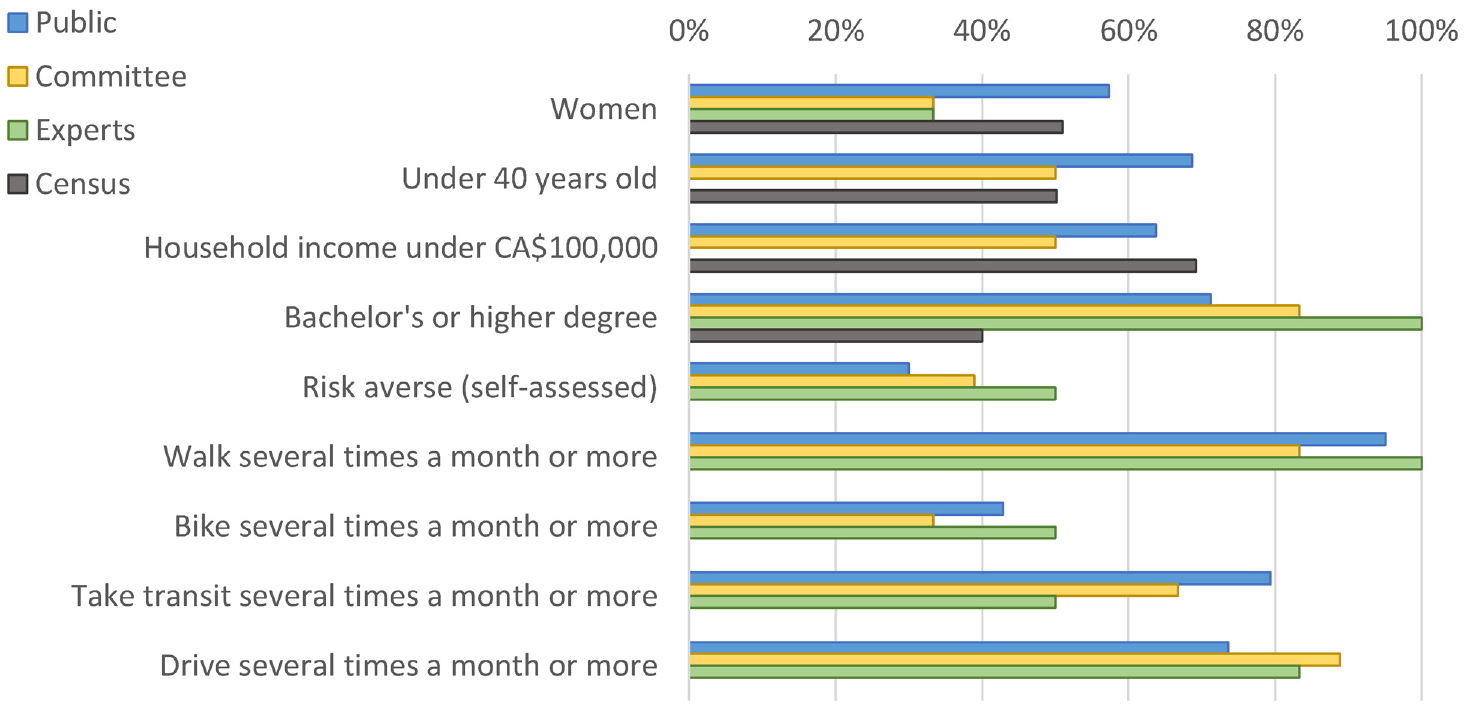
Sample characteristics (empty bars are missing data, not 0%).
Ratings distributions by respondent group are given in Figure 3. The distributions aggregate the full 5,529 ratings for all videos using the survey weights described above. The distributions are not representative of overall severity of interactions because of the stratified selection of videos for the survey (i.e., they over-represent interactions with bicycles and close interactions). There is generally good agreement among the groups on the ratings. The most visible difference is for Expert rating of the “low risk” question, which indicates greater agreement than in the other two groups. Even over-representing close interactions (<2 s PET) in the survey, there was more than 80% agreement with “comfortable” and more than 70% agreement with “low risk” in all three groups. Respondents agreed that the road user should have yielded to the pedestrian in 60% to 70% of the ratings, but agreed that they actually did yield to the pedestrian in around 40% of the ratings.
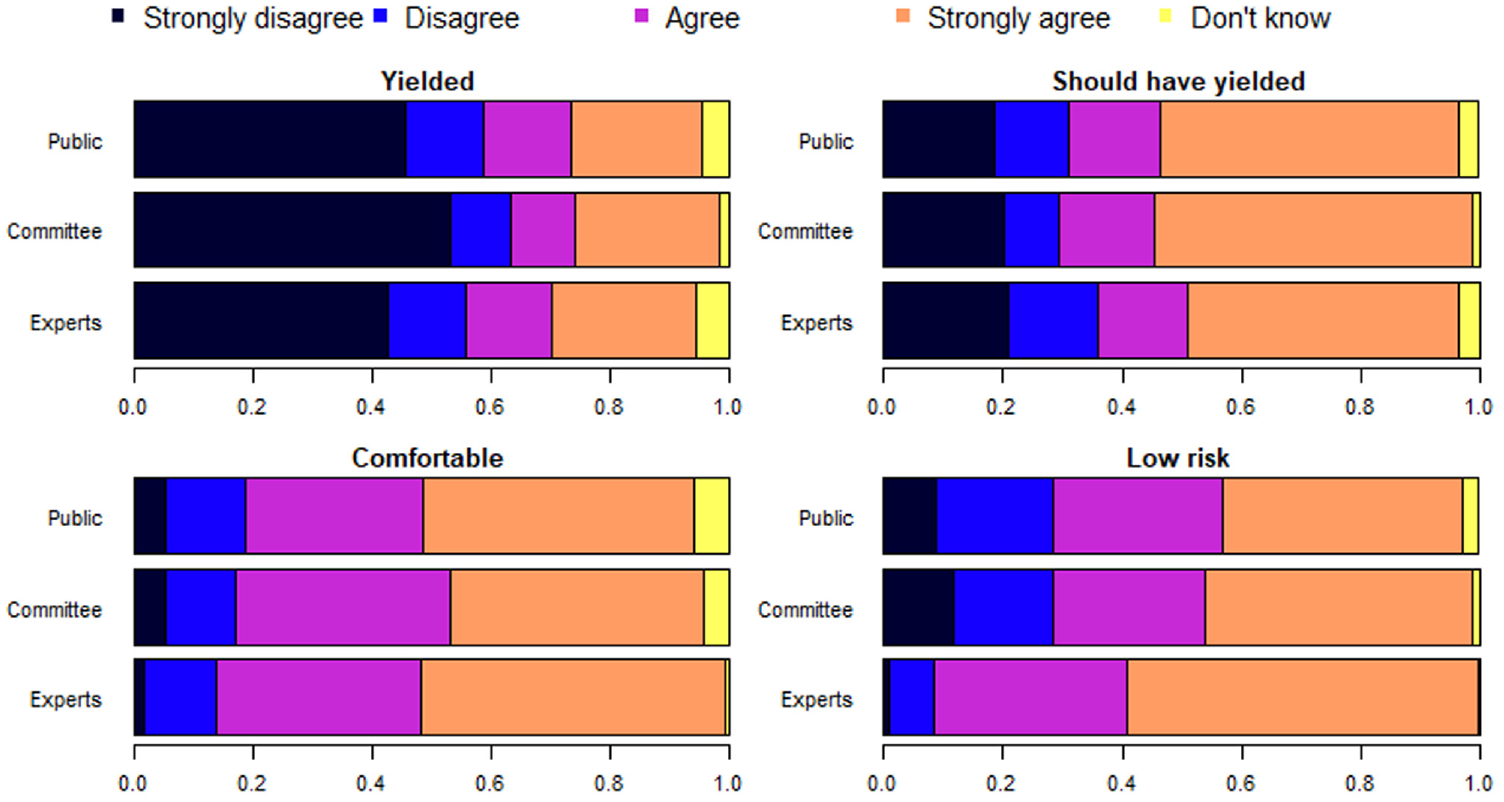
Distribution of survey responses by group.
Intraclass correlation coefficients (ICC) are given in Table 2 for average and single-rater measures based on absolute agreement in two-way effects, all significant at p < 0.01 ( 53 ). The single-rater measures ICC indicates the reliability of ratings based on a single (typical) rater; the average measures ICC indicates the reliability of ratings based on multiple raters averaged together (which is always higher than the single-rater measures ICC). All the ICC for average measures are high, in the range of “good” values of at least 0.6 and “excellent” values of at least 0.75. Conversely, ICC for single-rater measures are low, mostly in the “fair” range of 0.4–0.6 for yielding and in the “poor” range below 0.4 for comfort and risk. Therefore, average ratings from the survey sample are reliable indicators of interaction severity but individual ratings are not. The Committee group was the most internally consistent (with highest single-rater ICC of 0.34–0.68).
Intraclass Correlation Coefficients for Average and Single-Rater Measures
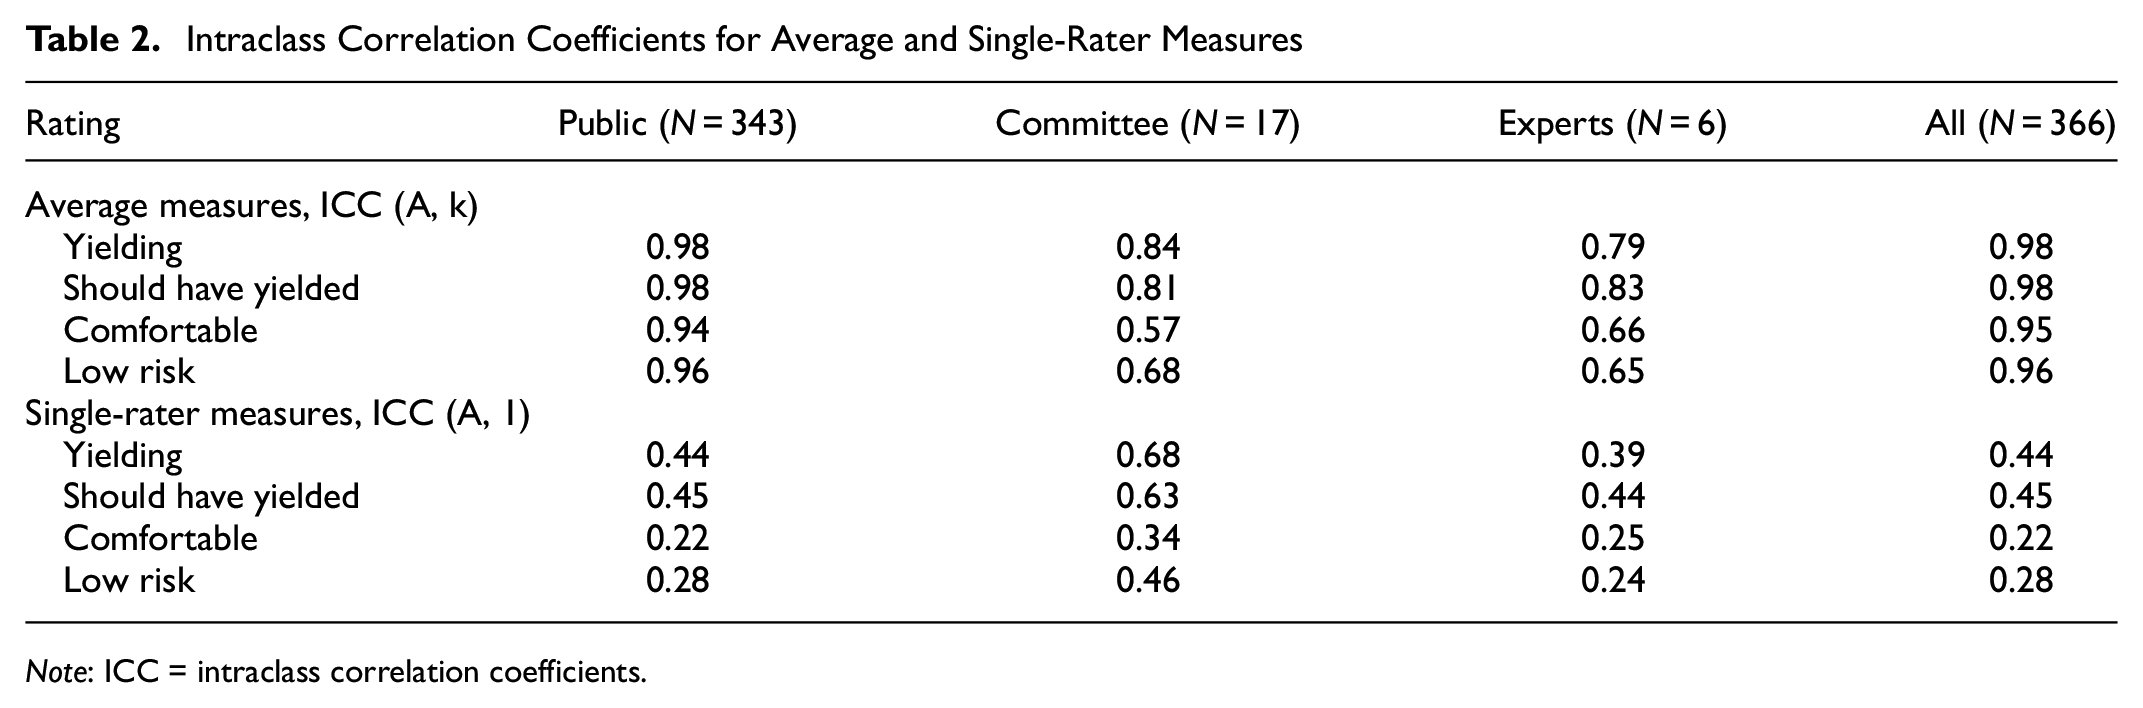
Note: ICC = intraclass correlation coefficients.
By both ICC measures across all groups, yielding was more consistently rated than comfort and risk. As an example of the large variability in ratings among individuals, at least 85% agreement or disagreement was reached for 58% of the 84 videos on “yielded,” 48% on “should have yielded,” 52% on “comfortable,” and 39% on “low risk.”
Response distributions were compared between groups for all 36 strata-outcome combinations (nine strata × four outcomes) using Chi-squared tests. Only nine of the 36 tests were significant at p < 0.05. For seven of the nine strata (all except single-bicycle and single-vehicle interactions of 3–4 s PET), Experts more frequently and strongly agreed that the interactions were low risk than the other two groups, particularly for pedestrian–bicycle interactions. The other two significant differences were for “should have yielded” in 2+ vehicle interactions (with greater agreement from Public than Committee that motorists should have yielded) and for “comfortable” in single-bicycle interactions under 2 s (with greater agreement from Experts than the other two groups).
The best-fit models for each outcome are given in Table 3, based on log-likelihood. The yielding model has the highest pseudo-R 2 , followed by obligation to yield, risk, and comfort. Of primary interest in this study are the respondent attributes in the model results. Surprisingly, perceptions of yielding, comfort, and risk do not vary significantly with any of the tested socio-demographic variables (age, gender, income, and education). This finding was consistent across numerous specifications and in single-variable models as well. Some travel habits do significantly relate to perceptions, however. Participants who report walking more frequently rate pedestrian comfort as lower and are more likely to agree that road users should have yielded in a given interaction. More frequent walkers may be more sensitive to pedestrian discomfort and feel more entitled to yielding from interacting road users. Participants who report cycling more frequently rate risk as lower for pedestrian interactions with both bicycles and motor vehicles. This effect could be because of risk desensitization by repeated exposure to motor vehicle traffic during urban cycling, or to greater likelihood of cycling by people who perceive traffic risk as lower. Self-assessed general risk aversion was also not significant in any of the four models.
Best-Fit Models of Rater Agreement with Each Outcome.
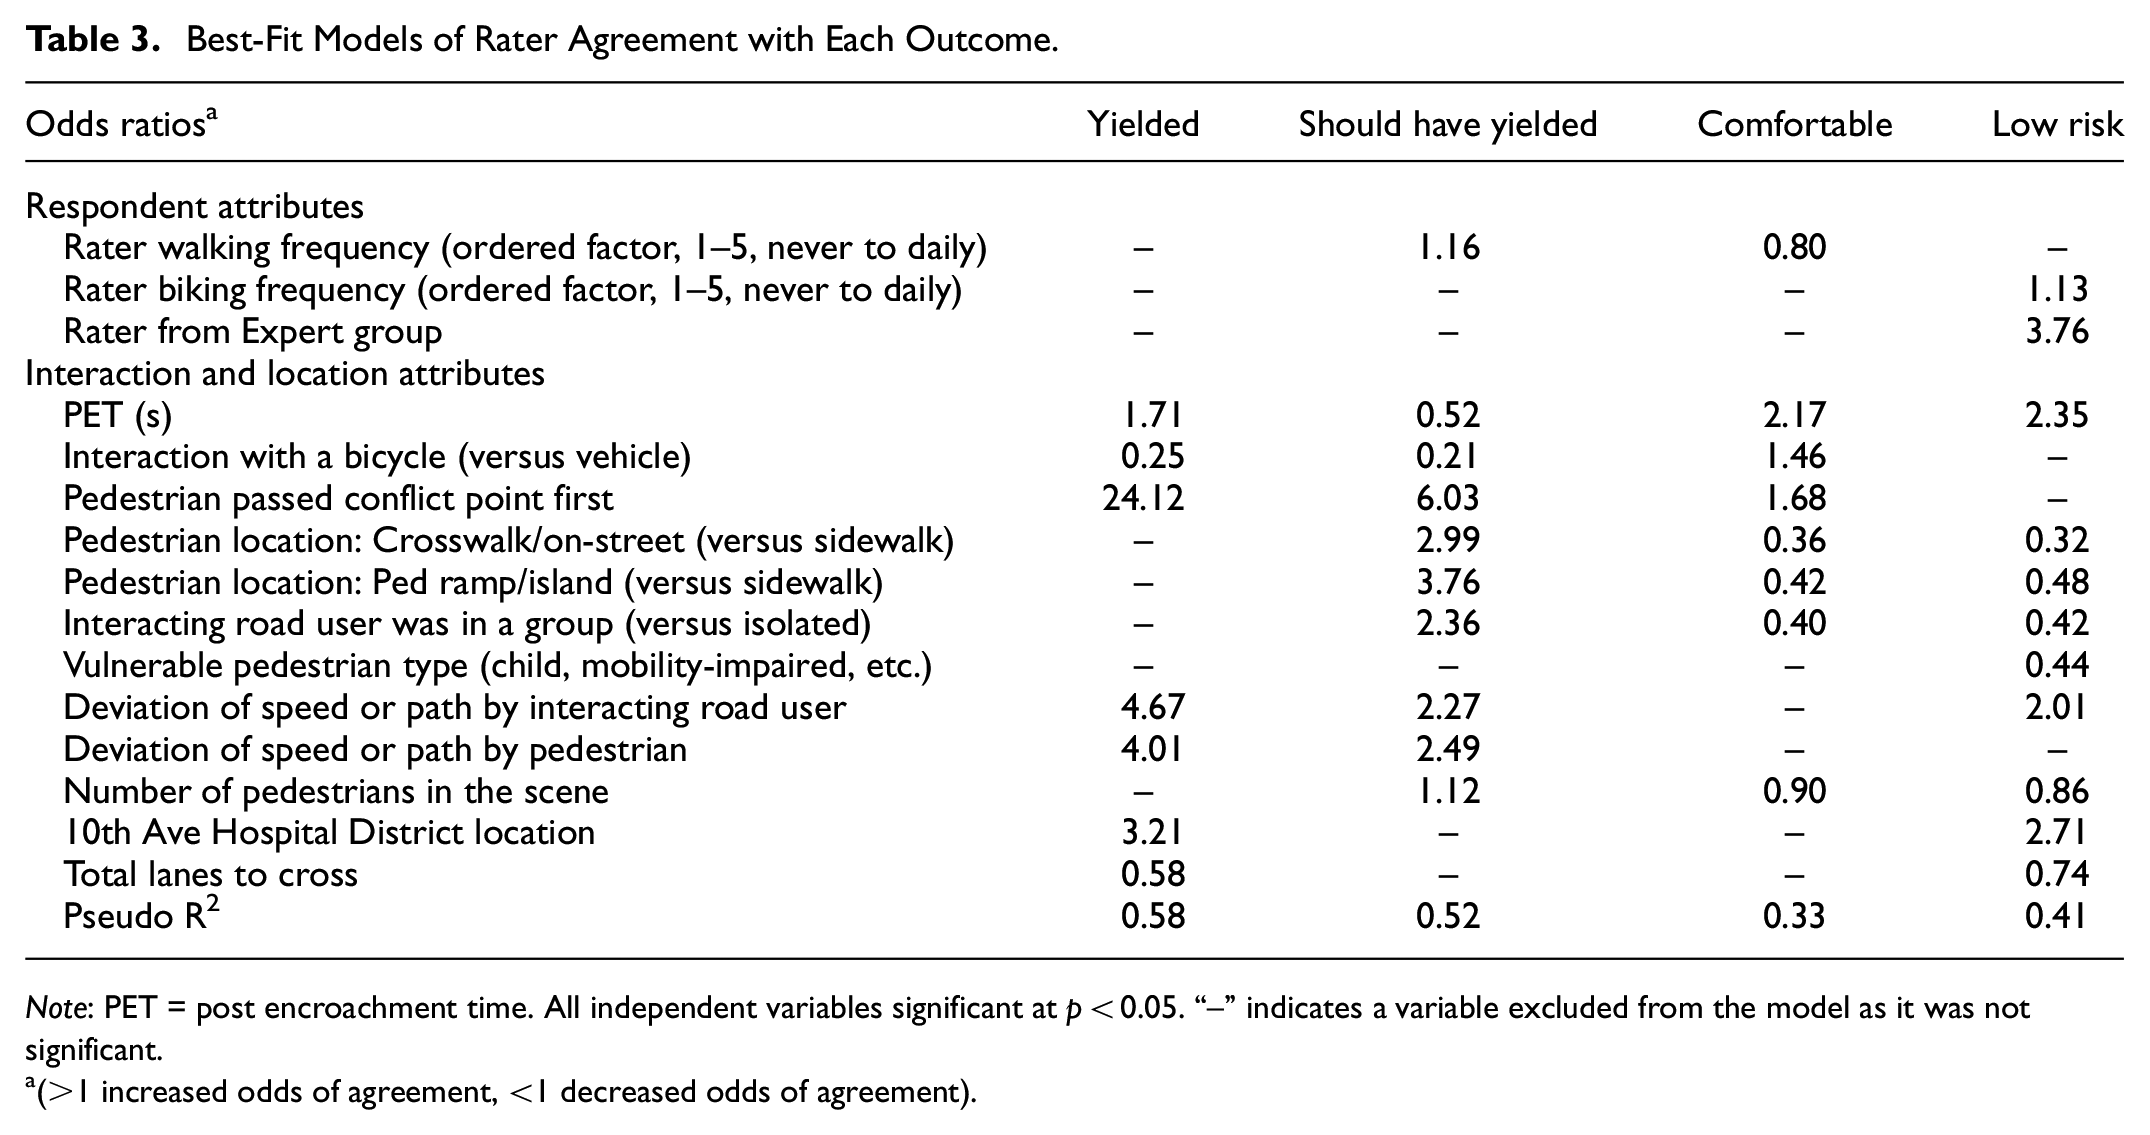
Note: PET = post encroachment time. All independent variables significant at p < 0.05. “–” indicates a variable excluded from the model as it was not significant.
(>1 increased odds of agreement, <1 decreased odds of agreement).
In addition to individual factors, there is a single significant systematic difference among the groups: the Expert group is more likely to rate an interaction as low risk compared with the other two groups. This difference is despite Experts rating the yielding and comfort of the interactions similarly to the other participants. Thus, the difference in risk perception does not seem to stem from different perceptions of yielding behavior, nor extend to perceptions of comfort for the pedestrians. This finding is reinforced because the Experts expressed higher self-assessed risk aversion than the other two groups, suggesting that the lower risk ratings are likely not attributable to greater general risk acceptance. Assessment of risk in these interactions by the Expert group may be reduced by experience evaluating higher-risk traffic situations such as high-speed, high-volume motorways with heavy truck traffic. Traffic safety professionals might have more context and awareness that serious injuries and fatalities in the study conditions (relatively low-speed urban streets) are rare, particularly for pedestrian–bicycle interactions.
As for non-respondent explanatory variables in Table 3, PET is the only significant predictor of all four severity outcomes, consistent with conflict research and supporting its use in defining interactions (7, 54). Higher PET is associated with higher comfort and lower risk, as expected. Pedestrian interactions with bicycles are perceived to be more comfortable than interactions with motor vehicles, likely because of the size difference and easier visual communication between pedestrians and cyclists. Relatedly, cyclists are more likely to be perceived as both not yielding and not needing to yield, as compared with drivers. Estimated parameters for other interaction and location features indicate factors such as complexity and crossing distance relate to yielding, comfort, and risk as expected, largely consistent with past research (17, 55–57).
Conclusion
In this study, we elicited diverse perspectives on pedestrian crossings to understand how different user groups rate interactions in relation to road user yielding, comfort, and safety. We found that perceptions of yielding, comfort, and safety were similar between participants who were members of the public and who were members of an advisory committee. This implies that an engaged group of citizens can accurately represent the safety perspectives and concerns of the general population, despite differing socio-demographics. While recruitment of random samples from the population is generally preferred, advisory groups can provide suitable proxy measures for project evaluation or safety studies. This finding can be beneficial for practitioners seeking public input on proposed projects or design alternatives, because advisory groups would be much faster and easier to access than a representative population sample.
The traffic safety experts who reviewed videos had similar views of yielding and comfort to the other participants, but a consistently lower assessment of risk for pedestrians in interactions with both motor vehicles and bicycles. It might be expected that public risk perception will diverge from professional safety assessments, with the public perceiving greater risk on urban streets, particularly for interactions between users of different travel modes. Public engagement from transportation agencies may need to anticipate this difference and consider how to address it when communicating safety evaluation results. A low-risk finding from an expert consultant may not translate into public perception of safety, and additional measures may be needed to address public perception; simply stating that the risk is low may not suffice. On the other hand, these findings may help agencies in explaining differences in perceived safety. The systematic discrepancy in relative perception of comfort and risk between experts and non-experts is also important for future research on perceived versus objective safety. The mapping of risk onto comfort is likely different for experts because there is not a generally lower perceived severity of interactions, but specifically a lower assessment of risk. To examine whether this finding is unique to the study context, future work should examine the phenomenon at higher-risk locations where experts may perceive higher risk than the public, such as uncontrolled crosswalks on multi-lane arterials or long signalized crossings with high-volume permissive turning movements.
Results from the regression models showed that participant socio-demographics do not significantly relate to perceptions of yielding, comfort, or risk. This finding is contrary to a few studies that report age and gender influence on traveler perception of risk and comfort (17, 20, 58–60). The difference in findings may be related to methods measuring first-person perceptions of travelers versus third-person observations. On the other hand, travel habits do relate to perceptions of yielding, comfort, and risk, and this study suggests they may be more important than socio-demographics in assessing the representativeness of a sample of evaluators in future comfort and safety studies. This finding may also enable practitioners to anticipate some differences among road user groups in perceptions of proposed projects or design alternatives. Perceptions of yielding, comfort, and risk vary substantially among individuals (even within the Expert group), and samples of raters are needed because single raters cannot reliably characterize yielding or interaction severity. Substantial variability of perceptions among safety experts underscores the need for a sufficient number of evaluators in safety assessments and for testing of rating reliability.
An important limitation to this study is that the video data and the Public and Committee raters are from a single city (Vancouver, Canada), with a unique travel environment. Vancouver has relatively high non-motorized travel rates (for North America), and likely greater assumptions around pedestrian priority among the public. This limits the generalizability of the findings and motivates replication in other cities with different walking cultures. Also, video data resolution was limited to protect privacy, which meant that several potentially important and interesting characteristics of the interactions (e.g., distraction or inattentiveness of pedestrians) could not be assessed because of lack of reliability of objective extraction. Finally, only interactions at uncontrolled crosswalks were examined. Future work should investigate perceptions of intermodal interactions in other contexts, such as off-street paths, signalized intersections, access points, and shared spaces. Better understanding of road user interactions is essential to improving traveler comfort and safety on increasingly crowded and multi-modal urban streets.
Footnotes
Acknowledgements
The authors would like to thank the following people for offering valuable direction and advice: Dylan Passmore, Dr. Marie-Soleil Cloutier, Dr. Rebecca Sanders, Elmira Berjisian, Amir Hassanpour, and Sarah Power. We would also like to acknowledge the time and valuable input from all the study participants and the 10th Avenue Evaluation Committee.
Author Contributions
The authors confirm contribution to the paper as follows: study conception and design: Alexander Bigazzi, Meghan Winters, and Gurdiljot Gill; data collection: Gurdiljot Gill, Alexander Bigazzi, and Meghan Winters; analysis and interpretation of results: Alexander Bigazzi, Meghan Winters, and Gurdiljot Gill; draft manuscript preparation: Alexander Bigazzi, Gurdiljot Gill, and Meghan Winters. All authors reviewed the results and approved the final version of the manuscript.
Declaration of Conflicting Interests
The author(s) declared no potential conflicts of interest with respect to the research, authorship, and/or publication of this article.
Funding
The author(s) disclosed receipt of the following financial support for the research, authorship, and/or publication of this article: This research was funded by the City of Vancouver, under Contract Number PS20181727.
The views expressed in this paper are those of the authors and do not necessarily represent the views of the project funders.