
Abstract
Brittle fracture is a major concern to structural engineers as it has significant consequences for safety and cost. Although modern day occurrences of brittle fracture are rare, it is well known that they can occur without warning and may lead to the sudden closure of a bridge, loss of service, expensive repairs, and/or loss of property or life. In Canada, steel bridge fracture is a particularly significant concern because of the harsh climate. If the toughness properties are improperly specified, many steels could be on the lower shelf of the toughness-temperature curve. A comparison of brittle fracture design provisions around the world reveals that more sophisticated approaches have been developed for modeling and understanding brittle fracture in existing and new bridges than those currently in use in North America, including Canada and the U.S.A. This paper describes the European brittle fracture provisions and presents a comparison of the North American and European design provisions using the example of a typical steel-concrete composite highway bridge. On the basis of this comparison, situations where one set of design rules may be more or less conservative are identified, and opportunities for improvement and areas warranting further study are highlighted.
Brittle fracture is a concern for steel bridge designers because of: (i) the significant consequences of failure associated with brittle fracture, (ii) uncertainties surrounding the effects of new alloy choices and fabrication steps (e.g., welding, galvanizing) on the risk of brittle fracture, and (iii) uncertainties surrounding the effects of in-service damage or gradual deterioration on the risk of brittle fracture.
The collapse of the Duplessis Bridge in Trois-Rivières, Québec (failed in 1951, four fatalities) and of Silver Bridge in Point Pleasant, West Virginia (failed in 1967, 46 fatalities) are historical examples of brittle fracture-related failures in North America ( 1 ). Before the early 1970s, Charpy V-Notch (CVN) toughness requirements were not part of any North American specifications (in the U.S.A.). The tragedy of the Point Pleasant bridge was a major initiating factor for research programs in the U.S.A., leading to the American Association of State Highway and Transportation Officials (AASHTO) developing fracture toughness requirements for welds and base metals in 1974 ( 2 – 4 ).
Another notable collapse was the Mianus River Bridge on I-95 in Cos Cob, Connecticut in 1983, where a fracture occurred in the pin and hanger assembly and caused the bridge to collapse, resulting in three fatalities ( 5 ). In the present day, pin and hanger assemblies are rarely (if ever) used in new designs because of their lack of redundancy. Following this failure, provisions were added to the North American bridge design codes, AASHTO LRFD Part 6 and CSA S6, requiring that “fracture-critical members” (FCMs) be identified by the design engineer and be treated with particular attention in the design of new bridges ( 6 , 7 ). The AASHTO definition of a FCM is “a steel primary member or portion thereof subject to tension whose failure would probably cause a portion of or the entire bridge to collapse” and the Canadian Standards Association (CSA) has a similar definition ( 8 , 9 ). This is a distinguishing point between North American codes and the European code, as the latter does not have specific wording on FCMs. Additionally, in the U.S.A., the AWS D1.5 Bridge Welding Code, Clause 12 (known as the Fracture Control Plan) requires that the toughness and fabrication standards are more stringent for FCMs than for non-FCMs ( 10 ).
Since the 1980s, the number of brittle fracture bridge failures has remained reasonably low in North America, though they still occasionally occur in the 21st century. Modern day examples include the Sgt. Aubrey Cosens VC Memorial Bridge in Latchford, Ontario (failed in 2003), the US 422 Bridge (failed 2003) and Hoan Bridge (failed 2000). The latter two examples showed no signs of fatigue cracking on the fracture surfaces and were both caused by a phenomenon on the rise in recent years called constraint-induced fracture (CIF) ( 6 ). This type of fracture tends to occur in connection details involving three welded plates intersecting at a point, leading to an increased risk of brittle fracture because of the resulting local stress concentration and highly constrained triaxial stress state ( 11 ). CIF can occur in bridges even when the steels used on the structure meet CVN and AASHTO requirements. In the case of the Hoan Bridge failure in 2000, the brittle fracture cracks found in all three bridge girders were a result of intersecting and overlapping welds between shelf plates, gusset plates, and transverse connection plates, causing high levels of triaxial constraints. Both the web and flange plate metals had been tested to meet the CVN and AASHTO requirements at the time the structure was built in 1972, and furthermore, they met the CVN requirements at the year of failure.
Brittle fracture is also a concern in cases where fatigue cracks have been identified in existing structures, largely because there is little in the way of guidance provided in the North American bridge codes on what can be done in this situation. Other situations that can result in an uncertain or elevated risk of brittle fracture include fabrication steps such as flame cutting, welding, and galvanizing, and embrittlement caused by impact damage and heat straightening.
From a review of the state-of-the-art in North America and Europe, significant advances have been made in recent decades—not only in the toughness properties of modern steel, but also in the sophistication of the tools available for modeling and understanding brittle fracture in both the design of new structures and the assessment of existing ones. With the development of these tools comes an opportunity to reassess the toughness requirements for avoiding brittle fracture in North American bridges and for more sophisticated approaches to be employed when cases of fatigue cracks or damage by other means (e.g., vehicle impact) are identified in existing structures.
To understand better the state of knowledge on brittle fracture as it pertains to bridges, the existing methodologies and design models currently prescribed in EN 1993-1-10 (Europe), by AASHTO (U.S.A.) ( 8 ), and CSA S6-19 (Canada) ( 9 ) are described and compared in this paper using the example of a typical steel-concrete composite Canadian highway bridge. On the basis of this comparison, situations where one set of design rules may be more or less conservative than the others are identified, and opportunities for improvement of design codes and areas warranting further study are highlighted.
Literature Review
Testing Methods for Evaluating Material Toughness
The most commonly used method in specifications for measuring impact toughness is through the Charpy V-Notch (CVN) test method, because of its low cost and simplicity, and the speed at which the test can be conducted ( 12 ). A specimen of 55 mm × 10 mm × 10 mm with a machined V-shaped notch at the middle is placed in the test apparatus and struck by a swinging pendulum. The initial and final heights of the pendulum are measured and the difference in height is used to calculate the energy absorbed by the specimen until fracture, in Joules (J). The typical procedure consists of testing three specimens at a specific temperature and repeating the test for varying temperatures.
The critical plane-strain stress intensity factor, denoted by KIc, corresponds to the stress at which unstable crack propagation will occur in a specimen ( 12 ). This is commonly determined through either: (i) the bend test, using single-edge-notched precracked beam specimens, loaded in three-point bending, or (ii) the compact test, using single-edge-notched and fatigue precracked plates loaded in tension. Other common shapes for the compact test are disk-shaped and arc-shaped specimens. Although the size of specimens may vary, they must conform to the dimensional proportions specified in ASTM E399 ( 13 ). The test generates force versus displacement plots, where the crack mouth displacement is measured using strain gauges. Specimens are loaded until Pmax is reached and they cannot sustain any more applied load. The calculation of the stress intensity factor, K, is done using equations presented in ASTM E399, which are dependent on the specimen shape. It is recommended that at least three tests are performed for each material condition. KIc tests are performed relatively rarely as a means of quality control as the costs associated with fabricating and preparing the KIc specimens, and performing the test, are high. For this reason, different relationships have been developed to correlate CVN energy and KIc.
Eurocode Simplified Method
The brittle fracture provisions within Eurocode 3: Design of Steel Structures (also referred to as EN 1993-1-10) ( 14 ) consist of two methods of analysis: a simplified method using design tables and a more complex fracture-mechanics-based method. The EN 1993-1-10 simplified method, CSA S6-19 Section 10.23 ( 9 ), and AASHTO LRFD 2017 Part 6 ( 8 ) procedures for brittle fracture all use the minimum service temperature of the location of interest to determine the appropriate steel grade, sub-grade, and CVN test requirements, that is: test temperature (oC or oF) and energy absorbed (J or ft-lb). However, aside from the use of the minimum service temperature as a primary input, the similarities end there. The design table C6.6.2.1-1 in AASHTO Part 6 additionally considers plate thickness for specifying grade and toughness, and has three different temperature zones as opposed to the two specified in the CSA S6 code. EN 1993-1-10 also takes into account numerous other factors in addition to plate thickness, such as the yield strength of the material, stresses on the component, radiation losses, member shape and dimensions, safety allowances, strain rate, and cold forming (if applicable).
A summary of the six steps required for the EN 1993-1-10 simplified method is as follows:
A thickness-adjusted yield strength fy(t) is calculated from the nominal strength, that is:

where t is the thickness of the plate in mm.
2. The maximum stress from external loads, σEd,max (Mpa), is calculated using a serviceability limit state load combination.
3. Three theoretical stress levels are prepared for the lookup table, representing stress from external loads, and are calculated using Equations 2 to 4.


where σEd is the maximum stress level, expressed as a proportion of fy(t).
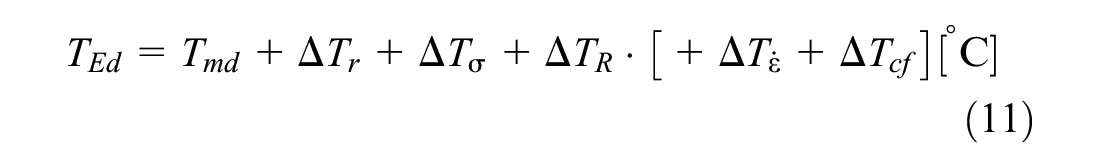
4. The reference temperature at the potential fracture location, TEd, is determined from the minimum extreme temperature with a 50-year return period, with temperature adjustments applied to consider radiation losses, member shape and dimension, safety allowance, strain rate, and degree of cold forming. This is shown in Equation 5. It is noted that Tmd and ΔTr in this equation have units of temperature, whereas the remaining adjustments accounting for other effects are originally in non-temperature units, which are then converted into an “equivalent temperature” for calculating TEd.

where
Tmd is the lowest daily air temperature at the bridge location with a 50-year return period.
ΔTr is an adjustment for radiation loss, which depends on the topography, latitude, albedo, and so forth, of the location of interest. Currently, research has been done in Germany to establish an average value of −5°K radiation loss for the entire country. Other European countries often adopt the −5°K radiation loss from Germany. However, this parameter has not yet been established for various locations in North America.
ΔTσ is the adjustment for stress and yield strength of the material, crack size, member shape, and dimensions. If the detail fits within one of the welded details from the fatigue section of Eurocode 3 (EN 1993-1-9), this term can simply be taken as zero.
ΔTR is a safety allowance, if needed, to reflect reliability levels for different applications.
ΔTε is the adjustment for a strain rate other than the reference strain rate. The design table assumes reference strain rate of ε0 = 4·10-4/s, which is suitable for dynamic action effects for most transient and persistent design situations. For other strain rates (e.g., impact loads), Equation 6 should be used.

ΔTεcf is the cold forming adjustment. The design table assumes non-cold-formed material with εcf = 0%. For any non-zero εcf, an adjustment is calculated using Equation 7.

When the input values for strength and toughness (fy and T27J, the test temperature corresponding to a 27 J CVN impact energy) are based on laboratory test data, there is a level of uncertainty associated with this data. An adjustment of −38°K is used as a conservative adjustment to account for the uncertainties in the input values.
Most European steels manufactured to the standard “EN 10025 - Hot Rolled Products of Structural Steels” ( 15 ) are generally manufactured to a higher standard, so their nominal values of T27J and fy represent a lower bound for the actual material strength and toughness. An adjustment of +7°K can therefore be used to account for the fact that most materials manufactured to the standard are, in reality, much stronger than specified. Note that the difference between the measured and specified toughness in EN 10025 ( 15 ) is 45°K. The +7°K can often be conservatively rounded to 0°K when the steel is manufactured to EN 10025 standard, which was the adjustment used to generate the design table in EN 1993-1-10.
5. A steel sub-grade is then selected from the design table 2.1 in EN 1993-1-10 ( 14 ). Based on the maximum stress of the component, σEd, calculated in Step 4, expressed as a proportion of yield strength, the designer finds the stress level in design table 2.1 (0.75, 0.50, or 0.25·fy(t)). The designer then finds the column corresponding to the reference temperature calculated in Step 4. Based on the maximum plate thickness, the required grade and sub-grade of steel can be determined. Conversely, if the sub-grade is known, the maximum allowable plate thickness for the component can be determined. Linear interpolation can be used for values of σEd/fy(t) between the three tabulated values, or the next highest value can be used.
Eurocode Fracture Mechanics Method
Along with the simplified method, EUR 23510 EN ( 16 ), which is the commentary to EN 1993-1-10 ( 14 ), includes details on how to implement an alternative method using fracture mechanics. The two forms for implementing this method are described in the next sections.
K-Factor Based Method
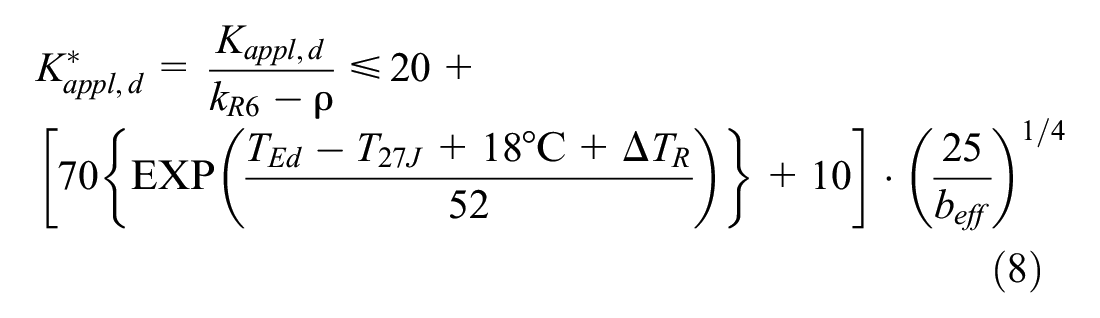
The first form of the fracture mechanics method is based on verifying that the toughness of the material (KMat,d, which is a function of TEd) is greater than the corresponding applied load effect (expressed as the stress intensity factor, Kappl,d). This is shown in Equation 8 as K-values ( 16 ). The original master curve, which forms the basis of this method was developed in Wallin ( 17 ).
The left-hand side of the equation is calculated using Equation 9.
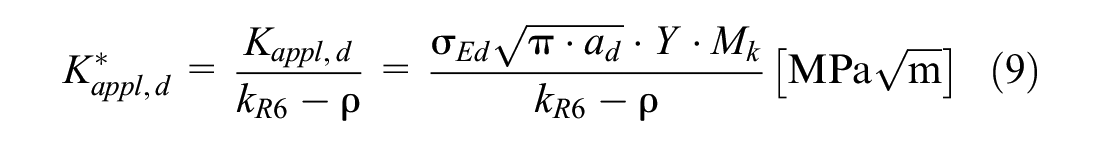
where
ad = design crack size (m);
Y = correction function for various crack positions and shapes [-], for example, based on Newman and Raju ( 18 );
Mk = correction function for various attachments with semi-elliptical crack shapes [-];
kR6 = plasticity correction factor from the R6-Failure Assessment Diagram (FAD) [-]; and
ρ = a correction factor for local residual stresses, taken as zero for non-welded details [-] in relation to Equation 9.
In Equation 8, beff is related to the crack front length and takes on one of the values given in Feldmann et al., table 2–7 ( 19 ).
Temperature Based Method
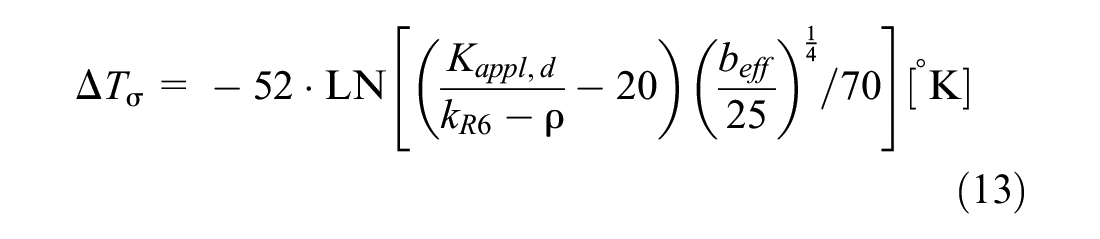
The fracture mechanics method may also be expressed as equivalent temperature. Since the equation is on the temperature scale, the effects on the action side Ed are required to be greater than the resistance side Rd, as shown in Equation 10.

where

The applied stress temperature shift due is calculated using Equation 13 and has a limit of 120°K.
Comparison of Design Provisions for a Typical Bridge
Although the Eurocode takes more factors into consideration, it is uncertain how the results compare with the current North American provisions, and whether this increased complexity is justified. As a first step in investigating these uncertainties, an analysis was performed to compare the brittle fracture provisions in EN 1993-1-10 ( 14 ) with those in CSA S6-19 ( 9 ) and AASHTO LRFD 2017 ( 8 ) using a typical steel-concrete composite bridge based on a design example (see Figure 1) developed by the Canadian Institute of Steel Construction (CISC) ( 20 ). This bridge has four three-span continuous girders (43 m/53 m/43 m) with flange and web plate thicknesses varying along the span.
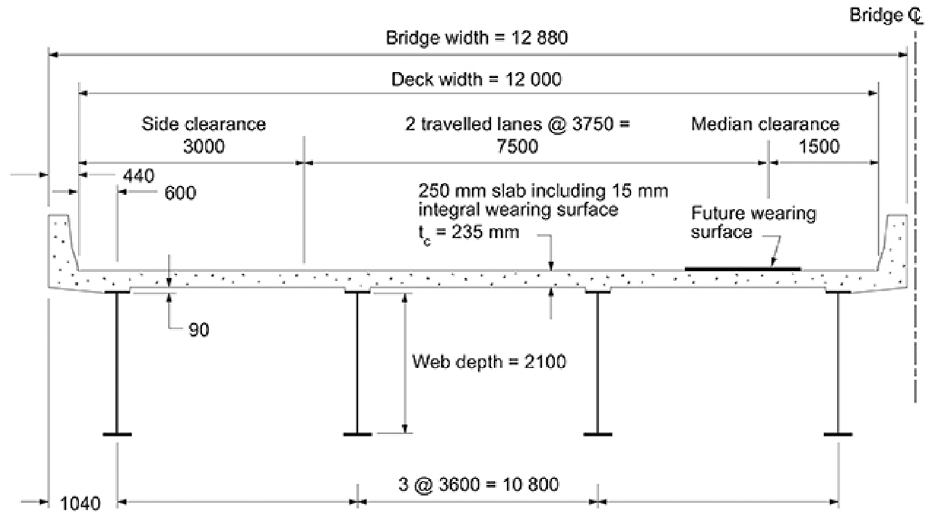
Straight steel-concrete composite plate girder bridge ( 20 ).
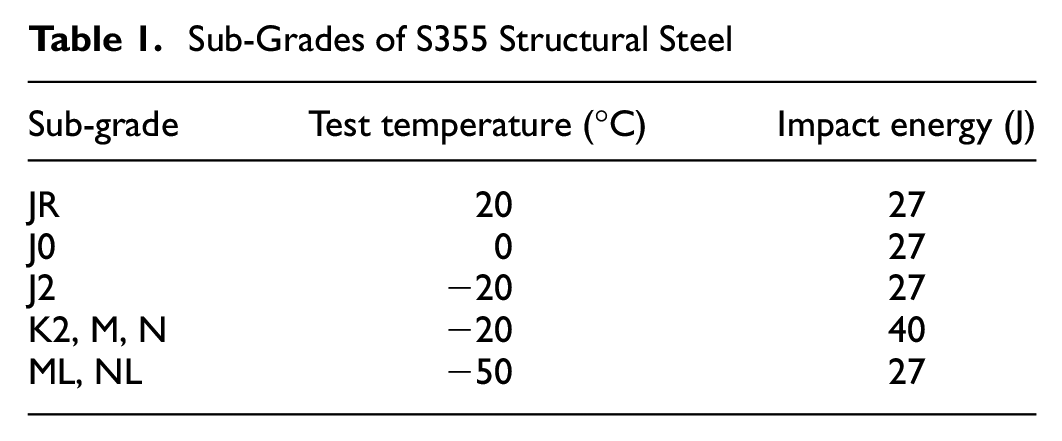
For comparison purposes, the structural steel grades chosen are Canadian 350 W (nominal yield strength of 350 MPa), which is roughly equivalent to European S355 (nominal yield strength of 355 MPa) and American 50 W (nominal yield strength of 50 ksi) steels. Note that European steels are also available in sub-grades, corresponding to different combinations of CVN impact energy and test temperatures for a particular grade. For the S355, the sub-grades are summarized in Table 1.
Sub-Grades of S355 Structural Steel
The first step of the comparison involved varying plate thickness at a single reference point on the girder while holding all other parameters constant, to study the effects of plate thickness variations on the toughness requirements between the three codes. The point selected was Span Reference 5 in CISC’s Straight Plate Girder Bridge Design Example 1, figure 1.17 ( 20 ), the location of maximum positive bending stress along the girder span. A second comparison was then done for the entire bridge span, which looked at the changes in steel sub-grade requirements using EN 1993-1-10 ( 14 ) where the stress level and plate thickness were both varying along bridge length.
The CISC design example provided useful information on the dimensions and loads of a typical North American roadway bridge, but the example is set in “a Canadian town” whose name is unspecified. As climatic data was needed to determine brittle fracture requirements, three Canadian cities of interest were chosen for comparison: Waterloo, ON, Vancouver, BC, and Fort McMurray, AB. These were selected to represent moderate, mild, and severe climates in Canada, respectively.
Extreme Air Temperature Calculation
While CSA S6 bases brittle fracture design on two temperature zones depending on minimum mean daily temperature and AASHTO uses three temperature zones depending on minimum service temperature, EN 1993-1-10 requires that the extreme temperature with a 50-year return period be specified. To determine this parameter, historical daily temperature data was collected from Environment Canada, and the lowest daily temperature was determined for each year. An Extreme Value Type 1 (Gumbel) distribution was fitted to the data, following the procedure in Agarwal et al. ( 21 ) for obtaining extreme wind velocities from similar datasets. It should be noted that the sign on the temperature data was reversed, to obtain the probability of exceeding a negative temperature. The cumulative distribution function (CDF) of the Gumbel distribution is obtained using Equation 14:

where


In this case, T is extreme (i.e., minimum) daily temperature. The extreme daily temperature corresponding with an N year reference period has a CDF which is expressed in Equation 17:

where


Equations 14 to 19 were applied with N = 50 years. Using the CDFs of the extreme 50-year temperature event, 95th percentile values for this parameter were established (i.e., values associated with a 5% probability of exceedance). The resulting design extreme temperature values obtained for Vancouver, BC, Waterloo, ON, and Fort McMurray, AB, were −26°C (−14.8°F), −45°C (−49°F), and −57°C (−70.6°F), respectively. If these were considered “minimum service temperatures” then they would correspond to AASHTO temperature zones 2, 3, and 3, respectively, based on the LRFD Bridge Design Specifications, table 6.6.2.1-2 ( 8 ).
Conversion of Toughness into “Equivalent 27 J”
While the CVN test temperature associated with a 27 J notch toughness is employed in both the Canadian and American design tables, the CVN test temperatures for sub-grades of the European S355 steel are not all specified for a 27 J notch toughness, rendering a direct toughness comparison difficult. The European sub-grades are converted to “equivalent 27 J” sub-grades, with an adjustment made to their test temperature using Equation 14, developed in Kühn ( 22 ), to make direct comparison possible:

where KV is the fracture toughness in J at the test CVN temperature TKV.
Use of Eurocode Design Tables
Table 2.1 in EN 1993-1-10 ( 14 ) is the brittle fracture design table, which sets limitations on the maximum allowable plate thicknesses for a given steel grade, stress level, and reference temperature. As described earlier, either interpolation, or a more simplified “round up” method for the stress level and temperatures, can be applied when using this table.
In the single point comparison, interpolation was utilized, first, for the plate thicknesses at each stress level (0.75, 0.5, and 0.25 fy(t)) corresponding to the reference temperature of each city, and then interpolating the plate thickness for the appropriate stress level (e.g., 0.46 fy(t)). The rounding method was used for the entire bridge span analysis, where the stress level (e.g., 0.46 fy(t)) was rounded to 0.5 fy(t) and the reference temperature was rounded down to the nearest 10°C.
The reference temperature for the severe climate in Fort McMurray fell below the lowest temperature permissible in the current edition of EN 1993-1-10, table 2.1 ( 14 ). For this analysis, the European Commission Joint Research Centre report titled Choice of Steel Material to Avoid Brittle Fracture for Hollow Section Structures ( 19 ) was used for temperatures below −50°C. In that report, table 12–1 covers plate thicknesses for temperatures down to −120°C, but the values above −50°C in the table are slightly different than those prescribed in EN 1993-1-10 ( 14 ). This is because the input parameters in the report vary slightly from those used in the original development of EN 1993-1-10. However, the differences are minor. The extended table 12–1 has been recommended to replace table 2.1 in future versions of EN 1993-1-10, so the use of table 12–1 in this study was considered to be justified.
Application of Fracture Mechanics Method
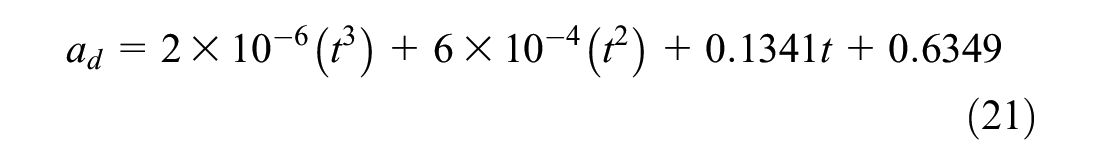
Analyses were also performed using the temperature based Eurocode fracture mechanics method. To compare the effects of CVN test temperature versus plate thickness using this method, first, as the independent variable to be plotted, different CVN test temperatures were set between −50°C and 60°C at 10-degree increments. TRd (the temperature on the resistance side of the design equation) was calculated for each designated temperature using Equation 12. TEd (the action side of the design equation) was calculated using Equation 11. Note that for the adjustment of ΔTσ, values for Kappl,d, kR6, and ρ are calculated using several nested equations, based on the information and tables from EUR 23510 EN ( 16 ). Several assumptions had to be made to apply the correct equations: an assumed fillet weld size of 25 mm, semi-elliptical surface crack, crack depth to width (a/c) ratio of 0.4, and design crack size ad determined using Equation 21.
The effective width, beff, for a surface crack is taken as 5·ad. The stress from external loads is calculated from Equation 22.

where σp is the stress from applied loads at that location of the span, and the additional 100 MPa accounts for residual stresses caused by welding. The stress applied to the gross section to achieve yielding of the net section is calculated using Equation 23 for a semi-elliptical crack.

The value of Lr was then calculated using Equation 24.

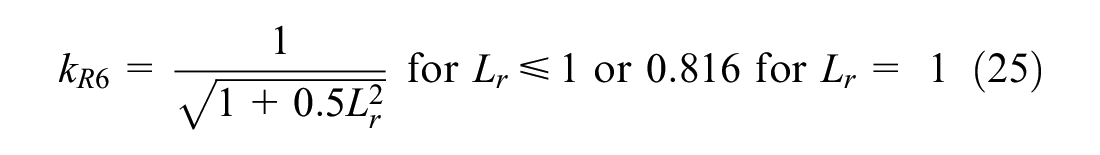
The plasticity correction factor, kR6 is then calculated using Equation 25.
The value of ρ was calculated using the equations in EUR 23510 EN, table 2–6 (16).
The applied K on the action side is calculated using Equation 26.

In this equation, the parameter Y is dependent on the crack shape and configuration. After calculating the values of Kappl,d, kR6, and ρ, ΔTσ is calculated from Equation 13. In Microsoft Excel, the “solver” function was used to solve for the plate thickness, t, such that TEd = TRd for each CVN test temperature increment from −50°C and 60°C. These were plotted alongside the curves for the AASHTO and Eurocode simplified method.
The process was repeated by varying the design crack size by +20% and −20% to assess the sensitivity of the results to defect size. For each of these cases, “solver” was used to obtain the plate thickness.
At Span Reference 5, the ratio of
Discussion of Results
Figures 2 to 7 were produced to show the variation in the required CVN test temperature corresponding to the required steel grade/sub-grade in the three design codes for varying plate thickness. Figure 8 shows the changes in the steel toughness requirement along the bridge span from changes in the girder plate thickness and applied stresses at each point, using the EN 1993-1-10 provisions ( 14 ).
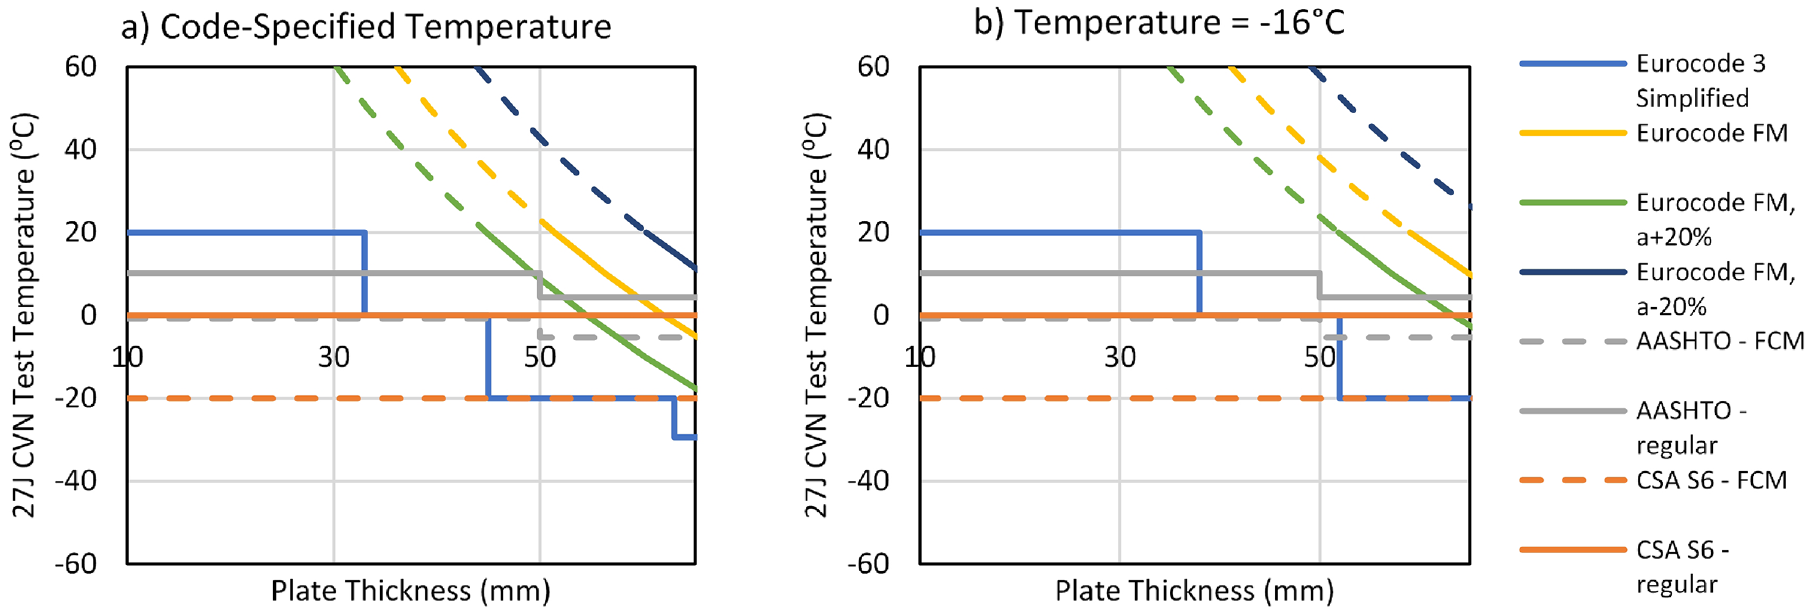
Required Charpy V-Notch (CVN) test temperature for Waterloo, ON (σed/fy(t) = 0.46).
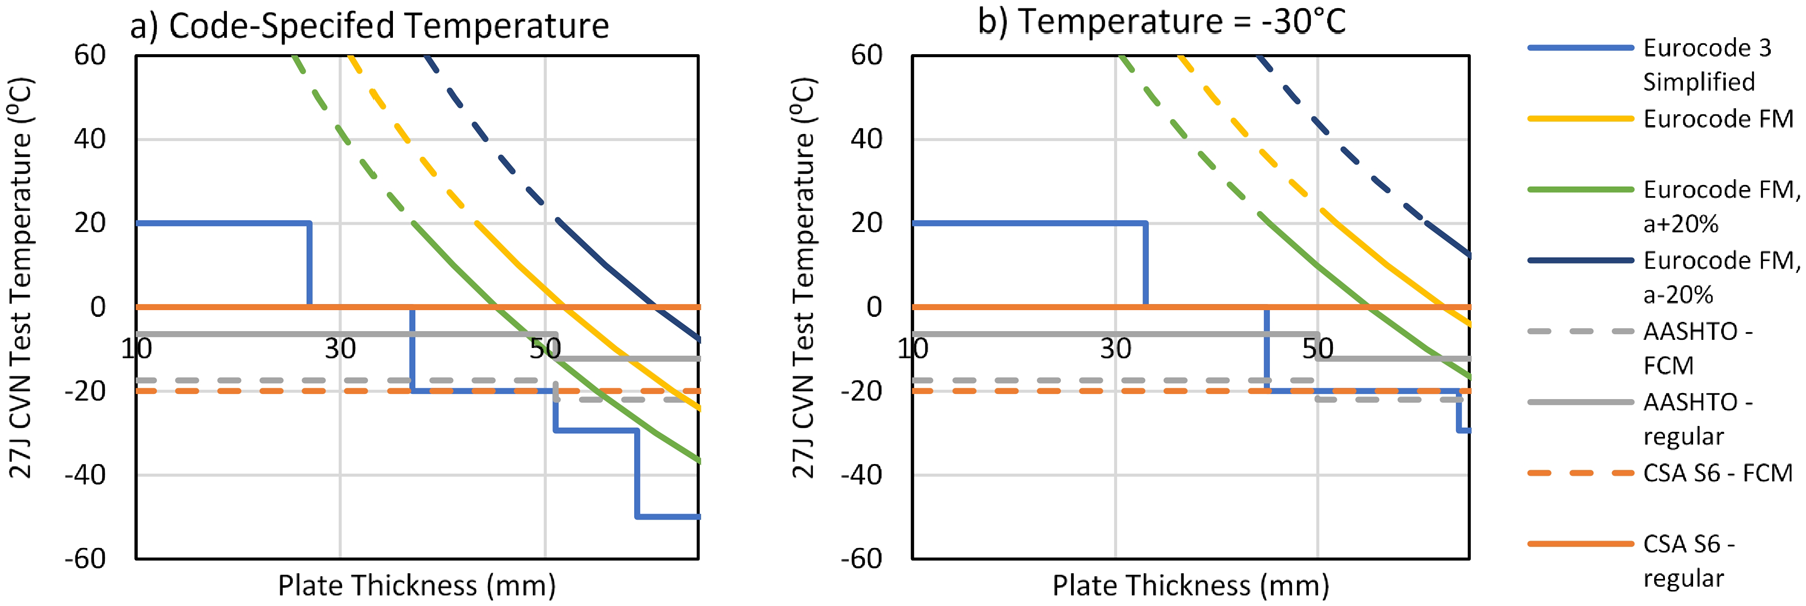
Required Charpy V-Notch (CVN) test temperature for Vancouver, BC (σed/fy(t) = 0.46).
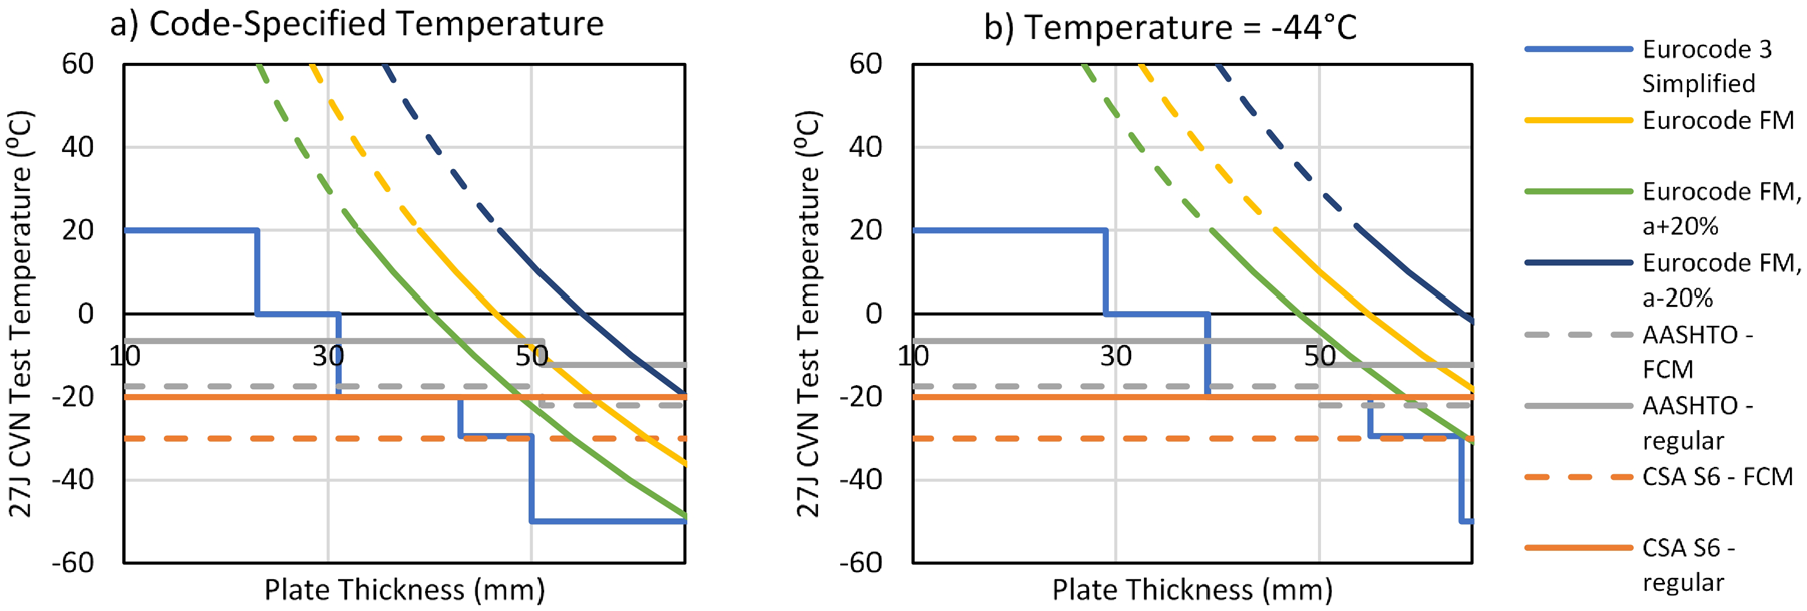
Required Charpy V-Notch (CVN) test temperature for Fort McMurray, AB (σed/fy(t) = 0.46).
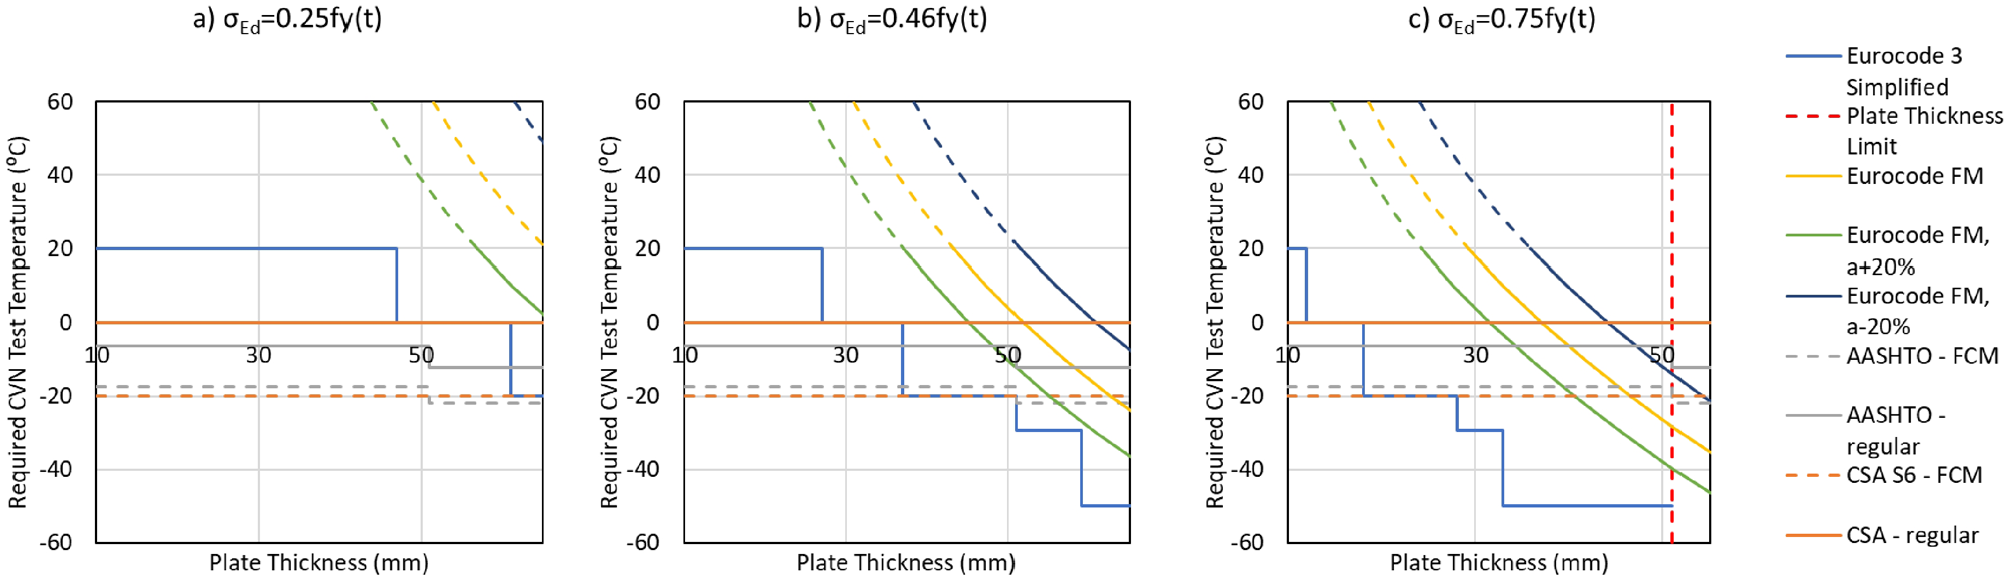
Required Charpy V-Notch (CVN) test temperature for different stress levels for Waterloo, ON.
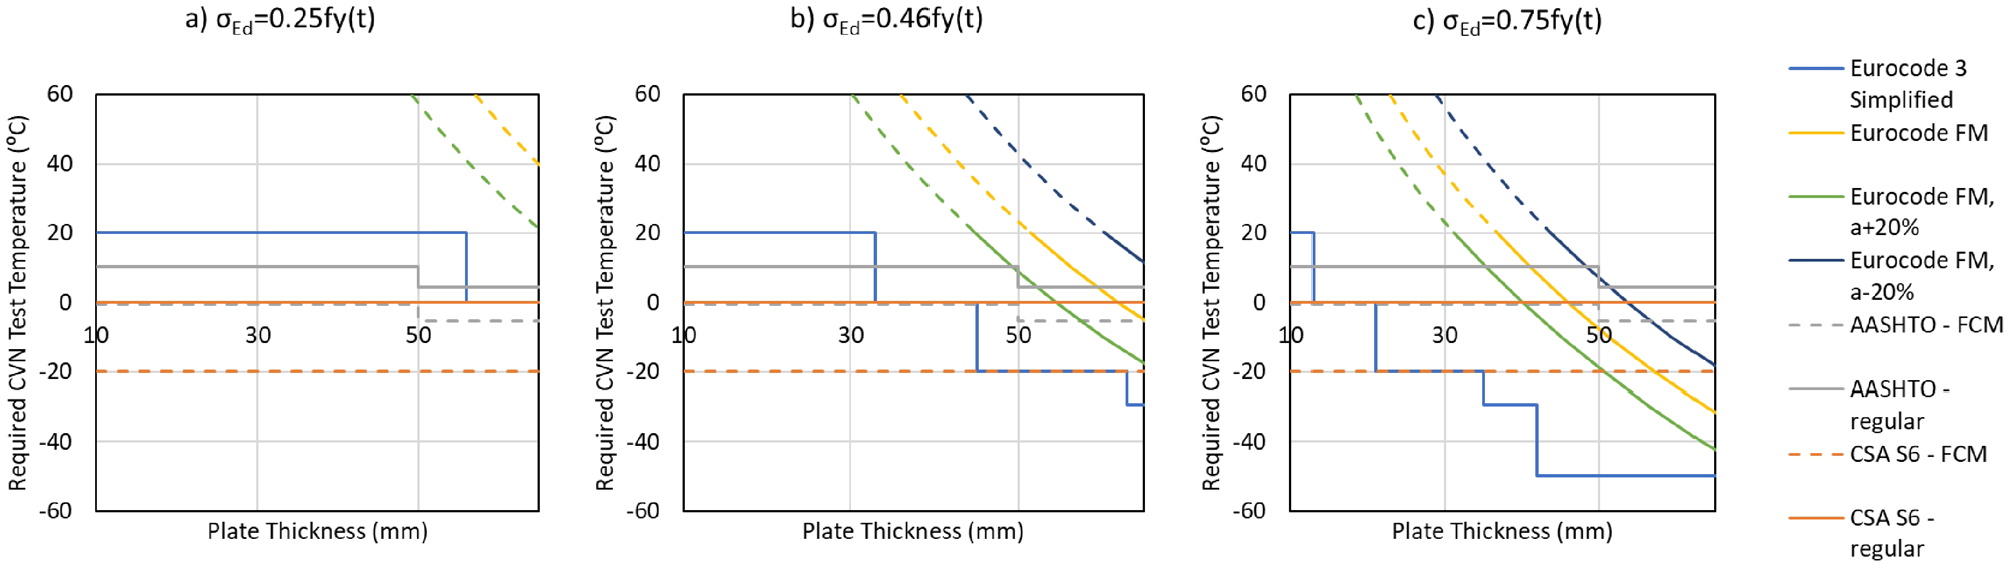
Required Charpy V-Notch (CVN) test temperature for different stress levels for Vancouver, BC.
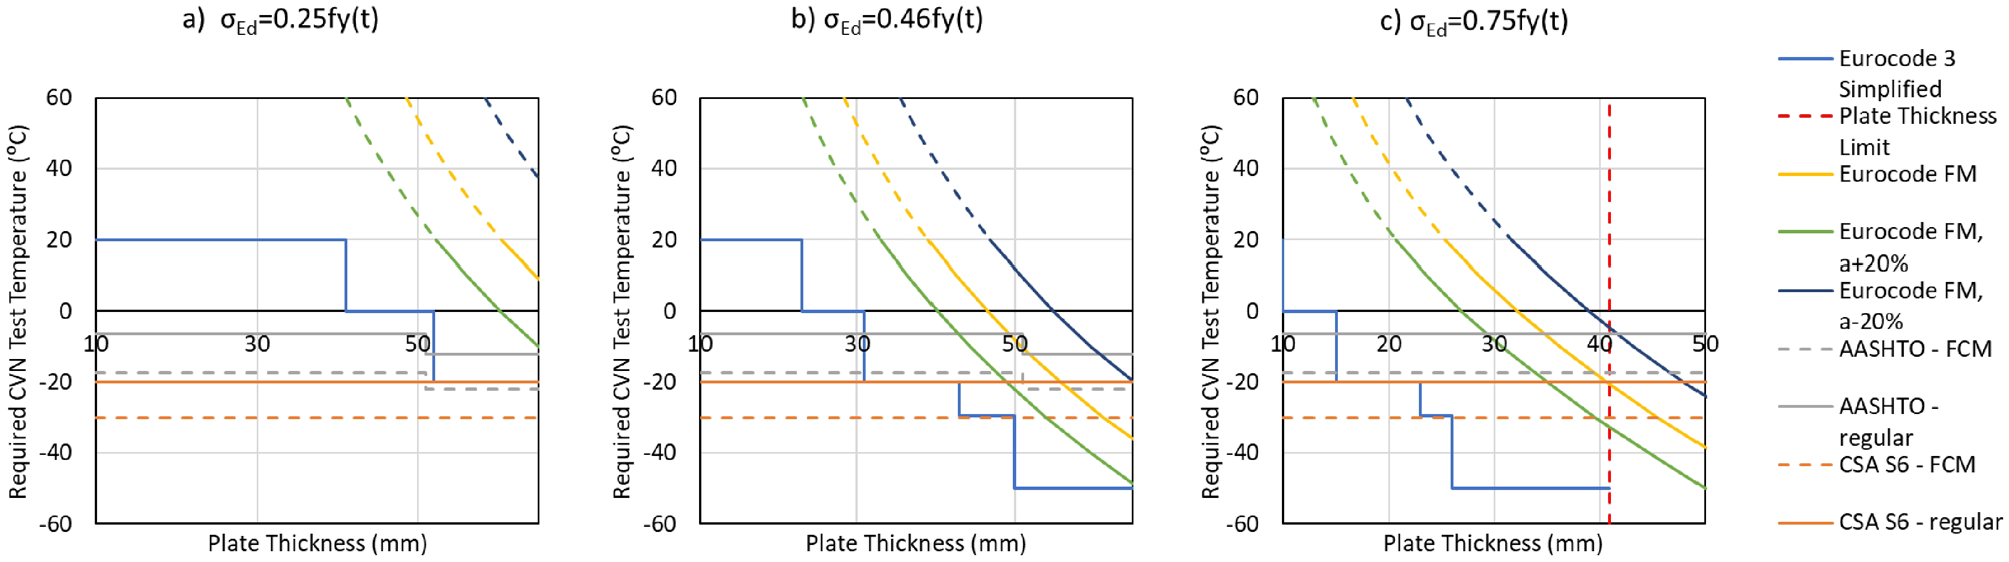
Required Charpy V-Notch (CVN) test temperature for different stress levels for Fort McMurray, AB.
Comparison of Eurocode simplified and fracture mechanics models for three locations.
Single Point Analysis
The toughness requirements in CSA S6 ( 9 ) are independent of plate thickness, as represented by the orange horizontal lines in Figures 2 to 7, and are more conservative than EN 1993-1-10 ( 14 ) for thinner plates, resulting in a lower CVN test temperature requirement for 27 J notch toughness. Both codes have the same toughness requirement in the middle range of plate thicknesses, and EN 1993-1-10 is more conservative for thicker plates. The AASHTO toughness requirement also varies with plate thickness, however, it still follows a similar trend in being more conservative than the Eurocode for thinner plates and less conservative for thicker plates when the CVN test requirements from the AASHTO Table C6.6.2.1-1 are converted from imperial to metric units. This is illustrated by the gray lines in Figures 2 to 7. Solid lines for both the CSA and AASHTO curves represent the non-FCM in the case of the case study bridge used, but the dashed orange and gray lines show the results for what would be FCM, had there been any on the bridge. It is noteworthy that the Eurocode makes no such distinction between regular members and FCMs, as is done in North America.
Figures 2 to 7 also show that the EN 1993-1-10 fracture mechanics method follows the same trend as the simplified method, with the simplified method being slightly more conservative. The yellow curve represents the results from the standard defect size calculated using Equation 21, while the dark blue and green curves represent the results when the defect size, ad, is varied by ±20%. The dashed lines of the fracture mechanics curves exceeding the 20°C CVN test temperature indicate the theoretical upward trend of these curves, while realistically, CVN tests would not generally be conducted at those higher temperatures. Figure 2a shows the results using the code-specified temperature for analysis, and Figure 2b shows the results at a common ambient temperature (before applying any code-specified temperature shifts). It is observed that for the common temperature scenario, the Eurocode curves are shifted to the right, extending the range of thin plates for which the Eurocode is less conservative than the North American counterparts for this example.
Similar trends were observed for Vancouver, shown in Figure 3, and Fort McMurray, shown in Figure 4. Although this analysis is specific to a particular loading scenario for the CISC design example bridge and the climatic data for the three cities of interest, the step function trend from the simplified method is similar for other European steel grades, such that toughness requirements for thicker plates are more rigorous.
Figures 5 to 7 illustrate the effects of the changes in stress level on the toughness requirement. (Note: Code-specified design temperatures are assumed in this comparison.) It can be seen that, when a plate is subjected to lower stress levels (0.25fy(t)), the CSA and AASHTO requirements are consistently more conservative for the range of plate thicknesses considered. At the higher stress levels of 0.46 fy(t) and 0.75 fy(t), the EN 1993-1-10 curves for both the simplified and fracture mechanics methods shift to the left, becoming more conservative for thicker plates, while the CSA and AASHTO still remain conservative for thinner plates at these stresses. The red dashed line on the graphs at 0.75 fy(t) for Waterloo and Fort McMurray represents the limit on maximum plate thickness from the Eurocode 3 simplified method, meaning that any plate exceeding the limit would not be permissible for those stress and climate conditions.
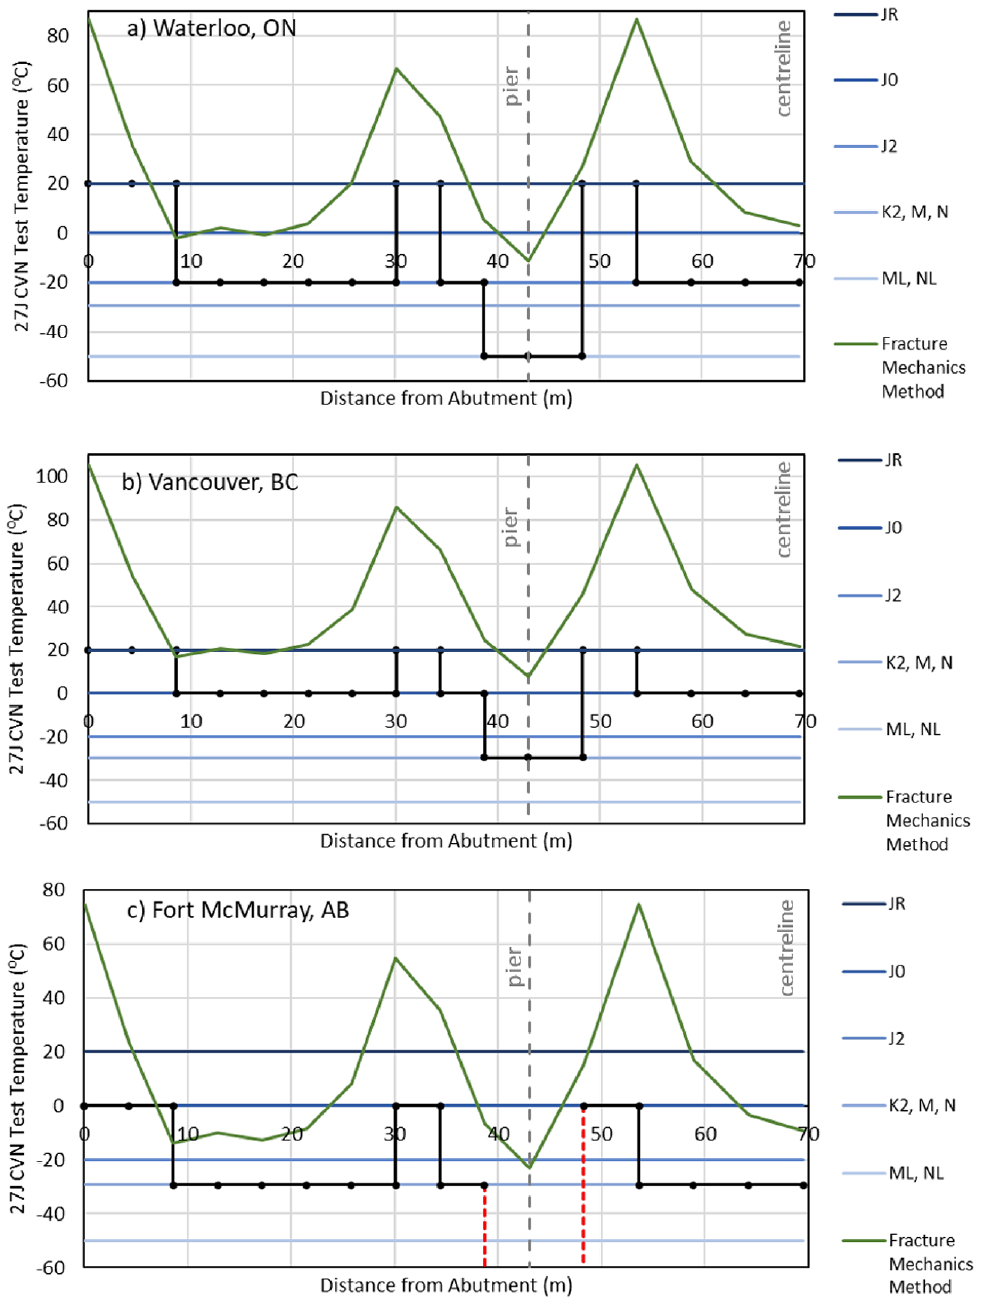
Entire Girder Analysis
Depending on the stresses and plate thickness, the toughness requirement along the length of the bridge can vary significantly, based on EN 1993-1-10 ( 14 ). This is shown in Figure 8. As expected, a mild climate such as that of Vancouver may justify a smaller range of steels with lower toughness requirements using the simplified method—between JR to K2, M, N—while the climatic conditions of Waterloo would require the full range of sub-grades for the European S355 steel grade. In the severe climate of Fort McMurray, a steel sub-grade could not be specified for Span Reference 11 (in the vicinity of the intermediate bridge pier), where the maximum negative moment occurs, as indicated by the dotted red lines in Figure 8c. This discontinuity occurs because the plate thickness exceeds the maximum allowable plate thickness—even for the toughest available sub-grade of S355—for the particular stress condition and reference temperature using the simplified method. In this case, a different steel grade would need to replace the S355 for the plate thickness at this location to fall within allowable limits.
It is also observed that the fracture mechanics curve follows the same trend as the simplified method, similar to the single point analysis. In general, the toughness requirement from the simplified method remains more conservative than the fracture mechanics method, with few exceptions near the 5 to 10 m distance from the abutment. This could be caused by the use of the “round up” method when applying EN 1993-1-10 table 2.1 ( 14 ) to generate Figure 8, where stress level and and reference temperature were rounded up on the table instead of interpolated. It is also noted that since the fracture mechanics method is generally less conservative than the simplified method, there is no discontinuity at Span Reference 11, and the steel grade of S355 would be permissible.
This type of graph could help designers determine the toughness requirement to specify the correct steel grade for the design of new bridges. Although the toughness requirement varies along the length, it is generally preferable to use the same grade along the entire bridge for ease of construction. In this example case study, the pier is the location of maximum negative stress and governs the fracture toughness requirement for the entire bridge. It is observed that the locations of lower toughness requirement (i.e., JR sub-grade) are generally near the inflection points. One possible use for this type of output might be to permit a lower toughness level at positions along the span other than the critical one for assessment purposes, such as assessing a point along the bridge span where a fatigue crack has been detected or the structure has been damaged—for example, by vehicle impact—or has a fatigue-prone detail present.
Conclusion and Future Work
This paper describes a comparison of the existing brittle fracture provisions in AASHTO, CSA S6, and EN 1993-1-10 ( 8 , 9 , 14 ), using a typical steel-concrete highway bridge as an example. In this comparison, it is found that the steel toughness requirements in AASHTO and CSA S6 are more conservative than EN 1993-1-10 for thinner plates, and less conservative for thicker plates. For the S355 and 350 W (50 W) steel in the thick plate range, the discrepancy in the CVN test temperatures suggests the North American toughness requirements and brittle fracture design rules might benefit from a review to consider the effects of factors such as stress range, plate thickness, and cold work more explicitly. On the other hand, the North American provisions require fewer assumptions and are considerably simpler to implement, so it should be a kept in mind that any efforts along these lines would benefit from retention of these positive attributes. The North American provisions also consider fracture criticality implicitly, whereas the Eurocode provisions do not. It is worth noting that the case study bridge used in this work is a typical structure, but contains no FCMs, and therefore does not consider all of the scenarios that may be relevant in steel bridge design. Extending the work to consider other structure types, including bridges containing FCMs, would be a worthwhile area of further study. It must also be acknowledged that the current study is limited to a deterministic framework, consisting essentially of an implementation of the various provisions as they would be used by a bridge designer. To understand better the safety levels being provided by these provisions, implementation in a probabilistic framework, considering the time-varying nature of the bridge live load and temperature, would be necessary.
According to EN 1993-1-10 ( 14 ), the toughness requirements of steel can vary along a bridge span. This information, while perhaps not useful in specifying steel grades for new construction projects, may be used in permitting lower toughness levels at critical locations on existing bridges in particular regions to avoid expensive and unnecessary retrofits. Further work would be needed, however, to explore the value and potential pitfalls of using such an approach for assessment purposes, for example, through the use of case study applications and comparisons with the simpler existing approaches. In addition to this possibility, the fracture mechanics method in EN 1993-1-10 allows the effect of crack size to be explicitly considered. Developing a similar approach that is consistent in other respects to the North American design standards could result in a valuable tool for the assessment of existing structures after fatigue crack development (resulting in a larger defect size in the brittle fracture analysis) or impact damage (resulting in an unanticipated local stress concentration and localized cold working of the girder steel).
Footnotes
Author Contributions
The authors confirm contribution to the paper as follows: study conception and design: MYX. Chien, S. Walbridge and B. Kühn; data collection: MYX. Chien and B. Kühn; analysis and interpretation of results: MYX. Chien and S. Walbridge; draft manuscript preparation: MYX. Chien and S. Walbridge. All authors reviewed the results and approved the final version of the manuscript.
Declaration of Conflicting Interests
The author(s) declared no potential conflicts of interest with respect to the research, authorship, and/or publication of this article.
Funding
The author(s) disclosed receipt of the following financial support for the research, authorship, and/or publication of this article: Financial support of this research project has been generously provided by the Canadian Institute of Steel Construction (CISC) and the University of Waterloo’s International Research Partnership Grants (IRPG) program. The Ontario Graduate Scholarship (OGS) program and Natural Sciences and Engineering Research Council of Canada (NSERC PGSD3 - 558769 - 2021) have also provided scholarships to the first author, which were instrumental in enabling this research project.