
Abstract
Information and communication technologies have opened the way to guide recent developments in the field of parking. In this paper these technologies are applied to model a decision support system that gives insight into 6-months ahead parking occupancy forecasts for 57 off-street parking locations in Amsterdam. An effect analysis was conducted into the influence of weather-, event-, parking tariff-, and public transport attributes on parking occupancy. The most influential factors on the parking occupancy were the scheduling of artistic and sports events, the addition of a public transport line, and the weather variables thunderstorm, average wind speed, temperature, precipitation, and sunshine duration. Parking tariffs did not significantly contribute to model performance, which could have been because of the lack of data and time variability in the parking tariffs of the examined parking locations. The forecasting algorithms compared were the seasonal naive model as a benchmark approach, the Box–Jenkins seasonal autoregressive integrated moving average with and without exogenous regressors (SARIMAX and SARIMA, respectively), exponential smoothing models, and the long short-term memory neural network. The SARIMAX model outperformed the other algorithms for the 6-months ahead forecasts according to the lowest root mean square error (RMSE). By including the event factor, the model improved by 24% based on the RMSE. Weather variables improved the predictive performance by 8%. Future studies could focus on the addition of more event variables, extension into an online model, and the impact of spatial–temporal features on parking occupancy.
The development of low-cost, on-demand shared mobility systems and the rise of the autonomous vehicle have made the topic of transportation central to current debate ( 1 ). Yet, innovations and developments in the field of parking are happening more quietly on various fronts, such as in relation to technology, and research and design ( 2 ). One of these developments is the reduction or elimination of parking minimums, which refers to the minimum amount of parking space required. Cities at the forefront of parking progress have reduced or removed parking minimums and replaced them with maximums, eventually resulting in a decrease in parking supply ( 3 ).
Another development is dynamic pricing, in which parking prices vary based on dynamic factors. One factor is pricing based on expected parking occupancy. Transport experts have found an optimal amount of 15% of unoccupied parking space minimizes the time spent “cruising for parking,” which adds substantially to the severity of downtown congestion ( 4 , 5 ). To reach this optimum, drivers pay a higher price to park in more desirable parking locations. Another factor is pricing based on the emission levels of vehicles. In some European cities such as Amsterdam and London, cleaner vehicles pay a discount rate on parking charges, whereas a higher rate applies to vehicles that pollute more ( 3 ). Recently, such developments have become even more relevant, as more public space is required as a result of the COVID-19 pandemic. Major cities such as Athens, Paris, and Berlin have set the goal to liberate public spaces from cars to allow for clean traffic alternatives, such as walking and cycling.
As is the case in several other affluent cities, Amsterdam is actively engaged in developments to reduce the negative impacts of traffic and transport on the environment ( 6 ). The municipality of Amsterdam is striving to promote cleaner transport alternatives, such as cycling and public transport, a reduction in cars on the streets, and a reduction in parking locations, to create more public spaces ( 7 ). To support decision making in relation to these policy measures, information about environmental factors that influence parking behavior and predicted parking occupancy is required. The objective of this paper is to propose a forecasting model that provides insights into future off-street parking occupancy.
For this study, historic off-street parking occupancy information for 57 public parking garages and park and ride locations in Amsterdam was used. These parking locations were either offered and controlled by the municipality of Amsterdam or by commercial companies, and covered over 90% of the total public off-street parking locations in Amsterdam. The parking occupancy data were obtained from open data feed and were retrieved from the barrier systems at the parking locations. Using this data, a model is presented that furthers insights into the factors affecting parking choice. The temporal models that were compared to predict parking occupancy for 6 months ahead were long short-term memory (LSTM), seasonal autoregressive integrated moving average with and without exogenous variables (SARIMAX and SARIMA, respectively) and exponential smoothing model (e.g. error trend seasonality [ETS] models). The benchmark was a seasonal naive model. We additionally present a software system to visualize the predicted parking data on a map, allowing decision makers to consult the occupancy rate forecast for 6 months ahead.
This paper is organized as follows. First we discuss related literature on parking occupancy forecasts and the interaction between parking and the built environment. Next, the model setup is given and we analyze the empirical parking data set. We then discuss the factors that may affect off-street parking choice and give the results for the effect analysis. We subsequently propose five temporal forecasting models and present the results and analysis for the models. We conclude with a summary of our findings and recommendations for further research.
Related Literature
The prediction of vehicle parking occupancy and urban land-use and transport planning have been studied extensively during the last decade. For example, Manville and Shoup studied the interplay between parking and the built environment in the city of Los Angeles, and concluded that eliminating the minimum standard led to a 40% to 55% reduction in the parking supply ( 8 ). Christiansen et al. analyzed the impact of parking availability at the start and end of a trip on mode choice ( 9 ). They concluded that parking restrictions at the workplace are more effective in reducing car use on work trips than regulation through parking fees. Liu et al. investigated the interaction between parking and the built environment in densely built neighborhoods in China ( 10 ). They found that the parking market can actively decrease the residential parking ratio, that minimum parking standards lead to more office parking in dense neighborhoods, and that better transit services and lower parking ratios are supported. However, the increase in office parking in these neighborhoods counteracted the benefits of compact development. De Gruyter et al. explored the association between high-quality public transport and reduced car parking requirements in Melbourne ( 11 ). They concluded that a 10% increase in public transport service supply is associated with a 0.9% to 1.2% reduction in car parking demand.
In the field of parking occupancy prediction, Stolfi et al. compared various models on parking prediction in the city of Birmingham and found that the time series method provided the most accurate results ( 12 ). They also presented a web page prototype to visualize current and historical parking data on a map. In comparison to Stolfi et al.’s research ( 12 ), the current study models for a larger time span and incorporates external factors. Yang et al. proposed a real-time model using deep learning approaches such as LSTM for occupancy forecasting in the Pittsburgh downtown area ( 13 ). For input, they used heterogeneously structured traffic data sources such as parking meter transactions, traffic speed, and weather conditions. They concluded that incorporating traffic speed and weather information significantly improved parking predictions.
In various time series analysis studies on parking space prediction, variants of ARIMA have achieved valuable results. For example, Zhu et al. applied an ARIMA model with an additional real-time short-term forecasting framework to create a parking guidance system in Nanjing, China, which outperformed both a conventional neural network method and the Markov chain method ( 14 ). Friso et al. implemented seasonal ARIMA in a short-term traffic prediction case study that, despite its simplicity, obtained more accurate results than more complicated methods like multivariate spatial–temporal ARIMA ( 15 ). A major difference between these studies, which are for real-time purposes and predict one-step ahead, and the cuurent study is that the purpose of this research was to gain insights into parking occupancy over a greater time span.
The following studies highlight the most important factors that influence car drivers’ parking decisions. According to Kaplan et al., historic parking data are influenced by past parking availability for predetermined time intervals, days of the week, weather conditions, and events ( 16 ). Other influential factors found by van der Waerden et al. include parking cost and walking distance ( 17 ). Likewise, Khaliq et al. found that the key attributes drivers consider are “walking distance to destination” and “parking cost” ( 18 ). Golias et al. studied off-street parking-choice sensitivity and concluded that the difficulty experienced finding a parking space is a more important factor than the increased parking fee ( 19 ).
Although real-time one-step-ahead predictions have been studied widely, only a few studies are available on many-steps-ahead predictions. These studies predict occupancy for 1 ( 20 ) to 2 weeks ( 12 ) ahead. Contrary to previous studies, this study had a time span of 6 months ahead. Parking occupancy forecasts of this time span are especially suitable for short-term policy decision-making, such as the organization of parking supply for events by, for instance, dynamic pricing.
Model Setup
The system architecture of the model is given in Figure 1. The data set contained information about occupancy and capacity per minute for the 57 parking locations in Amsterdam during 2018 and 2019. As it contained warnings, errors, and missing values, these were first detected and imputed using Kalman filter imputation ( 21 ). Afterwards, parking occupancy was aggregated into hourly data using the robust median. The cleaned data set was used to compare the LSTM, SARIMAX, and ETS models with a benchmark seasonal naive model. The hourly forecasts of the best performing model can be loaded into a decision support system (DSS). The goal of a DSS is to provide clear insights into forecast parking occupancy to assist a human decision maker to more effectively make choices on parking. The user can work interactively with this system by providing inputs on certain parking locations and time ranges, the results of which can then be saved. The user interface employed the graphics from OpenStreetMap to visualize the off-street parking locations.
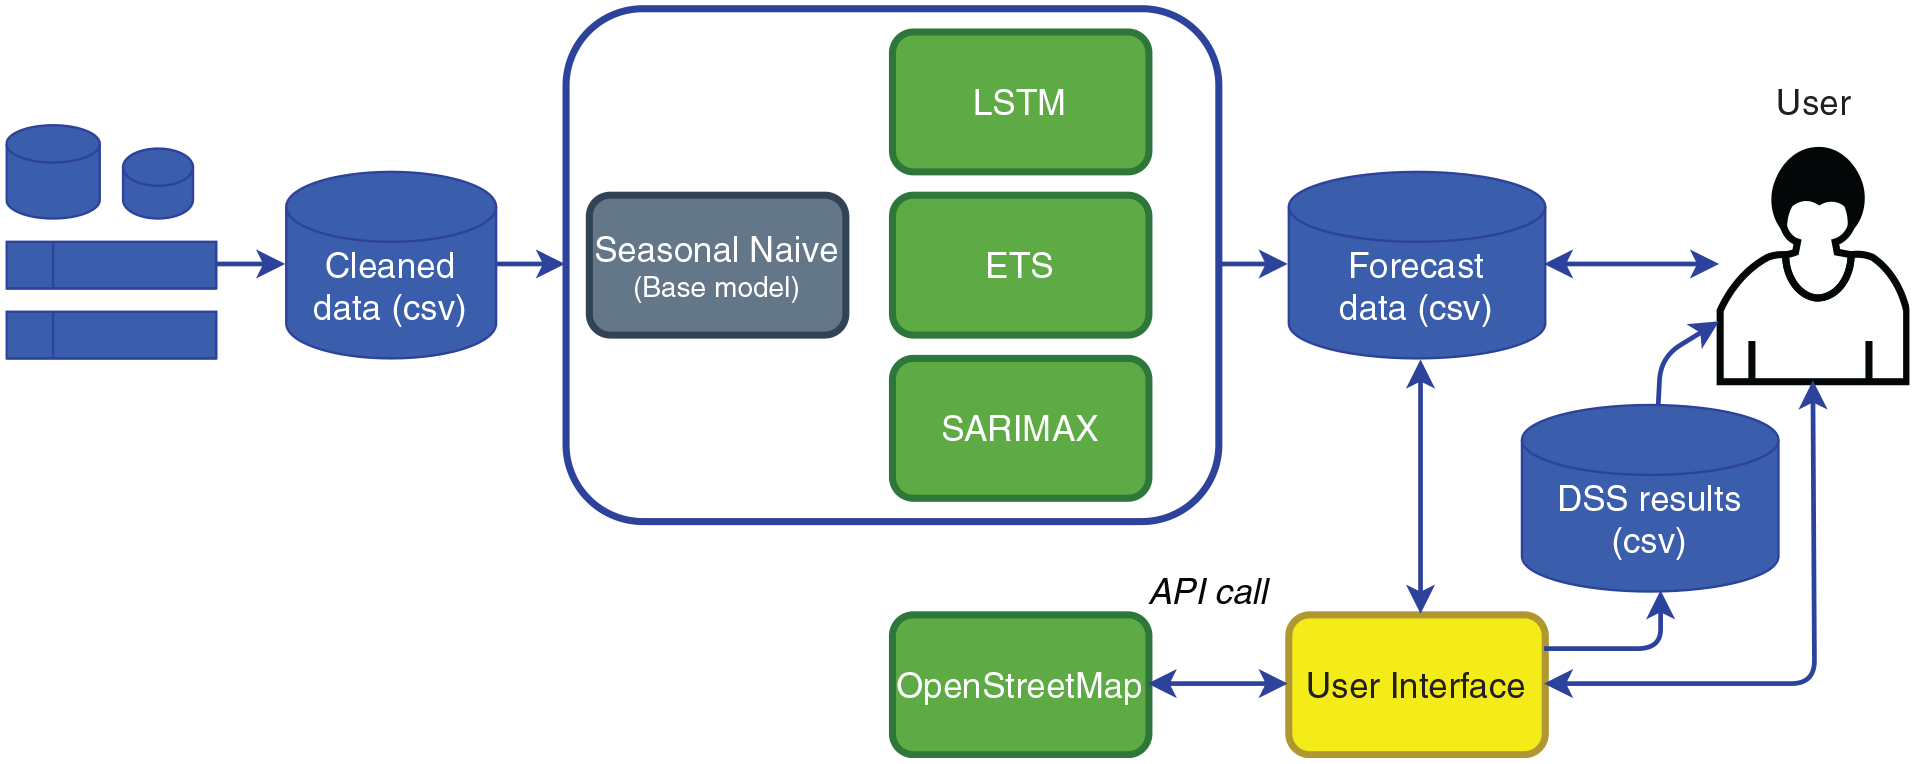
System architecture of the forecasting model.
Empirical Study
For the visualization in this study, six parking locations were highlighted. Figure 2 presents the spatial arrangement of these locations: ZO-P03 Mikado, ZO-P06 Pathé Johan Cruijff ArenA, ZO-P10 Plaza ArenA, and CE-P03 Piet Hein are operated by the municipality of Amsterdam. The other locations are operated by a commercial parking provider.
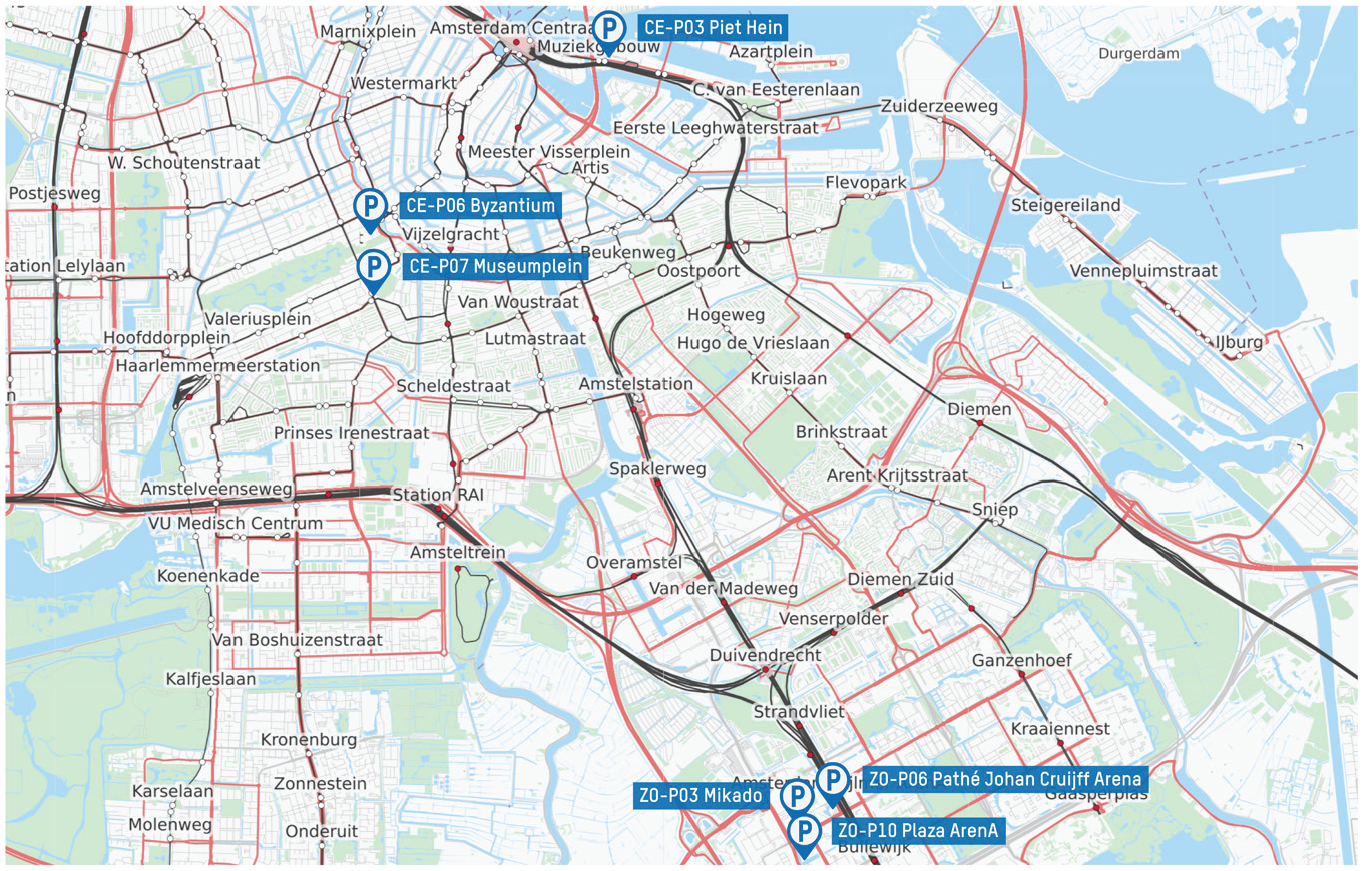
Locations of the parking garages.
Figure 3 visualizes the parking locations’ environment, which contains a soccer stadium, multiple concert halls, and a railway station. Other facilities include an apartment block, a shopping center, and a business park. Therefore, this neighborhood attracts residents and travelers with various purposes. The other three locations, CE-P03 Piet Hein, CE-P06 Byzantium, and CE-P07 Museumplein, are located in Amsterdam’s historic city center. The environment of CE-P03 Piet Hein is given in Figure 4.
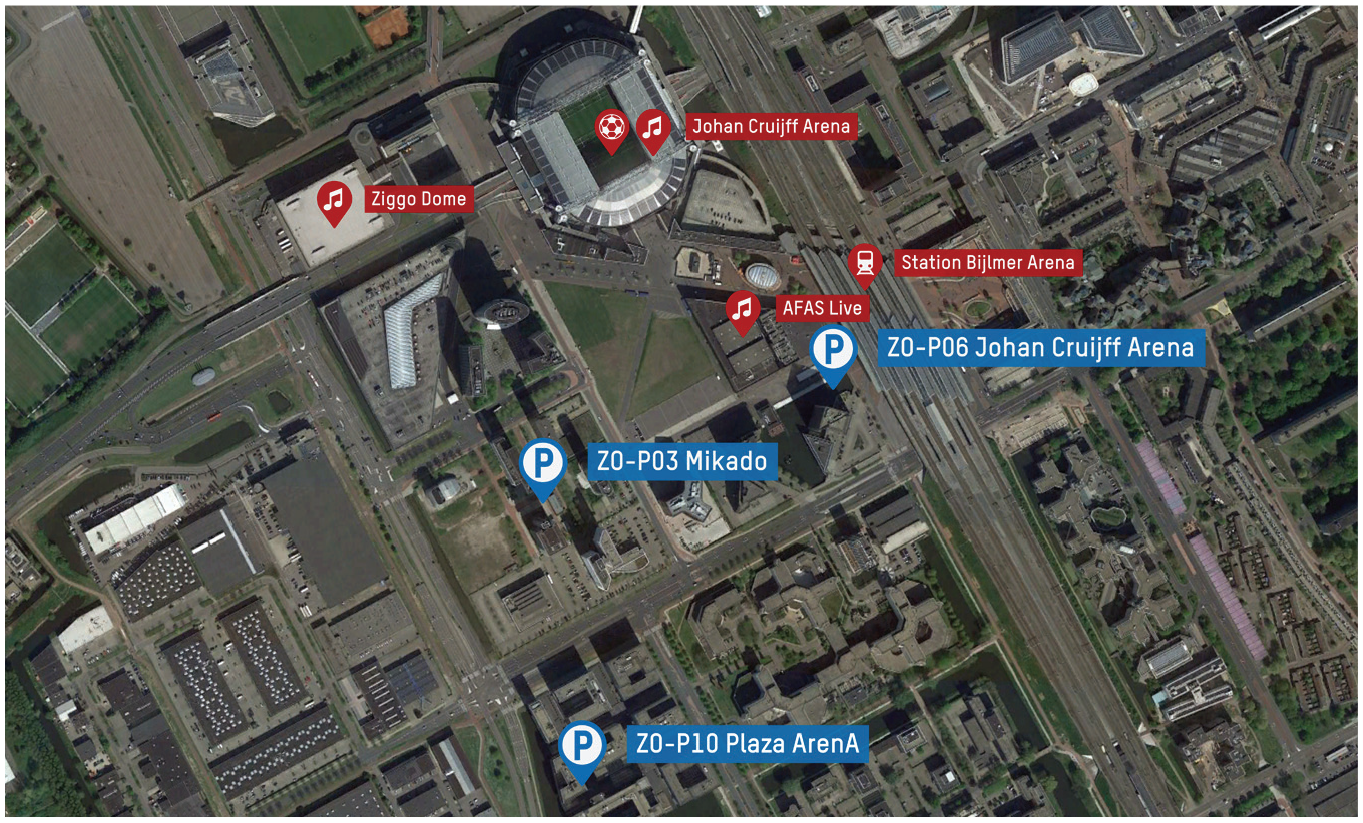
Spatial environment of the parking garages in the southeast of Amsterdam.
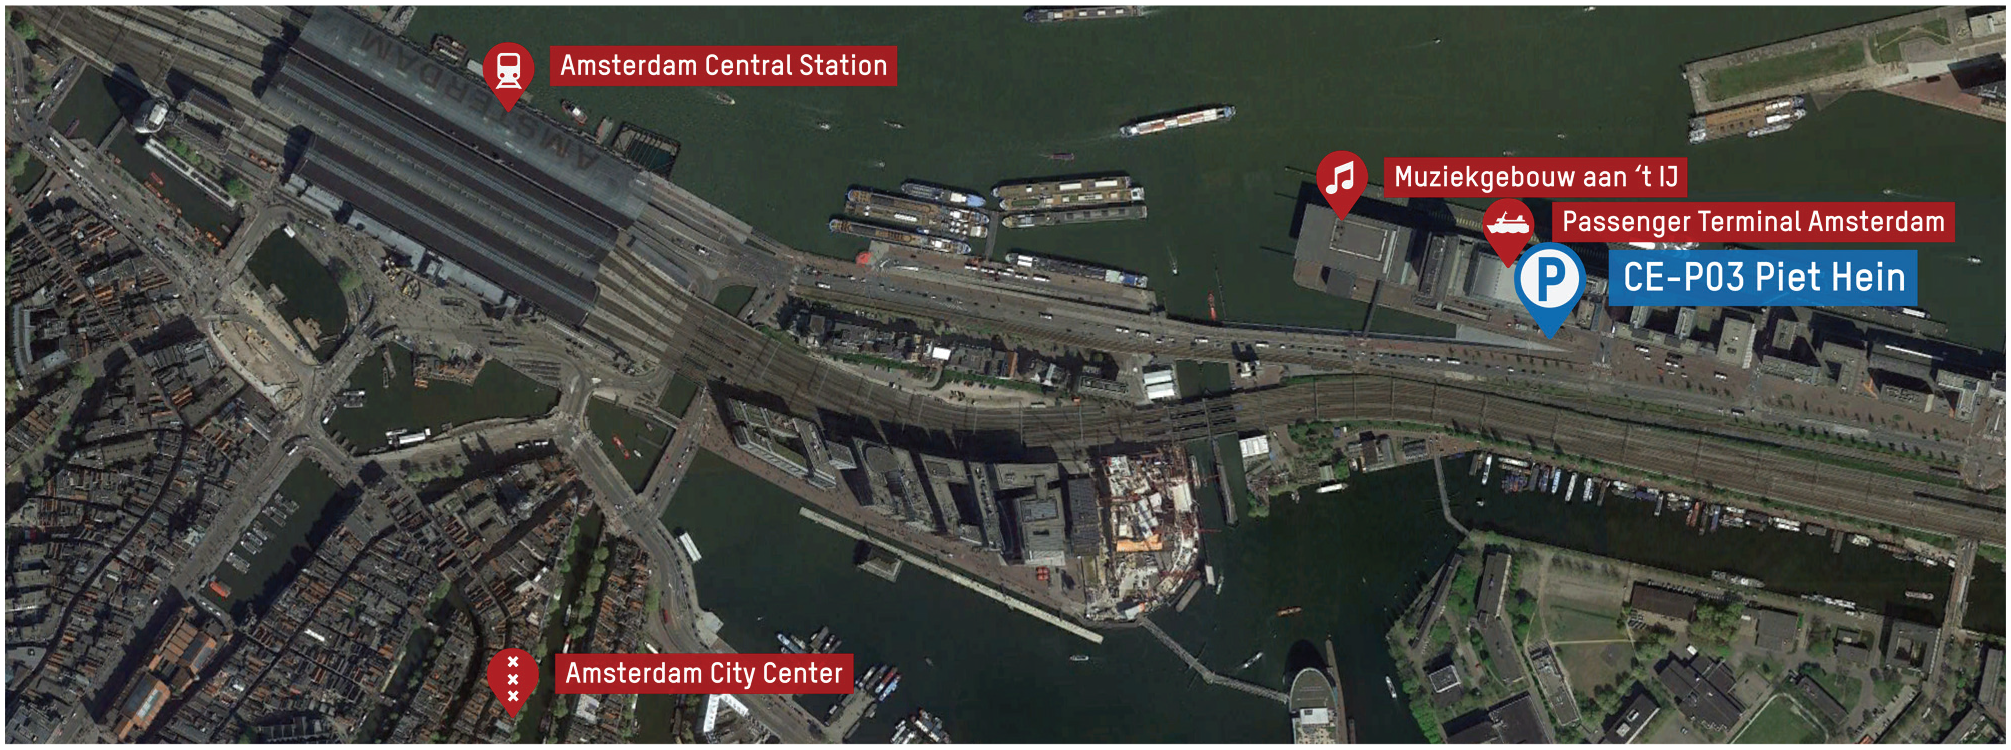
Spatial environment of CE-P03 Piet Hein.
This parking location, operated by the municipality of Amsterdam, is near the Amsterdam Central railway station, a concert hall, and a ferry terminal. CE-P06 Byzantium, and CE-P07 Museumplein are managed by a commercial parking operator. Figure 5 shows that these parking locations are situated near a park, museums, concert halls, and other entertainment venues. In addition, multiple commercial streets are located in this area.
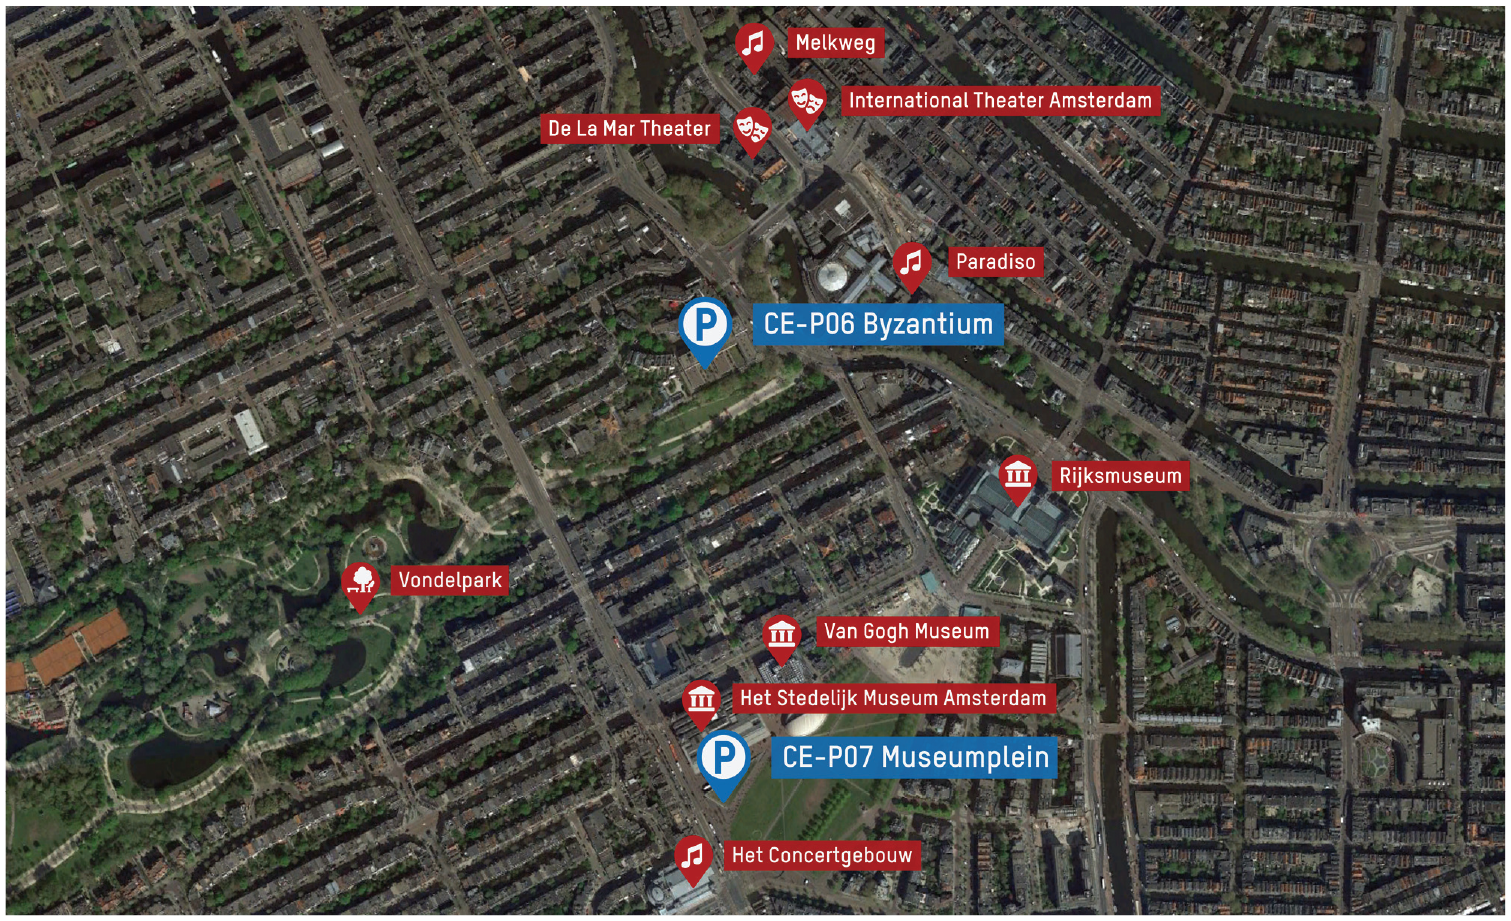
Spatial environment of CE-P07 Museumplein and CE-P06 Byzantium.
Figure 6 depicts the development in occupancy and capacity of these locations from midnight, Monday, July 24 to midnight, Sunday, July 30, 2019. Note that the capacity changed over time. This was because some parking locations in Amsterdam employ time-varying parking regulations, that is, parts of the parking garage are closed for short-term parking, based on the time of the day. It was also observed that overnight the parking spaces are only occupied to a limited extent or even have zero parked cars, whereas during daytime or in the evening clear peaks were shown. The graphs for CE-P06 Byzantium, CE-P07 Museumplein, and ZO-P06 Pathé Johan Cruijff ArenA have double peaks. These are typical for parking locations that serve both commercial and recreational purposes. Visitors park for commercial purposes around noon, and park for catering establishments and entertainment venues in the evening. In two parking locations established near the soccer stadium and concert halls (ZO-P03 Mikado and ZO-P10 Plaza ArenA), larger peaks (e.g., Saturday, July 29) caused by a soccer match were evident.
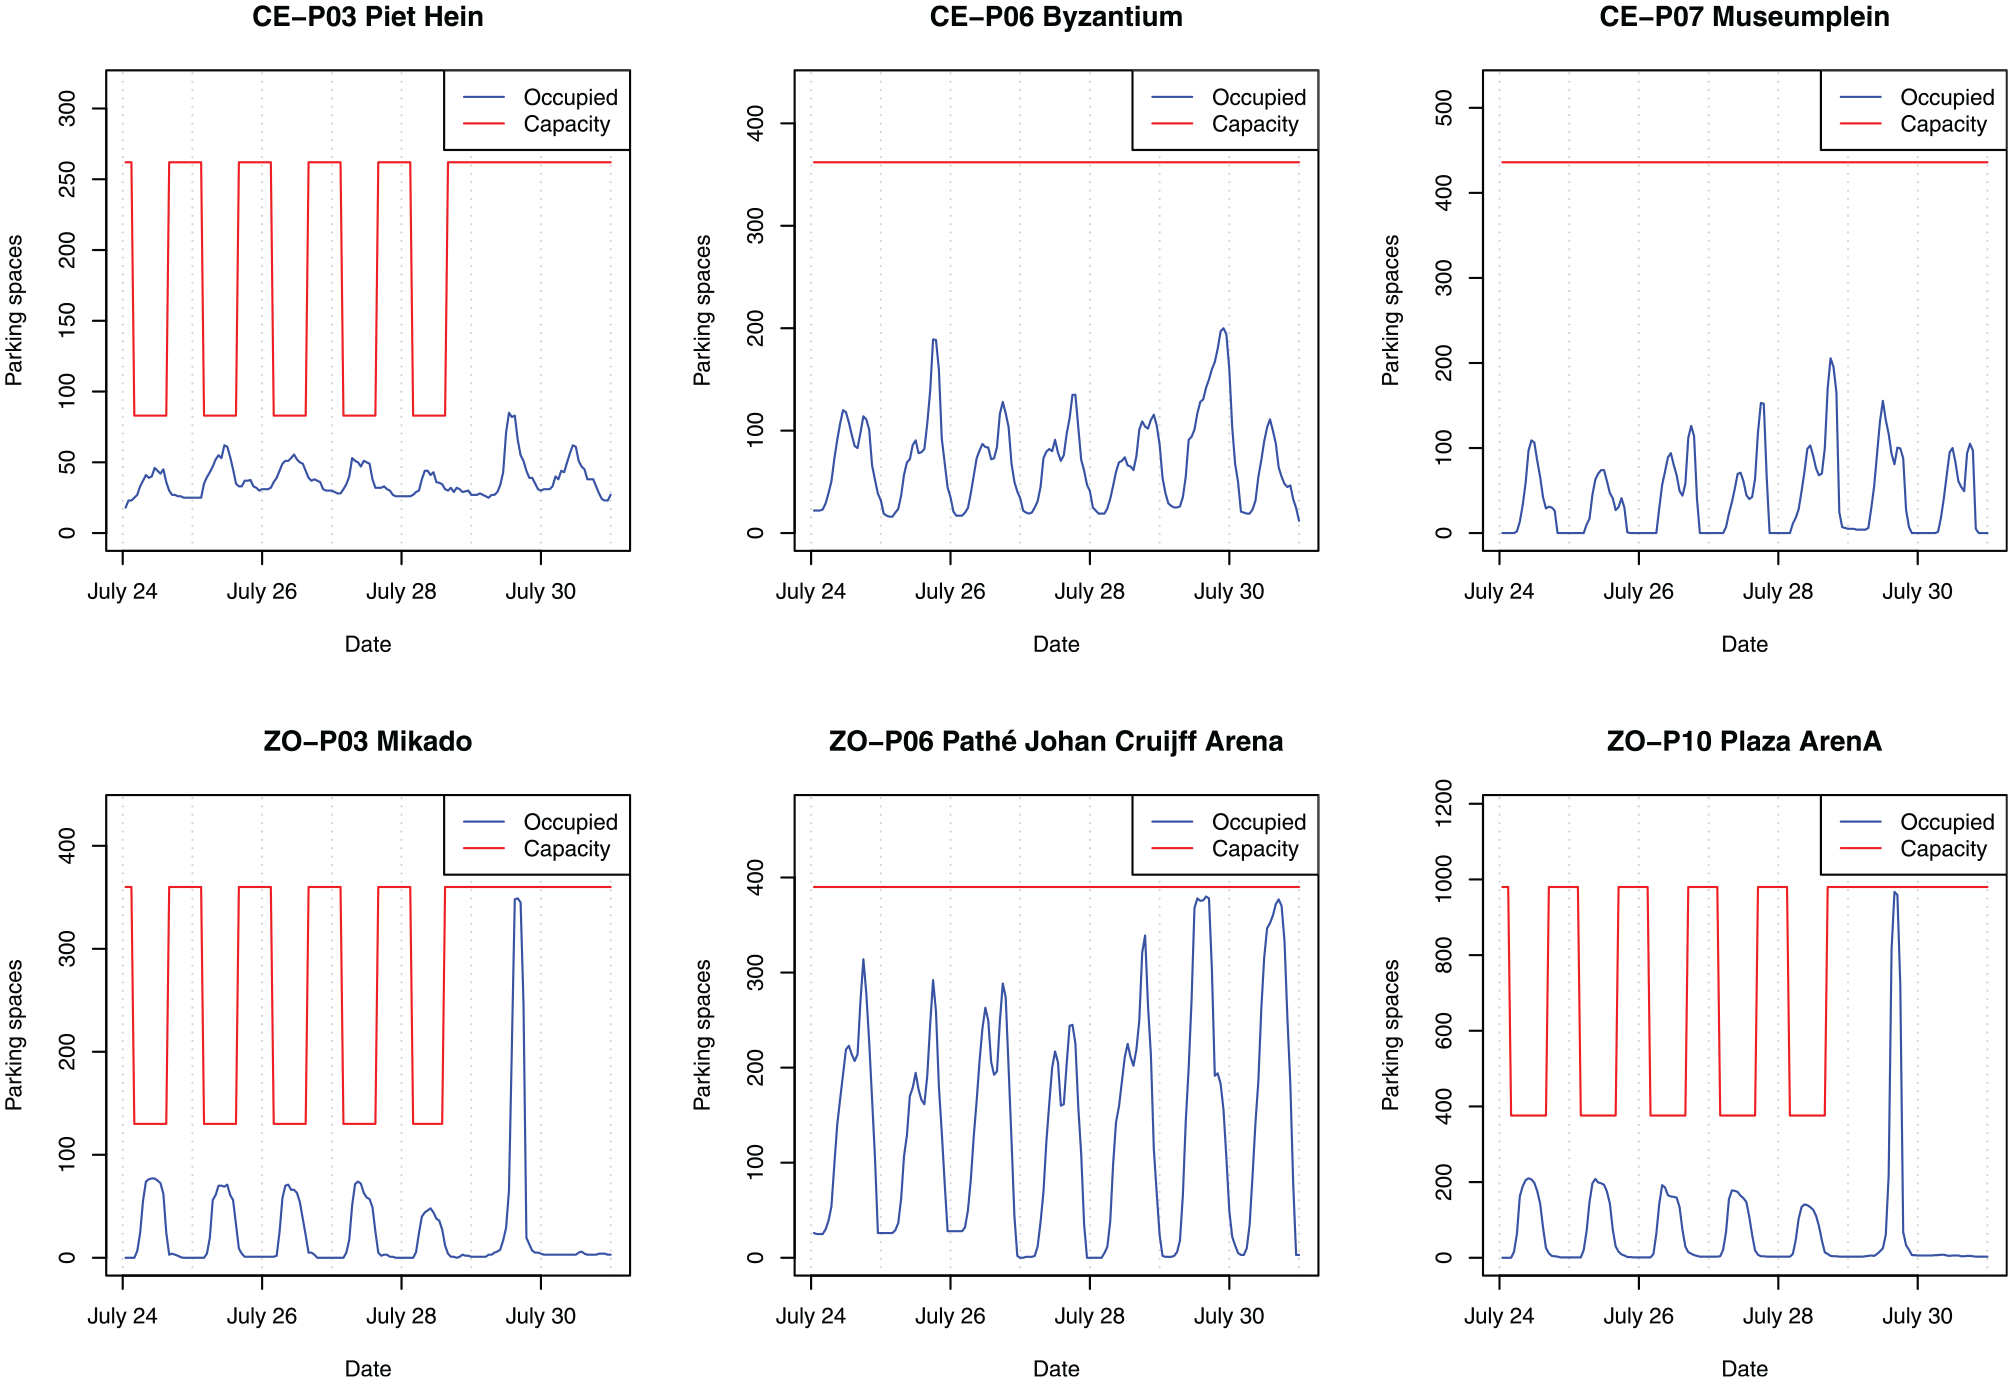
Occupancy and capacity of six parking locations, July 24 to 30, 2019.
Patterns in the data set were also investigated using autocorrelation function (ACF) plots, illustrated in Figure 7. The values on the x-axis are the lags,
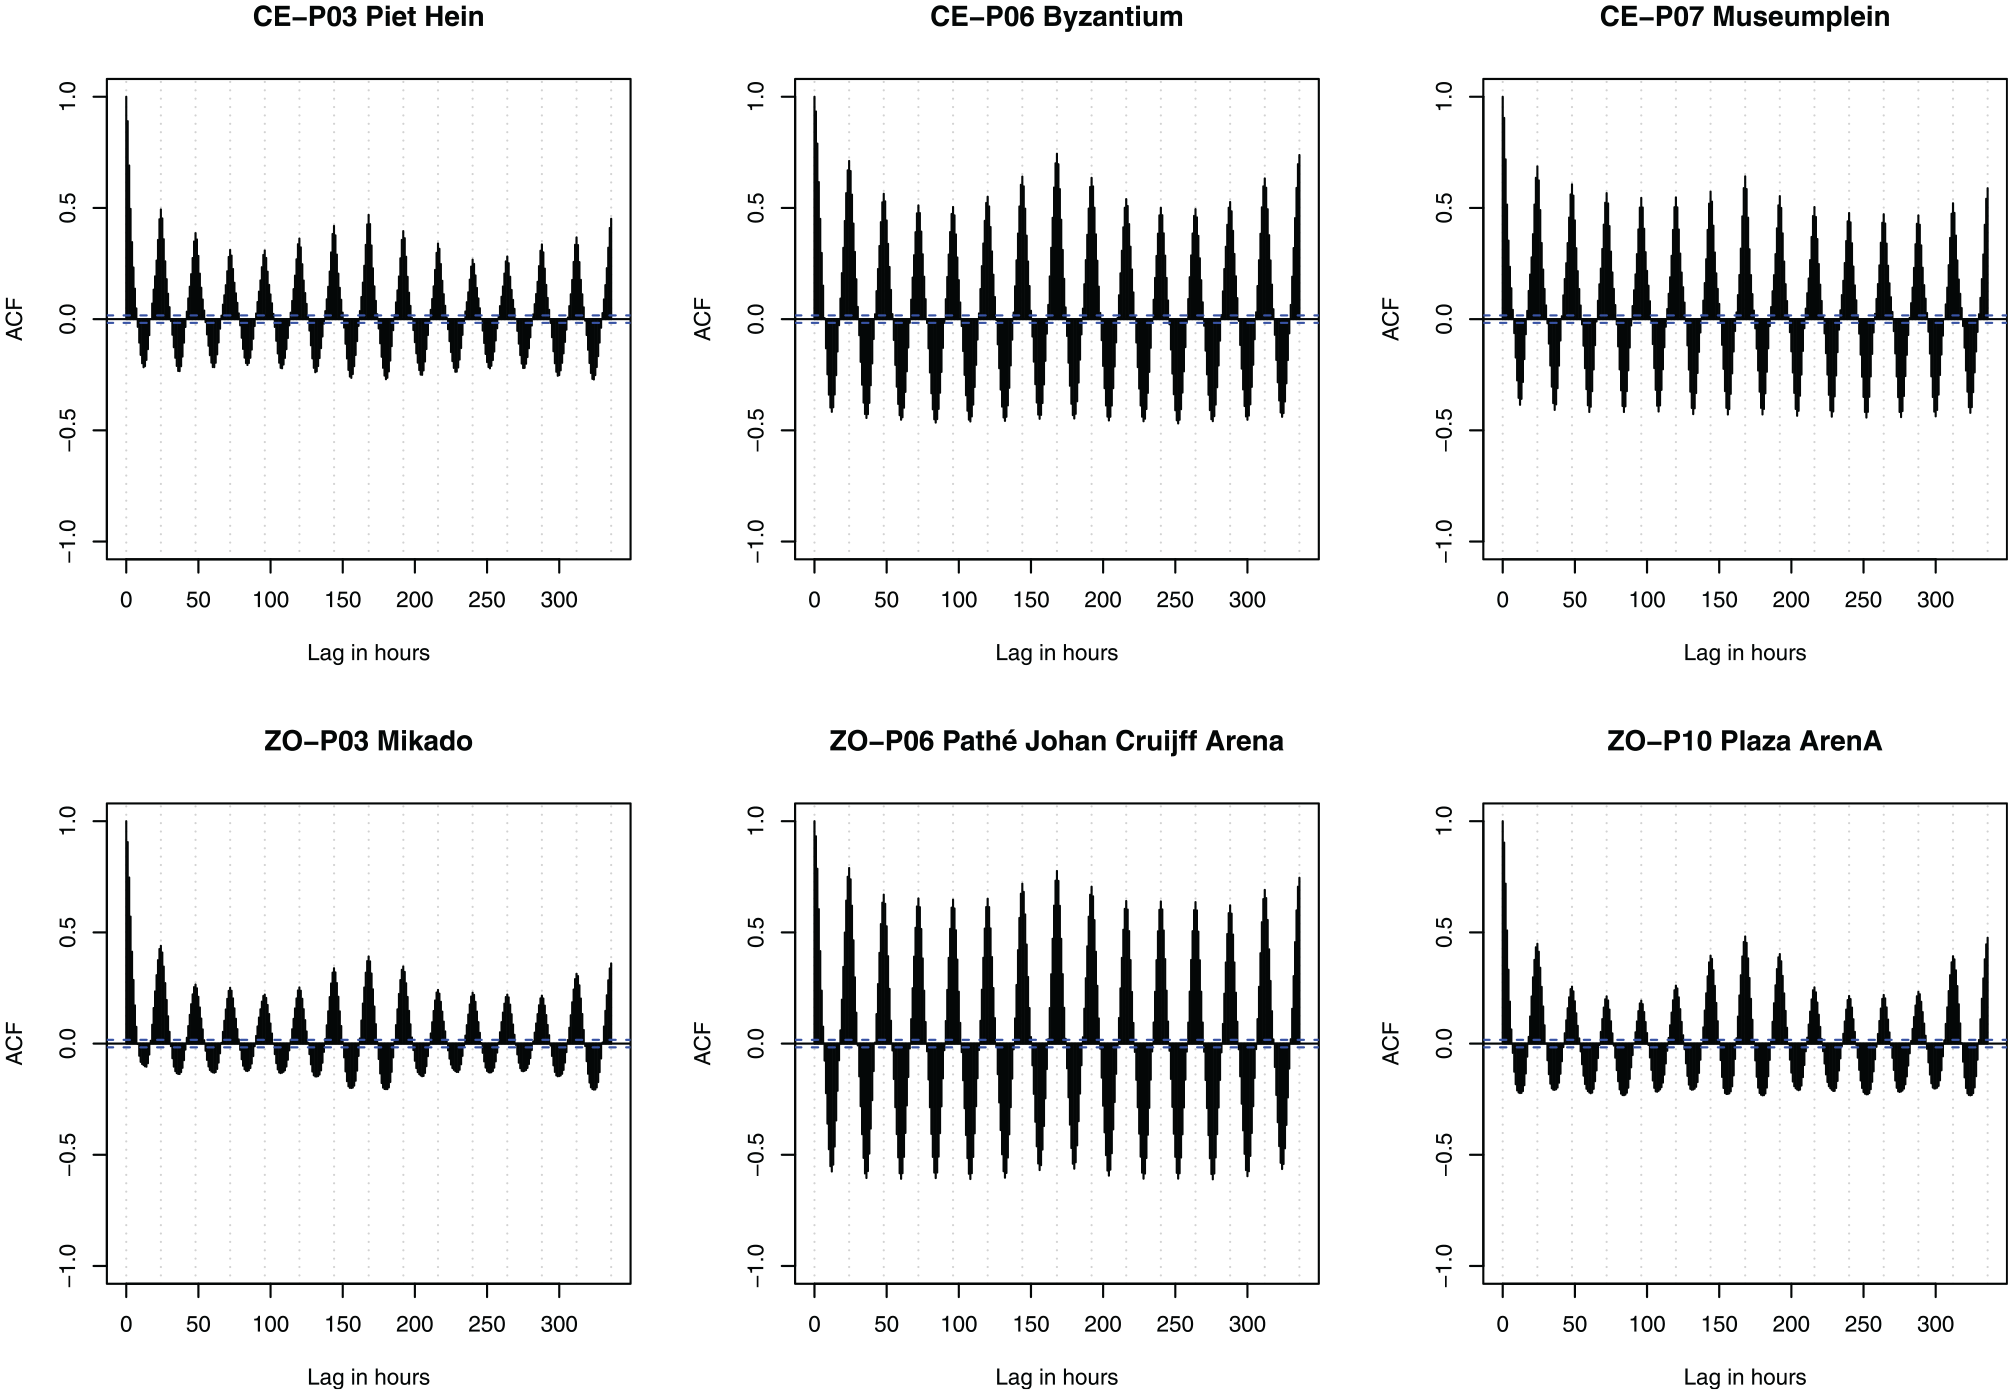
Empirical study: Autocorrelation function of six locations.
Identification of Factors Affecting Off-Street Parking Occupancy
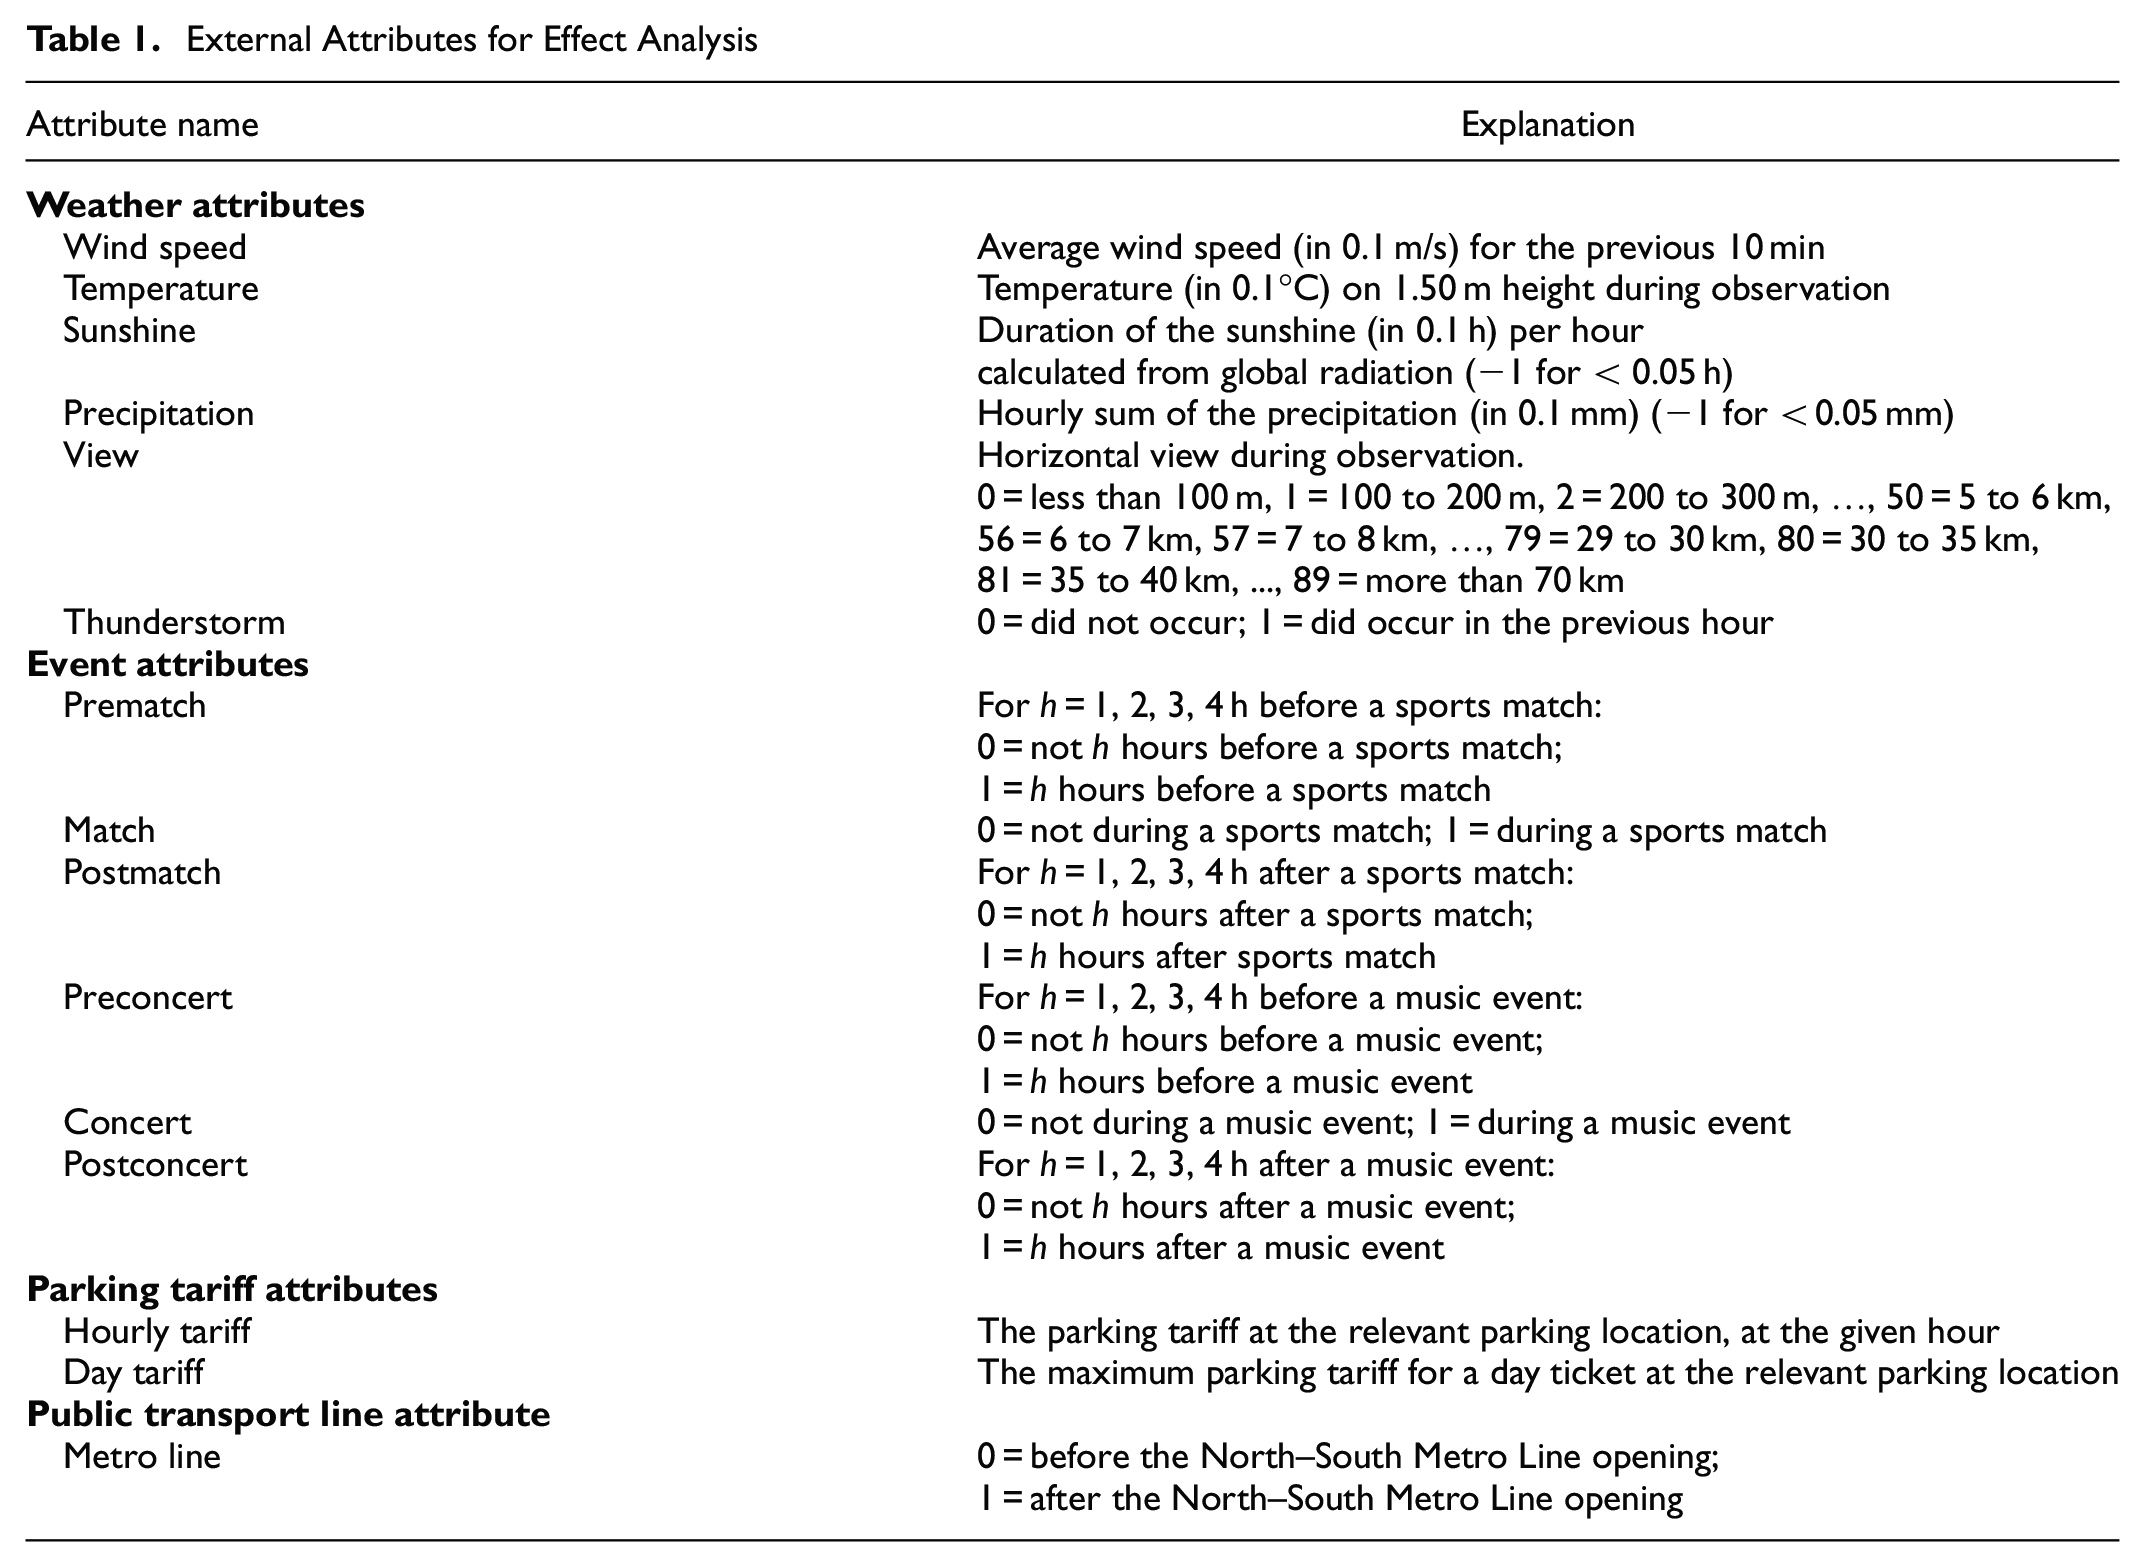
This section highlights the statistical significance of external factors on parking occupancy. The factors examined were the weather, events, parking tariffs, and the addition of a public transport line. Factors that contributed significantly to the model performance were implemented in the forecast model. In Table 1 a summary of the temporal variables is given.
External Attributes for Effect Analysis
Weather
The weather metadata were provided by the Royal Netherlands Meteorological Institute from Schiphol Airport weather station near Amsterdam. This data set contained hourly observations for 24 weather-related variables such as temperature, air pressure, and rain. Some of these variables are highly dependent on each other. For instance, horizontal view has a negative relationship with fog. To avoid overfitting, a selection was made in a way that the weather variables were not explained by any other variable. The remaining weather variables were average wind speed, temperature, sunshine, precipitation, view, and thunderstorm.
Events
According to previous studies, sports and artistic events substantially affect parking occupancy in nearby parking locations ( 24 , 25 ). This paper focuses on the impact of sports and artistic events in the stadium Pathé Johan Cruijff ArenA and the concert halls Ziggo Dome and AFAS Live, located in the southeast of Amsterdam. For each event type, nine binary variables were included in the model. For sports events, four binary variables were added for the hours before a match started (“Prematch” in Table 1). These variables had a 1 if a certain hour was 1, 2, 3, or 4 hours respectively before a match took place and 0 otherwise. Similarly, four binary variables were added for 1, 2, 3, and 4 hours respectively after the match was over (“Postmatch” in Table 1). Finally, a binary variable was included: 1 during the match and 0 otherwise (“During match” in Table 1). Nine variables were added instead of one since, in reality, the amount of occupied parking space does not increase to its maximum in the hour before an event starts and drop back to its original value immediately after the event is over. Instead, visitors arrive at and leave a parking location more gradually. This is caused by both the limitations of the parking system and traffic congestion on the surrounding roads. For these reasons, approximately 250 to 300 cars can leave in 1 hour per barrier. Using the same approach, music events were added to the model (“Preconcert,”“During concert,” and “Postconcert” in Table 1).
Parking Tariffs
In almost all major cities, parking pricing is an important consideration for policy makers ( 26 ), because it not only significantly contributes to parking occupancy ( 18 ), it also influences the performance of the whole transportation network ( 27 ). However, according to the municipality of Amsterdam, even though parking in garages is 15% cheaper than on-street parking in the same neighborhood, no strong (relative and absolute) increase in off-street parking occupancy has yet been detected. Paid parking is always applied in the locations investigated in this study. Local variation over time in parking prices is minimal. Two of the examined locations had a time-varying parking tariff, but the other four parking locations had a constant parking tariff that was insensitive to the hour of the day. One change in these variables occurred on July 14, 2019: from this day, parking tariffs increased drastically, sometimes by 100% ( 28 ). For each parking location, the parking tariffs for specific hours and the maximal parking price for 1 day were added to the model.
Public Transport Line
As an experiment, a new metro line was included as a variable: this was the North–South Metro Line, which connects Amsterdam via the city center. A 0 was given for the period before the start of the adjusted timetable (22 July), and a 1 from the start (22 July onwards).
Results of the Effect Analysis
For the effect analysis, the estimates and p-values from a z-test of the SARIMAX model were used. This model contained ARIMA processes and the exogenous regressors in Table 1. Table 2 presents the estimates and p-values for the weather-, event-, and public transport line attributes that significantly affected parking occupancy. Statistically significant variables not included in the table were the ARIMA component variables. The parking tariff variables are not included in the Table 2 because these were not found to be statistically significant for parking occupancy prediction of the examined parking locations. This finding contradicted the literature ( 18 , 26 , 27 ); one explanation for this could be that local variation in parking tariff prices over time is minimal. In four of the parking locations the parking tariffs only changed once from April 14, 2019. This parking tariff change was at the end of the time range of the data set, thus, the model did not have enough data to learn from the change.
Significant External Factors
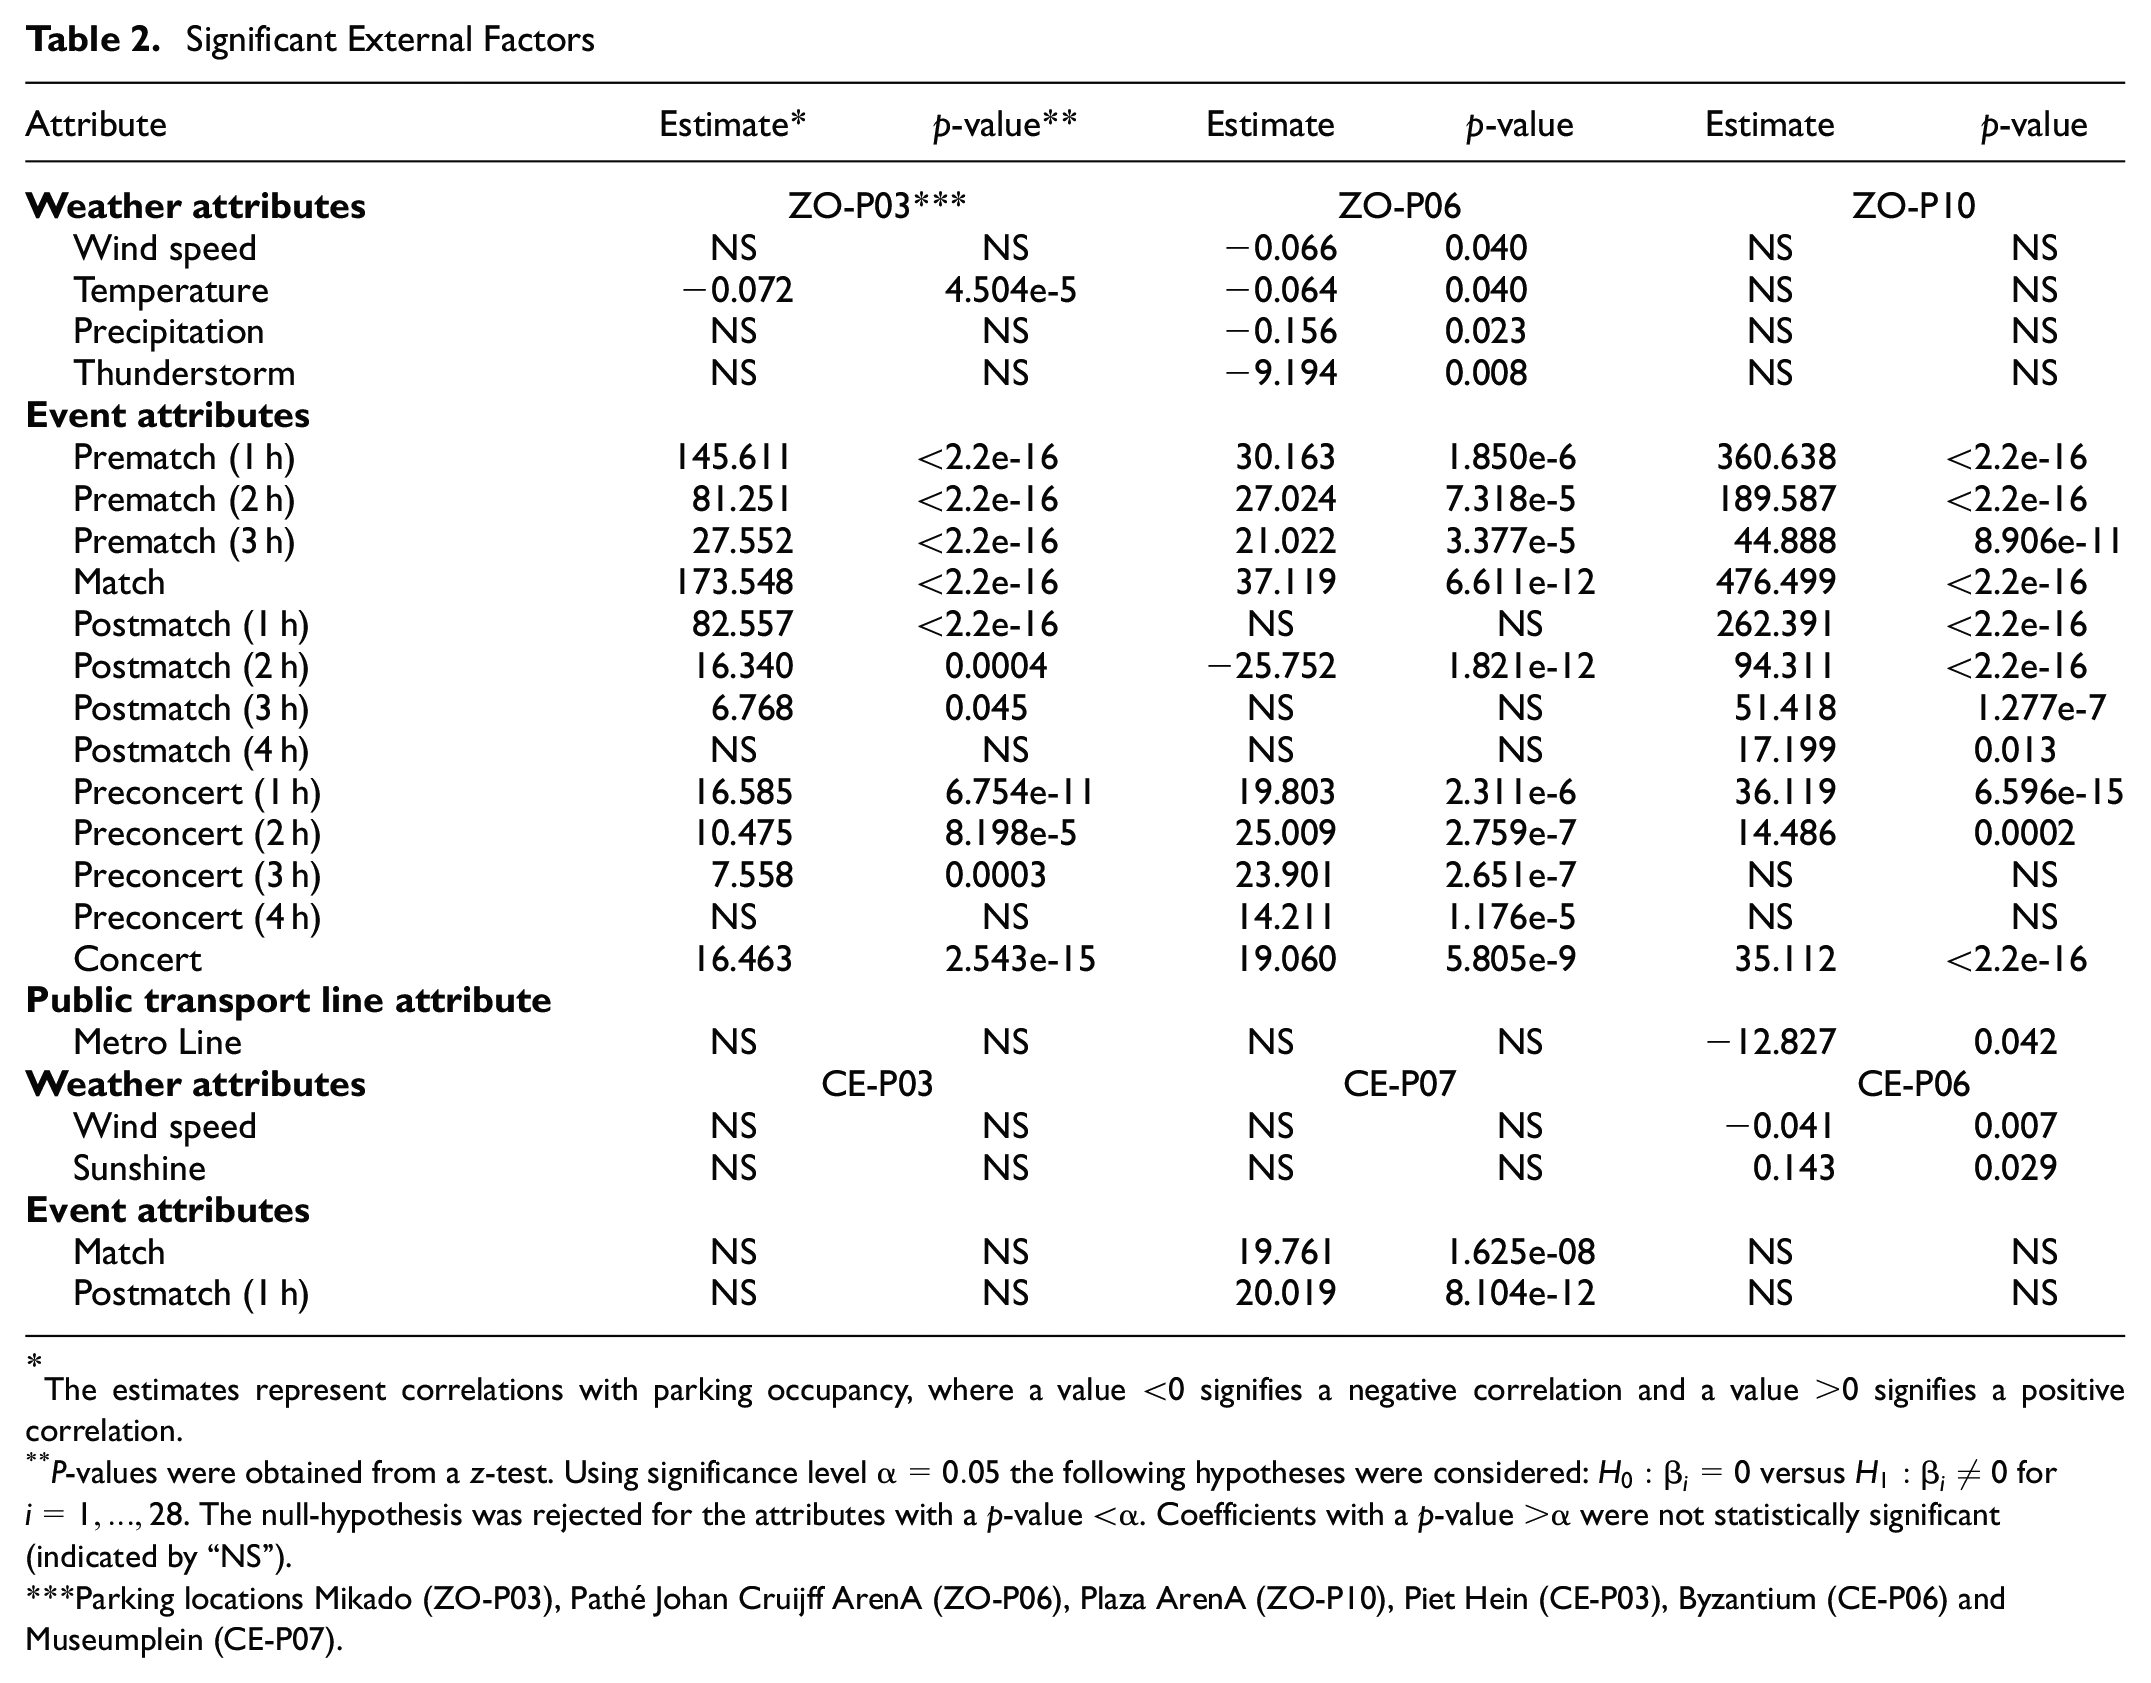
The estimates represent correlations with parking occupancy, where a value <0 signifies a negative correlation and a value >0 signifies a positive correlation.
P-values were obtained from a z-test. Using significance level
Parking locations Mikado (ZO-P03), Pathé Johan Cruijff ArenA (ZO-P06), Plaza ArenA (ZO-P10), Piet Hein (CE-P03), Byzantium (CE-P06) and Museumplein (CE-P07).
RMSE on Seasonal Naive, ETS, SARIMA, SARIMAX (6-Months Ahead Forecast), and LSTM (1-Hour Ahead Forecast); the lowest RMSE values for 6 months ahead predictions are in bold.
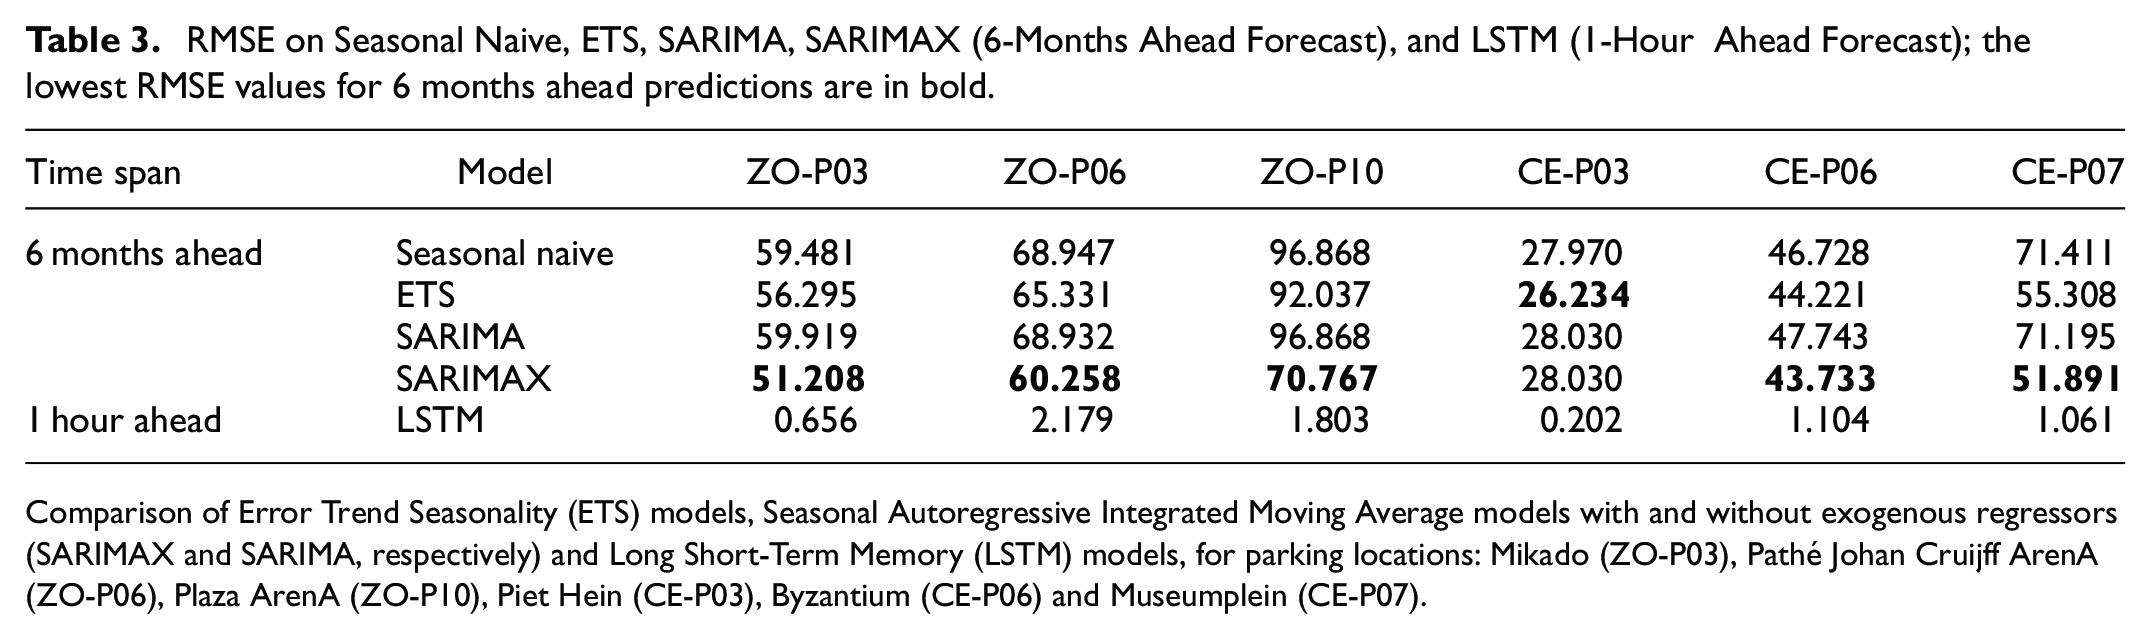
Comparison of Error Trend Seasonality (ETS) models, Seasonal Autoregressive Integrated Moving Average models with and without exogenous regressors (SARIMAX and SARIMA, respectively) and Long Short-Term Memory (LSTM) models, for parking locations: Mikado (ZO-P03), Pathé Johan Cruijff ArenA (ZO-P06), Plaza ArenA (ZO-P10), Piet Hein (CE-P03), Byzantium (CE-P06) and Museumplein (CE-P07).
Focusing on the weather attributes, average wind speed was found to have a modest negative impact on occupancy in the locations ZO-P06 Pathé Johan Cruijff ArenA and CE-P06 Byzantium (estimates of −0.066 and −0.041, respectively). The less wind, slightly more people parked their car in the above-mentioned locations. In two parking areas temperature had a small negative correlation with parking occupancy. An explanation for this could be that on colder days travelers choose the car over alternative transport modes (e.g., bicycle or public transport). Significant weather variables in CE-P06 Byzantium were precipitation (which had a negative impact) and sunshine (which had a positive impact). This makes sense as this garage is located close to a park and to commercial streets: a sunnier, less rainy day could attract more visitors to the city center. One variable that had a strong negative impact on parking was thunderstorm (−9.194 for ZO-P06 Pathé Johan Cruijff ArenA). It was speculated that, during a thunderstorm, potential travelers choose to wait for the storm to pass. Except for thunderstorms, the absolute difference in predicted occupied parking spaces caused by the weather was quite small. However, these results provided evidence that seemingly unimportant factors could still affect parking occupancy, albeit slightly. For policy decision makers this means that including these external factors could help to predict parking occupancy more accurately. The weather variables were not relevant for 6-months ahead policy making, but could be insightful for policy making for a few hours ahead (e.g., during events and holidays).
The event attributes strongly affected parking occupancy, especially in the parking locations near the event locations: ZO-P03 Mikado, ZO-P06 Pathé Johan Cruijff ArenA and ZO-P10 Plaza ArenA. In the city center (CE-P07 Museumplein) a significant effect was also noted during a match until 1 hour after the match. This impact could have been caused solely by this match, or by a combination of this and other events that might have been occurring at the same time in a concert- or music hall close to this parking location. To identify the exact source of this increase, variables related to events in the city center would need to be added to the model. Increases caused by a sports match often starts 3 hours before a match, reach their peak during the match, and stay high for between 2 and 4 hours after the match. When music concert estimates were compared with match estimates, it was observed that, in absolute numbers, fewer people parked for a music event than a match. Possible reasons could be that music event visitors choose different modes (e.g., public transport) or that the concert variable did not distinguish between big (i.e., in the football stadium) and smaller concerts (i.e., in a smaller music venue). It was also noted that after a music event visitors go directly home, whereas for a match event, visitors stay until 4 hours after the match has ended.
Finally, the North–South Line had a negative impact on parking in ZO-P10 Plaza ArenA. Since the metro line started operating, the number of parked vehicles in this location has dropped significantly. A possible explanation for this is that the metro line has improved connectivity with the city center but is not connected near this parking location. Accordingly, this line may have motivated car-to-transit travelers who originally parked in ZO-P10 Plaza ArenA to park elsewhere. However, it is unlikely that this affected a large absolute number of parked vehicles, because the number of short-term parkers in Plaza ArenA was relatively small compared with parking subscription holders. To find explanations, more research into this phenomenon is needed.
Although certain attributes (e.g., match variables) affected parking occupancy in several parking locations, clear differences between the locations were also noted. For instance, CE-P03 Piet Hein was not affected by any of the external variables. One reason for this could be that mainly subscription and permit holders park at this location. In addition, there are hardly any event venues close to this location that attract large audiences. Further, because this parking location is close to the central railway station, destinations in the neighborhood can also easily be accessed by bicycle and public transport. Because the exogenous regressors were location-specific, the significant factors on parking were investigated per location.
Temporal Forecasting Models
In this section, the five forecasting approaches are described: seasonal naive, seasonal autoregressive integrated moving average with and without exogenous variables (SARIMAX and SARIMA respectively), ETS models, and an LSTM neural network. To compare the predictive performance of these models and to reduce overfitting, parking location measurements were split into a training-, validation-, and test set in temporal order: the split was 60%, 20%, and 20%, respectively.
Key Performance Indicator
For model comparison, the key performance indicator (KPI) root mean square error (RMSE) was chosen for two reasons. First, the RMSE cannot be divided by the target variable (i.e., the amount of occupied parking spaces), because this value is often 0. This would make, for instance, the weighted mean absolute percentage error a less suitable KPI for the present case study. Second, the KPI is stricter when extreme peaks in the actual values are missed by the models. This is essential as these moments can indicate a fully occupied parking location. The equation is as follows:

where
Seasonal Naive
Because parking occupancy data show strong seasonal patterns, the seasonal naive model was chosen as a benchmark approach. This model is simple and requires minimal data, but tends to be quite inaccurate at predicting highly fluctuating data or data that change owing to irregular factors. Because of this, the expectation was that this model would not work extremely well. In seasonal naive, a forecast value equals the last observed value of this data point for the same season. The h-step ahead forecast is given in the following equation:

where
Because we observed a weekly seasonality for each location, a season of 1 week was considered in this model.
Seasonal ARIMA With Exogenous Regressors
An ARIMA (p,d,q) model is based on a combination of autoregressive (AR) and moving average (MA) processes of the order p and q respectively ( 30 ). To make time series with a trend component stationary, the model also differences over the trend (order d). Seasonal ARIMA (p,d,q) (P, D, Q) is an extension, which also differences over the seasons of the corresponding parameters p, d, and q ( 22 ). The addition of seasonal components to the model is very suitable for seasonal parking data. This model was extended further by implementing the temporal exogenous variables discussed in section Identification of Factors Affecting the Parking Occupancy, resulting in a SARIMAX model. SARIMAX models are a combination of regression and SARIMA. In the last few years, these models have been widely used in traffic demand forecast studies, for example in research by Cools et al. ( 31 ), Fişkin and Cerit ( 32 ), and Lin et al. (33). The step-up method is applied to build the model: this starts with an empty model and, step-wise, adds one statistically significant exogenous regressor. For hyperparameter testing, grid search was applied to each separate parking location. Because the parking locations showed different time developments (see section Empirical Study) and statistically significant exogenous regressors (see section Identification of Factors Affecting Off-Street Parking Occupancy), the hyperparameter values p, d, q, P, D and Q and the regressors also varied according to location.
ETS Models
ETS models are classic time series models that predict by applying exponential smoothing on the three main occurring components in the time series, namely error, trend, and seasonality. The model selection depends on the shape of the error, trend, and seasonality components. The error,
Long Short-Term Memory
The LSTM neural network is a variant of a recurrent neural network (RNN). RNN can be used to approximate almost any dynamic system. Traditional RNNs are trained via a gradient-based approach. This approach has the fundamental problem that the back propagation steps are exponentially dependent on the depth of the weights (
35
), resulting in vanishing or exploding gradients. Therefore, traditional RNNs are unable to detect dependencies for 10 or more steps. LSTM forces the backpropagation errors to be constant, therefore gradients cannot explode or vanish. Figure 8 shows one hidden layer of an LSTM model. This layer contains one memory cell and two adaptive multiplicative gating units in which each has an input and an output gate. These gates give and receive information to/from all memory cells in the block. The memory cells contain a recurrently self-connected linear unit called the “constant error carousel” (CEC). This solves the vanishing gradient problem since, when there is no input at a certain point in the data or when there are errors in a cell, the backpropagation steps remain the same. When the activation of a CEC gets close to 0 the irrelevant data and noise do not disturb the other memory cells. The CEC activation function takes three input variables and its own prior state, namely,
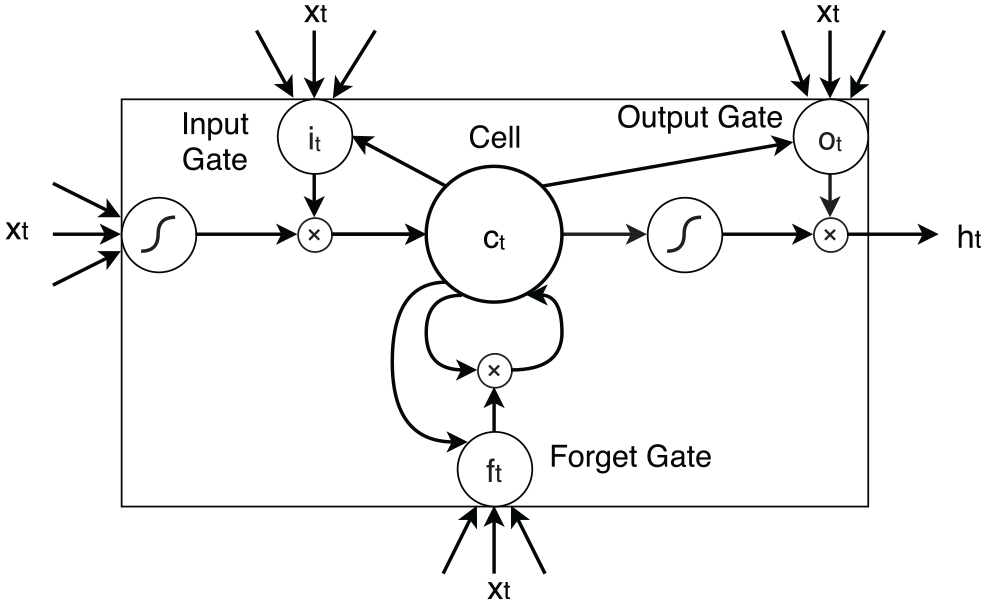
One hidden layer of an long short-term memory (LSTM) model.
Results of the Forecasting Models
In Table 3 the models are compared based on the lowest RMSE value in the validation set. LSTM is not included in the 6-months ahead forecasts owing to the extensive input data set and limited memory space. Instead, an alternative model with 1 hour ahead forecasts is proposed. Note from the table that the LSTM model obtained lower RMSE values. These improved results can be explained by the greater knowledge we had about recent actual values for 1 hour ahead, whereas for 6-months ahead the predictive power reduced over time. Based on the lowest RMSE of the 6-months ahead predictions, the SARIMAX model outperformed the other models, except for CE-P03 Piet Hein, for which the ETS model was the most accurate. Because none of the external regressors contributed significantly for this location, the SARIMAX and SARIMA RMSE values were identical. The highest errors were obtained by the benchmark model seasonal naive (in the southeast of Amsterdam, ZO-P03, ZO-P06, and ZO-P10), and by the SARIMA model (in the city center). A possible explanation for the less accurate results of the SARIMAX model in the center is that parking in the city center is less predictable compared with the southeast of Amsterdam. When SARIMA and SARIMAX were compared, strong differences in RMSE were noted. For example, adding the external regressors in Plaza ArenA and Museumplein decreased RMSE values by 27%. For CE-P06 Byzantium, the addition of the speed and sunshine variables reduced the RMSE from 47.743 to 43.733, which is an improvement of about 8%. Although this difference is smaller than in Plaza ArenA and Museumplein, the inclusion of weather information improved prediction performance.
Figure 9 presents the fitted values of the SARIMAX model for the six locations between January 1 and 7, 2020. From this figure we observe that the model and the external factors are close to the actual values.
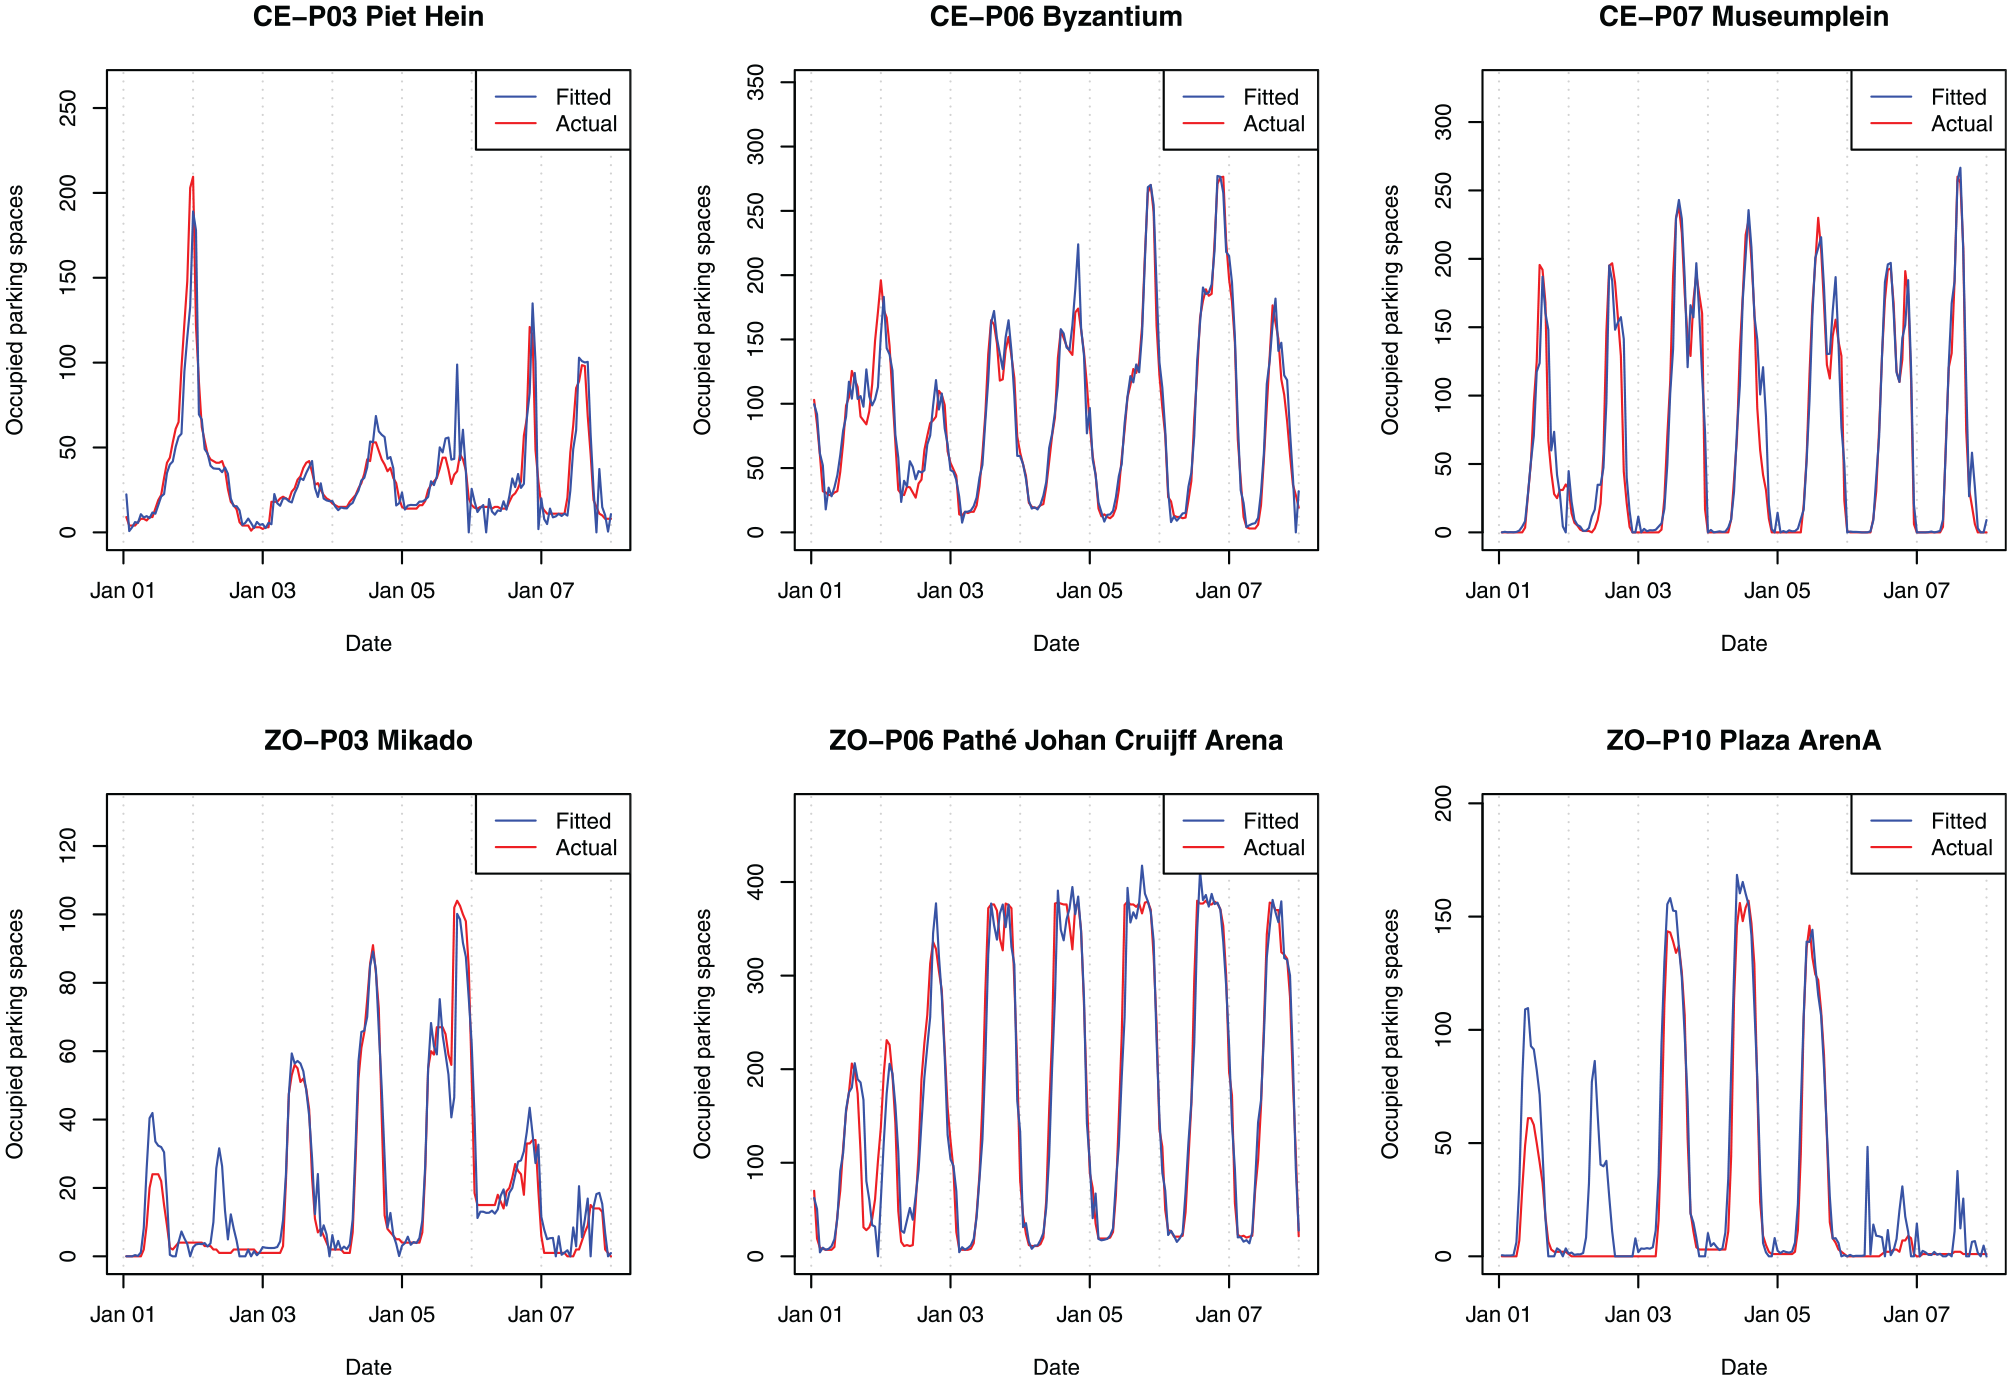
Seasonal autoregressive integrated moving average with exogenous regressors (SARIMAX) model, fitted values.
Figure 10 compares the 6-months ahead forecasting models for Plaza ArenA, January 19 to 25, 2020. For many-steps-ahead forecasts, each of the models predicted the seasonal patterns well. SARIMAX was the only model that was able to predict the off-seasonal spikes on January 20 and 24. These spikes were events and thus not part of a daily or weekly pattern. Because exogenous regressors can be included in a SARIMAX model, such events can be incorporated. Note that the estimate was too low for the first spike and too high for the second. Were this model to have more information about the expected number of visitors, the results could be further improved.
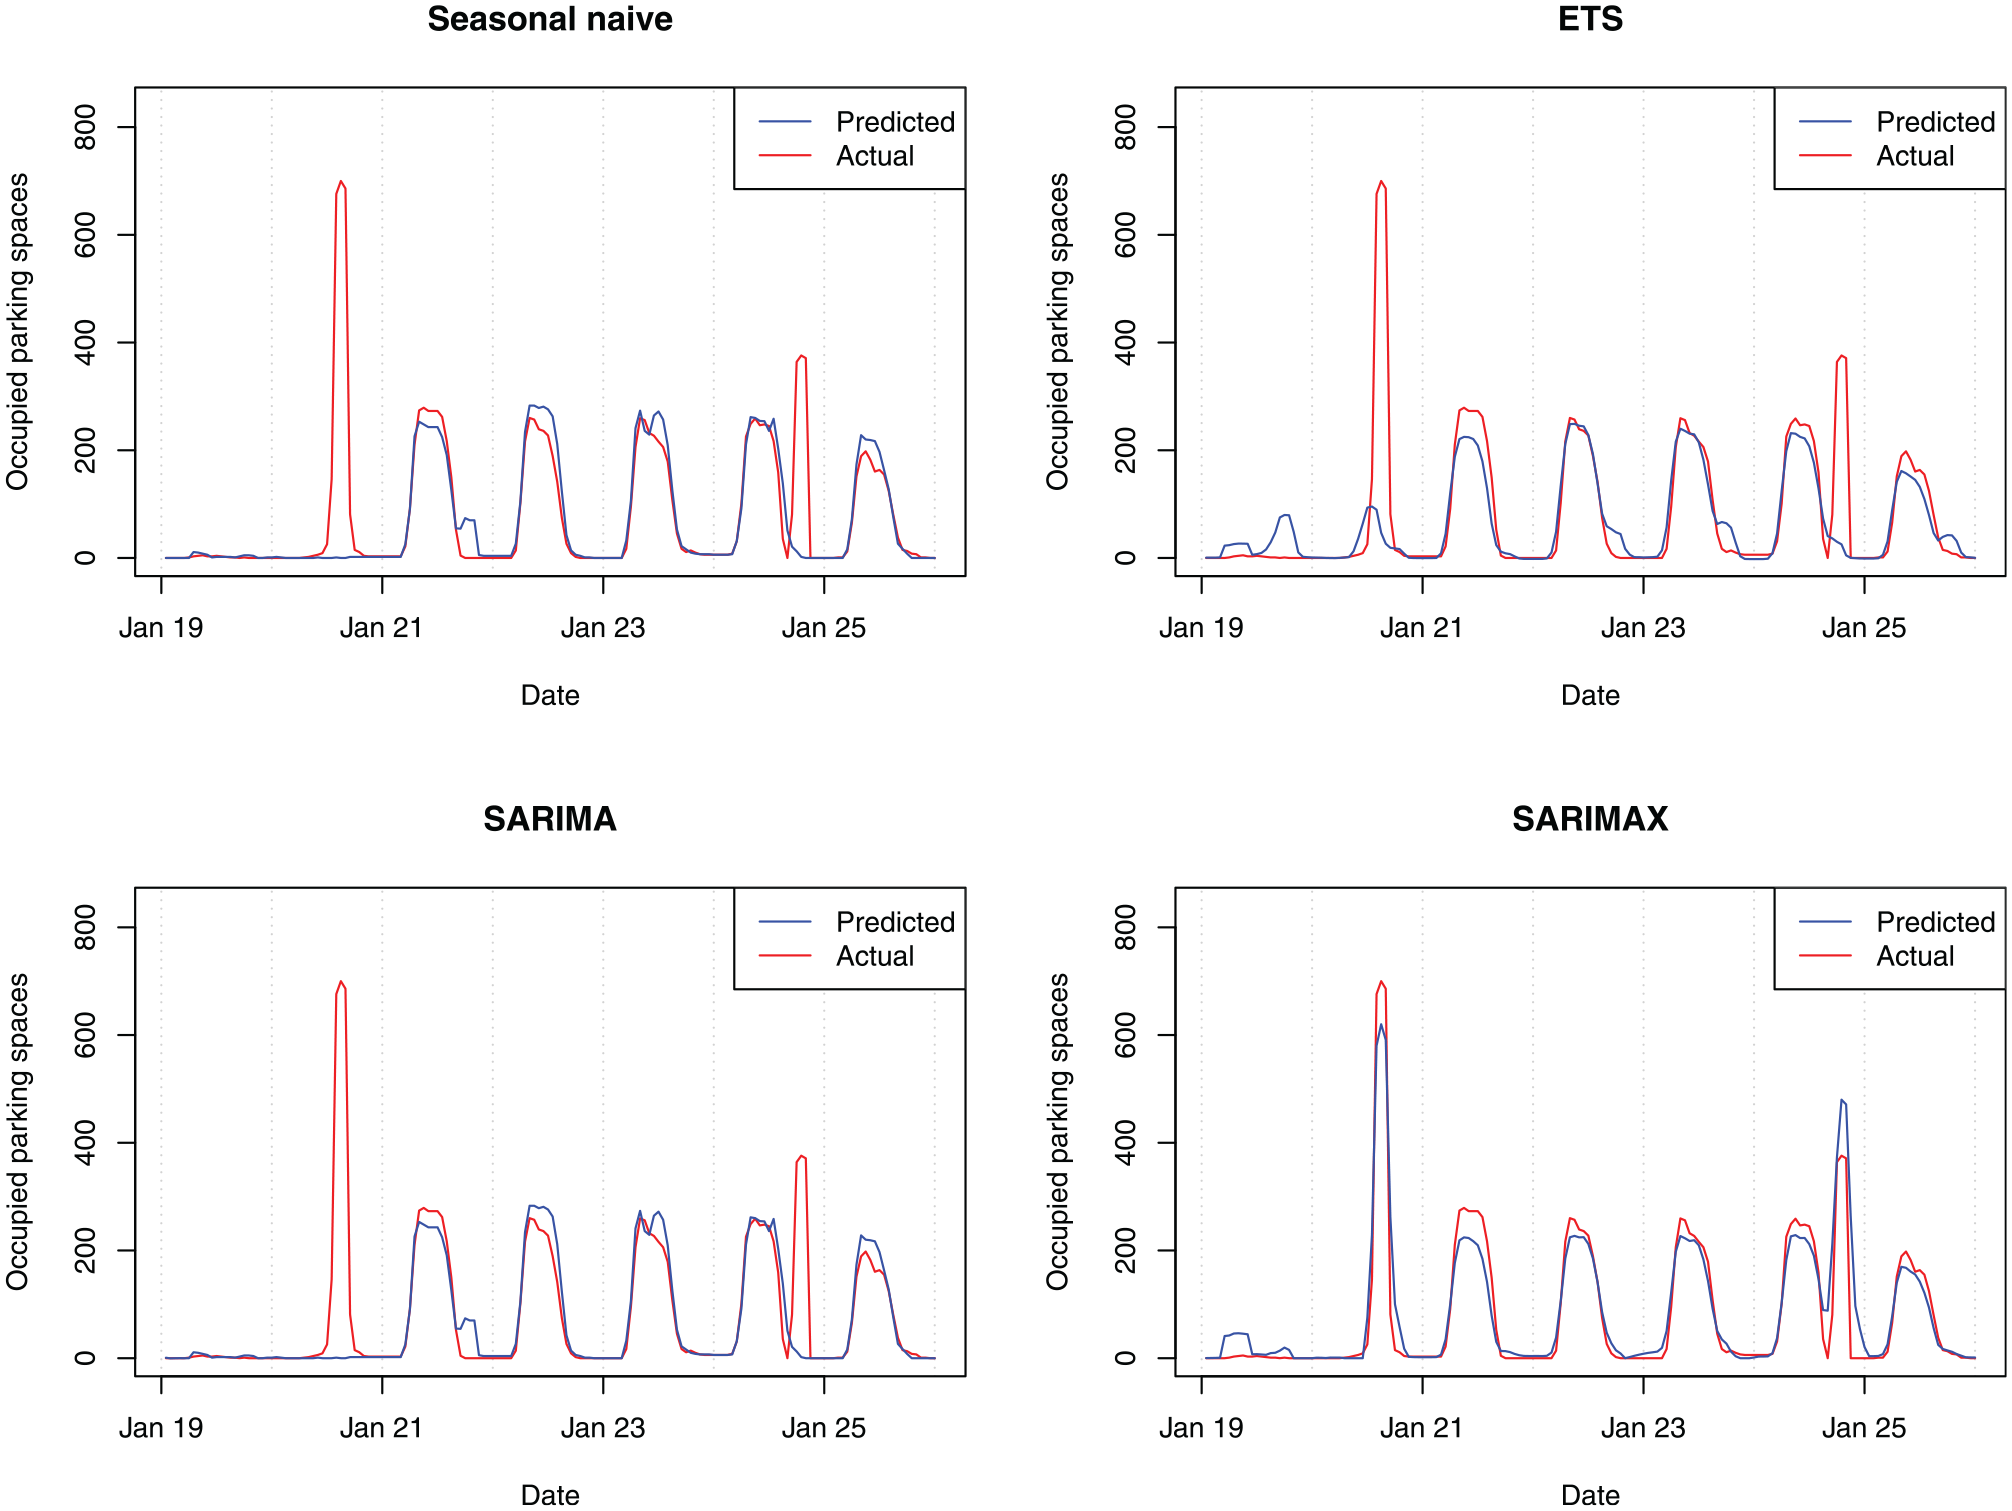
Comparison of models with 6-months ahead forecasts.
Figure 11 visualizes the 6-months ahead SARIMAX predictions for the six locations. Except for CE-P03 Piet Hein where the external regressors did not have any impact, the SARIMAX model was able to predict the daily patterns fairly well, especially given the broad time span.
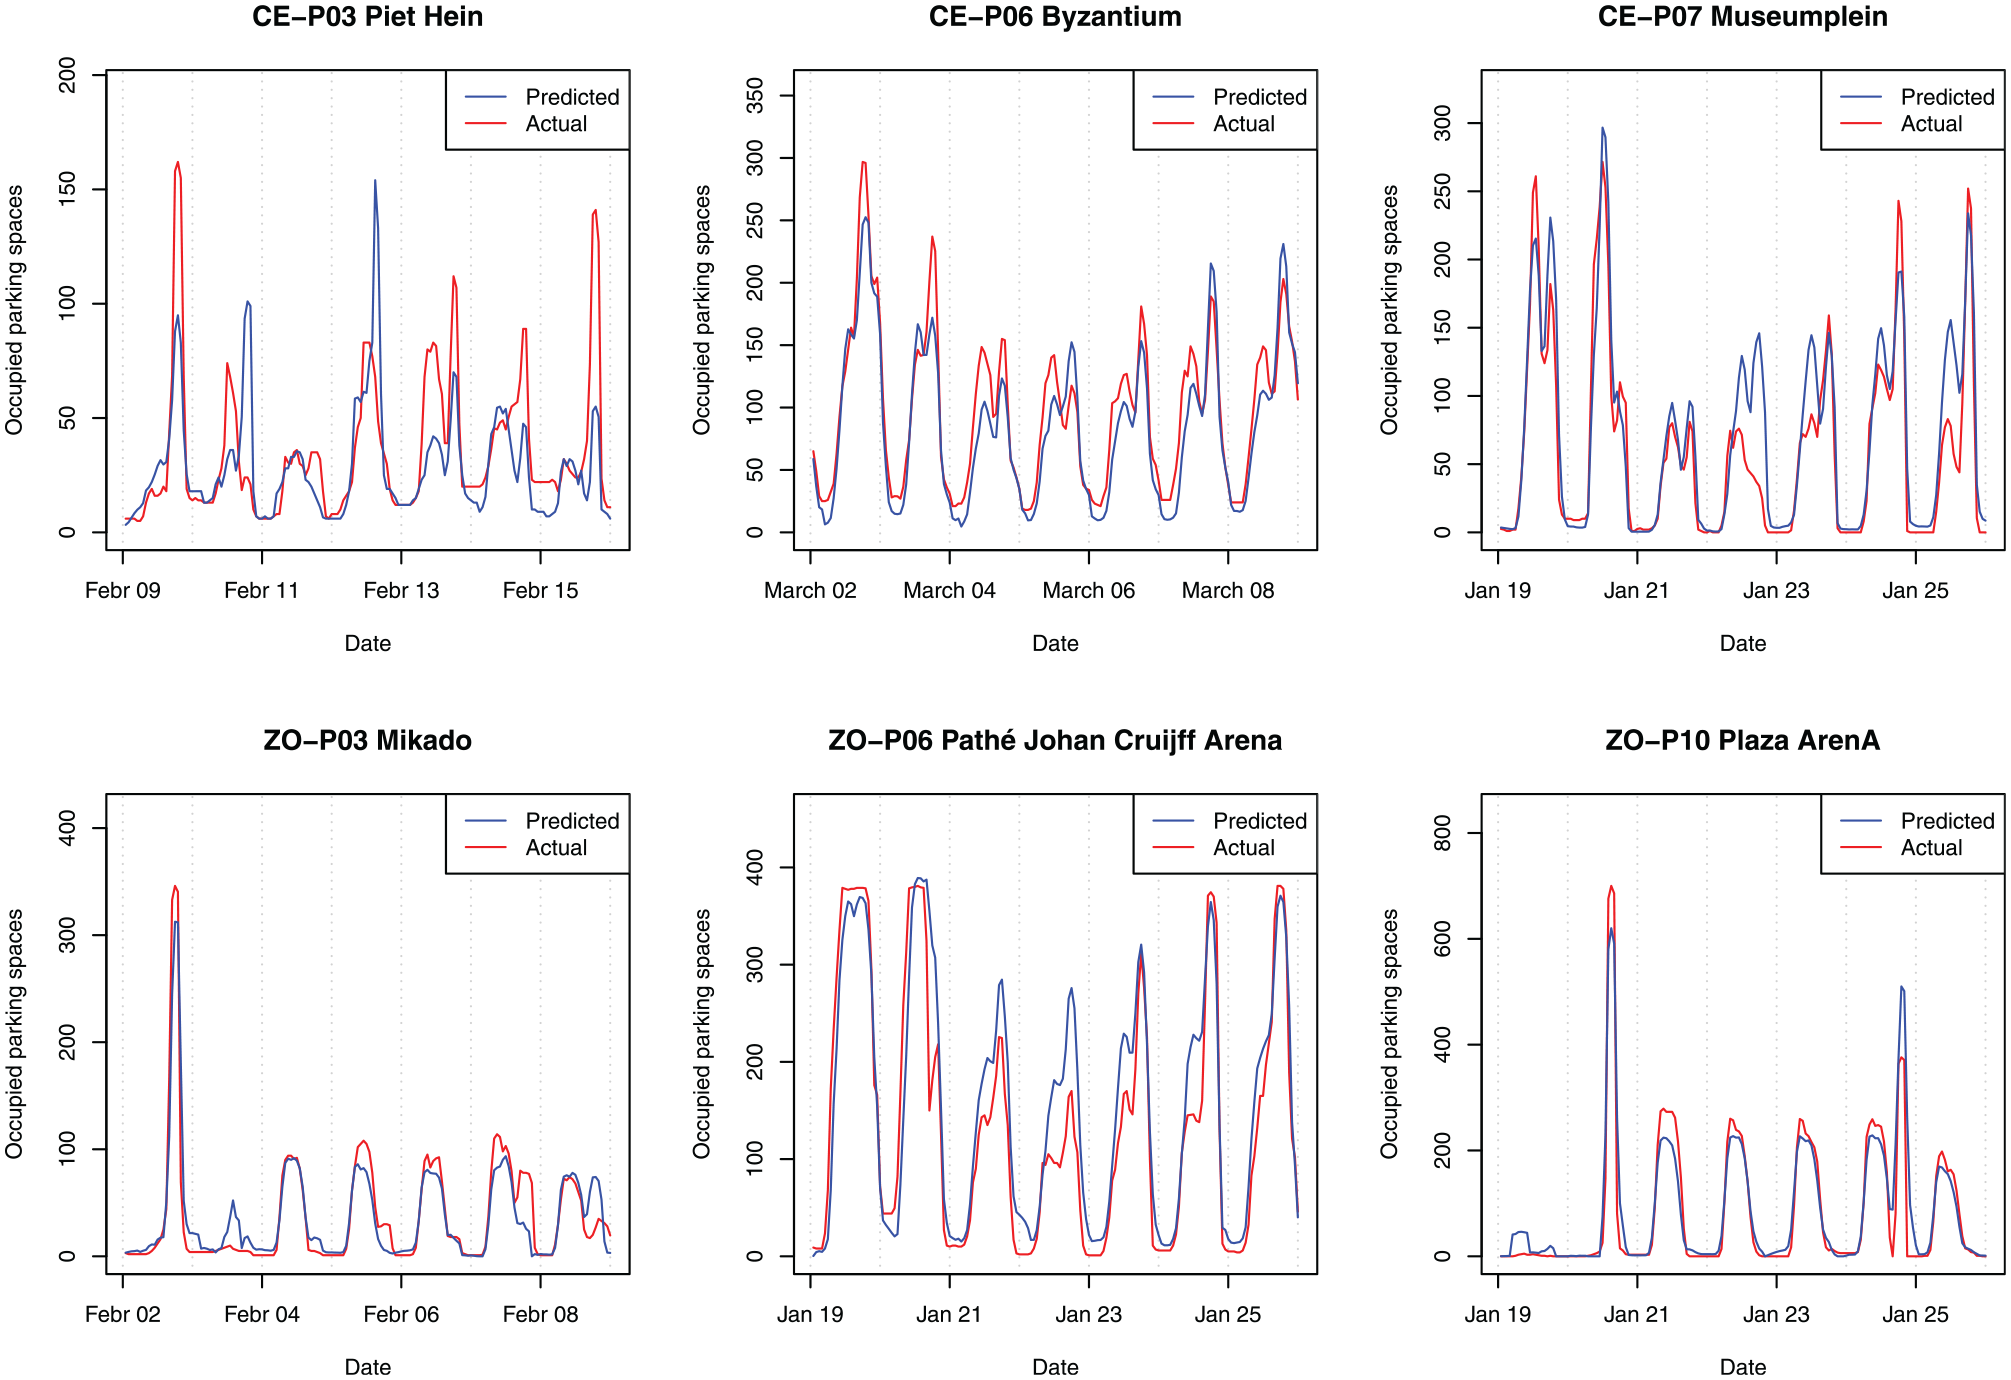
Comparison of actual against forecasted values for the seasonal autoregressive integrated moving average with and without exogenous regressors (SARIMAX) predictions.
In Figure 12 a similar graph is given for the LSTM model results for 1 hour ahead predictions. This model seemed to detect the complex structures and patterns in the data more than the other models. With smaller step sizes, the model outperformed the multistep-ahead predictions of the other algorithms.
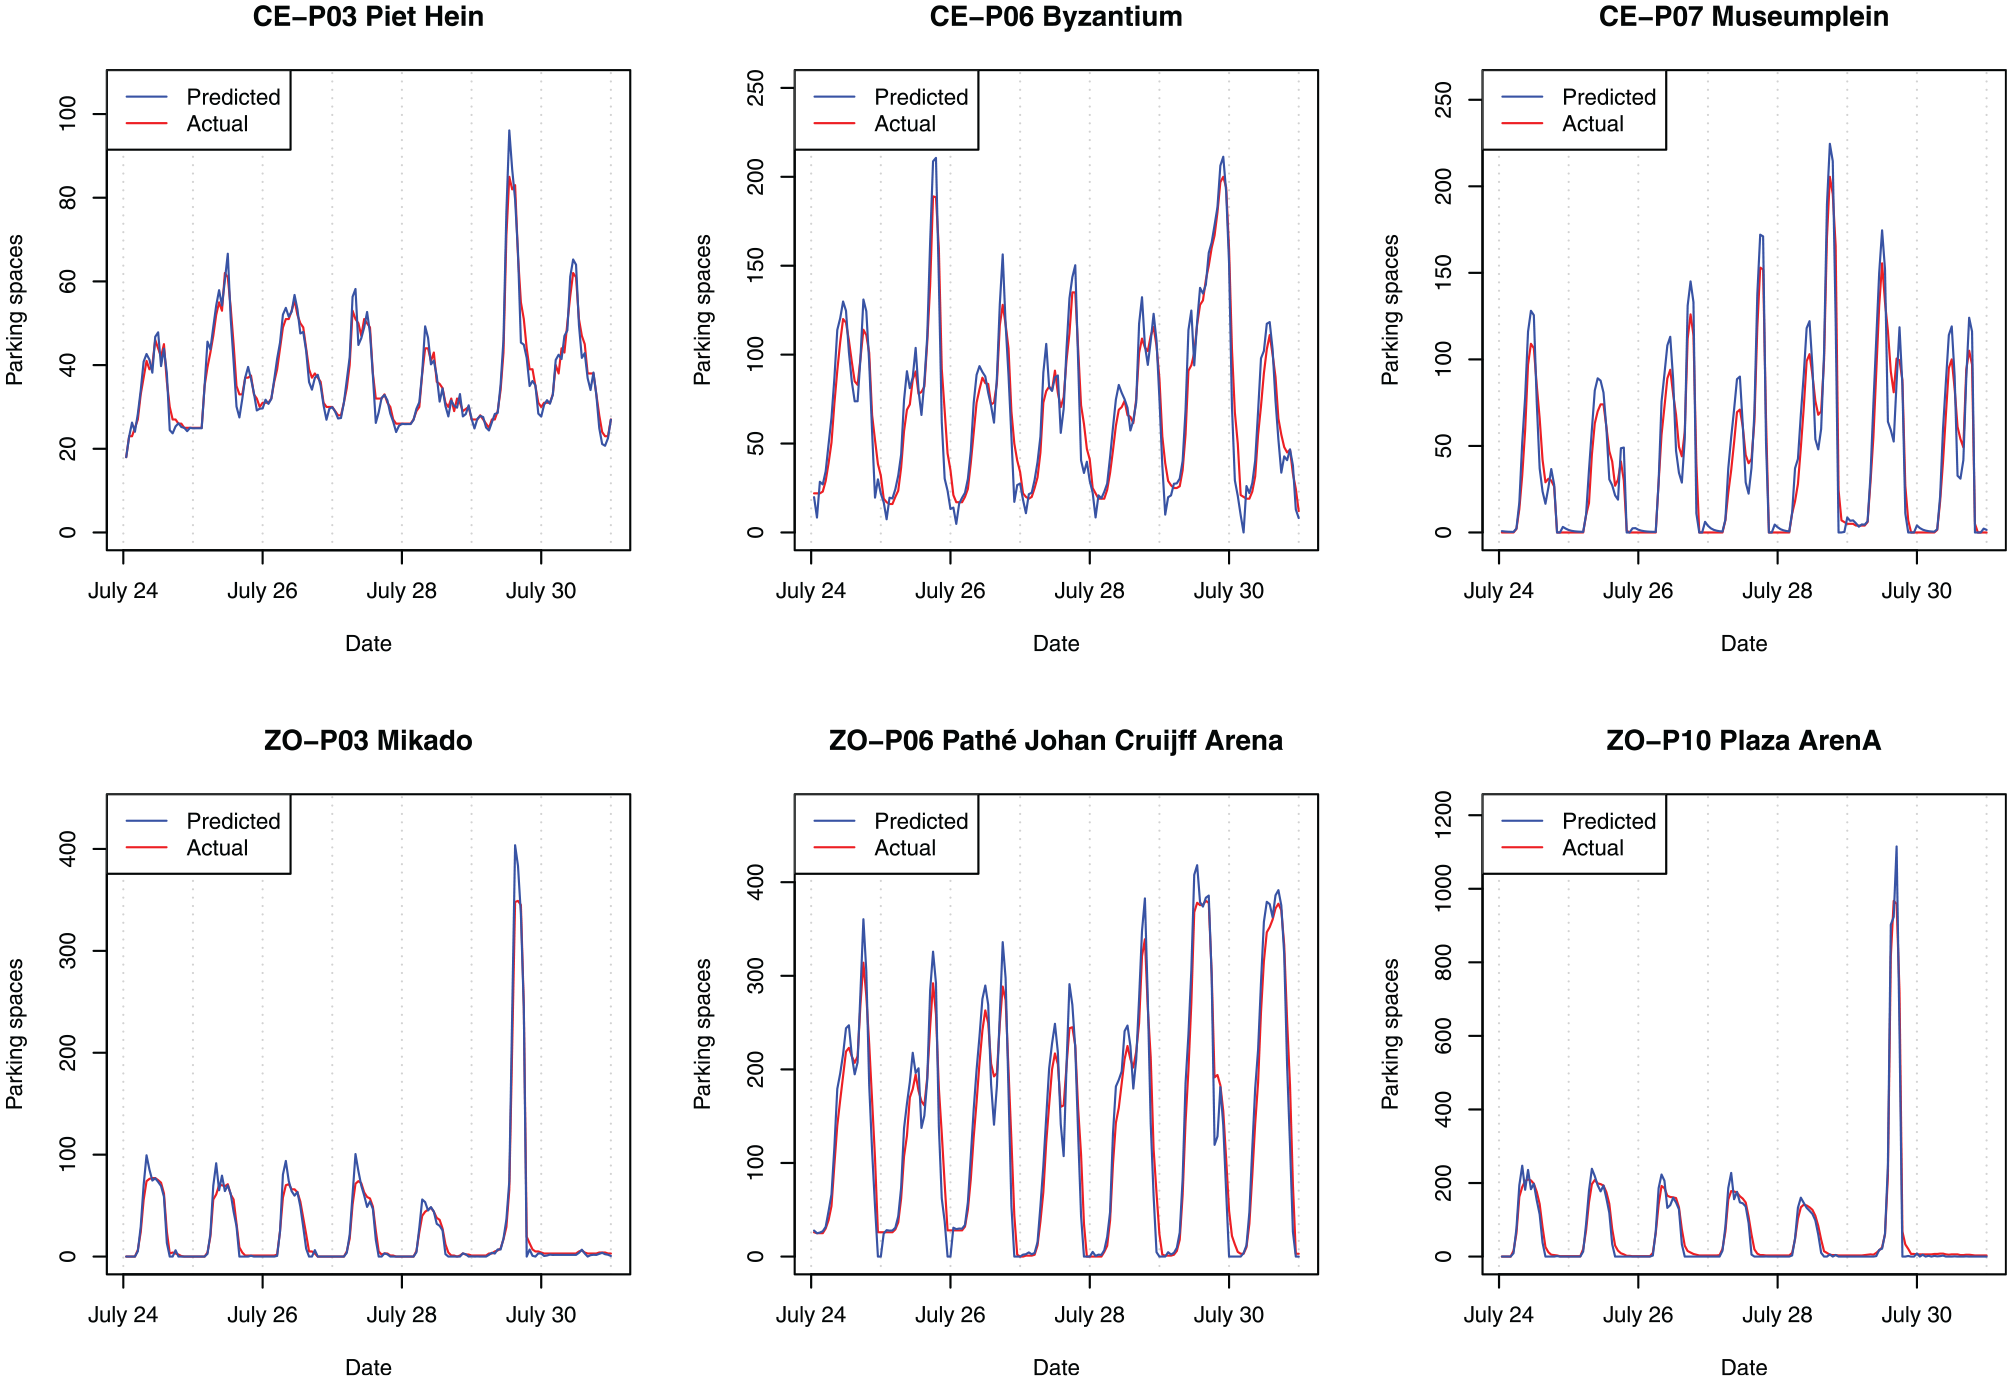
Comparison of actual against forecasted values for the long short-term memory (LSTM) predictions, one step ahead.
Graphical User Interface Decision Support System
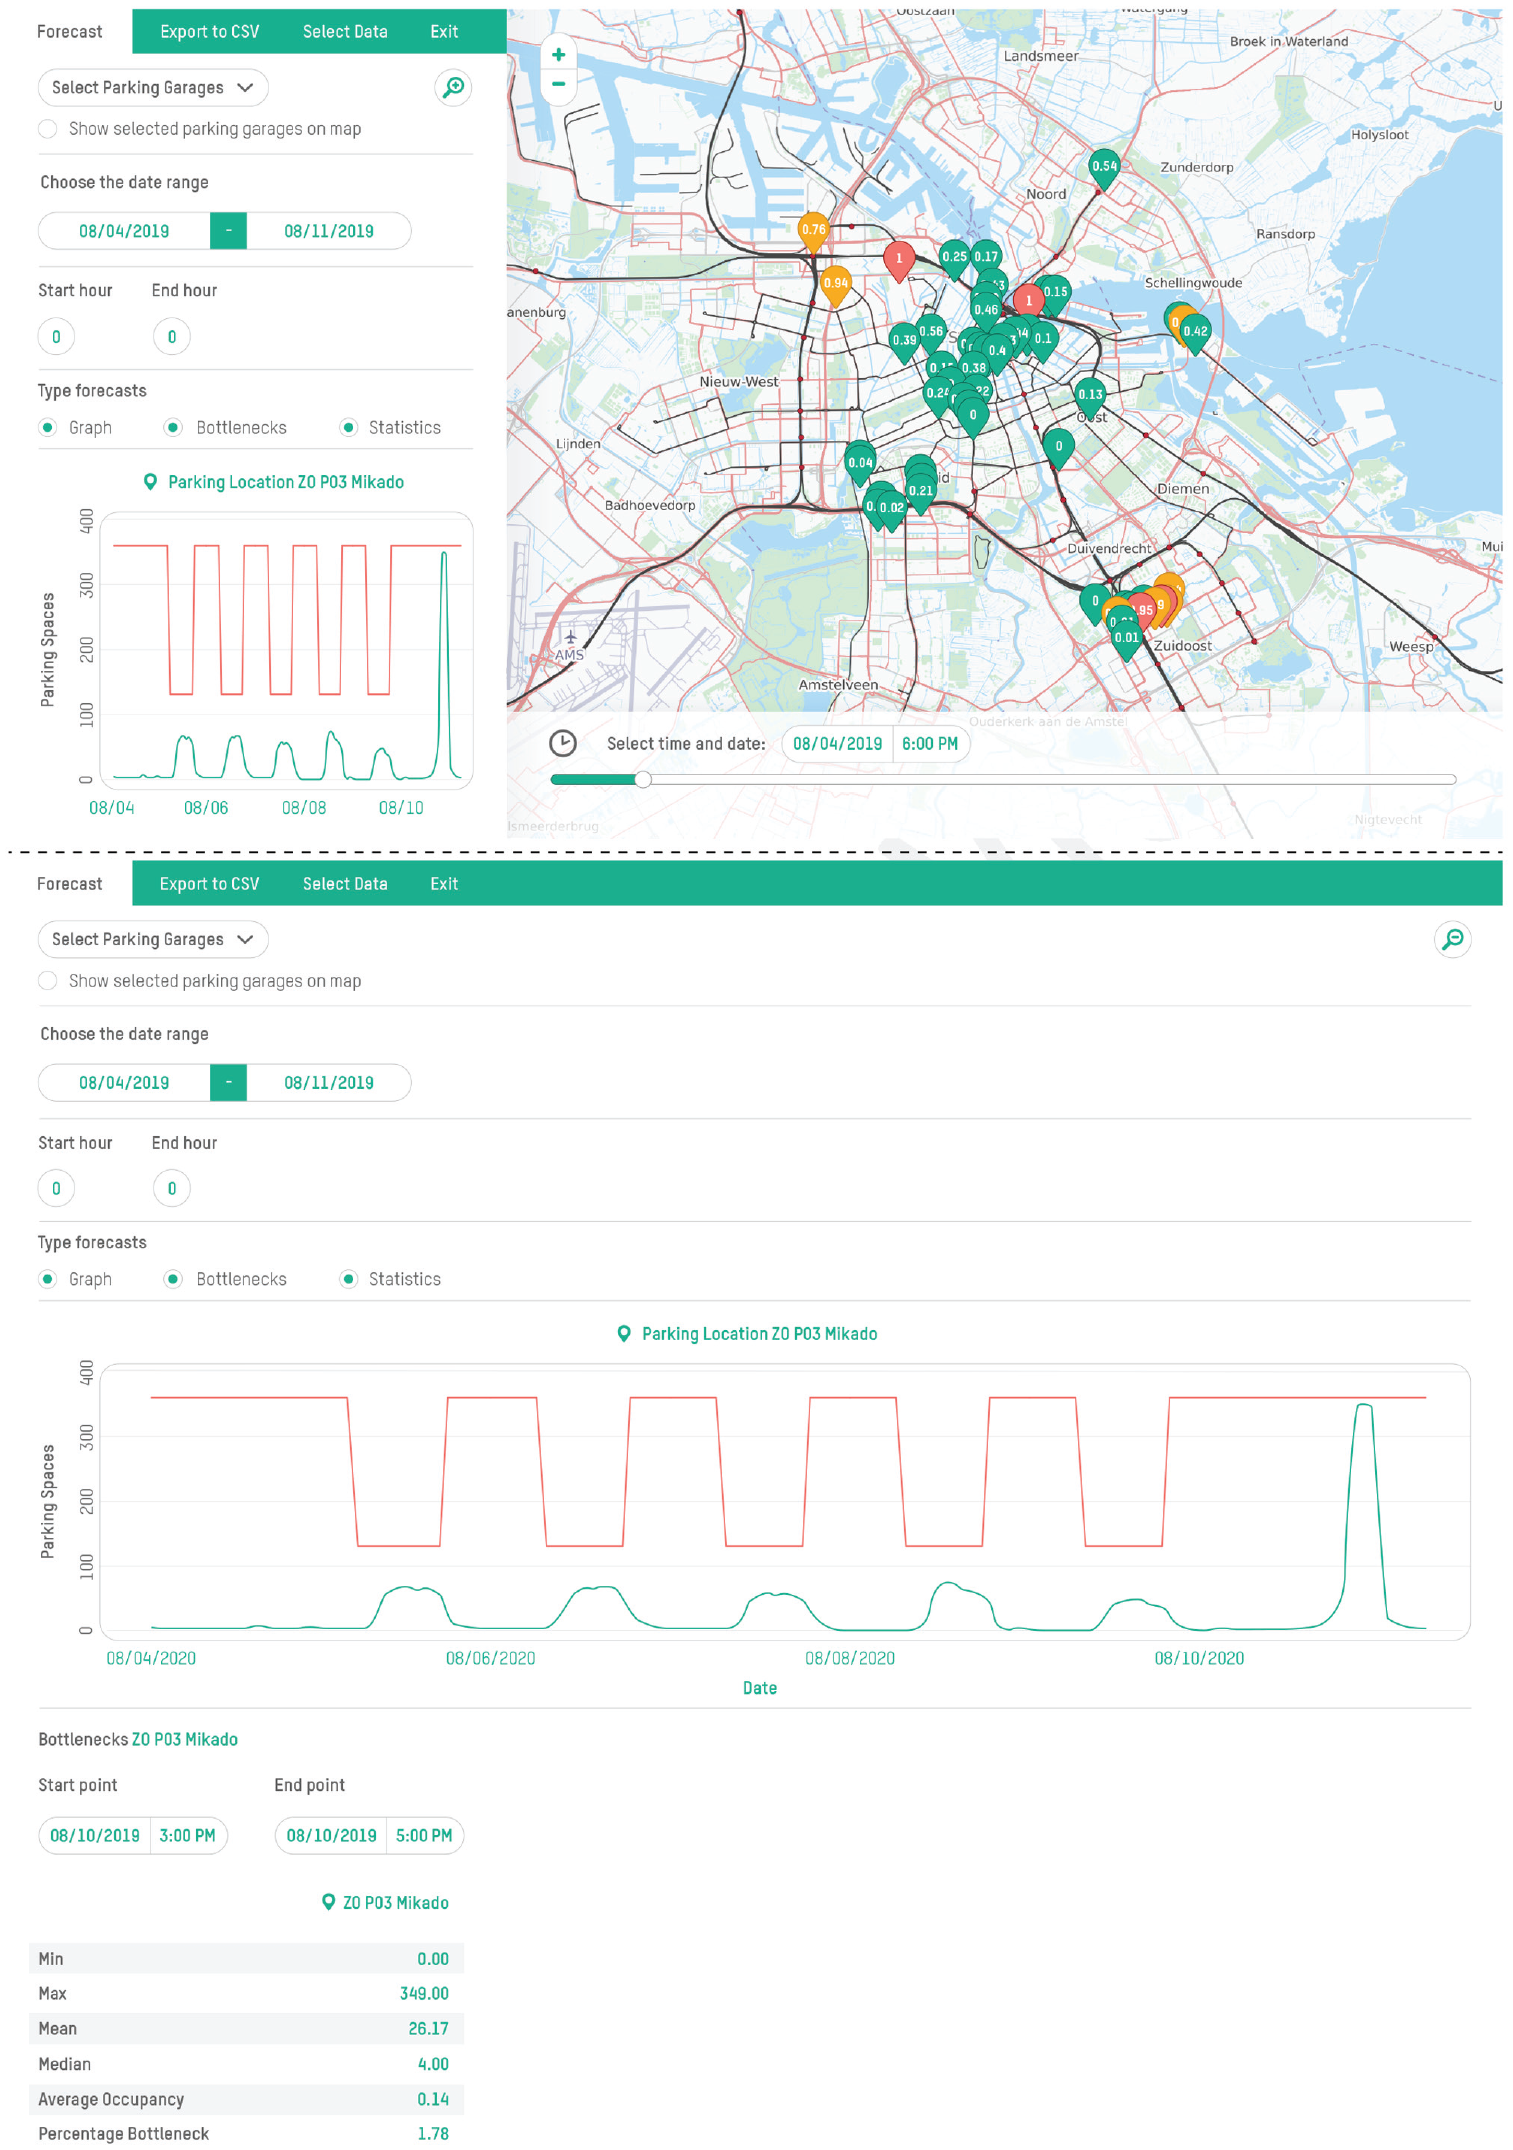
The DSS provided information on the parking occupancy forecast. For most of the locations, the SARIMAX model, and for a few locations (e.g., CE-P03 Piet Hein), the ETS model, were implemented in the DSS. The DSS user interface is presented in Figure 13. The main user interface of the DSS is visualized above the dotted line. On the left-hand side of the user interface the decision maker can select the parking locations and the date and time range of interest. On the right-hand side of the user interface a map is provided. The map uses OpenStreetMap graphics: the values in the placemarks represent the predicted parking occupancy rate for each parking location at the selected time. The results screen is presented below the dotted line. The time series graphs of the selected locations are visualized, and the moments of expected occupancy greater than 95% and related statistics are given. The decision maker can select tabs at the top of the screen, for example, “Export to CSV” to save the results or “Select Data” To select new data. The DSS can enable the policy maker or parking manager to ultimately reduce the urban congestion problems cited in the introduction. Potential applications include
Dynamic pricing: One might increase the parking prices per hour during times when the parking occupancy is expected to be high. For instance, if parking occupancy is expected to be over 85%, the price per hour could be raised by €1.00, and if the expected parking occupancy was under 40%, the price per hour could be reduced by €1.00. The goal of this strategy is to reduce the auto mode share during peak hours, and subsequently prevent congestion problems such as cruising for parking (here, an occupancy of 15% was found to be optimal for minimizing cruising for parking [4]). One could also use the DSS forecasts as an input for other existing dynamic pricing models ( 36 , 37 ).
Urban planning: If it is noted that a parking lot is expected to be (almost) vacant for a long period of time, the lot could be replaced with public areas (e.g., city parks) and cleaner traffic infrastructure (e.g., bicycle lanes).
User interface of the decision support system with parking occupancy forecasts.
Conclusion
The objective of this paper was to propose a forecasting model that provides insights into future off-street parking occupancy. To meet this objective, five forecasting algorithms were compared, namely seasonal naive model, Box–Jenkins seasonal AR integrated MA, with and without exogenous regressors (SARIMAX and SARIMA, respectively), ETS, and LSTM.
For the 6-months ahead predictions, the SARIMAX model outperformed the other models for the vast majority of parking locations, based on the RMSE. When the RMSE values of SARIMAX were compared with SARIMA, it was observed that the addition of exogenous regressors reduced the error significantly, sometimes by 27%. This indicated that including external variables was essential for parking occupancy predictions. The external variables that affected parking occupancy most were the event variables for sports matches and music concerts. Policy makers could use this information to reduce traffic congestion, for example, by increasing parking tariffs when occupancy is expected to be highest.
Other external variables that affected parking occupancy were thunderstorm, average wind speed, temperature, precipitation, sunshine, and the addition of a public transport line. By adding weather variables, model performance was improved by 8%, which could be used for few-hours-ahead forecasting during events. The parking tariffs did not significantly contribute to model performance, which may be because of the lack of data and time variability in the parking tariffs. The highest errors were obtained by the seasonal naive benchmark model in the southeast of Amsterdam, and by the SARIMA model in the city center. For most parking locations, ETS models were the second-best predictors.
The lowest errors were obtained by the real-time LSTM model, because a shorter prediction step led to more precise predictions. As a result of this, the model could be extended to an online short-term model, which would be especially useful for short-term event policy making. Because external variables can be added to the LSTM, model performance could be improved further with such extensions. Another improvement to LSTM would be to extend the model to a 1-day ahead predictor, instead of 1 hour ahead.
Since the event variables had the strongest impact on neighboring parking locations, these could be elaborated further in future studies. By including all events around each parking location, more peaks could be detected. Further, information about the number of attendees at an event could be included to improve model performance.
A follow-up study could be conducted into parking costs, which in this study were not found to have an effect on parking occupancy. However, this finding may have been affected by the lack of data after the parking tariff change. More data are needed to provide stronger conclusions on this aspect.
From the data analysis we observed major differences in parking occupancy development per parking location. To also investigate spatial effects on parking-choice behavior in future work, spatial features could be added to the models. Examples of spatial features include walking distance to public transport stations, recreational facilities, business parks, hospitals, and features that define social safety. Similarly, the addition of parking supply design features could provide insightful information for the built environment, for example, were the average distance from a parking space to the entrance of the parking lot found to affect parking occupancy, this could be incorporated in the design to reduce urban congestion problems. Another design feature of interest might be whether a parking lot is under cover in relation to weather variables. Further, to study the impact of parking occupancy in neighboring parking locations on a given parking location, spatial autocorrelation could be investigated in the future.
In this study, the effect of temporal features on parking occupancy was analyzed. Spatial–temporal features would facilitate investigation of the effect of changes in traffic and transport on parking occupancy for different parking locations. Examples of changes that could affect parking occupancy are new public transit networks or the current COVID-19 policy measures related to parking. Such information and communication technologies in smart cities could be used to form a strong foundation for urban planners and municipalities, resulting in more accurate decision making.
Footnotes
Acknowledgements
We thank the Faculty of Science at the Vrije Universiteit Amsterdam for giving us the opportunity to initially work on the research during the Project Operations of Business Processes (POBP), coordinated by G.M. Koole. We also thank POBP team members S.J.O. Eshun, A. Korthouwer, and S. Tiwari for their contribution to the study design, analysis, and interpretation of the results.Finally, we thank R.D. van der Mei for institutional support at Centrum Wiskunde & Informatica.
Author Contributions
The authors confirm contribution to the paper as follows: study conception and design: T. Koch, E.R. Dugundji, E.S. Fokker; data collection: T. Koch, M. van Leeuwen, E.R. Dugundji; analysis and interpretation of results: E.S. Fokker, T. Koch, M. van Leeuwen, E.R. Dugundji; draft manuscript preparation: E.S. Fokker. All authors reviewed the results and approved the final version of the manuscript.
Declaration of Conflicting Interests
The authors declare no potential conflicts of interest with respect to the research, authorship, and/or publication of this article.
Funding
The authors disclose receipt of the following financial support for the research, authorship, and/or publication of this article: This research was conducted in the framework of the Impact Study North–South Line research theme “Mobility and Accessiblity” hosted at the Netherlands national research institute for mathematics and computer science (Centrum Wiskunde & Informatica) and funded in part by the municipality of Amsterdam and the regional transportation authority of Amsterdam (Vervoerregio Amsterdam).
Data Accessibility Statement
All data are available from the corresponding author on request.