
Abstract
Demand responsive transit (DRT) can provide an alternative to private cars and complement existing public transport services. However, the successful implementation of DRT services remains a challenge as both researchers and policy makers can struggle to determine what sorts of places or cities are suitable for it. Research into car-dependent cities with poor transit accessibility is sparse. This study addresses this problem, investigating the potential of DRT service in Wayne County, U.S.A., whose dominant travel mode is private car. Using an agent-based approach, DRT is simulated as a new mobility option for this region, thereby providing insights into its impact on operational, user, and system-level performance indicators. DRT scenarios are tested for different fleet sizes, vehicle occupancy, and cost policies. The results show that a DRT service in Wayne County has a certain potential, especially to increase the mobility of lower-income individuals. However, introducing the service may slightly increase the overall vehicle kilometers traveled. Specific changes in service characteristics, like service area, pricing structure, or preemptive relocation of vehicles, might be needed to fully realize the potential of pooling riders in the proposed DRT service. The authors hope that this study serves as a starting point for understanding the impacts and potential benefits of DRT in Wayne County and similar low-density and car-dependent urban areas, as well as the service parameters needed for its successful implementation.
Mobility is important for ensuring people have access to their daily needs. Today, the necessity to move, coupled with population growth and economic development in urban areas, has led to increased congestion. Clearly, we need more sustainable transport options to move people safely through cities. Fixed-route and timetable-based public transit presents an effective solution in areas with high demand and well-utilized corridors; however, many locations, including cities, report underperforming public transit services, which are not sufficient for serving all travelers where there is low and sparse demand ( 1 ). This leaves private cars as the predominant alternative for commuters.
While not novel, in recent years, shared mobility has become a viable transportation option. This is partly because of the diffusion of information and communication technologies used in developing systems for requesting trips and making payments within a single software platform. This paper focuses on demand responsive transit (DRT). DRT falls under the broader category of shared mobility and comprises services such as: taxi, paratransit, microtransit, and so forth. DRT refers to a type of quasi-public transport that allows vehicles to modify their routes based on service demand ( 2 ). Operationally different from fixed-route public transit, DRT permits vehicles to pick up and drop off passengers at locations of their choice ( 3 ). When carefully designed, DRT can complement existing public transit. However, there remains the need to investigate how these services will perform amid existing transport modes to improve mobility. Few studies focus on understanding this need, particularly in areas with low public transit utilization and significant socioeconomic disparities, such as Wayne County, Michigan.
Private cars are the dominant mode of travel in the City of Detroit and Wayne County, with public transit accounting for less than 1% of total trips. This is largely because of high auto ownership (95% of households have access to at least one auto). Additionally, transit access is limited and inconvenient for trip making. This presents a problem for many residents who may struggle to afford high auto insurance rates ( 4 ). Wayne County is home to the “big three” U.S. auto makers, Ford, Chevrolet, and General Motors. The local stakeholders have been discussing possibilities for expanding transit and integrating new on-demand mobility options as they anticipate socioeconomic development in the area expected from growth in auto industry employment and future production of autonomous vehicles. Persistent socioeconomic disparities ( 5 ) as well as low public transit ridership make Wayne County a unique location to model DRTs as a possible solution for improving mobility, and will provide valuable insights to transportation agencies and researchers on DRT operations in similar cities.
For this reason, a hypothetical DRT service is modeled and simulated in Wayne County, Michigan. In this context, DRT is defined as a shared fleet of vehicles with operational tolerance for pooling, and with travelers picked up and dropped off at their desired locations. This paper contributes to the state of the art by developing a novel computational schema to convert a trip-based travel demand model into inputs for developing a calibrated agent-based model in MATSim, an open-source mobility simulation platform with an integrated DRT module. This required a further step of developing and calibrating a mode choice model to estimate demand for the DRT service.
The objective of this paper is to understand the demand potential of DRT for Wayne County based on fleet size, cost and vehicle capacity factors. A set of DRT scenarios was run with varying levels of these factors as a method of demand estimation and to understand the impact of DRT on operational, user, and system-level performance indicators. For the effectiveness of the designed DRT, the following questions are addressed: What is the demand for the new service and how will this affect fleet size and vehicle utilization? How does DRT fare affect demand? How do service-design parameters affect user experience of wait time and total trip time including detour allowances? How will the DRT service affect mobility in Wayne County measured by system-level vehicle kilometers traveled (VKT)?
The remainder of this paper is organized as follows. The next section provides background context and review of pertinent literature with regard to agent-based modeling and DRT. The third section describes the research methodology, demand and supply models, and scenario design for the integrated DRT module. The fourth section describes the results, and the fifth section provides a discussion of the research findings. Finally, the conclusion of this paper is presented and areas for future work highlighted.
Background
The past decade has seen an explosion in DRT and related shared mobility research and modeling, where vehicles serve passenger demand with both spatial and temporal flexibility as opposed to the fixed routes and schedules of traditional transit ( 6 ). An overall review of emerging mobility on-demand’s operational concepts is given by Shaheen et al. ( 7 ), and Ronald et al. ( 8 ) provides a more focused review of different studies on DRTs.
The most general approach comes from “aggregate models,” which use combinations of raw data, assumptions, and equations or assumed relationships, to deterministically estimate system-level performance metrics: costs, time, and so forth. Zachariah et al. ( 9 ) take a more detailed and hybrid approach, using a network assignment model to develop a time-based trip schedule for all passengers. More detailed are “Network Assignment Models,” where traditional travel demand modeling tools (e.g., TransCAD) are used with DRT added as an existing mode ( 10 ). They are strong at optimization, such as to test different optimization strategies to relocate vehicles when not in use ( 11 , 12 ). However, being macroscopic in scope, these assignment models lack the fidelity to model the actual performance of a DRT system, such as independent pick-ups and drop-offs.
The third and most detailed group, “Agent-Based Models” (ABMs), directly model the behavior of individual agents in a DRT simulation environment, including at a minimum passenger pick-up, drive time, and drop-off, and behavior while empty. Various sharing and relocation algorithmic approaches are often also simulated. These models have often been used to investigate the theoretical question of how many DRTs would be required to achieve the same level of mobility as private vehicles, finding replacement ratios ranging from approximately 2 to 40, (i.e., private vehicles replaced by one shared taxi) ( 9 ). This level of detail makes ABMs the most flexible of the model groups, useful for testing a range of hypothetical situations, such as different service types ( 13 ), service areas ( 14 ), approaches to ride pooling ( 15 – 17 ), vehicle relocation and staging strategies ( 18 – 20 ), impacts of traffic assignment ( 21 ), and cost impacts of different scenarios ( 22 ). Note that many researchers have a combined approach, utilizing a network assignment model to first generate and assign demand to yield a spatial origin–destination (OD) matrix and roadway travel speed skims, and then employing an ABM to estimate vehicle movements and passenger interactions ( 23 , 24 ). Of the ABMs, MATSim is one of the most popular modeling tools, having the benefit of being both open-source and activity based.
Obtaining good estimates of travel demand is an omnipresent challenge; one of the reasons that so many studies focus on New York, Singapore, and Austin TX is that they have publicly available taxi or transport network companies (TNC) data. No studies to date have specifically focused on overall DRT performance in a city like Detroit, which is characterized by low-density, car-dependent urban structure, and relatively low levels of traffic congestion. Similarly, relatively few studies have tried to endogenously model mode choice within an ABM. The network models of Liu et al. ( 20 ) and Gucwa ( 25 ), model mode choice exogenously as part of the traditional four-step transportation forecasting process, using multinomial logit models considering monetary costs, wait times, and in-vehicle travel times. Liu et al. ( 20 ) extend an existing ABM model of Austin to consider varying per-kilometer costs jointly with mode choice.
Other researchers consider mode choice endogenously in their models, as done in this paper. For example, Hörl et al. ( 26 ) treat mode choice directly as part of their ABM, with fully specified mode choice utility functions, in their hypothetical Sioux City network. Azevedo et al. ( 27 ) model the choice between private vehicles, public transit, and shared autonomous vehicles. Franco et al. ( 28 ) show that DRTs could take mode share from private cars, especially when well-integrated with public transit. Moreno et al. ( 29 ), examines how the shift to DRT could affect overall number of trips and distance traveled.
Methodology
Overview of MATSim
MATSim ( 30 ) is an extendable, multi-agent simulation framework implemented in Java. It simulates the activities and trips of travelers (referred to as “agents”) on a network for an entire day. Agents in MATSim have daily plans, which consist of their activity chains and socioeconomic information. Each activity contains certain information, such as activity location, start, and end time. In a typical application, MATSim operates in an iterated loop until it achieves user equilibrium. It uses a co-evolutionary algorithm where each agent optimizes its individual plan until the system converges to a stable state.
In this novel application, demand from an existing, calibrated trip-based model for Southeast Michigan is combined with the trip assignment capabilities of MATSim. Since we are modeling individual trips made by agents, rather than agents’ daily activity plans, the MATSim utility scoring mechanism which adjusts activity plans is not used to achieve system equilibrium. Only route choice is optimized to achieve convergence, given fixed origins, destinations, and departure times. A mode choice model is integrated to predict choice of private auto, public transport, walk, bike, and DRT modes. Below, the model network and demand components are discussed in more detail.
Network Creation
All roads within Wayne County were extracted from OpenStreetMap to form the basis of the MATSim network. To reduce computational complexity, the road network was thinned outside of the downtown Detroit area to match the planning network used in the Southeast Michigan Council of Governments (SEMCOG) E-7 trip-based model ( 31 ) (see Figure 1). Routing issues arising from the network thinning procedure were manually corrected.
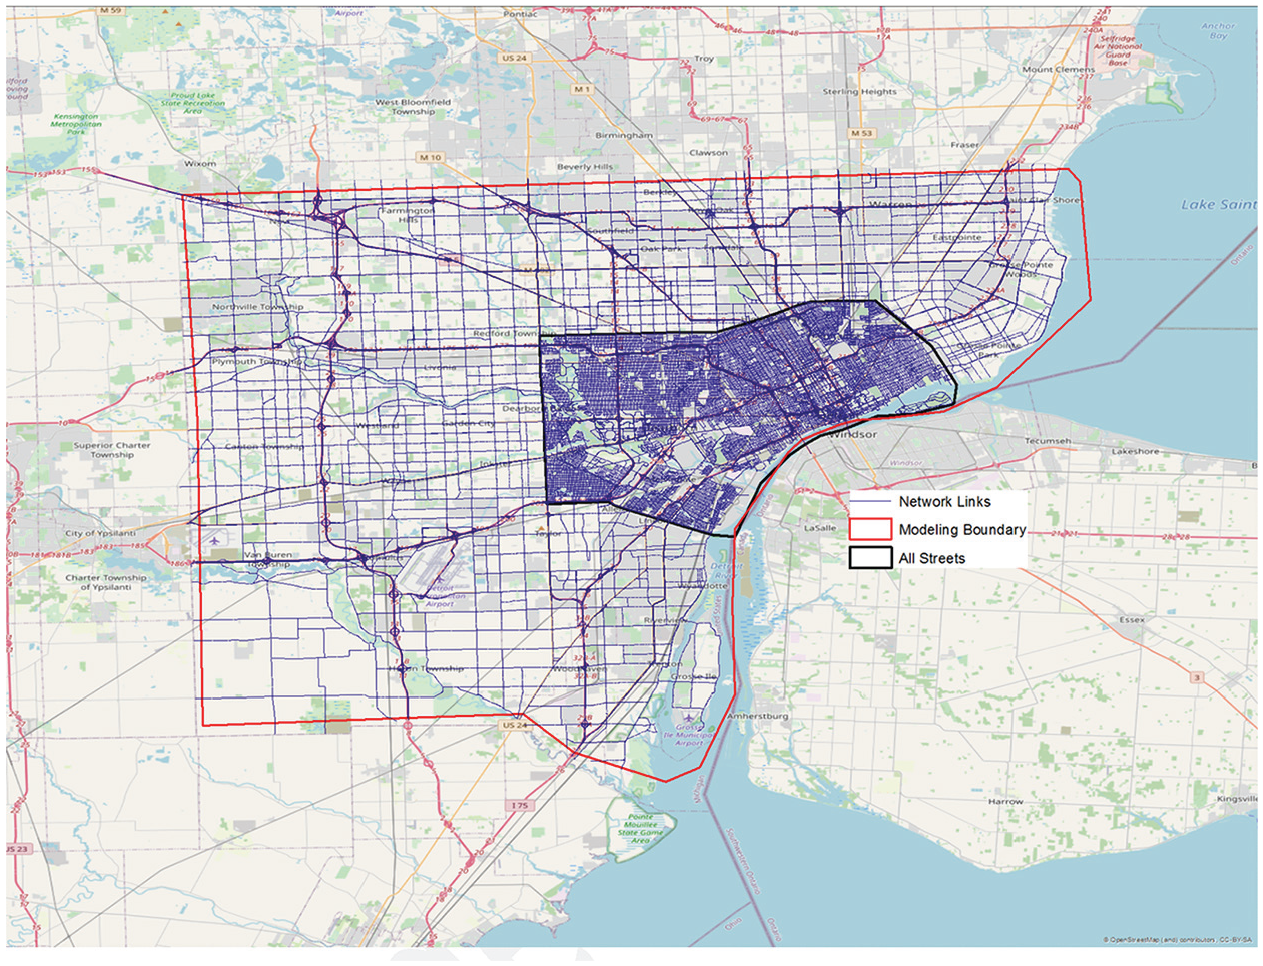
MATSim network of Wayne County.
MATSim requires links to be only unidirectional, so two-way links from OpenStreetMap were duplicated to create two identical links but with the start and end nodes switched. Link capacities and free-flow speeds (when not present in the OpenStreetMap network) were calculated based on the SEMCOG E-7 model network.
Transit routes were created from General Transit Feed Specification (GTFS) data, where available, or coded manually. Transit operators in the model include the Suburban Mobility Authority for Regional Transportation and Detroit Department of Transportation, whose buses service downtown and surrounding suburbs, and the QLINE streetcar and Detroit People Mover automated light rail system servicing the central business district. The pt2matsim software package ( 32 ) was used to combine GTFS data for these services and to create additional links in cases where routes extended beyond the Wayne County network. This package also created a public transportation vehicle list and schedules.
Travel Demand
The SEMCOG E-7 trip-based model was used as the base travel demand for this work. It contains more than 20 million person trips across six counties, 2,899 travel analysis zones, eight trip purposes, and 15 trip modes. Transforming the E-7 trips into MATSim “agents” required two steps. First, SEMCOG E-7 trip tables were disaggregated into individual trips that could equate to MATSim agents. Secondly, since the SEMCOG model encompasses a much larger area than the modeling area of Wayne County used for this project, the trips/agents were filtered to select only those that traversed the network for inclusion in the DRT simulation.
For the first step, production–attraction (PA) matrices from the E-7 mode choice model were first converted into OD format. The E-7 mode choice model creates PA matrices by income group, trip purpose, and peak or off-peak travel period. Each PA matrix contains a core for each of the 15 available trip modes in the E-7 model. PA matrices were converted into OD format using the PA to OD factors specified in the SEMCOG E-7 model. PA to OD factors are dependent on trip purpose, time of day, and direction. Peak period PA matrices were split into morning (AM) and afternoon (PM) whereas the off-peak matrices were split into midday (MD), evening (EV), and night (NT) for a total of five time-of-day periods.
After conversion to OD format, the shared ride 2 and shared ride 3+ trip tables were divided by 2 and 3.5, respectively, to convert from person trips to single vehicle MATSim agents. All cells in the OD matrix were then converted to an integer based on Monte Carlo sampling. Matrices for commercial vehicle trips already in OD format were also integerized and included. These commercial vehicles, which represent light, medium, and heavy trucks are included in the simulation as the background traffic because they contribute to network congestion.
For the second step, to select which trips entered or exited the region, unique link identifiers were coded and then skimmed to determine whether a trip crossed the model boundary, and if so, over which link and in which direction. Trips that had the entirety of their journey outside of the modeling area were excluded. Origins and destinations outside the model region were coded to the network’s boundary link.
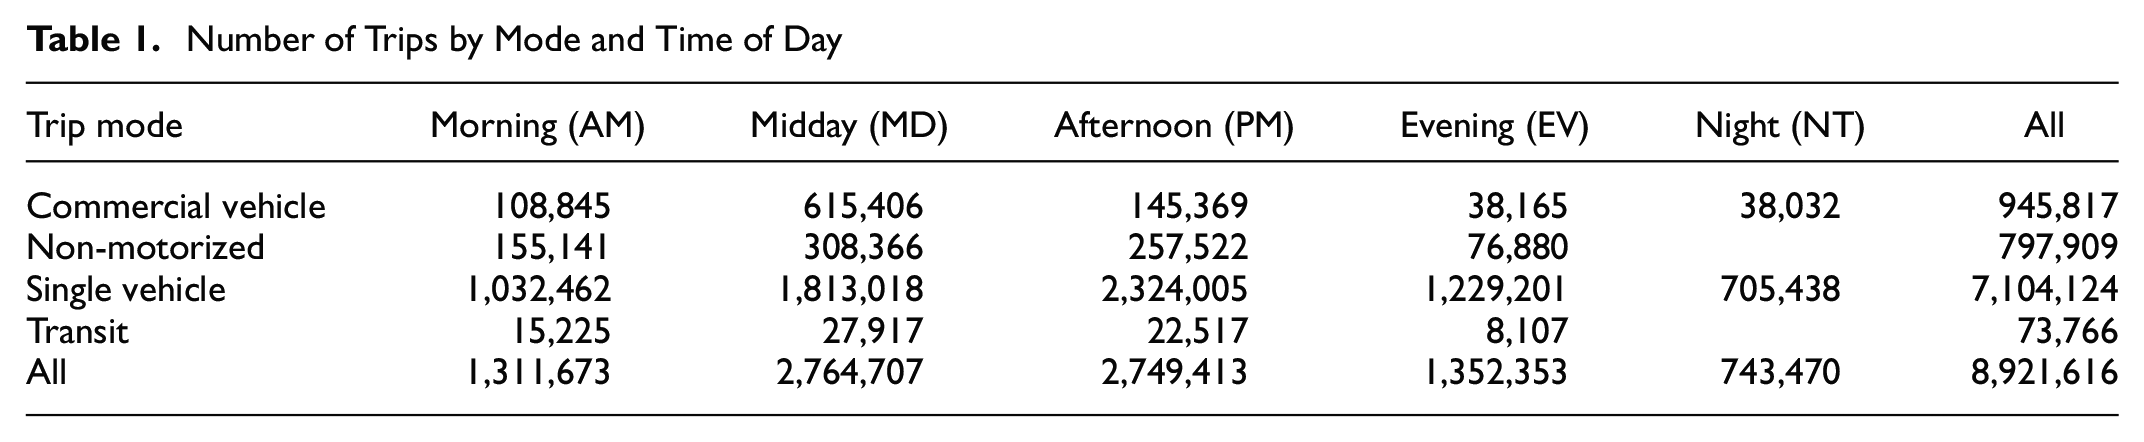
After completion of this process, the resulting demand of about 9 million trips within the modeled area can be seen in Table 1, segmented by trip mode type and time of day. Each of these trips was then input to MATSim as an “agent” making only one trip.
Number of Trips by Mode and Time of Day
Next, every MATSim agent was assigned a trip start time based on the time-of-day period they originated from. Start times were sampled from the time-of-day distribution of counts provided in the E-7 model documentation. Linear interpolation was used to distribute the half-hour count data to one second resolution to avoid bunching on the network caused by multiple MATSim agents spawning in the same location at the same time.
All MATSim agents were also assigned network links for start and end locations. Trip ends inside the modeled area were allocated to MATSim network links using Monte Carlo simulation based on link length (longer links were more likely to be selected than shorter links). Links corresponding to freeways and freeway ramps were excluded from the sampling subset to avoid agents starting or ending on highways. As noted above, if the agent entered or exited the modeling region, the start or end link corresponded to the appropriate link crossing the boundary.
Finally, each agent was assigned attributes for use in a mode choice model. Household income attribute was given based on the PA matrix the trip originated from. Auto ownership attribute was given based on a distribution derived from Wayne County Census data for each income category. Commercial vehicle agents and external trips were not given these attributes, and were excluded from the subsequent mode choice model.
Mode Choice Model
In this work, the eqasim framework that couples a discrete mode choice (DMC) extension with the microsimulation in MATSim is used to simulate agents’ mode choice decisions. The DMC extension enables one to utilize traditional DMC models within MATSim’s replanning phase. It can consider trip or tour-based constraints and mode availability rules. Detailed description of the DMC module and eqasim framework can be found in Hörl et al. ( 33 , 34 ) and Hörl and Balać ( 35 ), respectively.
In the MATSim’s replanning phase only a randomly sampled portion of the population in any given iteration performs mode and route choice. This study, in each iteration, samples 10% of the agents to perform mode and route adaptations.
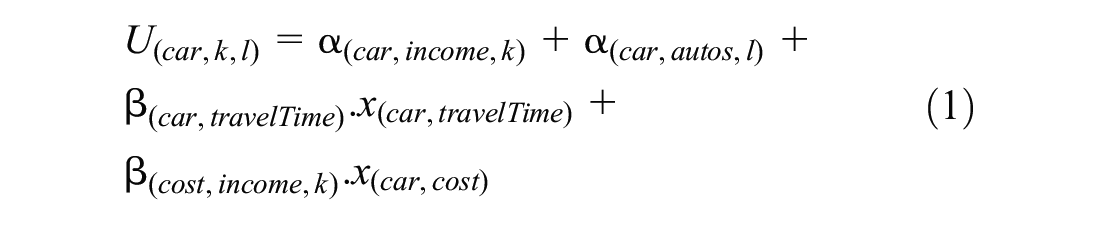
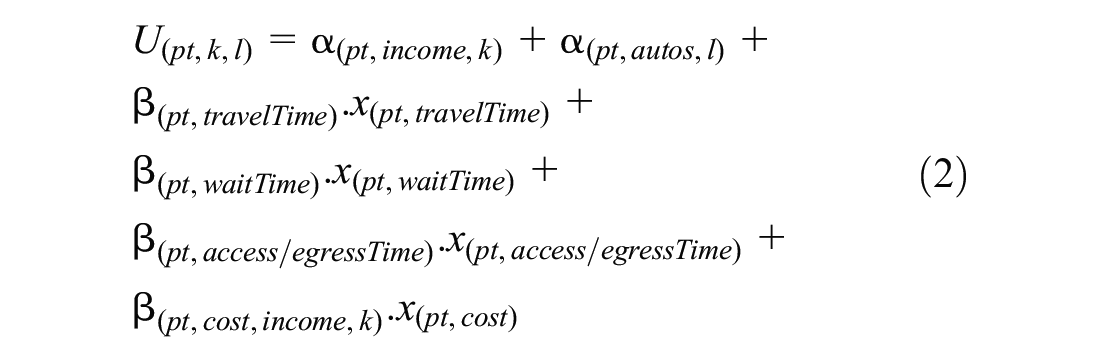
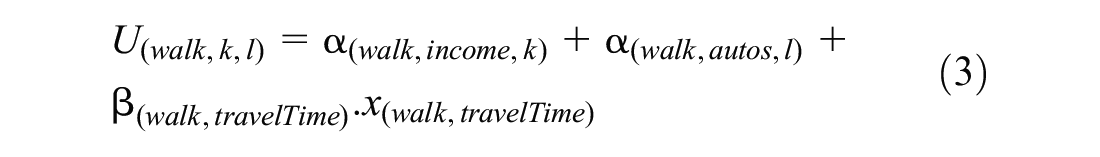
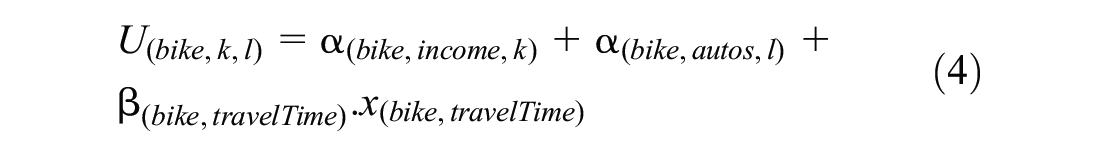
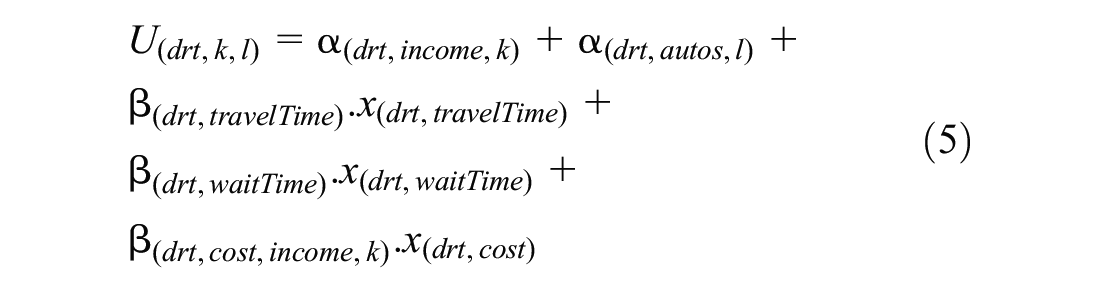
Furthermore, a multinomial logit model for mode choice is used. The choice model formulation is given in Equations 1 to 5 while the model parameters are specified in Table 2. The utility
Calibrated Parameters for Mode Choice Model
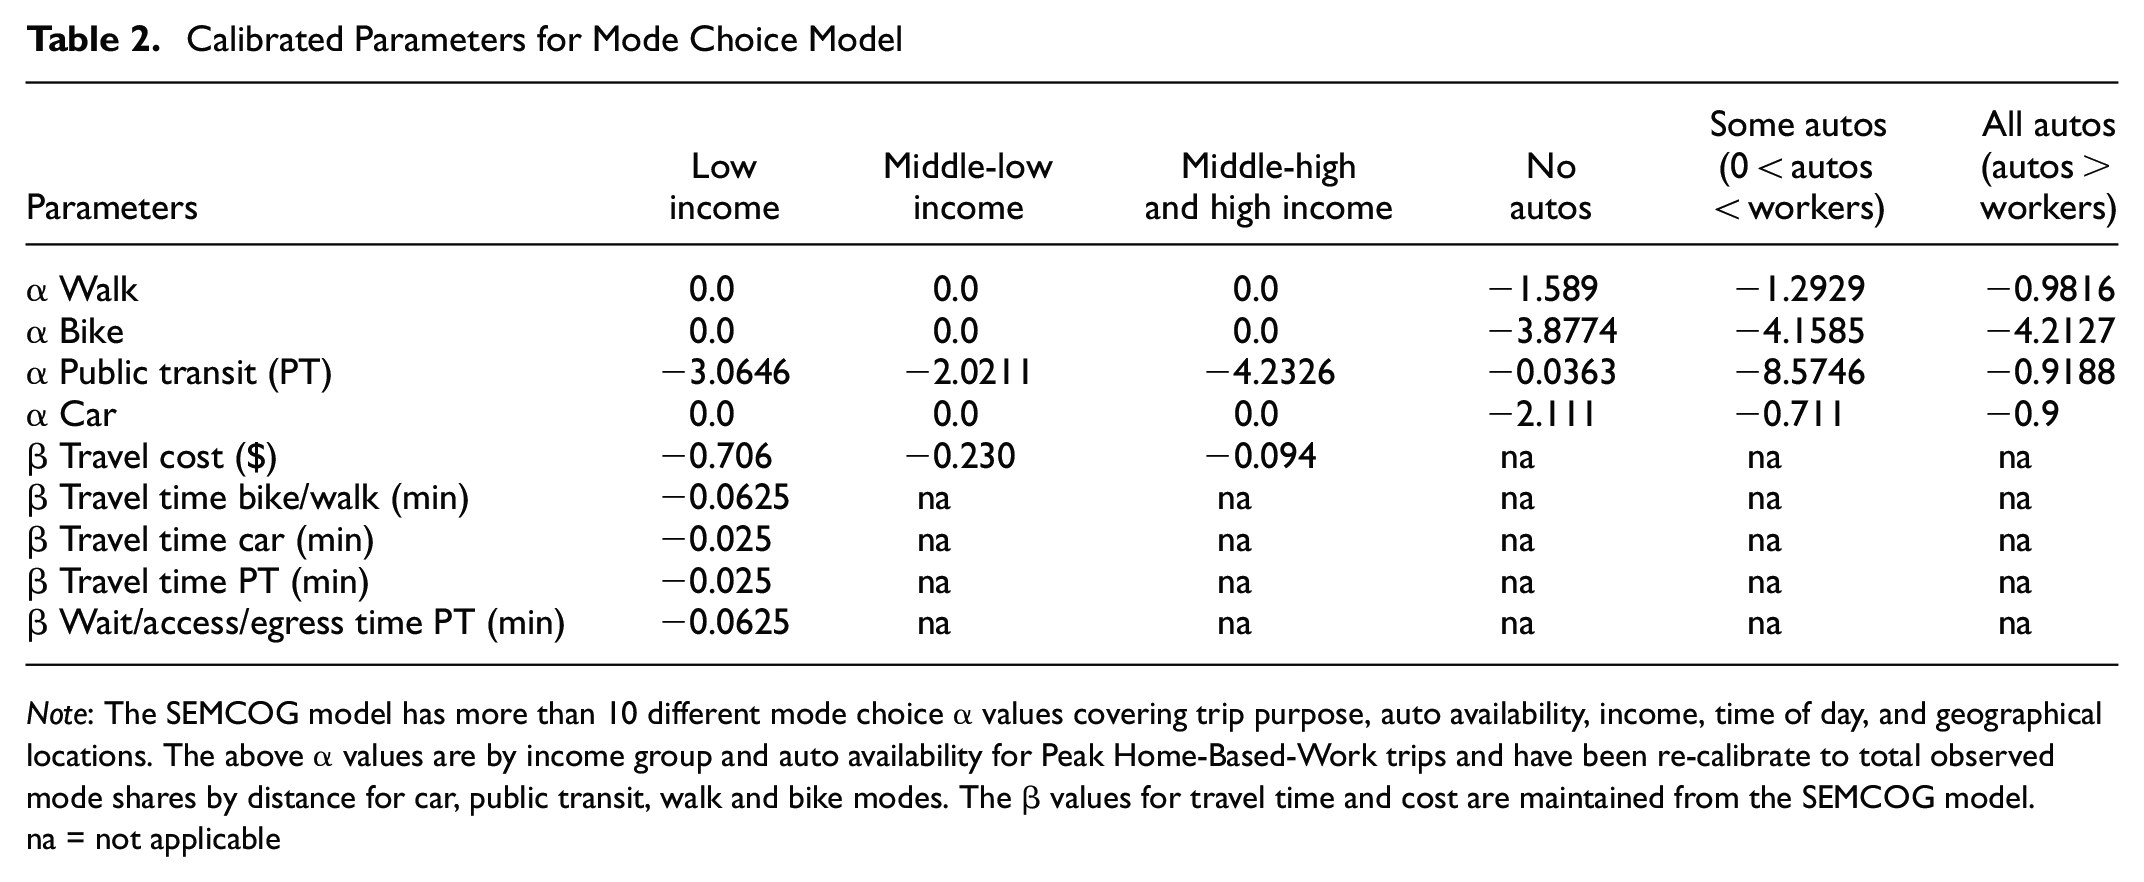
Note: The SEMCOG model has more than 10 different mode choice
na = not applicable
Parameters for public transit are applied to the DRT mode (Equation 5) since the SEMCOG model does not consider DRT. The DRT service is available only for internal trips, that is, those trips that originate and end in Wayne County. This is because we do not know where external trips in the model start or end. Furthermore, since a door-to-door DRT scheme is applied, there is no access or egress time as there is for public transport.
Simulation of DRT
DRT simulations for Wayne County were conducted using a DRT extension ( 36 ) of MATSim. The DRT extension has a dispatching algorithm managing the movement of DRT fleet and travelers’ requests. This process, like in real life, is dynamic and depends on the state of the simulation system. An agent choosing the DRT service submits a trip request and waits for a vehicle. The dispatcher then assigns a vehicle with the smallest detour time loss, to handle the request. Detour time loss is a measure of detouring because of adding additional passengers to a vehicle, which consists of pick-up detour time, drop-off detour time, and stop duration for pick-up and drop-off. It is added to the total travel time of agents with shared rides. If there are more trip requests than vehicles in the system, it is possible that some agents cannot be served within a pre-defined wait time. In that case, these agents’ trips will be labeled as “rejected” and then removed from the microsimulation of the current iteration. When a DRT vehicle drops off its last passenger and there are no other trip requests at that particular time, the DRT vehicle stays at the location where the last passenger has been dropped off.
The DRT module requires some configuration settings which define the vehicle fleet and operational parameters. Vehicles are generated based on defined fleet size, maximum vehicle capacity, and start and end locations. Maximum customer wait time and detour time of 15 min each were set and a stop duration of 105 s (1.75 m). Finally, the start time for the simulation was set at 12:00 a.m. midnight and the end time at 4:00 p.m. A total of approximately 5.4 million trips are simulated over this period.
DRT Service Level Scenarios
The objective of this paper is to understand the demand potential of DRT for Wayne County based on fleet size, cost, and vehicle capacity factors. Therefore 16 DRT scenarios were defined consisting of four different vehicle fleet sizes (100, 250, 500, and 1,000), two different vehicle capacities (four and seven occupants) and two different fare rates ($2 and $4). Vehicle capacity had no influence on the results, so the analysis presented is for four-occupant vehicles.
Results
This section compares the different scenarios and analyzes the impact of different fleet sizes, vehicle sizes, and fares on DRT demand, operational performance indicators, and system performance. First, three operational performance indicators were examined: fleet size and fare level, VKT, and vehicle occupancy. This provides insights on DRT utilization and an understanding of minimum requirements for a feasible DRT service in Wayne County. Next how the DRT service parameters (wait time, detour time) affect two measures of customer experience—waiting time and affordability—was observed. Finally, the system impact of DRT in Wayne County was measured by comparing the baseline scenario to the DRT scenarios.
Fleet Size and Fare Level
The first scenario runs were sensitivity tests for the minimum fleet size required to serve demand at each fare level. Table 3 shows the served/rejected trips for the $2 and $4 levels. In MATSim, the DRT demand is the total number of agents requesting the DRT service, whether served or not; it is the sum of actual DRT rides and rejections. Total rejected rides are quite high with a small fleet, but are reduced substantially as more vehicles are added to the fleet.
Demand for Demand Responsive Transit
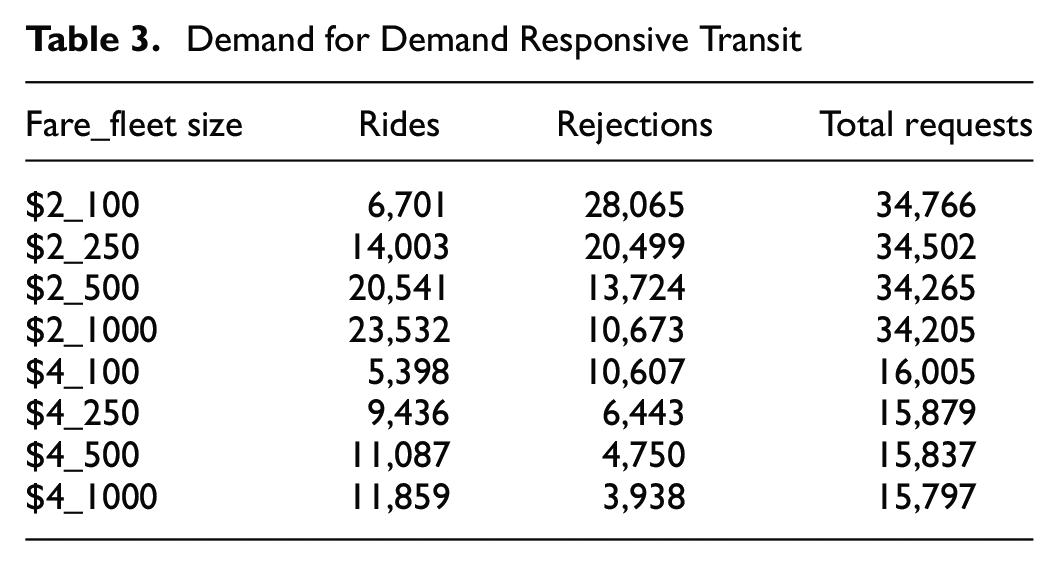
As can be seen from Table 3, increasing fleet size (i.e., supply) results in a minimal change in the total demand. However, a 100% increase in the price from $2 to $4 strongly reduces the demand by about 50%. At the $2 fare level, DRT trips keep increasing with fleet size, with the rate of change in rides per fleet size increasing 50%, 35%, and 18%, respectively. This is not the case at the $4 fare level. Between 100 and 250 fleet size, there is an increase of 26%, as the fleet size doubles; this increase drops to 13% and finally a second doubling from 500 to 1,000 fleet size leads to a minimal increase of 7%. The DRT trip rejections follow a similar trend.
To explain the almost stable and slightly decreasing demand, one must look at how mode choice is simulated in the adapted MATSim model, and the possible impact of DRT vehicles on congestion in the network. Besides the maximum waiting time and maximum detour time, other parameters of the service reliability (such as trip rejections) are not taken into account in the mode choice model. Consequently, if in a certain area the demand is high and many people are not served, in the next iteration, agents’ decision to use DRT service will not be influenced by the rejection effect of the previous iteration. This would explain the reason why there is almost the same number of requests even for a fleet size of 100 whose rejection rate is about 80%.
The decreasing trend of the demand, on the contrary, possibly reveals the impact of additional DRT vehicles on the network. Even though the maximum fleet size of 1,000 contributes less than 0.1% of the vehicles on the network, the actual usage of the fleet may have affected congestion in certain high demand areas. These are the locations where most of the pick-ups and drop-offs happen (see Figure 2). As these are concentrated, there will be increased VKT in these areas. Therefore, even if the total network distance is not changing substantially (see Table 5), this change is not homogeneous over the network. A similar effect is reported in Hörl et al. ( 37 ), where it was observed that a door-to-door autonomous vehicle service contributes little to the overall VKT of the network, but residential areas are substantially affected because of the high number of pick-ups and drop-offs.
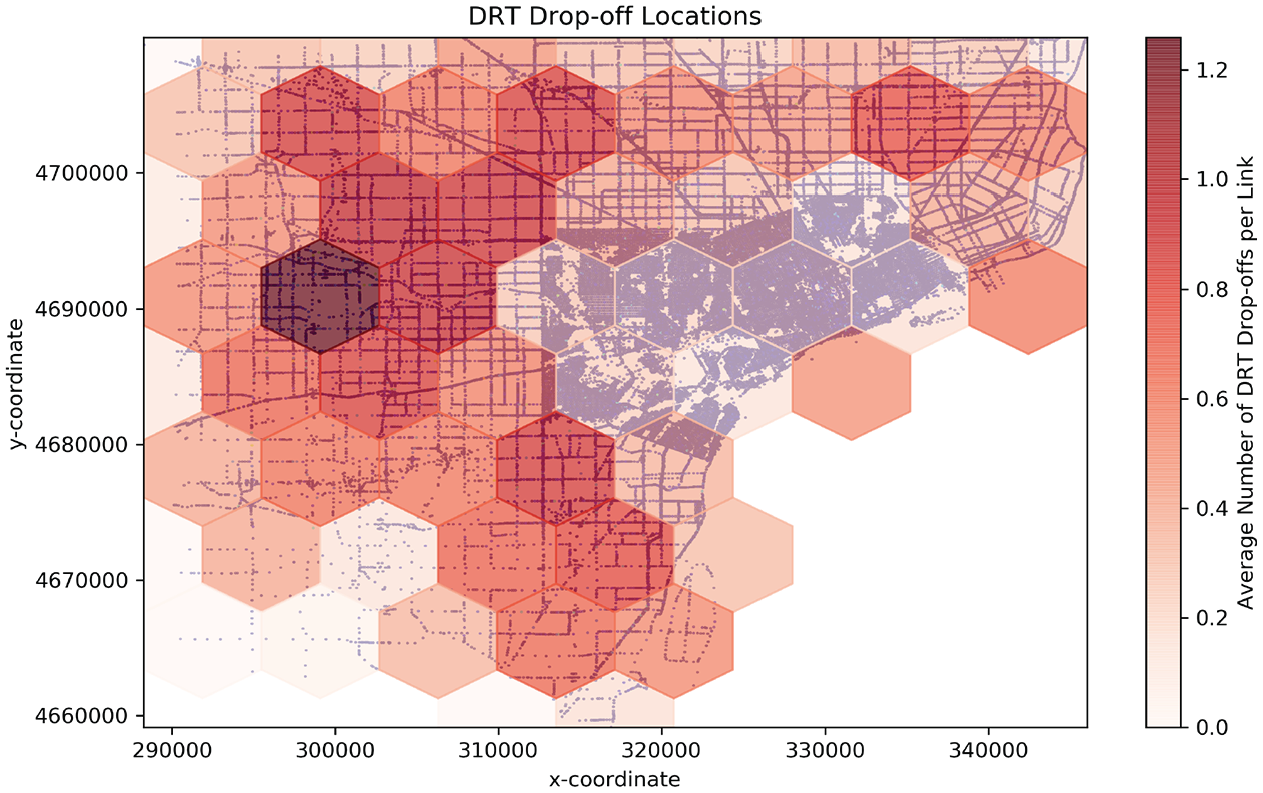
Demand responsive transit (DRT) drop-off locations. Grids show the share of drop-offs in an area and each dot represents a link with at least one DRT drop-off.
VKT
Average total distance per DRT vehicle decreases as fleet size increases. At the $2 fare level, it ranged from 483 km per DRT vehicle for fleet of 100, to 188 km for fleet of 1,000; and similarly, 435 km and 98 km for a $4 fare. Even though there are more vehicles serving more trips, the overall average VKT per vehicle reduces as fleet size increases.
Also, as fleet size increases, the ratio of passenger-less (i.e., empty) to passenger VKT decreases (the ratios are 0.32, 0.26, 0.19, 0.15, and 0.33, 0.25, 0.19, 0.15 for $2 and $4 fare, respectively). From Figure 3 one can clearly see that with larger fleets, the percentage of empty vehicles driving around reduces, as more vehicles spread throughout the network. This effect is the same for both fares except for the magnitude of demand. We will also see this trend reflected in the reduced wait times discussed later.
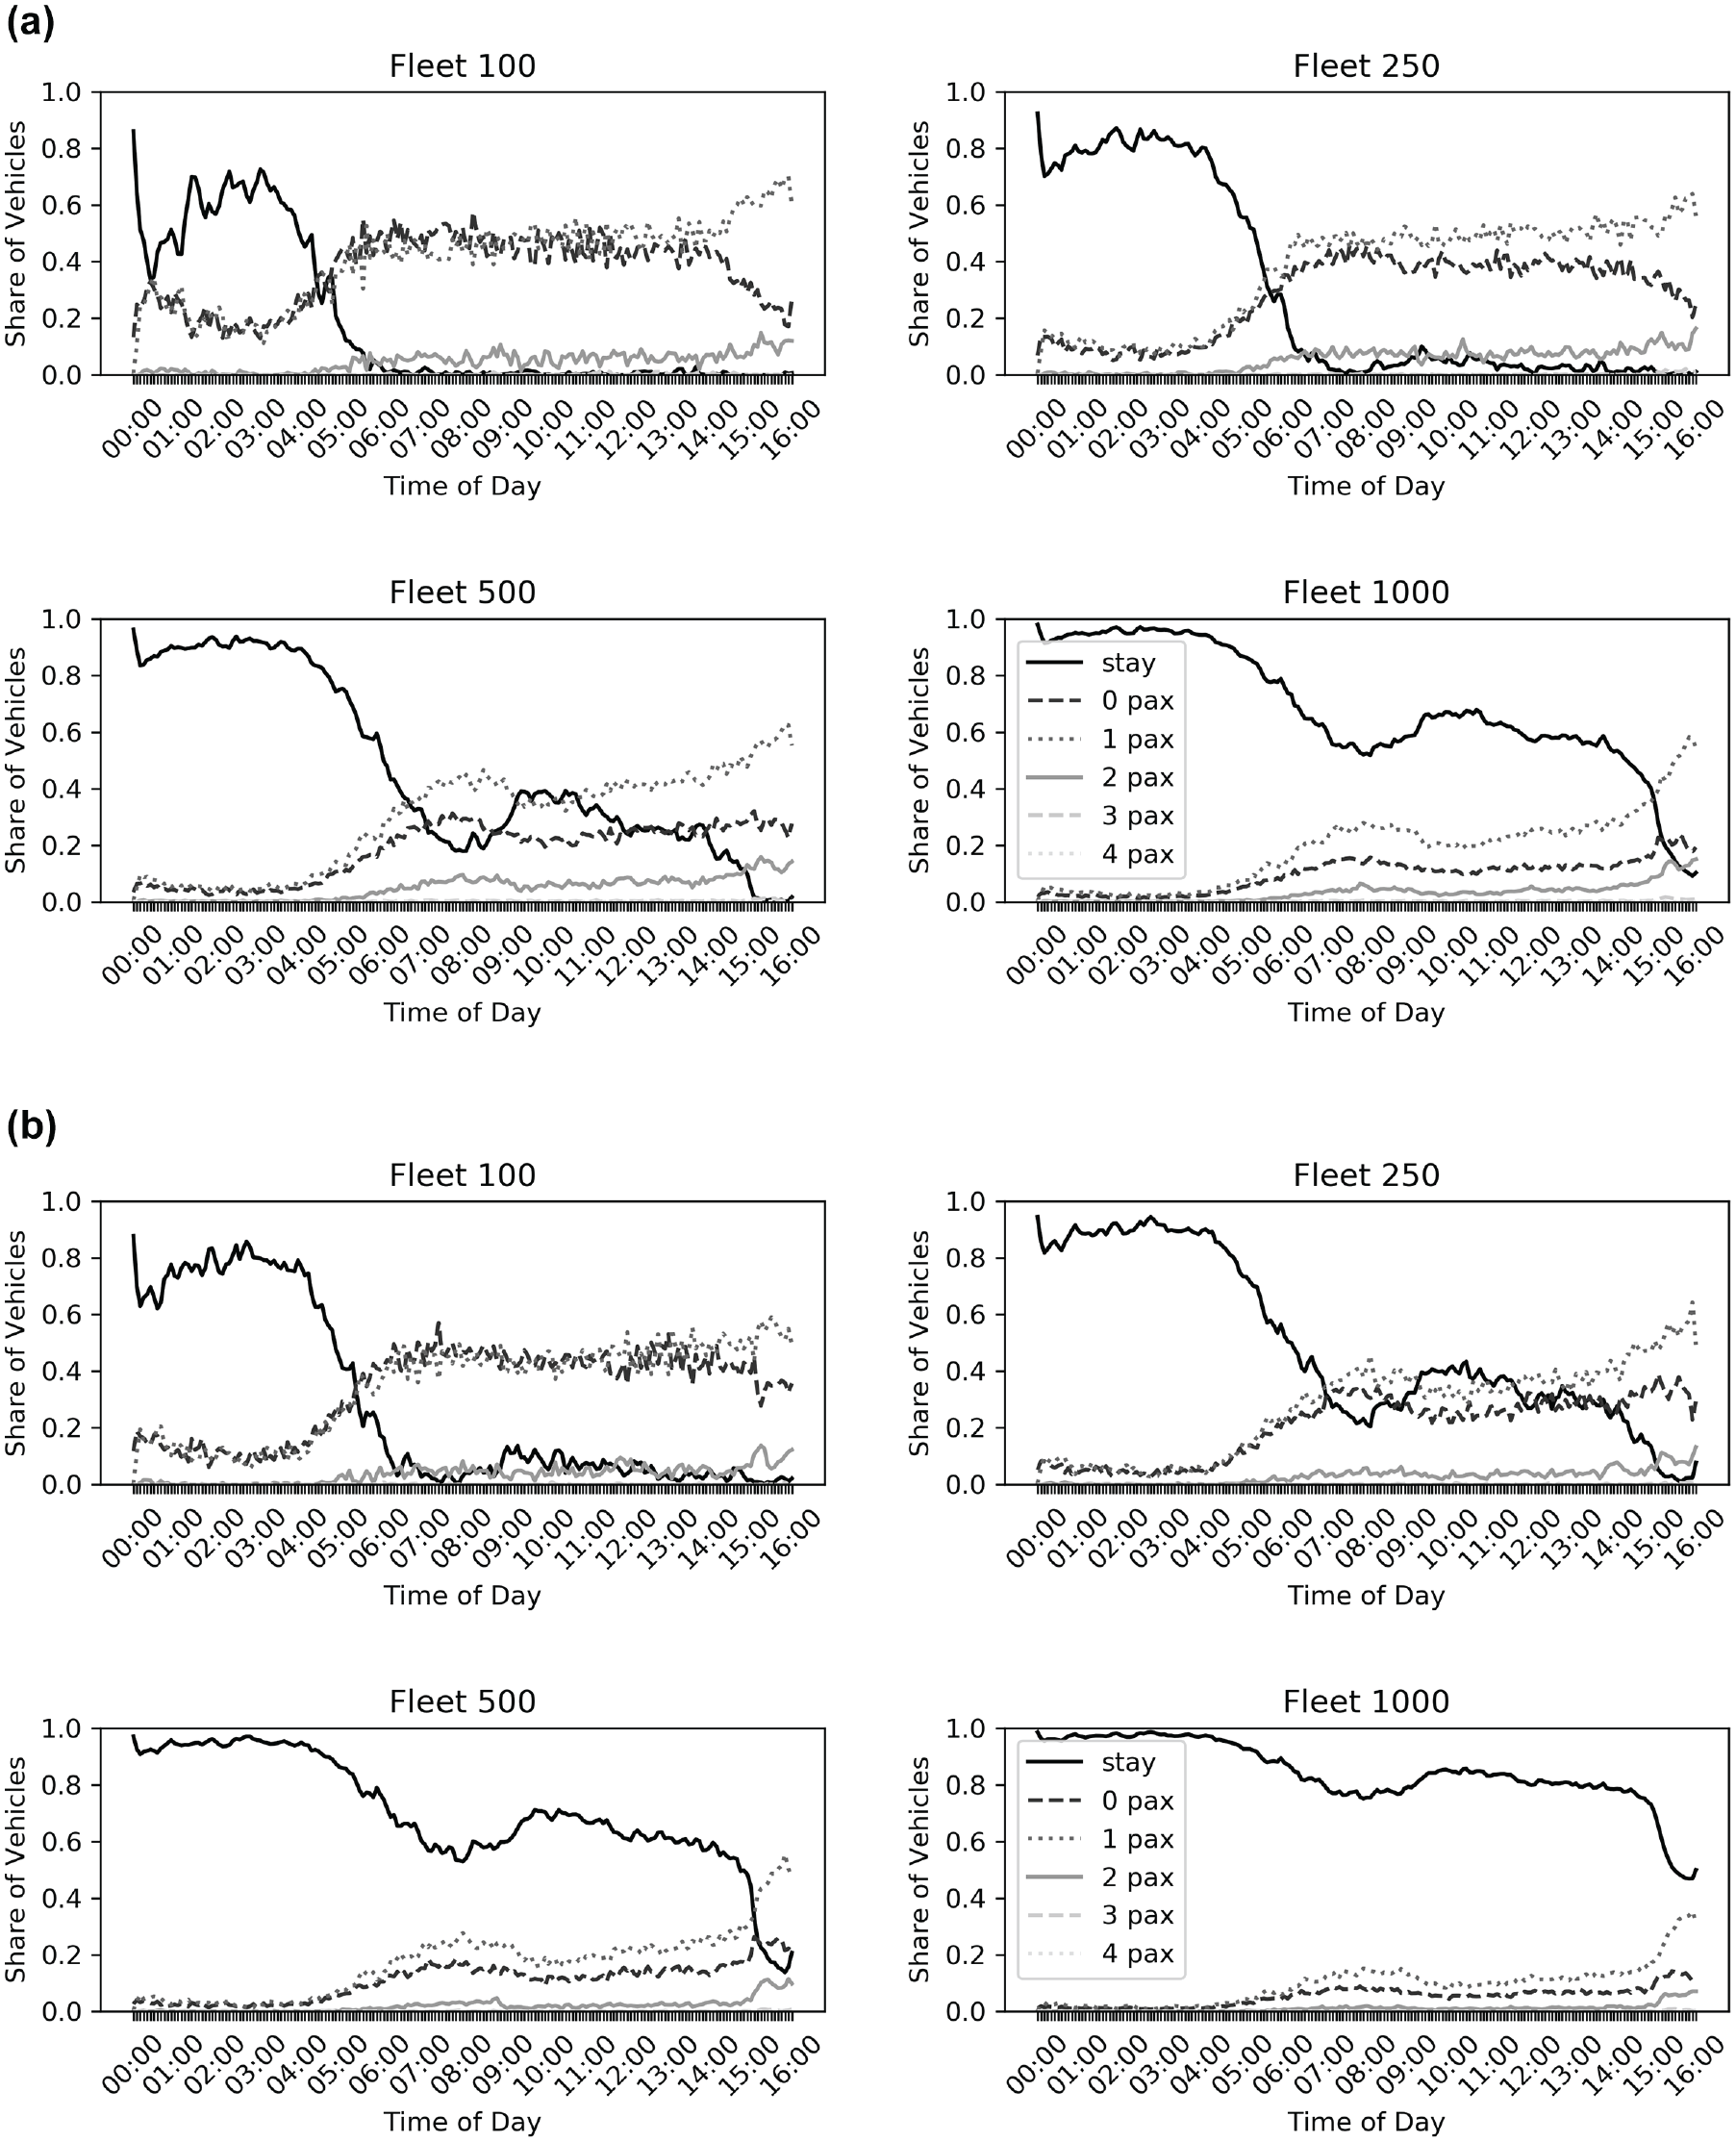
Vehicle occupancy for different fleet sizes by time of day: (a) $2 fare and (b) $4 fare.
Furthermore, compared with an average trip distance of 10 km for car travel, the majority of the passengers are using DRT for relatively shorter trips with average trip distances between 5 and 7 km.
Vehicle Occupancy
Figure 4 shows little actual ridesharing in any of the scenarios tested. This is also clearly seen in Figure 3, which shows that most of the DRT trips throughout the 16 h day period are single occupancy trips. This may be because the model area includes a large suburban portion of Wayne County characterized by low-density development, which makes it challenging to pool rides. The highest average occupancy per vehicle achieved in the simulations (1.12) was less than the smallest vehicle capacity tested (four passengers). As a consequence, vehicle capacity had no visible effect on the results.
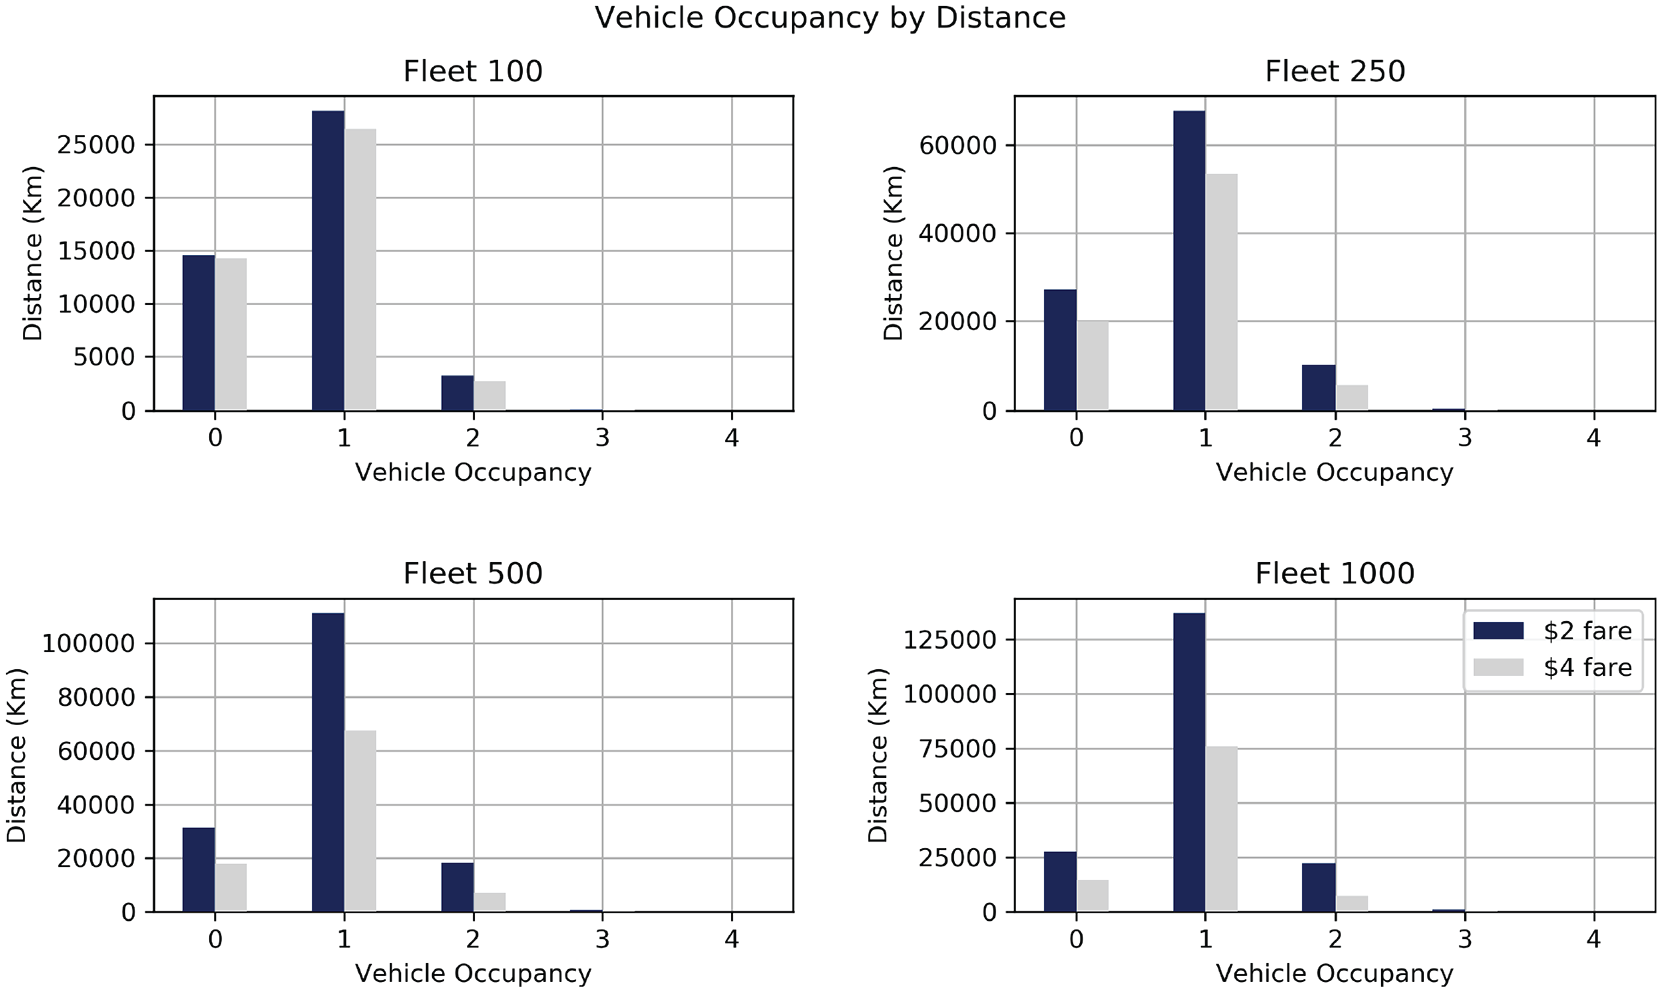
Vehicle distance traveled by occupancy for different fleet sizes.
It is interesting to note that, even with the high percentage of idle vehicles throughout the day for fleet size of 500 and 1,000, these vehicles still reject agents’ requests, likely because of the pre-defined service parameters, maximum wait time and detour time, and the consequence of modeling a large region. Since there is no rebalancing between trips, the vehicles are sparsely spread over all of Wayne County, as they pick up passengers and drop them off at their destinations. So even if vehicles are not in use, rejections can still happen, as the requests may be too far away from where the vehicle is sitting and are unable to meet the detour constraints for in-vehicle passengers and the wait time constraint of the requesting passengers. There is need to optimize the pooling, by testing different detour factors and wait times in future scenarios as well as limiting the DRT service to specific areas with high demand.
Passenger Rides and Wait Time
We have already seen more agents making requests for the DRT service than the service can meet. Figure 5 shows the hourly distribution of the DRT passenger rides. The passenger rides, which are the accepted requests, are higher in the morning peak period between 6:00 and 8:00 a.m. Afterwards, there is a slight decrease that spreads throughout the whole day for smaller fleet sizes, but peaks again in the afternoon for larger fleet sizes. This is because, with more vehicles, more demand is met at peak times. In Figure 3, smaller fleets have no idle vehicles and are unable to meet the demands at peak times for about 45% of these passengers who are either going home or going to work.
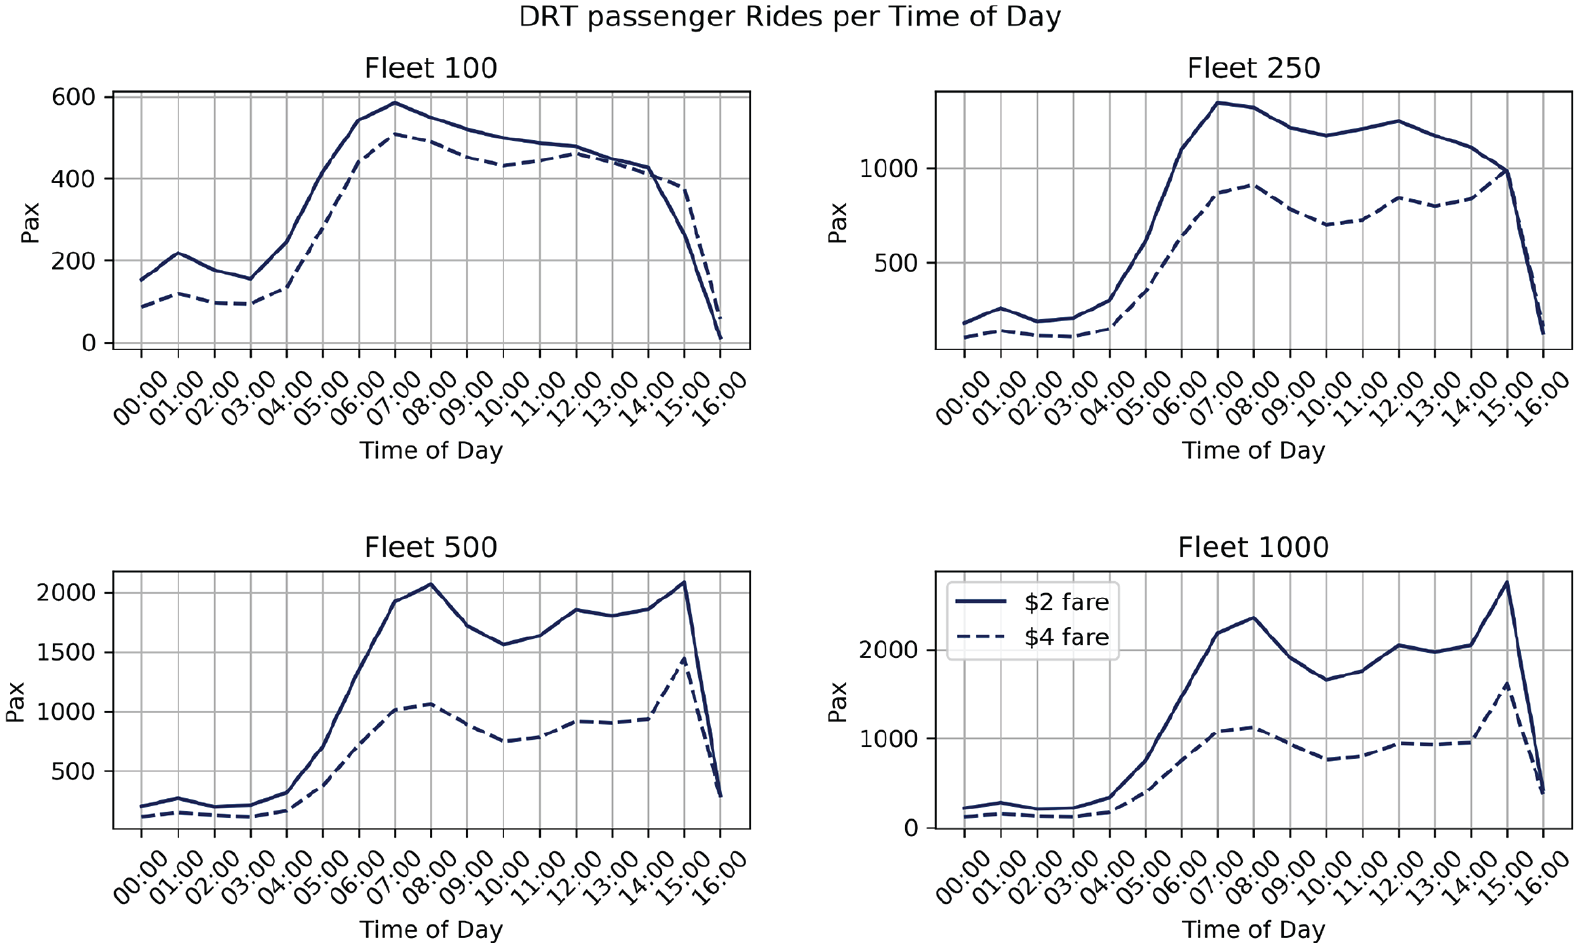
Passenger rides per time of day for different fleet sizes.
As shown in Figure 6, average wait time reduces as fleet size increases on average at [10, 8, 6, 5] minutes for the fleet sizes respectively. For all fleet sizes, high wait times are experienced in the morning peak period when there are more rejections. The fare policy does not have a significant effect on the wait time, but the wait time for the $4 fare scenario is slightly lower than the $2 fare scenario.
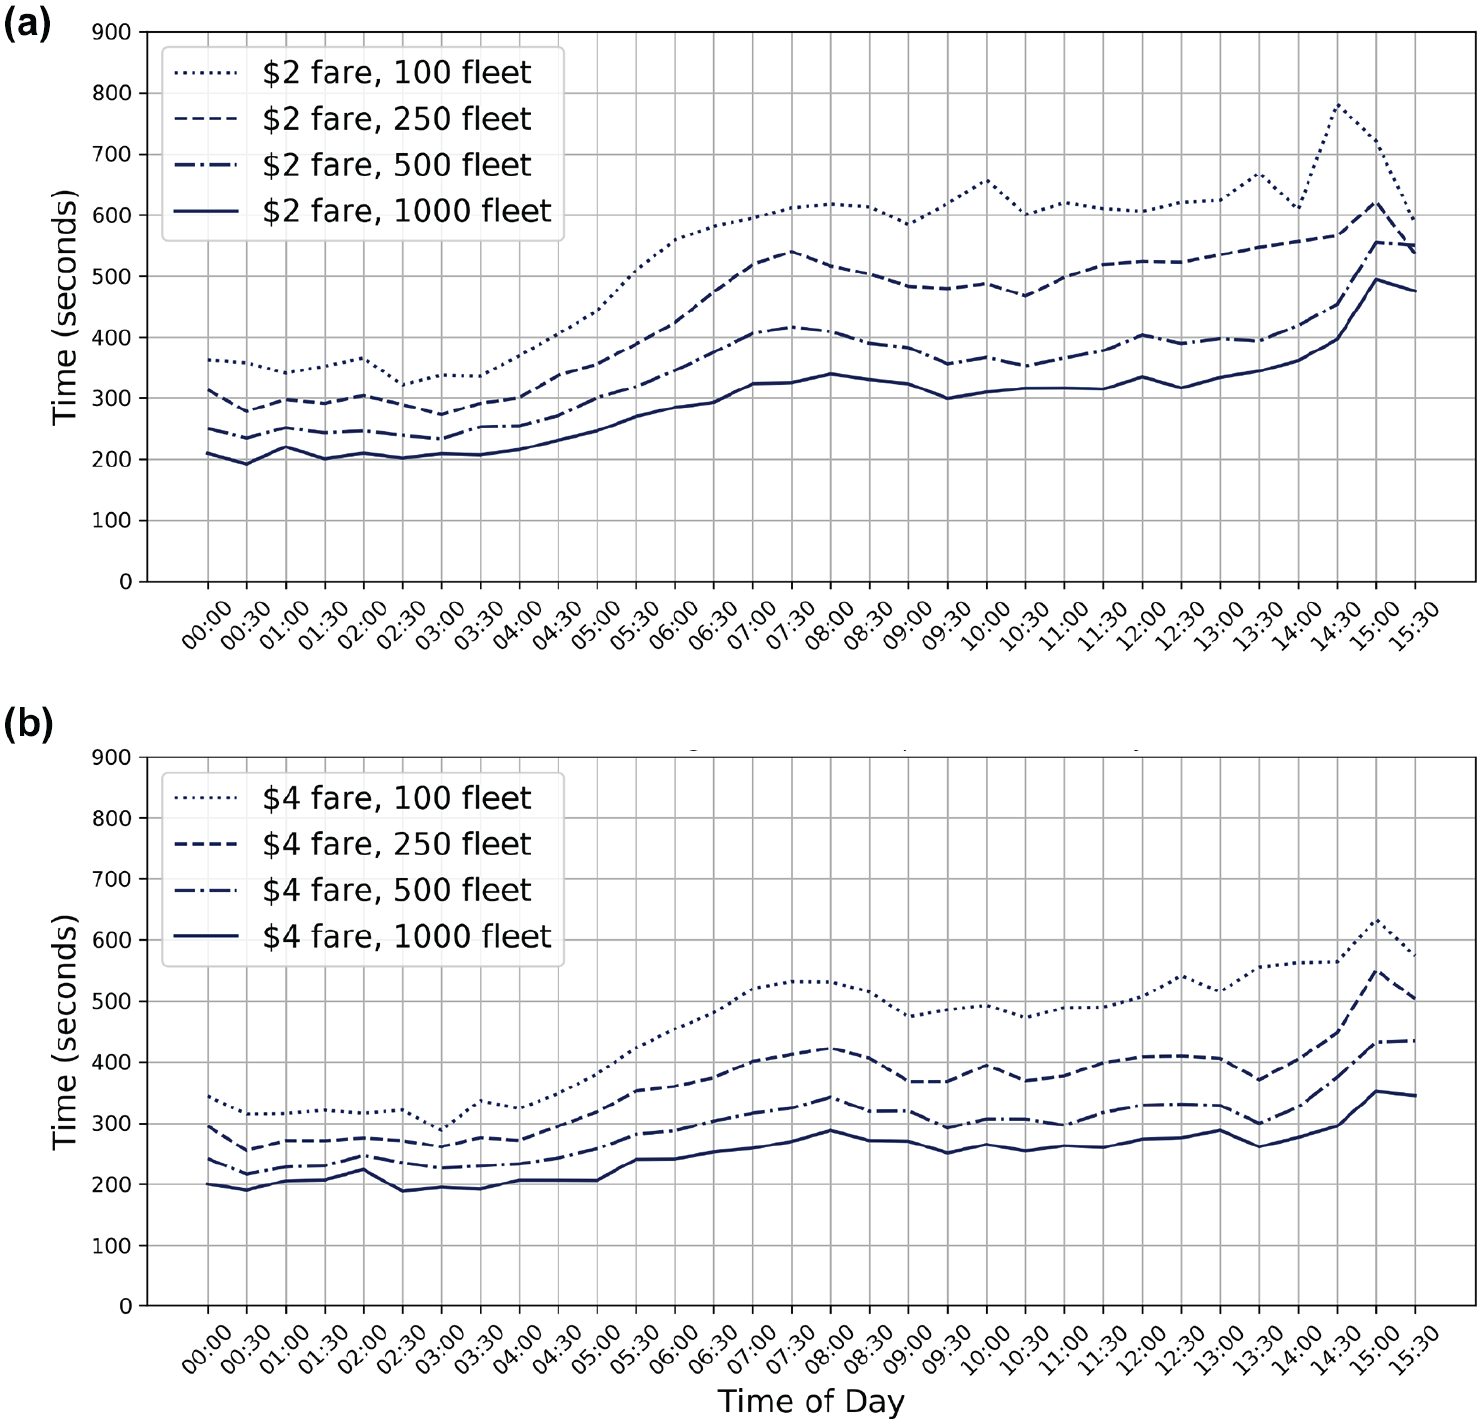
Average wait time per time of day for different fleet sizes: (a) $2 fare, (b) $4 fare.
Affordability
Figure 7 shows the distribution of DRT riders by income class at each fare level with share of public transit users that switched to DRT from the baseline scenario. The public transit fare is set at $2 while DRT fares tested are $2 and $4. Income classes of DRT users are similar to those of public transport riders regardless of the fare policy (INC1, INC2, and INC3 represent low, middle-low, and high-middle and high income earners, respectively). This shows that the DRT fare is relatively affordable for all income segments, which makes it suitable for improving everyone’s mobility.
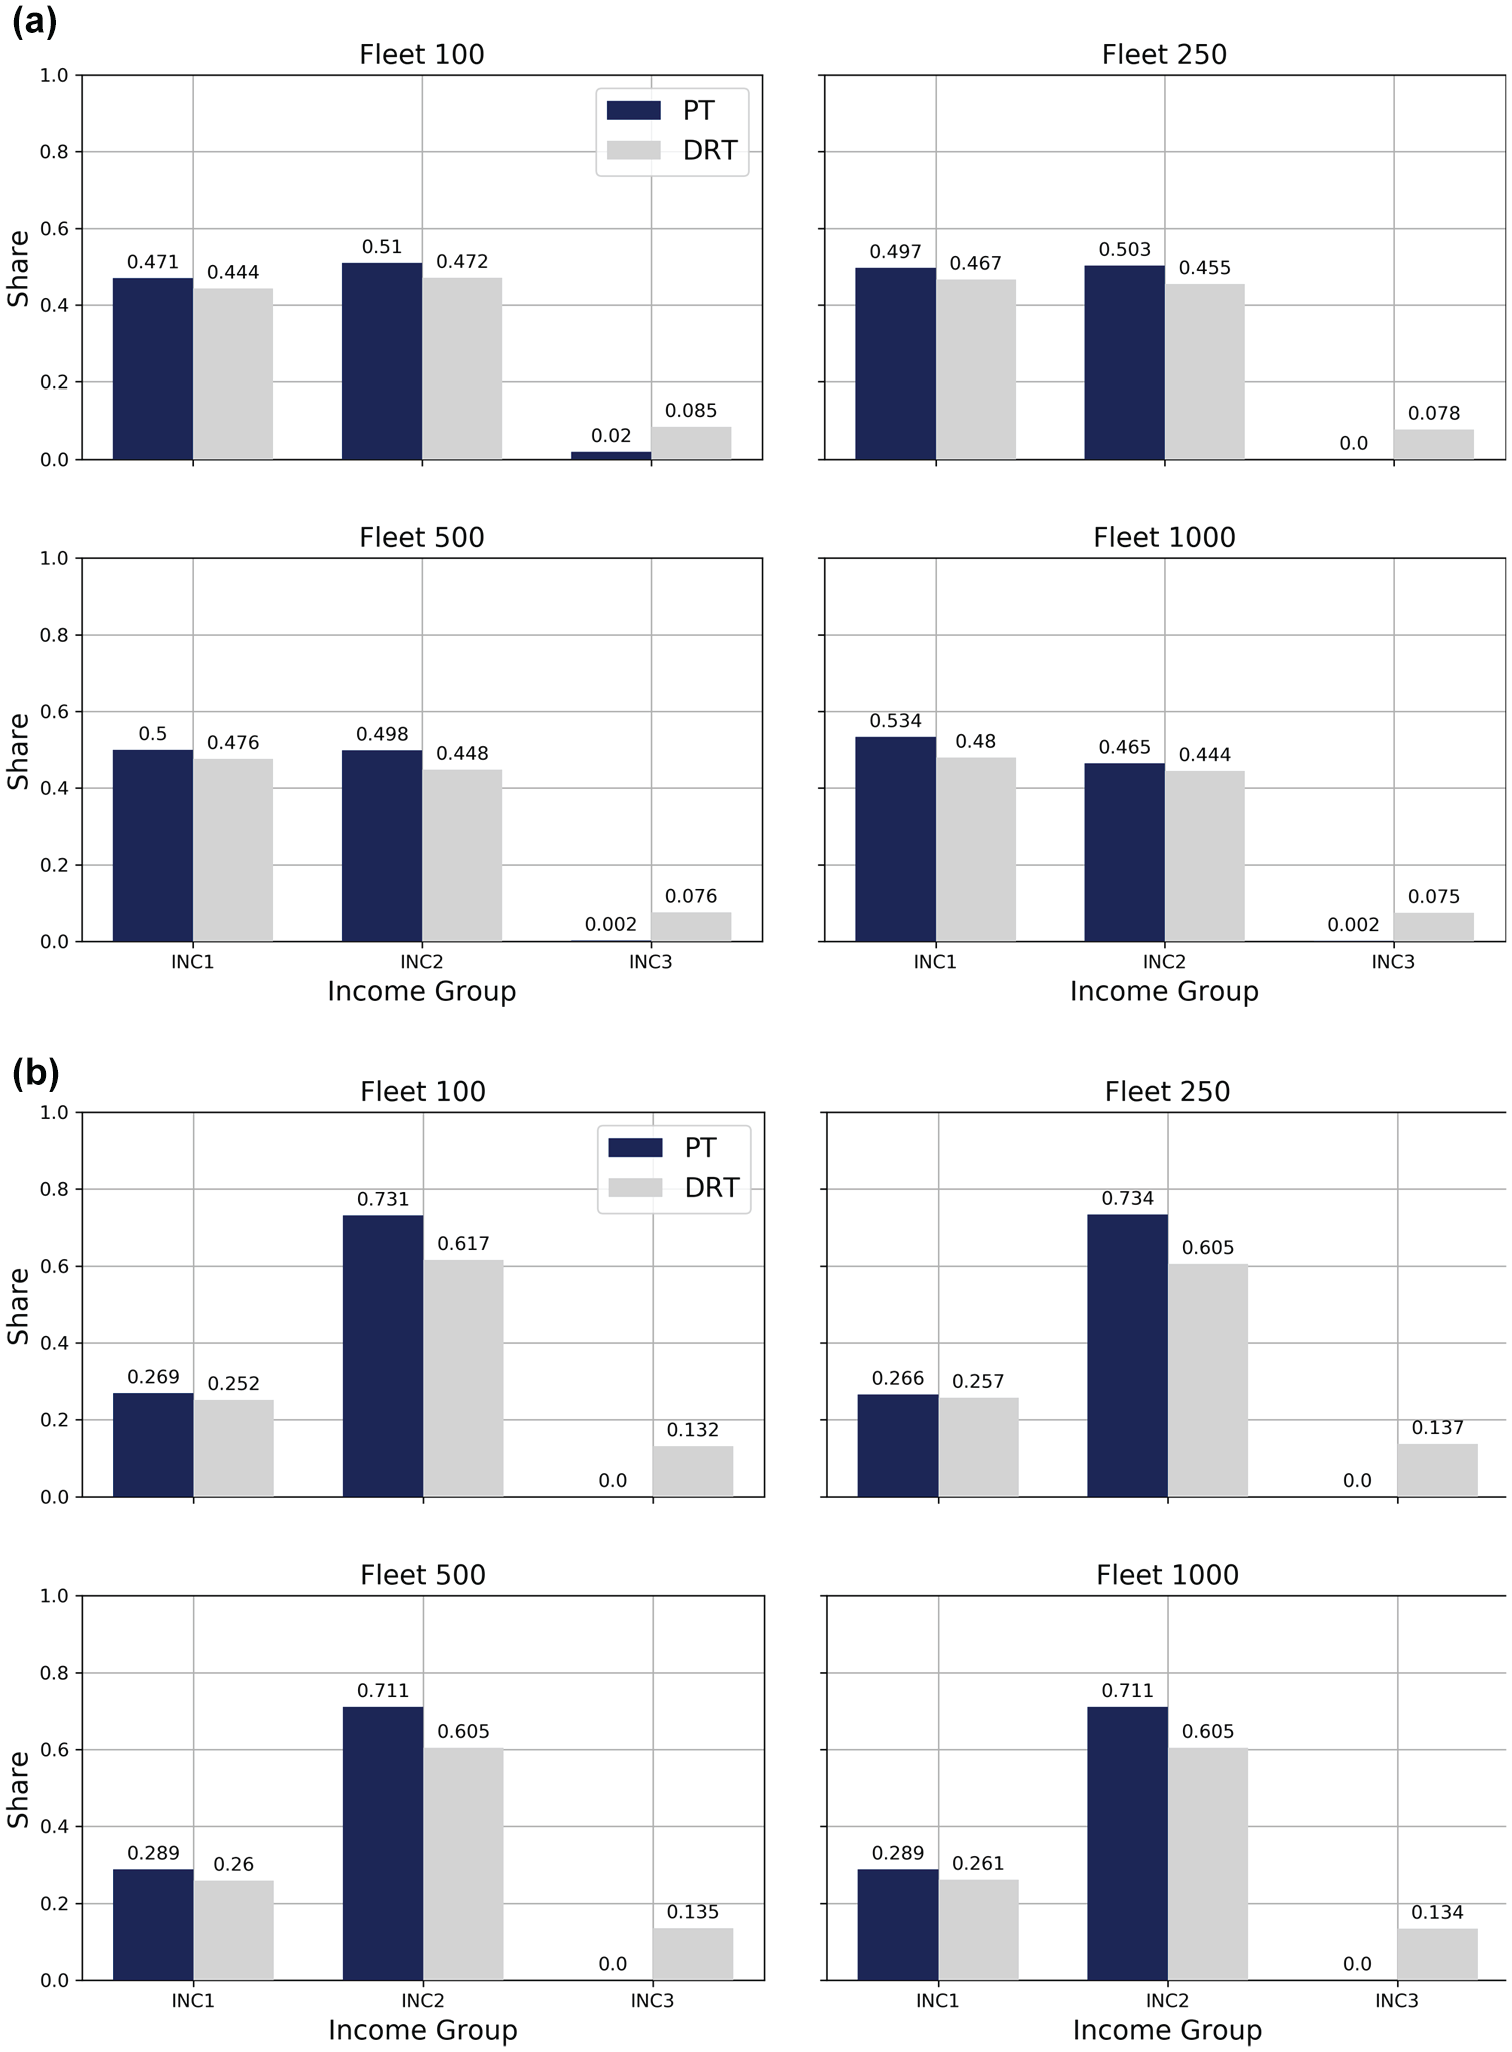
Share of income levels of demand responsive transit (DRT) users and public transit (PT) users for different fleet sizes: (a) $2 fare for PT and DRT and (b) $2 for PT and $4 for DRT.
System VKT Impact
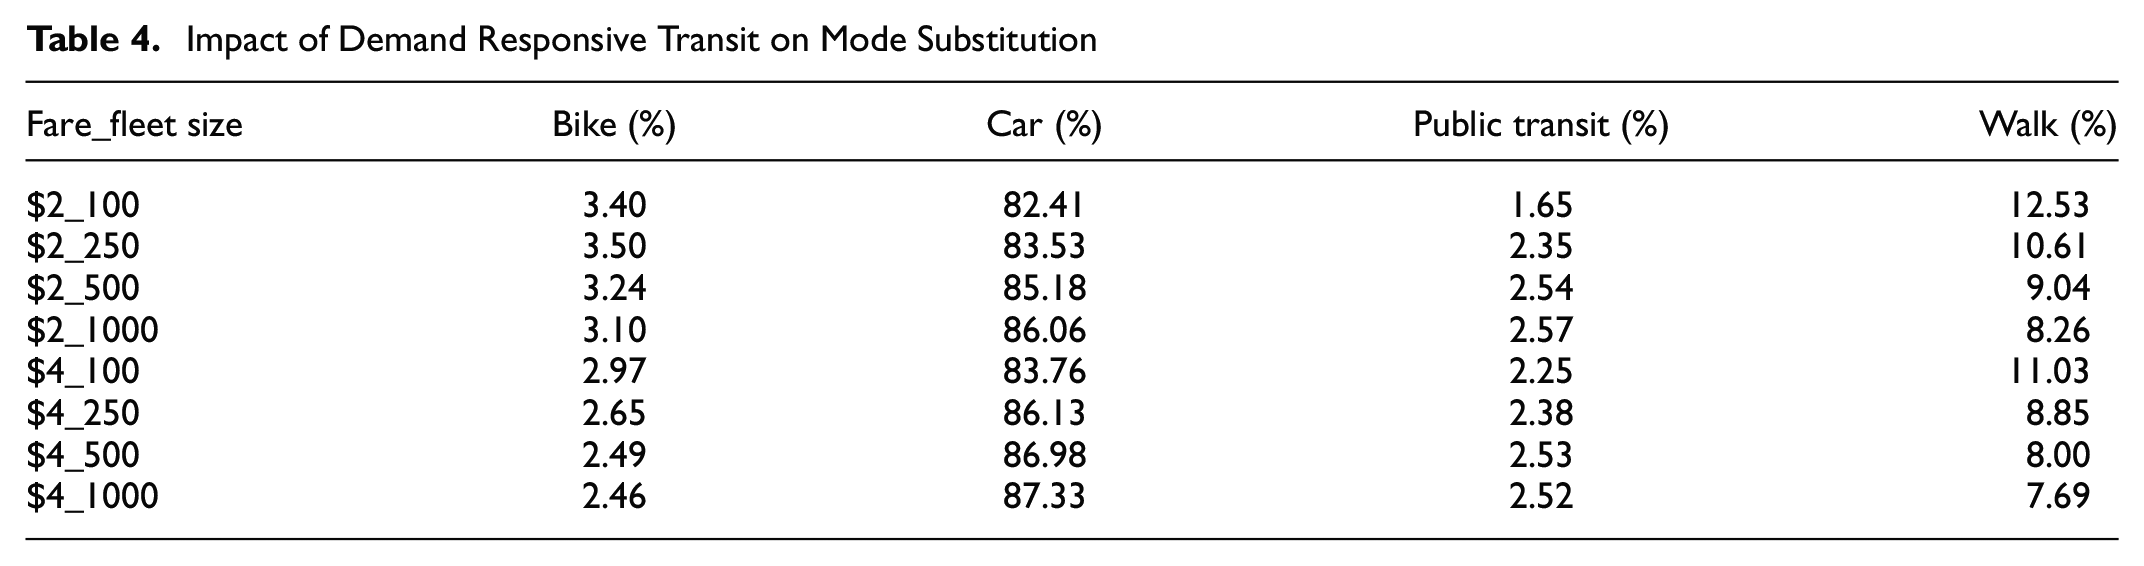
Private cars are dominant in Wayne County and contribute almost 80% of the mode share. An interesting question is how the addition of vehicles that drive almost all day would affect total VKT. To calculate this, all agents that used DRT are extracted from the baseline scenario, their share of mode replaced are compared, and the difference in VKT generated in the transport network is computed. This is summarized in Tables 4 and 5, showing: the share of replaced mode in the baseline scenario, the difference and percentage change in VKT between replaced modes from baseline scenario and DRT scenarios, and the difference in system-wide VKT between DRT scenarios and the baseline scenario.
Impact of Demand Responsive Transit on Mode Substitution
Impact of Demand Responsive Transit (DRT) on Vehicle Kilometers Traveled (VKT)
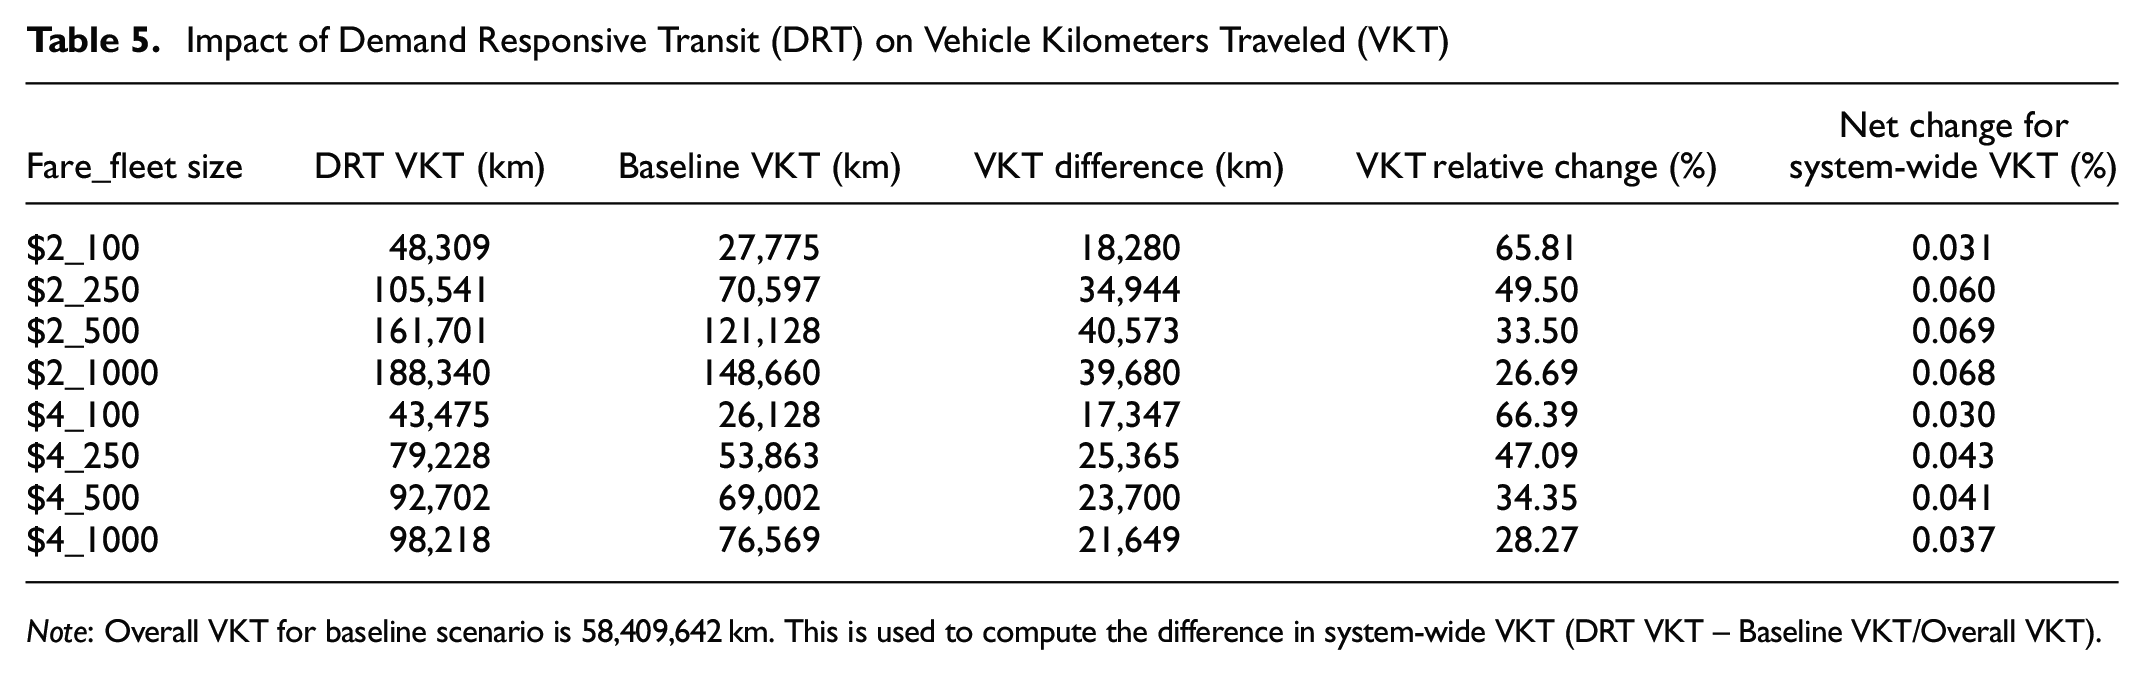
Note: Overall VKT for baseline scenario is 58,409,642 km. This is used to compute the difference in system-wide VKT (DRT VKT – Baseline VKT/Overall VKT).
Looking at the share of replaced modes, the DRT trips come mostly from car trips. Walk, public transit, and bike contribute only about 15% to the modes replaced by DRT trips. However, these agents have increased VKT in the transport system by switching to DRT. The VKT change depending on fleet size has the highest increase at 66% for fleet of 100 and the lowest at 27% for fleet of 1,000.
Nevertheless, the percentage change of VKT on a system-wide level is small. The highest across the different scenario is about 0.07%. Further optimization of fleet size, service parameters, as well as limiting the service area, should minimize and possibly have a positive impact on the system-wide VKT.
Simulation Runtime
The simulations were run on the ETH high performance computing cluster (Euler) with 12 cores and 144G memory. For the different scenarios the time varied in respect to the fare policy and also for vehicle seat capacity. The average run time was 43 h for all the scenarios. To reach the equilibrium 30 iterations were simulated, as at this point the individuals show no change in their mobility choices.
Discussion and Conclusion
This section summarizes some of the most important findings and presents potential improvements of the approach presented here to model a DRT service. The results show that, while the potential demand for DRT is high in Wayne County, it is challenging to serve the demand because of the large geographic size and low population density of the modeled area. While it is possible to serve a larger proportion of trips with a relatively larger fleet, this results in underutilization of the vehicles, as vehicles are unable to meet wait time and detour time constraints for picking up passengers. Based on the scenarios tested, there is low potential for ridesharing in a DRT service at the scale of Wayne County. Further analysis could test smaller service areas with higher population density which may have higher potential.
It was found that the net increase in VKT from the introduction of DRT vehicles is low, even with the largest fleet size tested. Note that the current model does not consider two or more people from the same household traveling together, so the results would tend to under-estimate vehicle occupancy as well as VKT. Note also that the simulation period ends by 4:00 p.m., so certain types of discretionary travel, such as dining out, often undertaken by multiple persons from the same household, are under-represented in the simulation. While average wait times for DRT increase with respect to demand, on average the wait times are reasonable even at the highest demand period modeled. It is also found that pricing DRT similar to transit results in greater mobility for lower-income travelers, and that pricing DRT at higher rates may substantially reduce demand.
Several possible further improvements of the methodology were identified based on the limitations of the study. The demand generated from the SEMCOG model is trip based. Therefore, the activity chains of individuals are not preserved. This is a limiting factor as certain constraints that tours impose are not captured. A possible way to overcome this limitation is to utilize an activity-based model, to generate full daily plans (i.e., ActivitySim) or other approaches used to generate mobility demand for MATSim ( 38 ). The mode choice parameters for DRT are not estimated based on empirical data. While, in the context of Wayne County, it is reasonable to adapt the parameters for public transport for DRT, it would be valuable to conduct a stated preference mode choice survey where DRT service is explicitly captured. Information on rejected agents in previous iterations is not used in the following iterations when agents make mode choice decisions. It would be interesting to capture this measure of reliability of the service in the mode choice model. How individuals value reliability and how it affects their choice set is however an open research question, and one worth investigating.
Based on the findings of the current study, for future scenarios, the authors may want to test different service parameters as well as rebalancing strategies. The DRT service in this paper covers the whole study region. Therefore, it is hard to meet pick-up constraints, as the service is spread thin within the region. Idle vehicles are unable to service requests that are too far away from where the vehicle is currently waiting. Using the spatial and temporal information on the demand in the whole region, it would be possible to optimize the service area to increase the share of pooled rides, and potentially to create a service that is able to reduce VKT in the region. To further optimize the DRT service, and to make the final judgment of its potential in the region, additional sensitivity tests are required. Those would include different cost structures, fleet sizes, and acceptable waiting and detour times. Currently the DRT service does not anticipate potential demand and does not perform preemptive relocations to serve the demand better. To overcome this limitation, different relocation policies could be implemented to analyze the potential improvements they could bring to the service.
In summary, there is potential for the DRT service to drive demand and be efficiently utilized. Presently the results show reasonable demand for the service, low empty distance, and that average VKT per vehicle lowers with increasing fleet sizes. However, there is still the need to optimize the DRT service parameters to maximize the efficiency of the system and improve ride sharing.
Footnotes
Acknowledgements
The authors would like to acknowledge Ford Motor Company for funding this research, Justin Culp (RSG) for contributions to network development, and Southeast Michigan Council of Governments (particularly Jilan Chen and Alex Bourgeau) for making the SEMCOG model and data available to the project team. The authors would also like to thank the two anonymous reviewers that took their time to give quality feedback.
Author Contributions
The authors confirm contribution to the paper as follows: study conception and design: G. O. Kagho, D. Hensle, M. Balac, J. Freedman, R. Twumasi-Boakye, A. Broaddus, J. Fishelson, K. W. Axhausen; data preparation: G. O. Kagho, D. Hensle, M. Balac, J. Freedman; analysis and interpretation of results: all authors; draft manuscript preparation: all authors. All authors reviewed the results and approved the final version of the manuscript.
Declaration of Conflicting Interests
The author(s) declared no potential conflicts of interest with respect to the research, authorship, and/or publication of this article.
Funding
The author(s) received no financial support for the research, authorship, and/or publication of this article.