
Abstract
Assessment methods are needed to rate the performances of advanced driver assistance systems in a range of real-world conditions, enabling the possibility of mandating minimum performance requirements beyond standardized, regulatory pass-or-fail tests, and ultimately ensuring a real and objectively measurable safety benefit. To bridge the gap between regulatory and real-world performance, this work presents a novel robustness assessment methodology and defines a robustness index determined from regulatory tests to analyze the real-world performance of lane departure warning (LDW) systems. In this context, a robust system means that it is insensitive to changes in driving conditions or environmental conditions. Distance to line (DTL) and time to line crossing (TTLC) were calculated for a light truck and a passenger car, and a black box model of the LDW systems was developed to predict their performance over different lane markings, drifting directions, and vehicle lateral and longitudinal speeds. During the test, neither of the vehicles triggered warning in around 10% of the trials despite the perfect condition of the markings painted on the proving ground. The type of lane marking significantly influenced DTL for both vehicles. For the light truck, the drifting direction, marking type, and their interaction were found to be statistically significant, which resulted in a lower robustness index than that of the passenger car. For both vehicles, TTLC was inversely proportional to the lateral speed, which greatly influences crash avoidance.
Lane departure represents a high-risk type of road crash. Kusano et al. ( 1 ) found that 44% of the total fatalities registered in the National Highway Traffic Safety Administration road crash databases from 2005 to 2011 occurred in crashes in which lane departure was a factor. Analyses of different databases indicate similar results for the U.S.A. by Penmetsa et al. ( 2 ) and for China by Tan et al. ( 3 ). For vehicles heavier than 3.5 tonnes, it was estimated that road departure accounts for 10% of crashes and correlates with 40% of serious or fatal injury cases ( 4 ). Lenné et al. ( 5 ) concluded that mostly human factors contribute to lane departure crashes, with drowsiness and fatigue in first place; other factors such as masking stimuli (85%), negative emotions (e.g., stress, 64%) and secondary activities (46%) are also significant ( 6 ). Gaspar et al. ( 7 ) and Dawson et al. ( 8 ) reported several technologies which can warn the driver in advance, such as camera-based eye tracking, steering wheel position monitoring, yaw rate monitoring, and vehicle lane position monitoring. So far, forward-facing-camera-based lane departure warning (LDW) systems have become widespread ( 9 ) and have been mandatory for new heavy-duty vehicles in the European Union since 2019.
To avoid such crashes, the LDW is triggered at a certain lateral distance between the lane marking the vehicle is approaching and its nearer front wheel. Typically, this distance is in a range from a few centimeters before the marking line (i.e., when the front wheel is still in the vehicle lane) to tens of centimeters beyond the marking line (i.e., when the front wheel has invaded the adjacent lane), depending on the vehicle make and model. Even though Kusano et al. ( 1 ) showed that time to lane crossing (TTLC) is a more important parameter than distance to line (DTL) to estimate the crash avoidance potential of LDW, current regulations (e.g., UNECE [ 10 ]) mandate a threshold on the latter. Therefore, commercial LDW systems are designed to detect a threshold DTL.
To the authors’ knowledge, no quantitative analyses of the influence of various factors on DTL and TTLC of a LDW system have been presented in the literature so far. These influencing factors may include the nature and geometry of the vehicle maneuver (e.g., the direction or speed of lane departure) as well as system-specific factors (e.g., the distance from the lane marking when a warning is triggered). The mutual interactions of multiple factors may also be relevant for calculating the robustness and efficacy of LDW systems.
Currently, type-approval tests and consumer assessment programs are typically based on testing protocols with fixed parameters and “pass-or-fail” thresholds. This raises concerns with safety systems and devices in that they may be developed strictly to satisfy the test criteria (e.g., passing certain standardized type-approval tests or assessment tests in a controlled environment) in force at the time they were marketed, whereas their performance in a real-world setting may be less satisfactory. In the interest of consumers and of road safety, it is important to assess the technical capability of those systems in real driving conditions to draw conclusions about real performance and robustness of these systems beyond the mandated regulatory tests performed on proving grounds.
This study shows the development of a methodology for assessing the robustness of LDW systems fitted on vehicles currently on the market. A special screening design is developed to minimize the measurement needs while maximizing the statistical significance of the measurement conditions. Robustness is measured by analysis of variance (ANOVA) with a model comprising both the main effects and the interactions between main effects. If a main effect (e.g., speed of lane change) or an interaction (e.g., direction and road marking) is found to be significant, then the system is considered to be less robust. If a system was designed with a primary focus on satisfying the legal requirements or assessment test criteria, that system might show significant correlations between its performance and a combination of parameters that differ from the values defined in the corresponding regulations or assessment protocols.
Beside camera-based solutions, other methods are emerging that show various levels of sensitivity and selectivity ( 11 , 12 ). Objective comparison and characterization of performance of the different systems is important for cost–benefit analysis, for simulation of crash avoidance, and for development of technology-agnostic regulations.
Literature Review
The performance of a LDW system can greatly influence its capability to reduce crashes. Penmetsa et al. ( 2 ) calculated that if the system effectiveness is 20% the number of crashes can be reduced by 16.4%; however, a 100% efficient LDW system can reduce crashes by 66.5%, which is in agreement with the results of Kusano et al. ( 1 ). Indeed, based on crash data from 25 U.S. states between 2009 and 2015, Cicchino ( 13 ) found 11% and 21% reduction in overall crashes and in crashes with injuries, respectively. This relatively modest reduction in crashes may imply that the effectiveness of LDW is closer to 20%, so there is plenty of potential for further improvement. Hickman et al. ( 14 ) found for large trucks that LDW reduced lane departure type crashes by 48%, which is better than the efficacy for passenger cars mentioned above, although this estimated efficacy was not corrected by demographic factors (e.g. age) as in the passenger car analyses.
Although the effectiveness of a LDW system is key for its contribution to traffic safety, no comprehensive definition and no experimental methodology are agreed to assess it. The availability of the system in the vehicle is frequently defined as the condition in which the system is active (i.e., not disengaged). This condition occurs when the driver enables the system and the lane markings are recognized within the operational design domain (ODD); in this state, the system monitors the lane markings and is ready to trigger a warning in case of lane departure. It was reported in Gordon et al. ( 15 ), Bruce et al. ( 16 ), and Flannagan et al. ( 17 ) that LDW systems are available in 90% and 20% of driving time in daylight and night-time conditions, respectively, but an availability of only 36% of driving time was detected on non-freeway types of road. Furthermore, there are system design constraints, such as the operating speed range, which may affect the availability. Minimum operating speed was found to be important; however, the maximum operating speed shows a limited impact on the availability of LDW ( 18 ).
Regulations and Standards
At present, LDW systems are mandatory on heavy-duty vehicles of categories M2, M3, N2, and N3 under Regulation 130 of the United Nations Economic Council for Europe (UNECE) ( 10 ) in the UNECE WP29 participating countries. The type-approval procedure for LDW systems includes the driving tests briefly described as follows. Paragraph 2.5.1. of UNECE Regulation 130 requires the test driver to:
drive the vehicle under test (VUT) at a speed of
maintaining the prescribed speed, gently drift the VUT, either to the left or to the right, at a rate of departure between 0.1 and 0.8 m/s so that the vehicle crosses the lane marking;
repeat the test at a different rate of departure within the range 0.1–0.8 m/s;
repeat the above tests drifting in the opposite direction.
The lane marking can be freely chosen from different markings listed in the Regulation. The pass criterion is defined in paragraph 2.5.2 of the UNECE Regulation 130 as follows: the LDW system shall provide the LDW indication at the latest when the outside of the tire of the vehicle’s front wheel closest to the lane markings crosses a line 0.3 m beyond the outside edge of the visible lane marking to which the vehicle is being drifted.
While there is no legal obligation for LDW systems on light-duty vehicles at present, the European New Vehicle Assessment Programme (EuroNCAP) has included LDW tests since 2015 (
19
). The tests are executed at a constant longitudinal speed of
Design of the Test Campaigns
Two test campaigns were performed on two vehicles equipped with a LDW system: an N2 category vehicle (large van up to 8 t) and an M1 category passenger car. The following sections describe the details of each test campaign.
N2 Vehicle
This campaign featured an N2 category vehicle (large van between 3.5 and 8 t) type approved in 2019, and thus subject to the UNECE Regulation 130 ( 10 ). The vehicle was driven on the IDIADA proving ground in Santa Oliva, Spain, in daytime. The test matrix was randomized to minimize varying illumination and other systematic effects.
A test matrix was designed with 49 test runs (including repetitions of failed warnings) comprising numerous test scenarios with the following varying parameters:
Speed of lane change. A driving robot was used and different objective lateral speeds were defined in the test matrix of 0.2, 0.4, and 0.8 m/s;
Direction of lane departure: drifting toward the left side or toward the right side;
Road layout and lane marking type. The following road markings were tested (Figure 1) based on UNECE Regulation 130 (
10
): - straight road with dashed line; - straight road with solid line; - straight road with double dashed-solid line.
Further layouts were tested experimentally and evaluated only qualitatively for reasons that will be explained in the Results section below:
- curved road with dashed line;
- straight road with diagonal diverging line;
- curved road with diverging lane from the right.
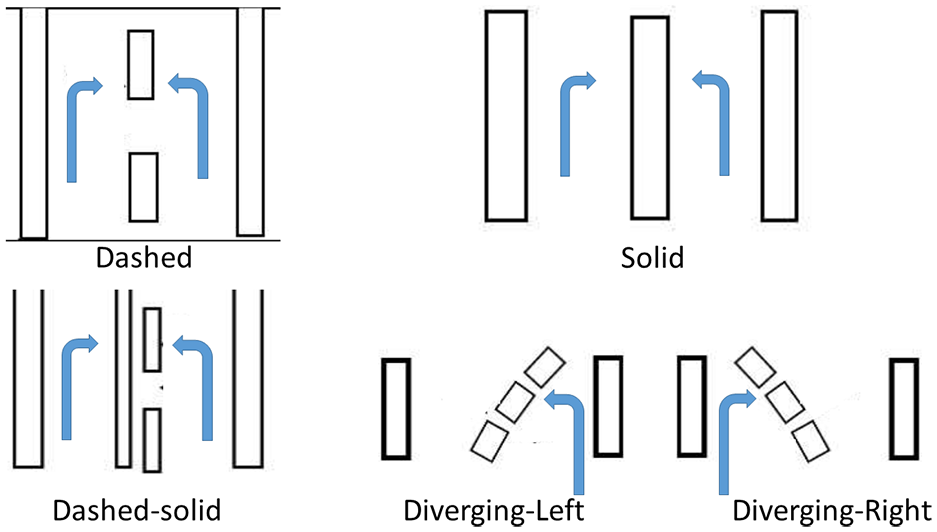
Tested marking types for N2 vehicle with the drifting directions.
The test matrix was designed by considering the main effects and their second-order interaction by using the principles of D-optimal design of experiment, i.e., minimizing the error of the predictors ( 20 , 21 ). A randomized test sequence was generated using JMP statistical software (U.S.A.).
The vehicle was equipped with an AB Dynamics (United Kingdom) driving robot featuring a steering wheel motor controller for direction control and an accelerator pedal motor controlled for speed control; a dbBrake modular data acquisition system based on National Instruments (U.S.A.) components controlled by a personal computer; an OxTS RT 3002 (United Kingdom) differential GPS system with integrated inertial platform to record the absolute position, speed, and angular orientation of the vehicle; and an OxTS RT Range WiFi 802.11a based Vehicle-to-Vehicle (V2V) communication system with a service vehicle for high-precision (
M1 Vehicle
Another testing campaign involved a M1 category passenger car. This vehicle was not subject to any regulation, but the LDW system had been evaluated by EuroNCAP in its assessment of the vehicle. The vehicle was driven on the IDIADA proving ground in Santa Oliva, Spain, in daytime. The test matrix was randomized to minimize varying illumination and other systematic effects.
The test matrix for this vehicle featured 24 tests with a combination of the following parameters:
Speed of lane change. With this vehicle, a human driver performed the test; this was decided for more realism and to investigate if the human variability in performing the maneuver correlates with effectiveness of LDW. The driver was instructed to perform a subjectively soft or aggressive lane departure. No objective lateral speed was given to avoid distracting the driver and to keep the maneuver as natural as possible. Lateral speed was determined at the time of warning;
Direction of lane departure toward the left side or toward the right side;
Road layout and lane marking type. The lane marking types from the EuroNCAP testing protocol were tested with this vehicle (Figure 2);
straight road with dashed line on the drifting side and no line on the other side (road edge);
straight road with dashed line on the drifting side and solid line on the other side;
straight road with solid line on the drifting side and no line on the other side (road edge);
straight road with solid line on the drifting side and dashed line on the other side;
straight road with a road edge (no marking) on the drifting side and no marking on the other side;
straight road with a road edge (no marking) on the drifting side and dashed line on the other side.
Two further scenarios were also included in the experiment for a qualitative analysis:
- curved road with a large radius with dashed line to the drifting side and solid line on the other side;
- curved road with a small radius with dashed line to the drifting side and solid line on the other side.
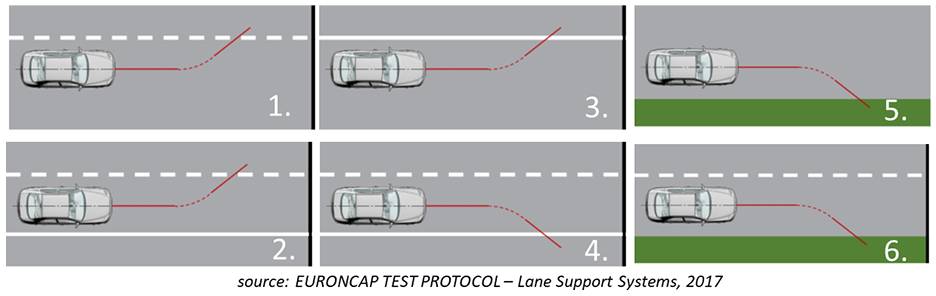
Tested marking types for M1 vehicle.
The vehicle was fitted with the same measuring equipment as the N2 vehicle. In addition, a microphone was fitted near the dashboard to record acoustic LDW warnings.
The vehicle speed was not considered significant in the range 60–80 km/h based on previous experience and data from the literature ( 1 ); moreover, speeds near to the upper limit of this range were not allowed in the curved road scenarios for safety reasons. Therefore, the speed was kept constant at approximately 65 km/h in all scenarios.
Results
This section presents the results of the LDW tests that were carried out with the two vehicles. The raw data were pre-processed with Python scripts.
N2 Vehicle
Table 1 summarizes the test matrix and the warnings detected during the tests of the N2 vehicle with solid, dashed, dashed-solid, and diverging markings, as they are mandated by the UNECE Regulation 130. Note that while the UNECE Regulation 130 lists the diagram of the diverging line among the lane marking types that may be tested, it does not specify the approaching direction or other details. In this test campaign, the diverging lane was approached from the lane that was about to end toward the through lane, as shown in Figure 1. Additionally, although not required by the regulation, curved roads with dashed lines were also tested.
Summary Results of the Lane Detection Warning Tests of the N2 Vehicle
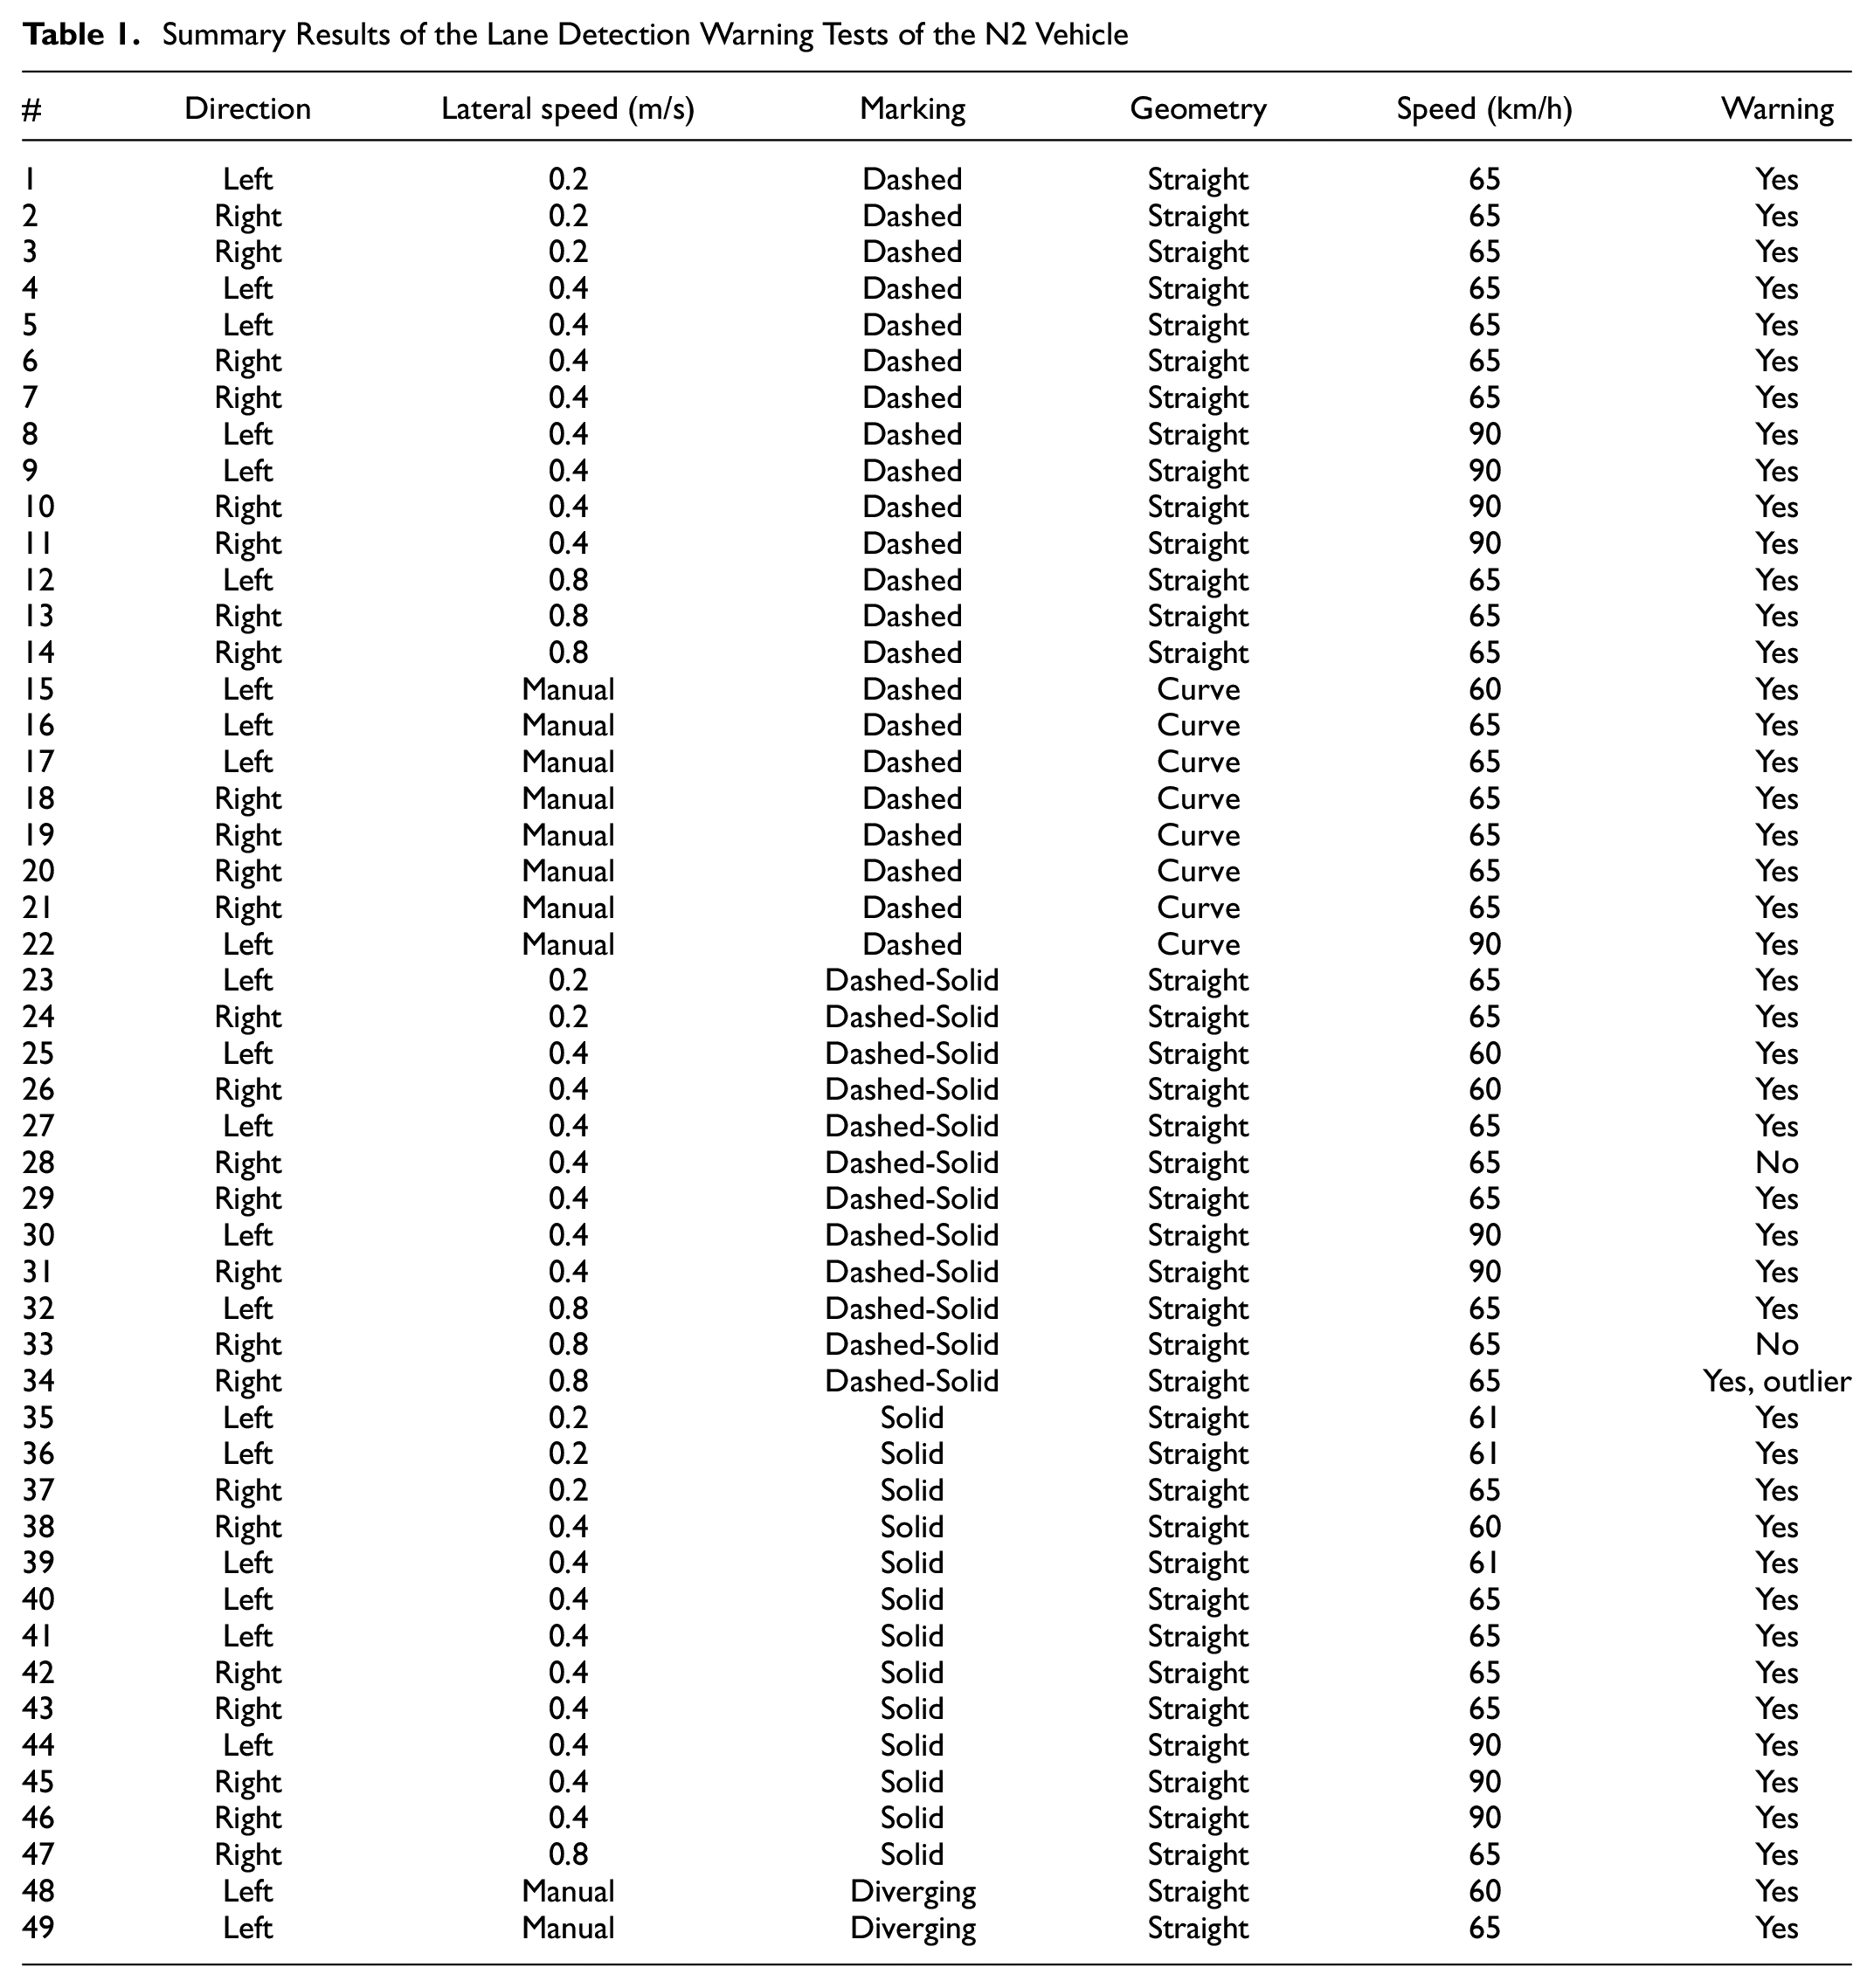
Missed warnings occurred in two test runs. In test run #28 there was no obvious external reason (e.g., unexpected maneuver) which would explain the missed warning. The warning was correctly given in the repetition of this test (test run #29). In test run #33, a warning was triggered in the initial part of the road before the testing section; the warning was cleared before the testing section was reached, but an interaction with the previous detection cannot be excluded. Repeating the test on the same road triggered the warning correctly.
Two test scenarios were performed using the diverging line marking. Even though the design of the diverging lane is regulated in UNECE Regulation 130, the vehicle trajectory and drifting may be interpreted in different ways. The first one featured a straight lane cut by a diagonal dashed line (Figure 1). The second one featured a merging lane from the right, separated by a longitudinal dashed line similar to a merging lane into a freeway. The first scenario was driven with a driving robot. When the truck was driving straight toward the diverging lane, the lateral speed range (0.2–0.8 m/s) was impossible to respect and warnings were triggered sporadically (not listed in Table 1, because of off-regulation conditions). In the second scenario, the steering robot could not be used and the vehicle was driven manually, following the curve but drifting slightly toward the dashed line of the merging lane. In this case, the warning was triggered (#48 and #49 in Table 1). It may be argued, however, that moving over from the merging lane toward the through lane is the expected maneuver, so a warning may be unnecessary. This warning was not considered to have failed because it is unclear from the regulation how to interpret the test results and in which scenario the LDW system is supposed to intervene.
A warning was always triggered for the curved lane in the tested scenarios. However, further clarification would also be recommended for future regulation or standards on how to interpret the drifting speed and its values. Beside drifting scenarios, other avoidable scenarios may need to be taken into account. For instance, when a vehicle approaches a curved road section from a straight section and the driver does not react, the lateral speed can be higher than the 0.8 m/s currently required as maximum and should depend on the speed of the vehicle and the radius of the curved road.
Because of these interpretation issues, the curved and the diverging lane scenarios were excluded from the further quantitative evaluation. Furthermore, tests with missed or incorrect warnings were also excluded.
M1 Vehicle
In the absence of LDW regulation for M1 vehicles, the definition of the lane markings is taken from the specification of the EuroNCAP Test Protocol – Lane Support Systems ( 19 ). Additionally, the vehicle was tested on a curved road with dashed marking. The qualitative results and the testing conditions are summarized in Table 2 for the dashed, solid, full solid, and full dashed marking EuroNCAP scenarios, and in Table 3 for the additional road edge and curved road scenarios.
Test Matrix and Summary Results of the Lane Detection Warning Tests of the M1 Vehicle
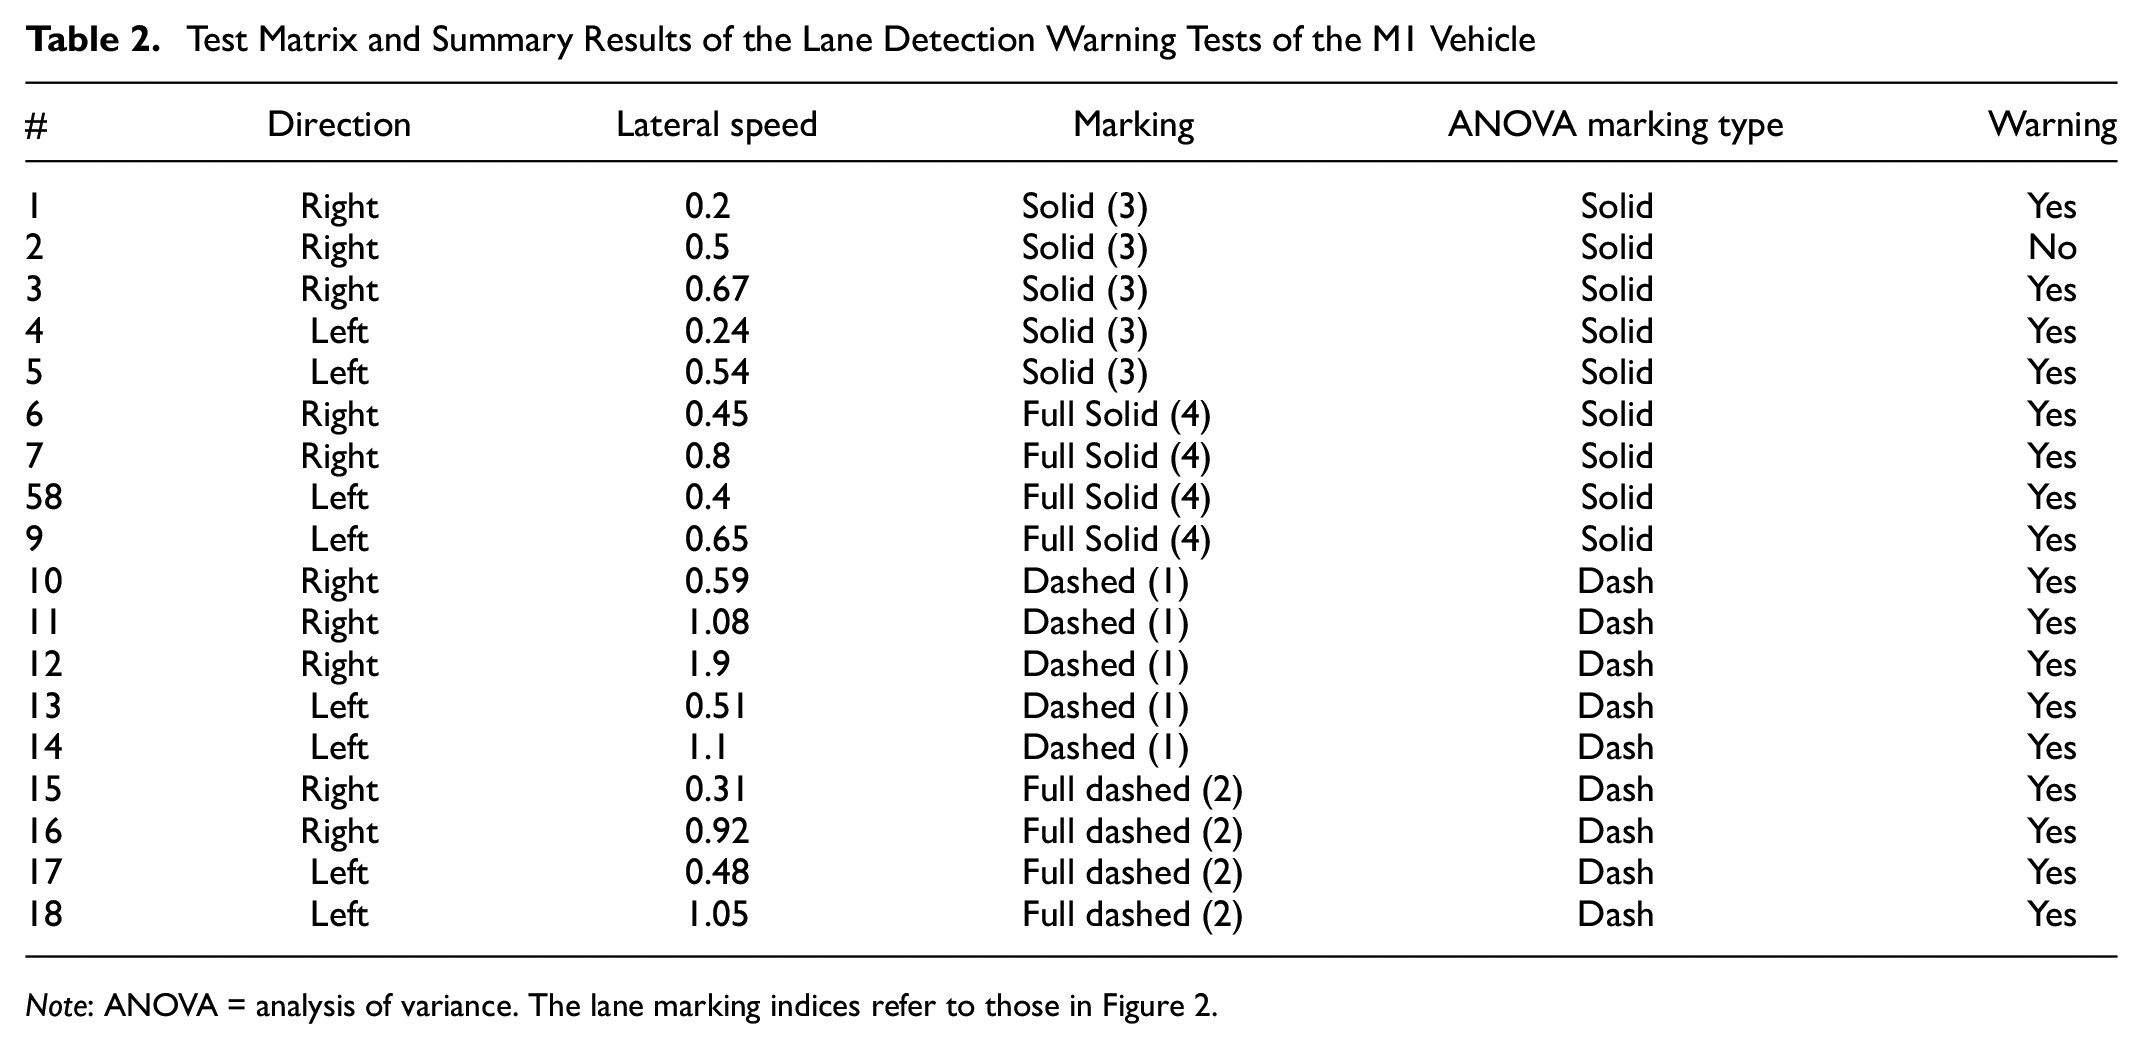
Note: ANOVA = analysis of variance. The lane marking indices refer to those in Figure 2.
Test Matrix and Summary Results of the Additional Lane Detection Warning Tests of the M1 Vehicle
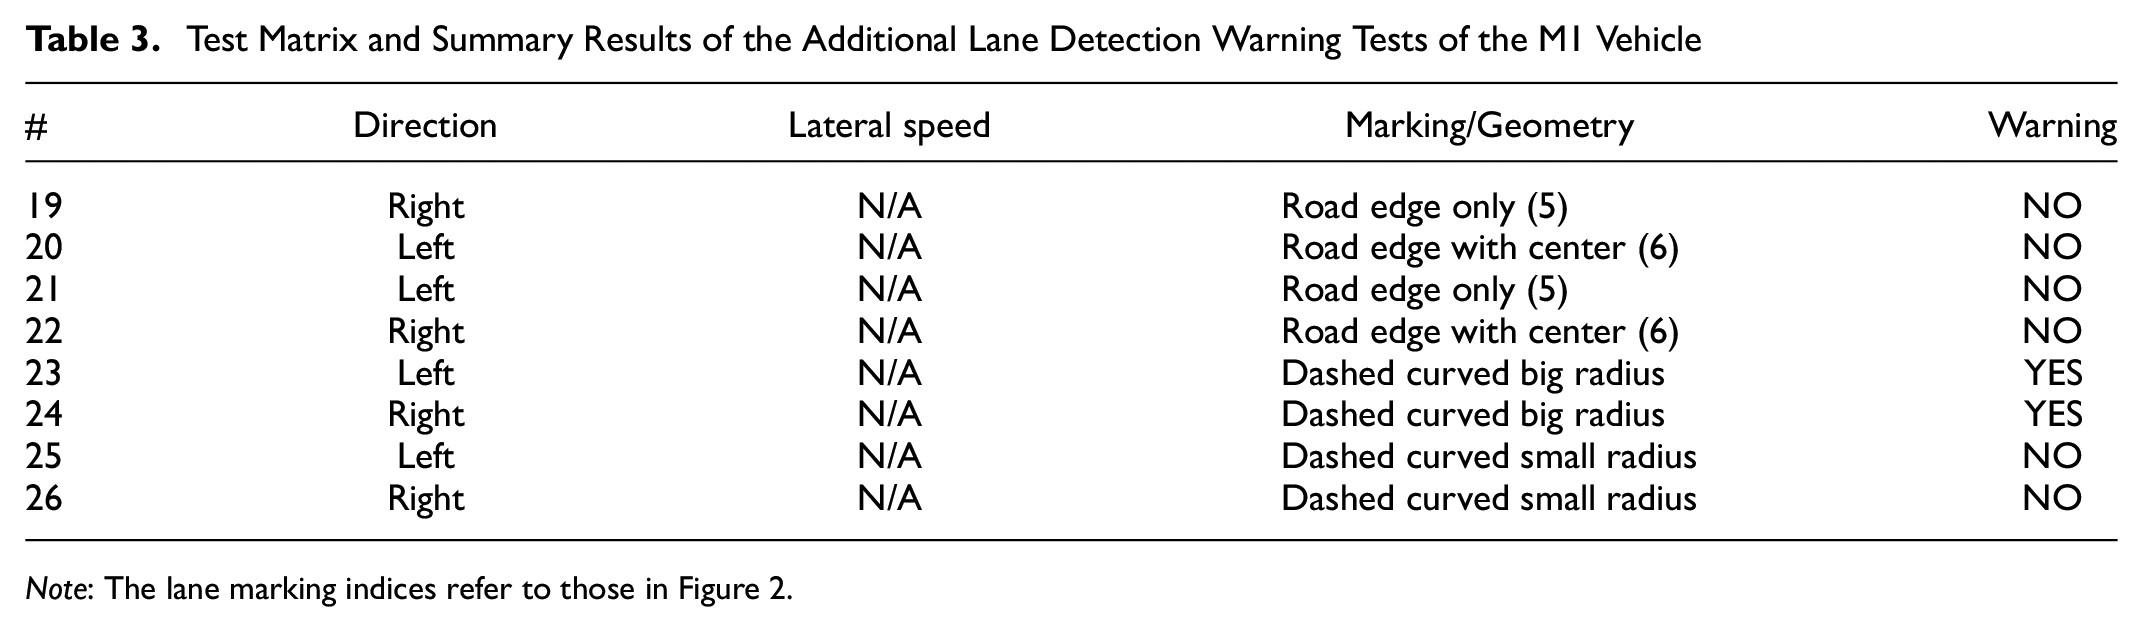
Note: The lane marking indices refer to those in Figure 2.
In one case, the LDW system lost the recognition of lane marking, therefore there was no warning. This case is shown in Figure 3. The LDW system failed to trigger a warning in the first attempt; the part of the dashboard image with red dashed circle (Figure 3e) shows that the lane was not recognized despite the lane markings being visible. However, in the second attempt during the same run (5 s after the first) at the same road segment, the LDW system recognized the road markings (Figure 3f) and triggered the warning correctly. The reason for the loss of recognition could not be identified; there is no visible difference between the two road segments, as Figure 3, e–f , show. Also, other parameters, such as lateral speed, are the same or similar. Therefore, the failure was attributed to a software reliability issue.
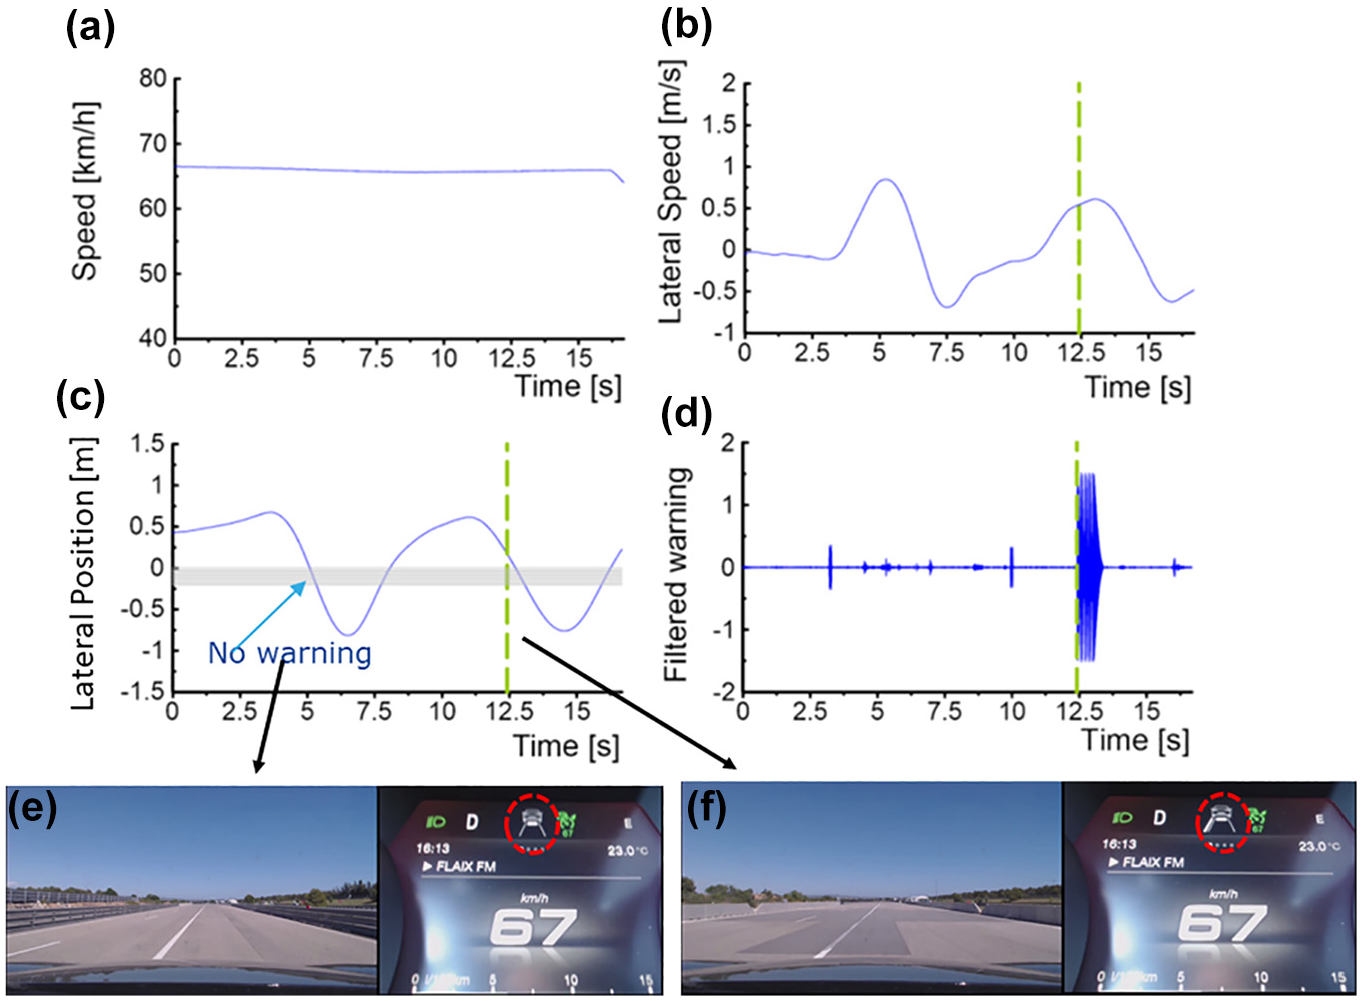
A test run with the M1 vehicle drifting to the left toward a solid line. Kinematics of the vehicle during the test (a-c); acoustic warning signal intensity in arbitrary unit (d); pictures of the road segment at failed warning (e) and at correctly triggered warning (f).
The system did not recognize the road edge without road signs. In the small radius test, the speed had to be reduced below 60 km/h to negotiate the curve safely, therefore the system disengaged.
Analysis and Discussion
Quantitative analysis of the results was performed to detect any statistical correlations between the test parameters and the reaction of the LDW system. In this section, first, the black box model of the LDW and the parameter extraction process is presented, then the model fitting and analysis that was performed using model fitting and ANOVA analysis modules of the JMP statistical software.
Model Development
The quantitative analysis is based on the evaluation of the parameters extracted from the kinematics, positioning, and audio-visual data of LDW tests. Using the example of test #37 illustrated in Figure 4, the following kinematic quantities were used for each test:
Determination of warning time as the moment when the vibration reached the threshold acceleration (Figure 4a) referred to the gravitational constant g. Further details can be found in the Appendix;
DTL: actual distance of the tire from the outside edge of the lane marking (Figure 4d);
TTLC or time from line crossing: actual elapsed time (Figure 4e) between warning and lane crossing (the outside edge of lane marking), or actual elapsed time from the lane crossing (the outside edge of lane marking) until warning (if warning happens beyond the lane);
Figure 4, b , c , f , are used to verify the requirements of the regulation or standard.
Both parameters were analyzed by ANOVA to check the robustness of the LDW system on the following factors:
Direction
Lateral speed
Marking type and
Vehicle speed
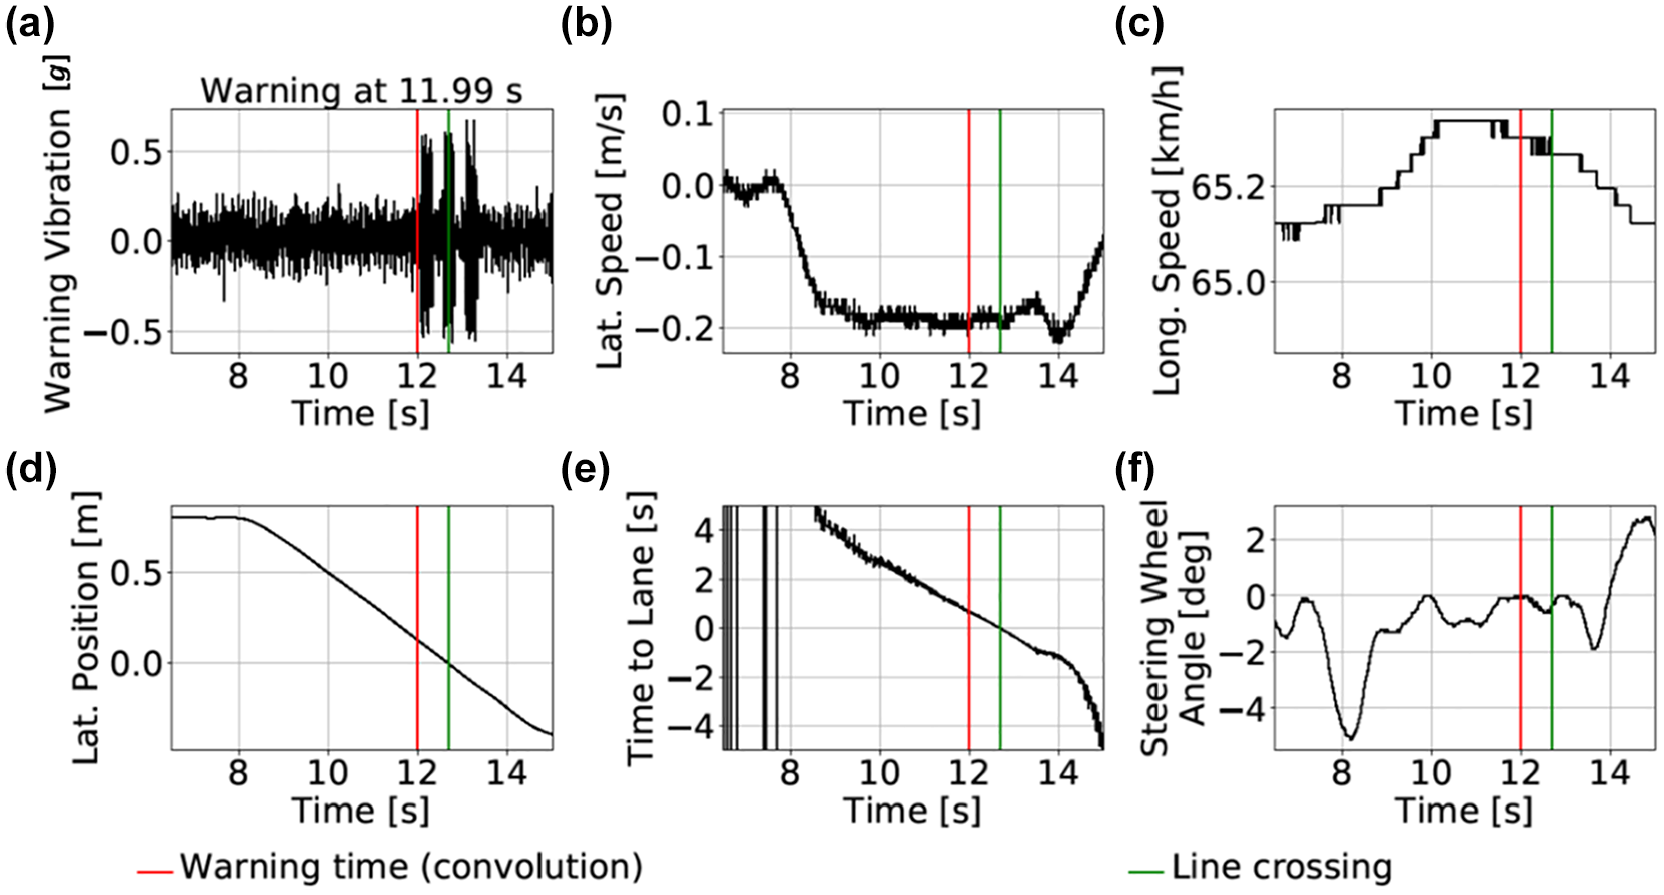
Example of kinematic quantities recorded for each test run. The plots show test run #37 from Table 1 at 65 km/h speed with 0.2 m/s lateral drifting to the right toward a solid line marking. Intensity of the haptic warning relative to the gravitational constant g (a); kinematics of the vehicle during the test (b-f).
As a first step, a screening analysis was performed using optimal design of experiment (Table 1) and statistical significance tests (
22
). Since the correlation of the vehicle speed with DTL and TTLC did not reach the 5% significance level, it was excluded from the further analysis. For a detailed analysis, the following simple model has been developed based on the working principle of the LDW system, which features regular verification that the recognized marking lines and the vehicle position do not pass a threshold. This threshold is typically determined by DTL or TTLC, which are correlated with the lateral speed of the vehicle,

If there is no dependence on the lateral speed, then
If
N2 Vehicle
The significance levels of the model parameters were tested by ANOVA and are summarized in Table 4. In this table, the importance is the maximum of the scaled estimate and shows the extent of the contribution of each factor to the output; the p-value is the probability that the observed variability is random. For both DTL and TTLC, the type of lane marking and its interaction with the drifting direction were found to be significant, which means that the LDW warning was triggered at a significantly different distance and time depending on the lane marking and certain combinations of marking and direction. The effect of lateral speed is at the borderline of the 1% significance level for the DTL and its influence on DTL is the lowest among all other parameters. Taking the lateral speed out from the model only reduces the adjusted
Summary of Analysis of Variance (ANOVA) of Lane Departure Warning Test Results for the N2 Vehicle
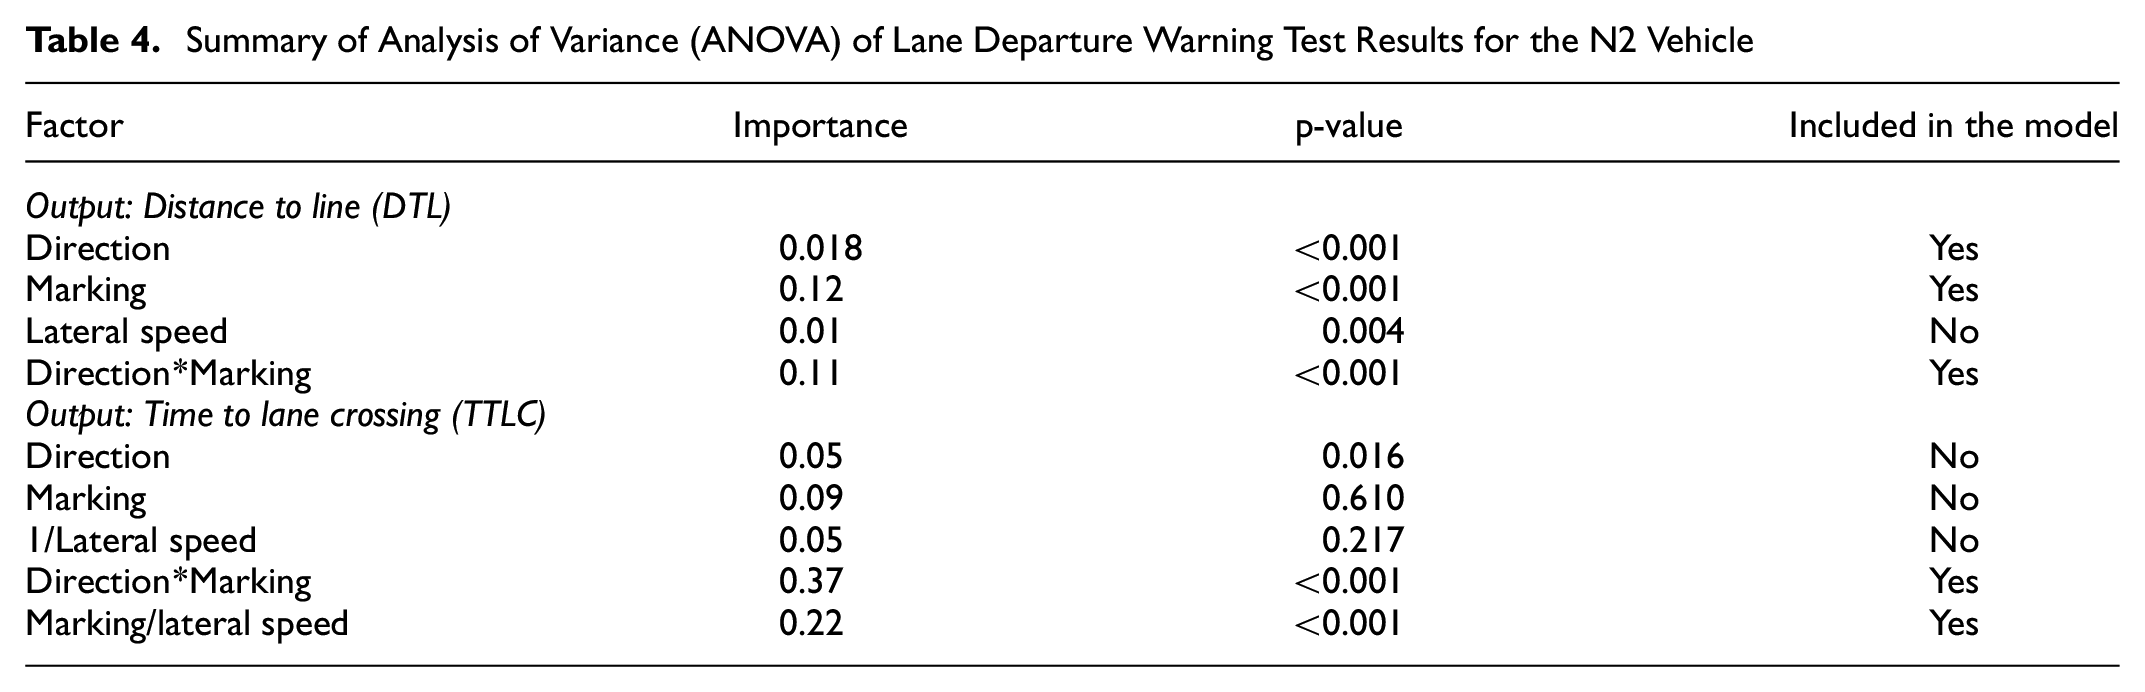
Test run #33 was identified as an outlier because the warning was triggered more than 30 cm away from the group average of tests of dashed-solid lines in the right drifting direction. Therefore, it was also excluded from the quantitative analysis. It must be mentioned that the analysis of the data including the test run #33 does not change the models, but it only adds to the error of the quantitative analysis.
Figure 5 depicts the predicted average DTL with the confidence bands for the investigated markings and maneuvers. The vertical axis shows the DTL, when the warning is triggered while still in the lane, and distance from the line (with a negative sign), when the warning is triggered after passing the marking line. The solid black horizontal line at 0 m is the position of the outside edge of the lane marking and the dashed horizontal line at −0.3 m is the threshold of UNECE Regulation 130. It is clear from the diagram that, for solid and dashed lines, the warning was triggered 10 cm closer to the line during the drifting to the right than to the left. Another important observation is that the warning was triggered earlier for solid lines than for dashed lines by almost 10 cm in both drifting directions. The difference in the behavior between the two drifting directions toward the dashed-solid type of line is even more striking. When the vehicle approaches the dashed-solid line from the solid side while drifting to the right, the LDW is triggered at the latest almost 35 cm further to the other lane than with the solid-only lane marking. However, when drifting to the left and approaching the line from the dashed part, the detection is similar to the solid-only line detection. Although the warning was triggered for dashed line in the left maneuver and for the dashed-solid line in the right maneuver beyond the line (negative DTL values), they are all within the permitted tolerance of the the UNECE Regulation 130 (maximum 0.3 m beyond the lane).
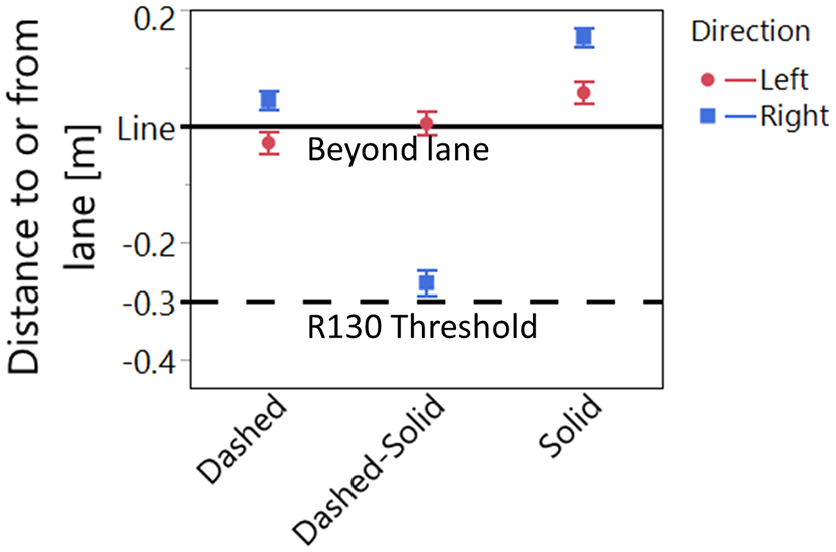
Distance to/from line for the N2 vehicle.
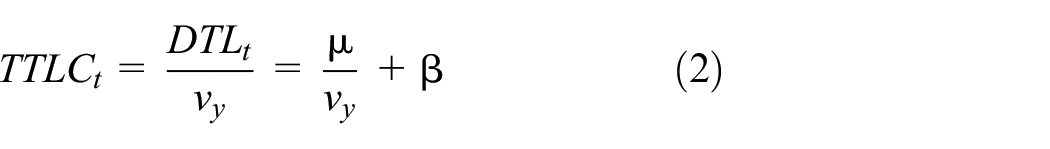
With regard to TTLC, only interactions between marking and direction and between marking and the reciprocal of lateral speed exist with a significance level higher than 1%, as Table 4 indicates. Therefore, the system behaves differently with different marking and direction combinations, which in turn may create confusion for the driver, according to Navarro et al. ( 23 ). The data in Figure 6 fitted by Equation 2 separately for the different markings at different directions. The time axis (vertical axis) of Figure 6 is split into two parts. When the warning is triggered before the line (when DTL is positive, e.g., for the solid line) the time measures TTLC; conversely when the warning is triggered beyond the line, it measures the time spent in the other lane. Obviously in all cases, LDW should provide more time for the driver to react, consequently the vehicle spends considerably shorter time in the other lane. As Figure 6 shows, if the warning is triggered in the lane then the increasing lateral speed decreases TTLC, which in turn results in a shorter margin for corrective reactions by the driver. However, if the warning is triggered beyond the lane, increasing lateral speed decreases the time spent in the other lane. The different influence of drifting speed on safety margin at the two sides of the line might be counter-intuitive at first glance, but it can be interpreted as follows. If warning happens at a fixed distance after trespassing the lane marking, the vehicle needs more time to reach the threshold at lower than at higher lateral speed. Therefore the time spent in the other lane is longer at lower lateral speed. In contrast, when a warning is given in the lane, then passing the lane marking needs a longer time at lower lateral speed. As Kusano et al. ( 1 ) mentioned, a shorter time spent in the other lane may be more effective to avoid crashes in case of lane departure than DTL. Therefore, reducing the time spent in the other lane may be taken into account in future LDW developments.
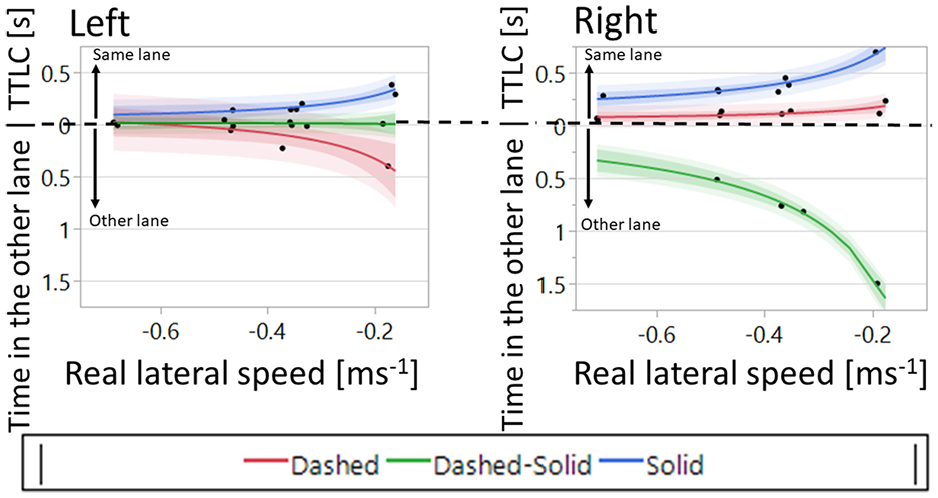
Dependence of time to line crossing (TTLC) with regard to the time spent in the other lane on the lateral speed in the left and right maneuver and at different lane markings for the N2 vehicle. The shaded areas are the confidence bands for the fit (darker colors) and for the prediction (lighter colors).
While more research is needed to ascertain the reasons behind the interactions between lane departure parameters, it can be concluded from the test results that the performance of the LDW system can vary depending on the lane markings and the departing trajectory. Because of the interaction found between the marking and drifting direction, asymmetric lane markings may require that all possible combinations of direction and line type should be tested; that is, in this case, drifting to the right encountering the dashed line first and drifting to the left encountering the solid line first should have been tested too.
M1 Vehicle
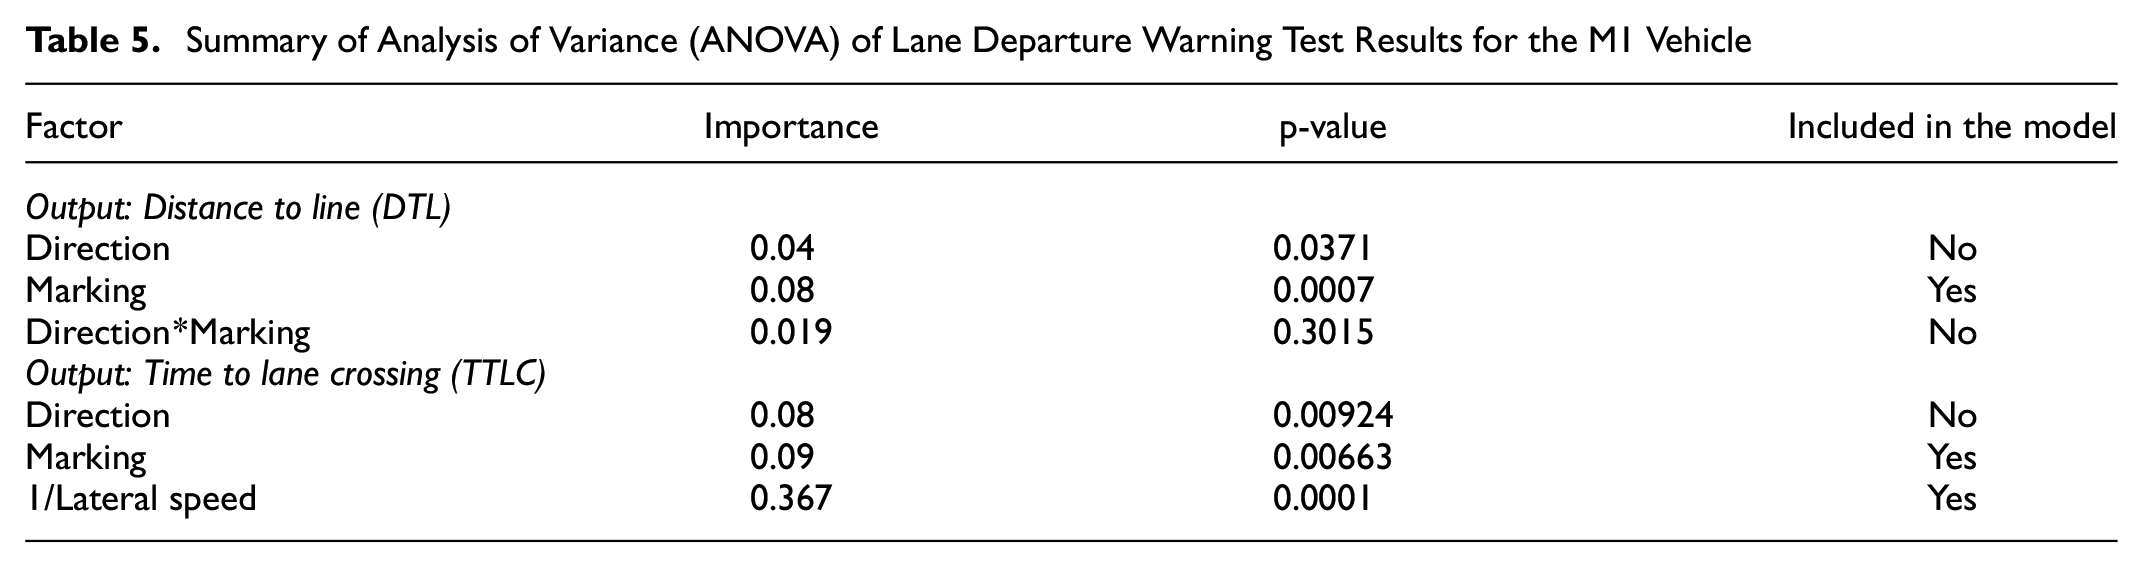
The approach illustrated for the analysis of the N2 vehicle was also followed for the M1 vehicle for the EuroNCAP scenarios comprised in Table 2. The screening of the main effects and interactions was performed through ANOVA. Table 5 summarizes the results of the analysis for DTL according to Equation 1, and for TTLC according to Equation 2, respectively. Here again, the importance is the maximum of the scaled estimate and shows the extent of the contribution of each factor to the output; the p-value is the probability that the observed variability is random. No interactions were found for either DTL or TTLC. The only significant and important factor of DTL is the lane marking type. Figure 7a shows the bar chart of the DTL at different markings and directions. As appraised by the ANOVA analysis, the direction does not show any significant trend, unlike the marking. The dashed and full dashed types show similar behavior to the solid and full solid type. Therefore, for further analysis the marking type variable is reduced to two groups, dashed and solid, that respectively comprise the two dashed types and the two solid types. Figure 7b shows the testing results aggregated for all lane change speeds and directions into the newly introduced marking type category. The red boxes show the quantile analysis and the green diamonds show the ANOVA analysis of the experimental results. The non-overlapping circles on the right side of the graph indicate that the means are significantly different according to the Tukey-Kramer Honestly Significant Difference method. On average, the warning came 20 cm closer to lane marking for the dashed line types than for the solid line types. This difference likely comes from the LDW system, but further analysis is needed to identify the cause or possibly additional, hidden variables. It may be argued that this could be a deliberate design strategy. An intentional lane change is possible with a dashed line, so the system may wait for a driver’s action (e.g., activating a turn signal) until the last moment to avoid false positive warnings. However, an intentional lane change is unlikely with a solid line, so drifting is probably not a deliberate maneuver. Nevertheless, it may be advisable to test further road markings in addition to the two lane marking types currently required in the EuroNCAP testing protocol. Alternatively, a future regulation may set different thresholds for different lane markings.
Summary of Analysis of Variance (ANOVA) of Lane Departure Warning Test Results for the M1 Vehicle
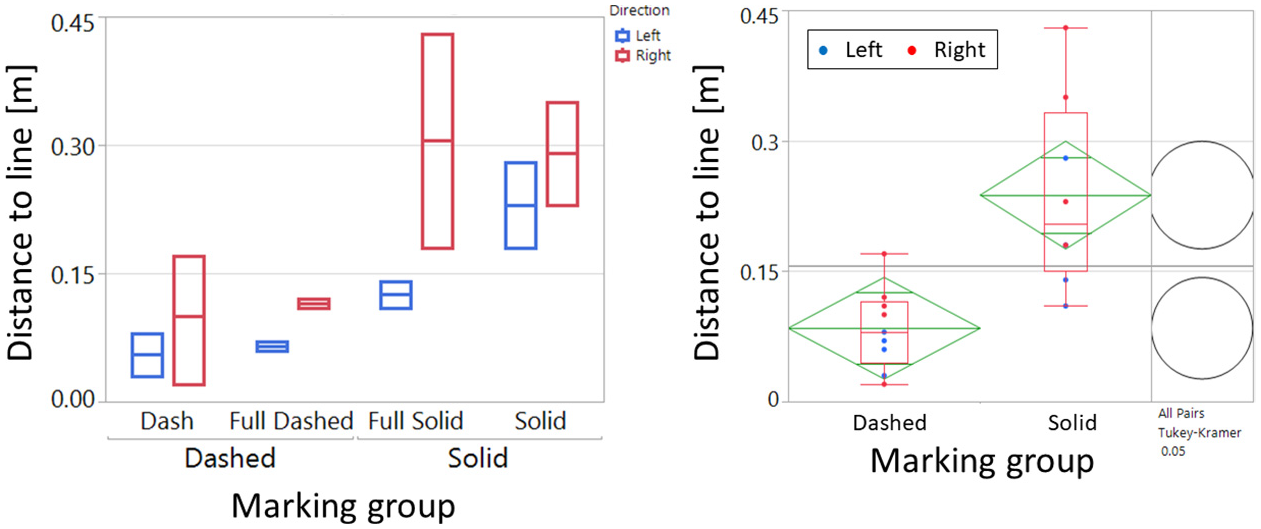
Distance at warning for the two different lane markings (dashed versus solid).
TTLC is sensitive to the reciprocal of lateral speed and lane marking without any interactions. The drifting direction is at the borderline of 1% statistical significance and is omitted from the following to simplify the model. The new variable “marking type,” as explained above, is introduced for the analysis of TTLC and used to fit the model. All warnings occurred while still in the lane, therefore, increasing lateral speed decreases the TTLC, as Figure 8 shows.
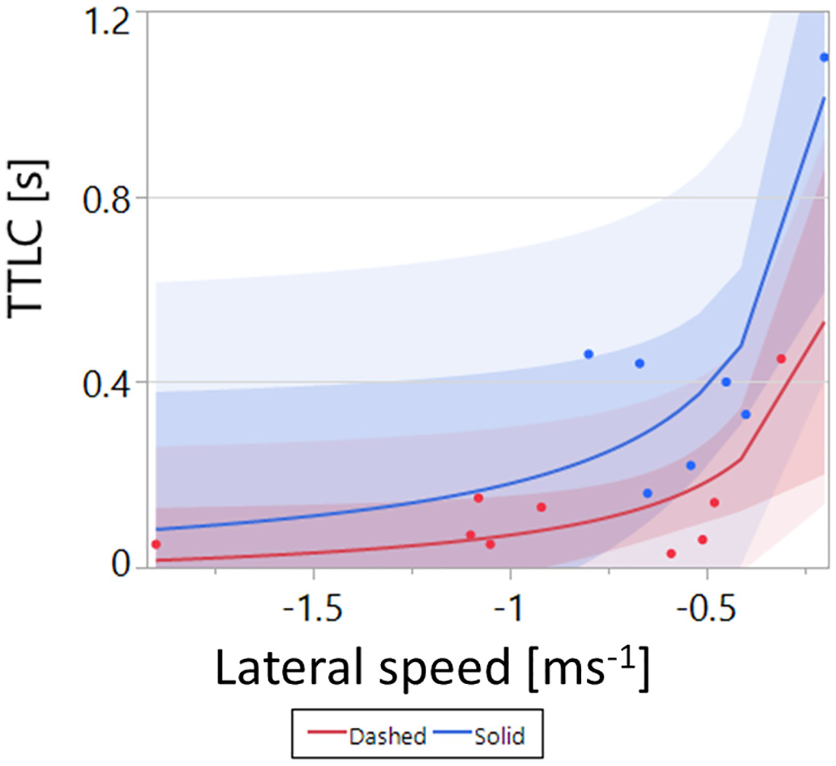
Time to line crossing (TTLC) for the two lane marking groups (dashed versus solid).
Both the direction and the lateral speed of the vehicle were not found to be significant on DTL, but they were on TTLC, which may indicate that the lateral position is used as the LDW threshold in this vehicle. Therefore, an increasing drifting speed reduces the reaction time of the driver. However, the system works in a broader range than that set out in the EuroNCAP standard.
Robustness Index
The behavior of the LDW systems of the N2 and M1 vehicles show several differences and the comparison of the two systems is not trivial. Since there is no commonly agreed metric in the literature, a robustness index R is proposed and analyzed in this work. This index takes the following three parameters of the performance of LDW systems into account.
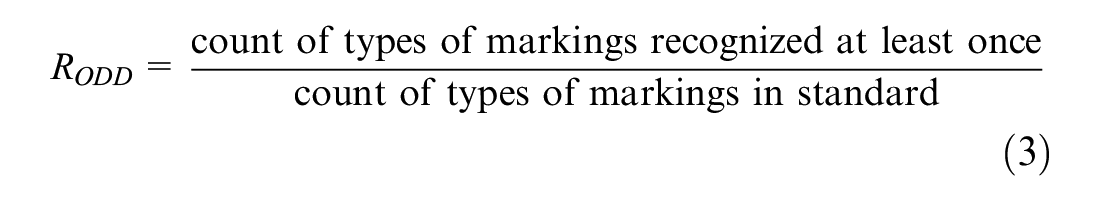
As an alternative, other scenario databases (e.g., realistic driving data) can also be used to determine the required ODD in the denominator of Equation 3.

In this definition, the successful attempts and overall test runs are corrected for small numbers. Since the ratio of unsuccessful attempts is smaller than 10%, the Laplace method was suggested by Sauro and Lewis ( 24 ). This method is simple: the successful (or unsuccessful) attempts are increased by one and all test runs by two. If the ratio of unsuccessful attempts is higher, the Wald method may also be used.
A control system is said to be more robust if the controlled behavior is less sensitive to the model uncertainties. Here, a robust LDW system means that the warning is insensitive to driving conditions, or more generally to the experimental conditions (including also weather conditions). The global sensitivity analysis (
25
) combined with the ANOVA is performed and analyzed as a possible metric to measure sensitivity. Let us denote Var() and E(), the variance and the expected value of a random variable, respectively. The global sensitivity of the warning
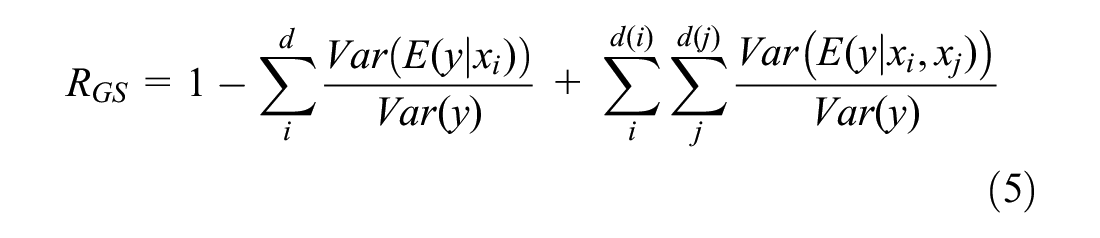
where y is the measured values of DTL and TTLC, respectively,
Finally, the overall robustness index R proposed in this work is calculated as follows:

Both DTL and TTLC can be used to calculate the global sensitivity (
To further analyze its applicability, the robustness index R is calculated for the DTL and TTLC for both vehicles in the following subsections.
N2 Vehicle
The simplified linear model for the N2 vehicle to predict DTL at warning is:

where
The lane marking types from the UNECE Regulation 130 are used to define the required ODD for the N2 vehicle. Because of the controversial interpretation of the diverging lane (Figure 1) as discussed in the Results section, it was excluded from both the required ODD and the test results. In this test campaign, the N2 vehicle recognized all other marking types at least once. Therefore
Lane markings were not recognized in two out of the 47 attempts. This results in
The sensitivity index (Equation 5) for DTL of the N2 vehicle can be calculated by using the model determined in Table 4 and Equation 8 as follows:
where the values of

which means that the system is sensitive to the driving conditions.
M1 Vehicle
Since the data in Table 4 indicate only a dependence on the lane marking type, a simplified linear model for the M1 vehicle to predict DTL at warning is given by:


The EuroNCAP Protocol for M1 defines six lane markings out of which four were recognized (road edges were not recognized). Therefore
The global sensitivity index is based on the formula for DTL in Equation 10, so
Comparison of Robustness
The robustness index R is scaled between 0 and 1 and robust systems are closer to 1. Comparing DTL robustness indices, the LDW of the M1 vehicle is more robust than the N2 vehicle. For TTLC robustness (details in the appendix), 0.094 and 0.12 were achieved for the N2 and M1 vehicle, respectively. While the ranking is the same, TTLC robustness increased for the N2 vehicle and decreased for the M1 vehicle compared with the DTL robustness indices. Since TTLC depends on the reciprocal of lateral speed (if DTL is independent of lateral speed), the global sensitivity index is expected to decrease, which decreases the robustness too. The increase of TTLC robustness for the N2 vehicle may indicate that its LDW uses TTLC as a threshold to trigger warning more than the M1 vehicle. However, at the moment the effect of some hidden variables cannot be excluded, such as lane centering or lighting conditions which may be confounded with driving conditions, since tests were performed in different parts of the day.
The proposed robustness index, based on state-of-the-art statistics, is not a direct measure of safety. Even though more research is necessary to develop a global safety index, using a TTLC-based robustness index for safety related ranking can be recommended. Its insensitivity to driving conditions means that the system provides the same time for the driver to react in every condition, which is more important to prevent injuries ( 1 ). The DTL-based robustness may be more meaningful to evaluate the drivers’ trustworthiness in responding to LDW for behavioral studies, such as Navarro et al. ( 23 ).
The robustness index may also be used to compare the testing needs and if the system is designed to fulfill only regulations or standards, that is, if it works similarly on a broader range of driving conditions. Furthermore, a less robust system depends not only on driving conditions but their interactions, therefore, considerably more tests are needed to validate the performance of a system with low robustness (
Conclusion
This paper presented a methodology for assessing the global robustness of currently marketed LDW systems fitted on road vehicles. Ranking the capabilities of assistance systems such as LDW is key to correct estimation of their contribution to traffic safety and evaluation of the appropriateness of the pertinent regulatory requirements. Data from two test campaigns with a M1 and a N2 vehicle were analyzed by means of ANOVA to determine statistically significant interactions between LDW and experimental factors such as lane marking type, speed, drifting direction, and combinations of these.
Statistically significant dependence on the lane marking type was found for both vehicles; the interaction with drifting direction was also significant for the N2 vehicle. Warning was triggered at significantly different distances for asymmetric lane markings, such as dashed-solid, depending on toward which side of this marking type the vehicle was drifting.
For the calculation and comparison of robustness, a global robustness index is introduced, which considers the ODD for lane marking types, the reliability of lane recognition, and the global sensitivity of warning to driving factors such as lane marking, direction, lateral and vehicle speed as well as their interactions. While the performance of the LDW system of the M1 vehicle depends only on the lane marking type, the N2 vehicle depends on more factors (direction and lane marking) and interactions (between lane marking and direction). Therefore the robustness index of N2 is 20 times lower than that of the M1.
DTL is independent of the lateral speed, while TTLC is inversely proportional to the lateral speed. Furthermore, when warning is triggered in the lane, the increasing lateral speed increases the time potentially spent in dangerous situations. However, if warning is triggered beyond the lane, increasing lateral speed decreases the time spent in potentially dangerous situations. Future regulations and standards may also mandate a threshold on the time a vehicle potentially spent in a dangerous situation, that is, in the other lane, rather than using distance as the same threshold for any driving conditions. Furthermore, all combinations of drifting directions and sides of lane marking types may need to be tested and, if crash statistics justify it, different thresholds for different conditions need to be required.
The experimental campaigns revealed some issues with the interpretation of diverging markings and the experimental conditions of curved roads; namely, the drifting speed can be higher than the required 0.8 m/s and depends on the driving speed and the curve radius. It is also suggested that LDW tests should be conducted on road sections with transitions from straight to curved roads. Since missed warnings were also found for both vehicles, dedicated tests may be required to be able to determine the realistic reliability of a LDW system.
Footnotes
Appendix
The pre-processing in Python comprised the automatic parsing and calculation of metadata (e.g., test run parameters) and key results for each test run. In particular, the time of the warning was detected automatically from the haptic or the audio warning measurement, which was done by calculating the convolution between the warning signal and a pre-recorded signal of the warning vibration or audio clip. The maximum of the envelope of the convolution function occurs at the time of the highest correspondence between the two signals, that is, the time at which the pre-recorded warning could be found in the test signal (see Figure A1).
The black box model of TTLC for the N2 vehicle reads as follows:
The black box model of TTLC for the M1 vehicle is:
Acknowledgements
The authors appreciate the collaboration of IDIADA, Santa Oliva, Spain in performing the test campaign.
Author Contributions
The authors confirm contribution to the paper as follows: study conception and design: A. Kriston, F. Re, F. Minarini; data collection: D. Broggi, A. Kriston, F. Minarini, F. Re; analysis and interpretation of results: A. Kriston, F. Re; draft manuscript preparation: A. Kriston, F. Re. All authors reviewed the results and approved the final version of the manuscript.
Declaration of Conflicting Interests
The author(s) declared no potential conflicts of interest with respect to the research, authorship, and/or publication of this article.
Funding
The author(s) received no financial support for the research, authorship, and/or publication of this article.