
Abstract
With rapid growth in on-demand delivery, ridehailing, and shared mobility use, cities are observing dramatic increases in demand for curbspace. In response, cities and private companies have proposed a diverse range of structural, policy and technology solutions to manage the curb lane more efficiently. Through structured interviews with public agency and private company staff and a review of existing pilot project evaluations and curb management guidelines, this study surveys contemporary approaches to curbspace management in 14 U.S. cities and documents the challenges and opportunities associated with them. A total of 17 public agencies (including public works departments, transportation agencies, and metropolitan planning organizations) in every census region of the U.S.A., and 10 technology companies were interviewed. The results show that the top curb management concerns among public officials are enforcement and communication, data collection and management, and interagency coordination. Interviewees reported success with policies such as allocating zones for passenger pick-ups and drop-offs, incentives for off-peak delivery, and requiring data sharing in exchange for reservable or additional curb spaces. Technology company representatives discussed new tools and technologies for curb management, including smart parking reservation systems, occupancy sensors and cameras, and automated enforcement. Both public and private sector staff expressed a desire for citywide policy goals around curb management, more consistent curb regulations across jurisdictions, and a common data standard for encoding curb information.
In recent years, explosive growth in demand for transportation network company (TNC) services, on-demand delivery, and new mobility options has transformed the curb lane into valuable real estate, especially in central urban areas with limited curbspace. These heightened demands have spurred congestion and conflict for scarce curbspace, prompting a reevaluation of on-street parking revenue structures and longstanding regulatory practices in cities around the world. At the same time, numerous technology companies have entered the curb management space, offering tools to help cities digitize their curb assets, communicate rules in machine-readable format, and enable smart parking and loading zone reservation.
Throughout the U.S.A., cities large and small, progressive and conservative, grapple with the same questions surrounding this dynamic and hotly contested space. Municipalities are adopting citywide curbspace policies, restructuring curb management and parking divisions, and experimenting with an array of novel policy and technology tools.
Early research on curbspace management centered on performance pricing (also called dynamic pricing) schemes. A review of Los Angeles’s Express Park concluded that given the relatively stable demand for parking, performance pricing strategies proved most effective when they were actively communicated to the public, and when revenue was not the primary goal ( 1 ). Pierce and Shoup ( 2 ) dubbed San Francisco’s performance pricing program, SF Park, a “promising” pilot program that internalized the costs of parking. Perez et al. ( 3 , 4 ) outlined a data-driven approach to selecting performance pricing zones in Washington, D.C., drawing on geographic information systems (GIS), transit agency, and parking meter data. Successful pricing plans, according to the existing literature, frequently change prices, set a wide range of rates to account for the price inelasticity of parking, and target specific districts. However, previous research on pricing viewed the curb as a space primarily for parking, while the emergence of on-demand delivery, new mobility services, and novel technologies demands a more nuanced and multidimensional understanding of the curb.
The lack of curb data and metrics for these emerging uses has made exploratory, interview-based research a key tool for identifying problems and solutions. In recent years, interview-based research has investigated comprehensive, multimodal demand management strategies for the use of curbspace. Zalewski et al. ( 5 ) characterized many cities’ complaint-driven curb management process as an “incremental” policy approach. In interviews with staff in eight cities, they found two alternatives: performance pricing or a “framework model” that sets broad standards for districts based on land use and other planning considerations. They also found that as cities shift to the framework model, they reimagine their curb management governance structures and workforce distribution ( 6 ). Butrina et al. ( 7 ) interviewed staff at 10 municipalities, finding that eight had restructured departments and increased staff to deal with new curbspace management pressures. They also reported significant challenges with interpreting curb data, enforcing regulations, and coordinating various agencies responsible for the curb.
City policies and curbspace design standards are trending toward flexible, multifunctional uses. Recently, the Institute for Transportation Engineers (ITE) developed a Curbspace Management Practitioners’ Guide with policy frameworks and best practices for efficient curbspace management ( 8 ), and the National Association for City Transportation Officials (NACTO) proposed a set of transit-centered curb design strategies ( 9 ). These reports describe strategies such as “flex zones” that can accommodate both freight and passenger loading, dynamic pricing, and reallocation of curb space for bike or transit facilities. Consulting firm Fehr & Peers and curb technology company Coord proposed new curb productivity metrics by which cities can evaluate the performance of these design strategies ( 10 , 11 ). These methods calculate the number of passengers served per foot of curb, normalized by vehicle length. However, there is no specificity around how these metrics are calculated for goods (e.g., volume, weight, or value of packages). Kong et al. ( 12 ) proposed a model for intermodal competition for curb space, demonstrating how curb managers can deploy flexible strategies to maximize benefits for users.
Recent literature has addressed the impacts on curbspace of TNCs, on-demand delivery, and e-commerce, and resulting increases in passenger and freight loading demand. Lu ( 13 ) found that dedicated TNC loading zones can serve four times as many passengers per hour as the same space used for parking. Drawing on TNC activity data from Shared Streets, the nonprofit Open Transport Partnership’s geographic data-referencing project, Washington, D.C., adopted a strategic approach to placing 25 pick-up/drop-off (PUDO) zones throughout the city ( 3 ). Ranjbari et al. ( 14 ) evaluated adding new PUDO zones and geofencing, a practice of restricting pick-up/drop-off of ridehailing users to specific areas, in a highly congested neighborhood in Seattle. They found that both measures reduced dwell time and illegal in-lane stops, with no observable effects on traffic speed or safety. The rise of on-demand delivery and e-commerce has increased freight loading demands and shifted activity to new areas. Chen et al. ( 15 ) documented a spike in residential deliveries in New York City (NYC), concluding that the city’s loading regulations, which were aimed predominantly at managing congestion in commercial areas, were not keeping pace with these new demands.
Several studies have evaluated emerging curbspace technologies and data standards. A study by District Department of Transportation (DDOT) identified a range of data collection technologies including GPS-enabled cameras, time-lapse cameras, license plate recognition devices, and in-ground sensors ( 16 ). Through a series of pilot projects and academic evaluations, the same group of researchers uncovered several limitations to existing parking sensor technology, including prohibitive cost and a considerable number of false positives ( 17 ). They also applied predictive modeling to strategically deploy parking assets where they were most needed ( 18 ). In 2018, the International Transportation Forum (ITF) summarized emerging data standards and open-source tools for promoting a flexible, self-regulating curbspace ( 19 ). ITF advised that cities should plan for revenue impacts from shifting paid parking to loading and unloading activity, form adjudication bodies to manage increasingly contested curbspace, and develop common standards for encoding information about curb assets.
In recent years, many cities in the U.S.A. have attempted new pilots and technologies that have transformed their approach to curbspace management. While prior studies have revealed valuable insights into curbspace policy, the effectiveness of current and emerging curb management technologies and best practices for curb inventory and data sharing have not been addressed to the same extent. Previous interview-based studies also focused primarily on the public sector, and did not incorporate the perspective of private sector and technology companies working in this area.
The aim of this study is to understand curbspace management opportunities and challenges from the perspective of both public and private sectors, identifying areas for collaboration and mutual benefit. Structured interviews were conducted with public agencies and private companies in the U.S.A., and the technology and policy tools currently available to manage curbspace demand and operation were examined. By compiling and synthesizing the information from these interviews, common themes, challenges, and approaches to more efficient and effective curbspace management are identified. This study also identifies a set of curb performance metrics, along with the corresponding data sources and companies/agencies collecting those data, that assist cities in evaluating effectiveness or efficiency of their pilot programs and policies.
The next section describes the study approach and characteristics of interviewees. Findings on existing challenges, current policy trends and solutions, emerging opportunities, and evaluation metrics are presented in the third section. The fourth section discusses the findings and offers insights for efficient curbspace management.
Study Approach
The research approach consisted of structured interviews with representatives of public agencies and technology companies specializing in curb management solutions. The study sample, shown in Table 1, included 10 technology companies, 14 cities, and three regional metropolitan planning organizations (MPOs). Interviewees held a diverse mix of job titles including curb access manager, transportation planner, and parking strategist. Technology company interviewees consisted of chief executive officers and marketing or business development staff. City planning documents, company websites, pilot program evaluation reports, and other documents provided by interviewees were also reviewed. The cities were selected to reflect a range of population sizes, political leanings, governance structures, transportation options, and geographic locations, representing every census region of the U.S.A., ranging from the Pacific Northwest and California to the Midwest, South, and Northeast. Technology companies were chosen based on participation in prominent technology competitions and curb management pilot projects. Table 1 presents information on the interviewees’ positions and their associated companies/agencies, and Figure 1 displays a map of the locations for the interviewed companies/agencies.
Interviewees’ Positions and Associated Agencies/Companies
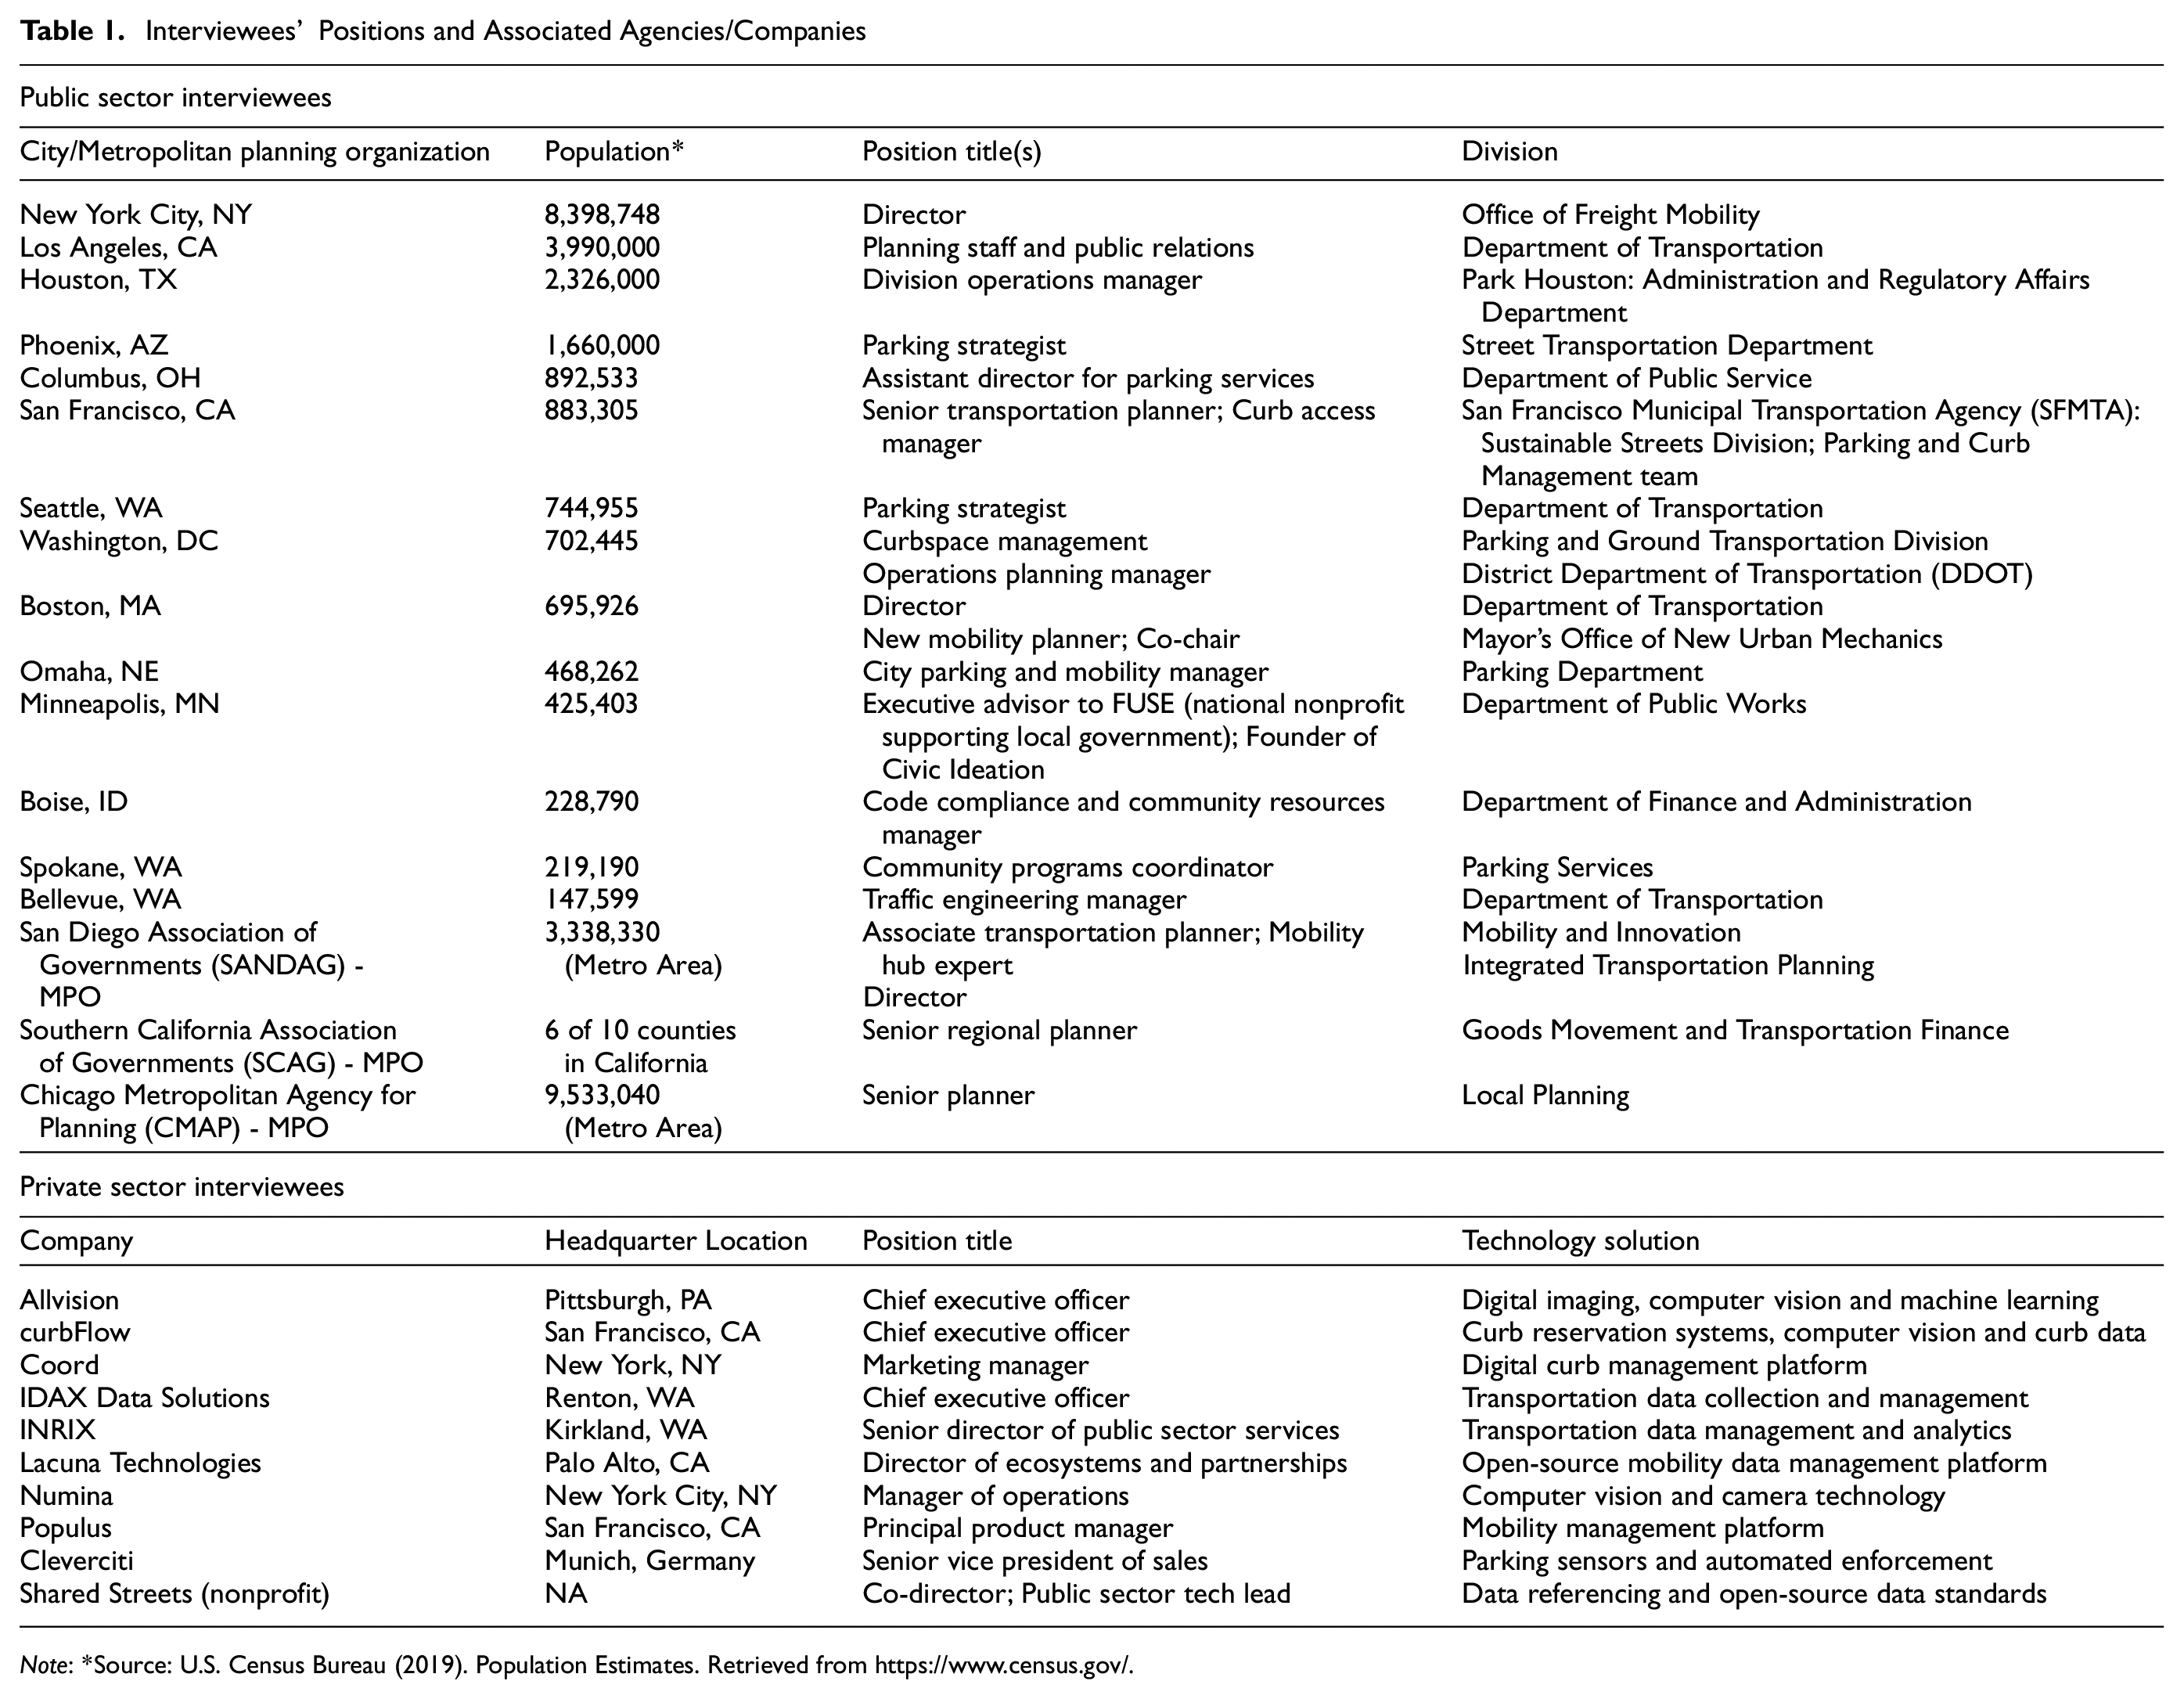
Note: *Source: U.S. Census Bureau (2019). Population Estimates. Retrieved from https://www.census.gov/.
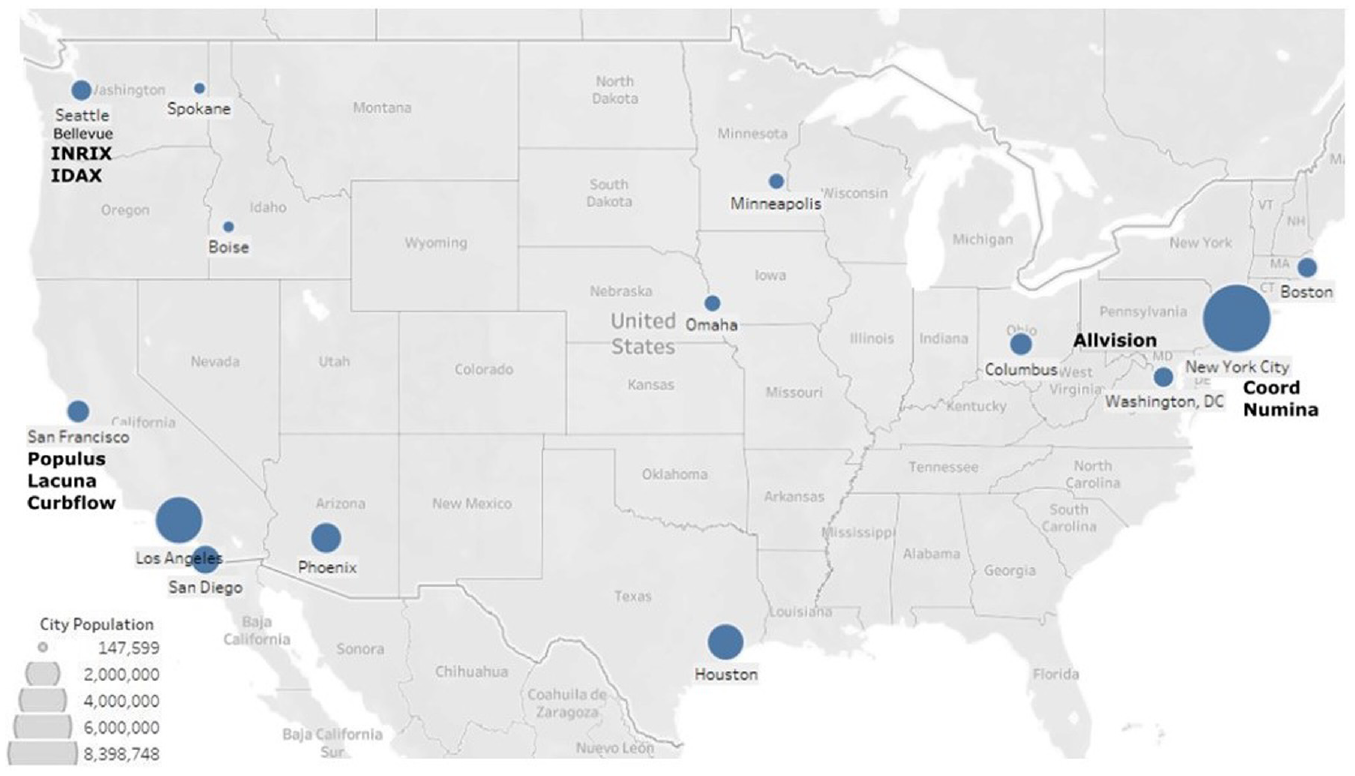
Map of cities and curb technology company headquarters in the study (the size of dots on the map shows city population).
Interviews were conducted by phone or videoconference between February and June 2020. Before the interview, interviewees were informed that their responses could be made publicly available through academic papers, reports, or presentations. Interviews ranged from 30 min to one hour, and all interviewees within the same sector were asked a similar set of questions, with occasional follow-up questions asked as needed.
For public agency interviews, questions followed the themes below.
Organizational shifts around curbspace management
Characteristics of current policy tools
Challenges to efficient curbspace management
Recent changes to curbspace management policies
Effectiveness of current policy tools and evaluation metrics
Usage and effectiveness of emerging curb management technologies
Interviews with technology company staff followed the themes below.
Design and effectiveness of recent pilot projects with cities
Workings of the technology, including limitations and variables measured
Comparisons with similar technologies on the market
Business models and pricing
Plans for future expansion
Findings
The findings from the interviews are presented in four categories: existing challenges, current trends and solutions, emerging and future opportunities, and curb management evaluation.
Existing Challenges
Policy Challenges
The top five challenges in curbspace management that emerged in the interviews are listed below. Figure 2 lists the challenges each city faces, broken down by population size.
Communication and enforcement: Curb rules may change dynamically—by the week or day, and sometimes even hourly. SFMTA officials say that regulatory agencies in San Francisco print new regulations as often as every week and paste them on existing signage. Every city in the study reported a high frequency of parking violations and difficulty in communicating and enforcing these constant changes. Moreover, some violations seem to happen because city authorities fail to meet existing needs, underscoring the importance of understanding reasons behind parking violations. A NYC freight program manager noted that freight companies often find it more efficient to pay tickets, rather than waste time and fuel searching for a parking space. In 2006, for example, UPS, FedEx and other delivery companies paid the city $102 million in parking fines annually and averaged a combined 7,000 tickets per day ( 20 ). Staff at other cities say that vehicles with disabled placards, official vehicles, and TNCs frequently occupy freight loading zones, and that agencies lack the resources for consistent enforcement.
Regional and interagency coordination: Many municipal staff interviewed in the study expressed confusion around who is responsible for managing the curb and lack of centralized structures. They pointed out that currently different agencies, including police, public works, consumer and regulatory affairs, and transportation departments, each claim responsibility for pieces of the curb. Planners at SFMTA say they continually navigate legal issues with regard to where their jurisdiction falls for different sections of curb. Boise, ID faces an unusual situation in which the Ada County Highway District maintains most roads within the city, and curb managers must negotiate for county approval to install parking sensors or other technologies. A Spokane, WA planner named convening staff from different agencies and avoiding working in a silo as a major challenge. In Minneapolis, an advisor for the public works department said that systems from 50 to 100 years ago still define the agency’s organizational culture, and that various departments lack connectivity. Figure 3 shows a comparison between Seattle’s more centralized and Minneapolis’ decentralized curb management structures. Some cities described a tension between standardizing curb regulations citywide and adapting them for individual businesses or neighborhoods. A planner at the San Diego Association of Goverments (SANDAG) said that private companies sometimes launch curb pilots with only minimal coordination with city governments.
Concerns over losing municipal revenues: Some city authorities hesitate to replace parking meters with loading zones, fearing a loss of revenue that supports essential public services. Chicago’s then mayor signed a contract with several investment banks in 2008, having offered $1.15 billion in exchange for 75 years of the city’s parking meter revenue. The deal effectively privatized the parking meter system, with investors collecting the meter revenue until 2083 ( 21 ). One regional planner at Chicago’s MPO commented that the city’s agreement turns any curb policy that could jeopardize meter revenue into a political third rail. A Columbus planner says the city would like to charge for passenger pick-ups and drop-offs to replace the lost meter revenue from converting paid parking spaces into additional loading capacity. However, Columbus, like many other cities, faces a prohibitively high cost to install the requisite automated payment infrastructure.
Political inertia: Staff from several cities, including Omaha, NE and Phoenix, AZ, reported that their citizens expect widespread free parking and are skeptical of curbspace pilots that take away storage space for private vehicles. Officials in Bellevue, WA, a city with no paid parking spaces, said that a popular image of the city as an escape from Seattle’s restrictive parking regulations has not kept pace with its rapid population growth and loading zone needs. Boise, ID and major cities in California named state laws protecting free and unlimited parking for vehicles with “disabled” placards as one of their most vexing issues. In Boston, officials mentioned that politics and entrenched unions make it difficult to automate parking enforcement.
Data collection and management: Staff from every city in this study mentioned a lack of complete data about curb usage, especially from shared mobility and freight operators, as an obstacle to updating/revising curb management rules and asset inventories, and efficiently communicating changes to users. They cited the following obstacles to partnerships with curb technology companies: Lengthy government procurement procedures and legal requirements Initial capital costs of sensor installation and other data collection technologies Ownership disagreement over generated data Low-resolution data (e.g., neighborhood-level maps were provided to avoid identifying individual trips.)
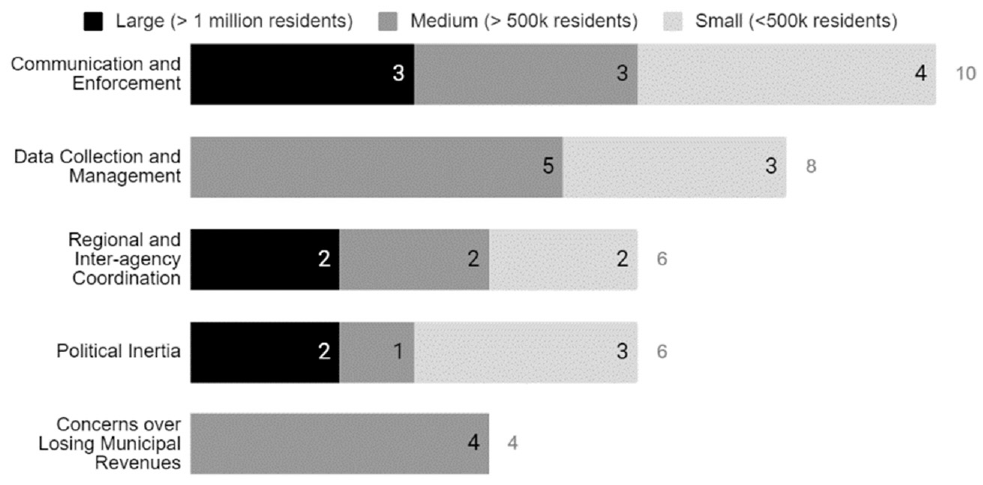
Existing challenges with curbspace management in cities in the study, broken down by population size.
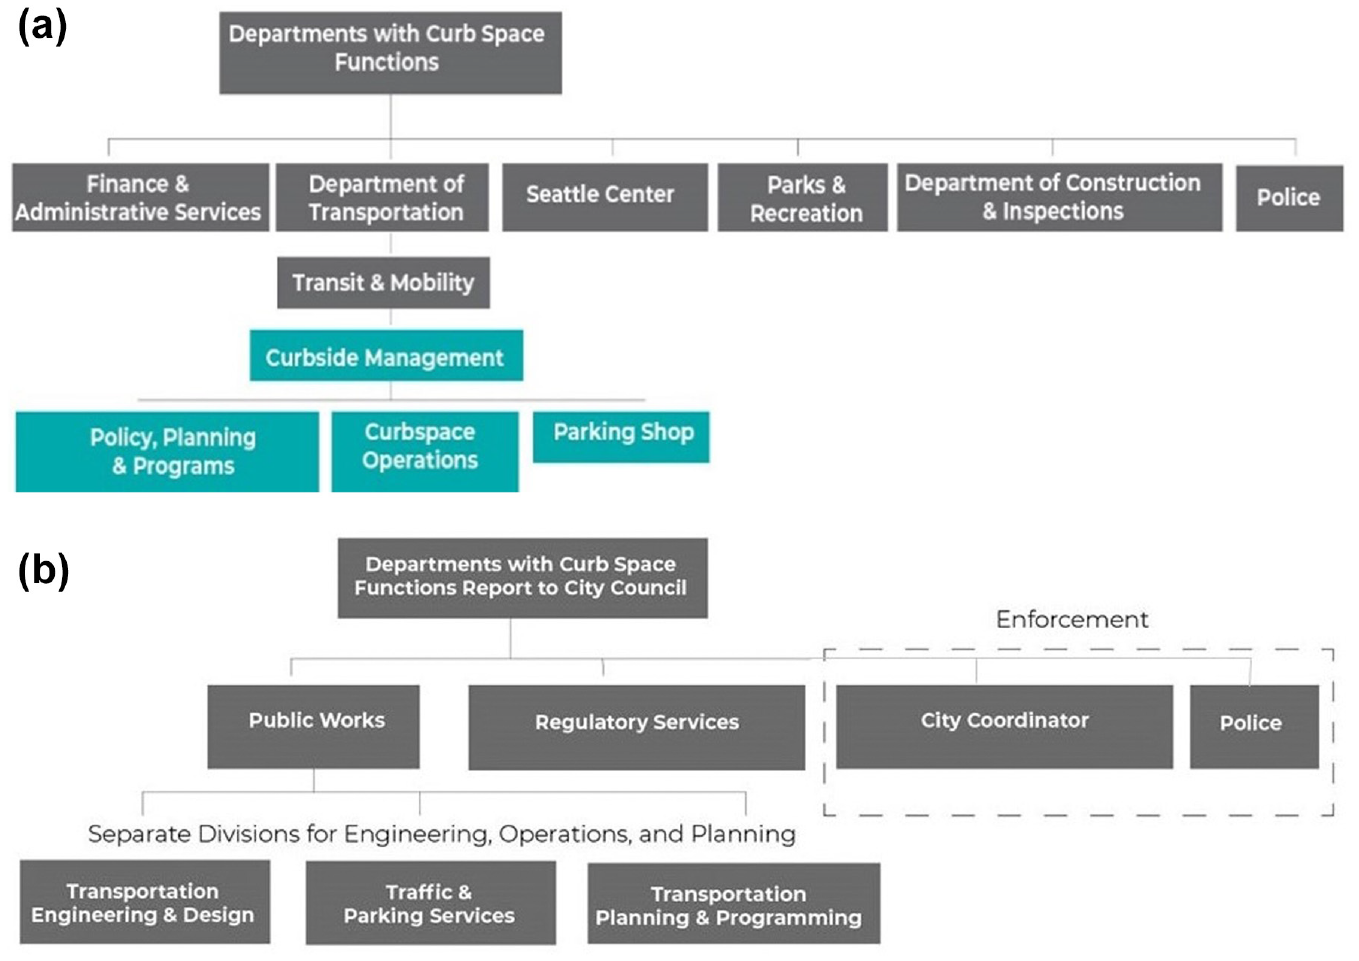
Curbspace management organizational structures in (a) Seattle and (b) Minneapolis.
Current Trends and Solutions
The main trends and solutions to curb management issues fall into three categories: organizational restructuring, policy solutions, and data inventory digitization. Figure 4 shows the most common curb management strategies adopted by cities, and Figure 5 displays a map of those cities.
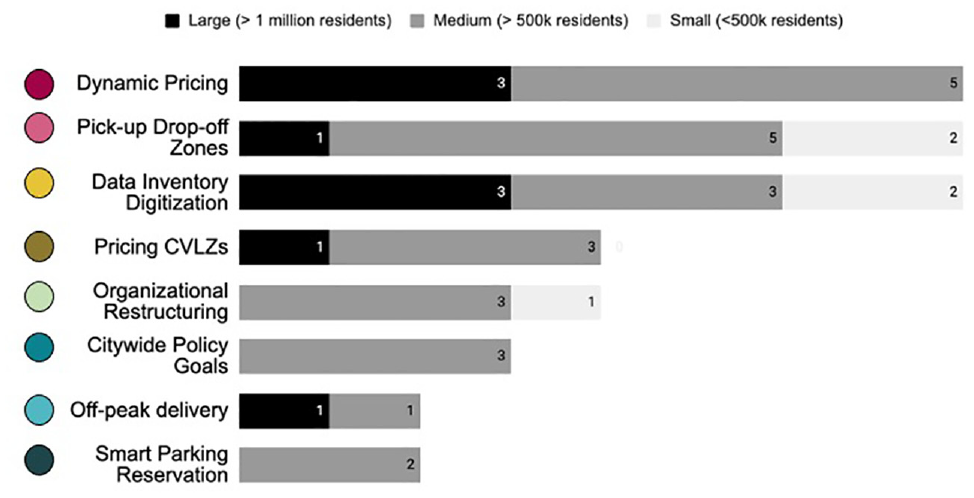
Most common curb management solutions in cities in the study, broken down by population size.
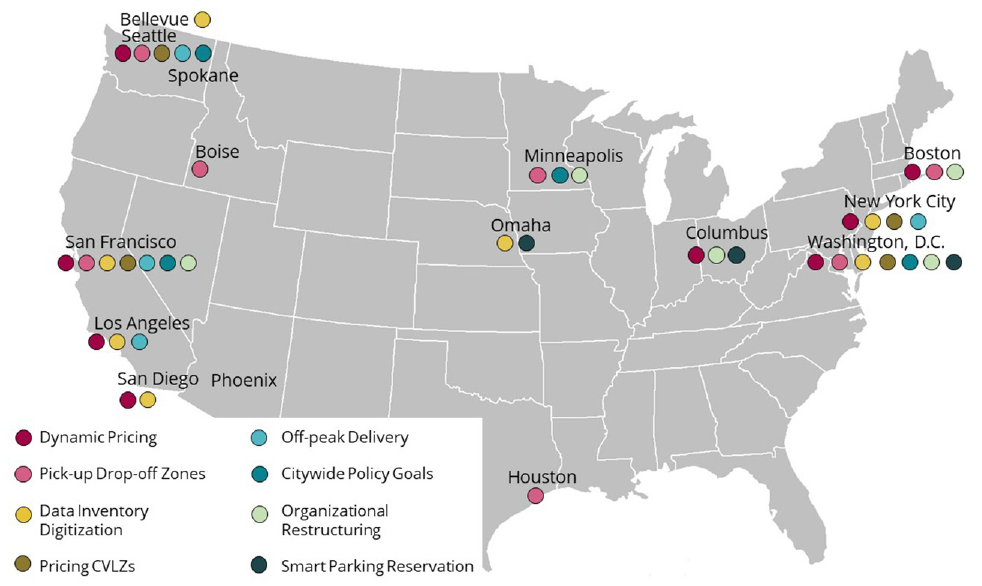
Map of existing and emerging curb management solutions implemented in cities in the study.
Organizational Restructuring
With curb management gaining prominence, some cities have entirely rebranded and repositioned these responsibilities, or created new divisions entirely dedicated to curbspace management. In spring 2018, San Francisco formed a curb management team within its parking and curb management division. The team of policy managers and urban planners promoted a culture shift within the department from complaint-based allocation of loading zones to proactive management. This work culminated in the city’s Curb Management Strategy, released in February 2020, the most comprehensive of its kind in the U.S.A. ( 23 ). SFMTA staff noted that curb management is now a required component of most major transportation projects. A planner from NYC said that the city’s curb management process shifted from a “car-centric” to a multimodal “sharing” mentality emphasizing complete streets, and an assistant director for parking services at the City of Columbus said the city administration now hires data scientists and programmers to work on contactless payment and other technology solutions for curb management. Staff from six cities in the study also reported minor changes, such as renaming parking departments as “curbspace management,” or increasing staff hours spent on multimodal or new mobility projects.
Policy Solutions
Developing citywide policy goals for curb management: A recurrent theme among interviewees was the desire to transition to a more proactive management structure. San Francisco, Seattle, and Washington, D.C. have published citywide curb management policy frameworks ( 22 – 24 ), and staff from Boston, Minneapolis, Columbus, and Bellevue indicated that their cities plan to introduce similar strategies.
The Seattle and San Francisco strategies have set specific goals to improve safety, mobility, environmental sustainability, equity, and public transparency, and prioritized curb functions, such as greening, mobility, and storage, by land use. For example, downtown areas prioritize access for people, while industrial areas favor access for commercial vehicles. Other municipalities weave curb management goals into their general transportation plans. The Go Minneapolis plan relates curbspace management goals to land use objectives such as eliminating single-family zoning and increasing density ( 25 ).
Incentives for off-peak delivery: In an attempt to ease pressure on the curb, NYC is attempting to redistribute freight demand throughout the day by incentivizing off-peak deliveries. The NYC Director of Freight Mobility said the city had enough loading zones, but they were not all available at the right times. An off-peak delivery program in NYC funded by the U.S. Department of Transportation provided freight companies with small financial incentives to shift demand to quieter hours, and the city aimed to triple the number of locations in 2020 ( 26 ). SFMTA planners say they are also considering off-peak scheduling requirements or incentives.
Pricing commercial vehicle loading zones (CVLZs): In many cities, delivery vehicles park in CVLZs for free, leading to virtually unlimited demand. NYC enacted a progressive pricing structure to incentivize shorter stays. Consequently, the percentage of occupied curbspace dropped from an average of 140% (accounting for double parking) to 95%. Average occupancy times decreased from 160 min to 45 min, and only about 25% of commercial vehicles occupied spaces for more than one hour ( 27 ). The Stipulated Fine Program, enacted in 2004, allows commercial operators to pay reduced parking fines but limits their ability to challenge tickets in court. As a result of their reduced fines through this program, UPS and FedEx saved as much as $20.4 million in 2018 ( 28 ). Pricing CVLZs in Washington, D.C. also reduced violations for double parking and non-trucks parking in loading zones by 50% ( 29 ).
Dynamic pricing: Seven cities in the study launched dynamic pricing programs, with target parking occupancy rates between 70% and 90% per block. The cities reported decreases in congestion and parking cruising times, and positive feedback from businesses and residents. The frequency of adjustments in cities ranged from every eight weeks to once per year.
Shorten time limits: Shortening parking time limits is a cost-effective way to encourage higher turnover. Currently, most CVLZs have a 30 min time limit, while a recent study in downtown Seattle found that more than half (54%) of commercial vehicles parked at the curb for 15 min or less ( 30 ). Many cities in the study also noted that a lack of time restriction on parking placards issued under the Americans with Disabilities Act (ADA) hindered their ability to manage demand. In its curbspace management plan, SFMTA proposed to standardize its 15 to 30 min loading zones at 15 min, and to reduce time exemptions for ADA permits. The agency also planned to take a more proactive approach to placing 15 min zones outside businesses that cater mainly for pick-ups and drop-offs ( 23 ).
Move, extend, or merge loading zones: In its latest curbspace management plan, San Francisco encouraged loading across driveways as an alternative to double parking ( 23 ). The Seattle Department of Transportation (SDOT) has also applied design changes to 29 CVLZs near downtown: moved loading zones in front of driveways or close to intersections, and extended CVLZ length to a minimum of 35 ft, giving drivers more space to maneuver ( 31 ). A recent study in Seattle suggested that drivers use curbspace fluidly—passenger vehicles accounted for more than half of vehicles parked in CVLZs (52%), while more than a quarter (26%) of delivery drivers parked in PUDO zones ( 30 ). As a result, SDOT also moved CVLZs and PUDO zones on the same blockface next to each other, hoping that combining these two zones would facilitate drivers’ natural behaviors while preserving existing regulations. Furthermore, cities can discourage illegal behavior by responding to the underlying curbspace needs behind violations. For example, Los Angeles interviewed parking violators and placed loading zones in areas where they indicated a need ( 22 ).
Passenger pick-up and drop-off (PUDO) zones: Increased TNC activity has increased passenger pick-ups and drop-offs, especially on evenings and weekends. To address these trends, six cities in the study undertook PUDO zone pilots. Cities generally selected hotspots where businesses and residents reported unsafe driving, overcrowding, double parking, and congestion. Planners converted those areas into PUDO zones at night or peak hours, while preserving parking spaces during quieter daytime hours. Often these zones were geofenced. Cities reported positive feedback from businesses and TNC providers and users, as well as improved traffic flow and emergency vehicle access ( 3 , 14, 32). The primary challenges with these pilots are enforcement, wayfinding, and public education.
Data Inventory Digitization
Most cities in the study still inventory their curbs through manual data collection and entry into a GIS database, although different agencies or departments each have their own methods for storing data. Boise’s inventory, for example, is largely passed down through seasoned employees. However, cities are searching for tools to present these data to the public in a standard digital format. Los Angeles has launched the broadest attempt nationwide to centralize and digitize more than 1 million curb signs and 37,000 parking meters through its “Code the Curb” effort ( 33 ).
Several companies, including Numina, Conduent, Streetline, and IDAX, promise real-time data collection through in-ground sensors, or cameras affixed to nearby buildings or light poles. However, sensors sometimes suffer from high cost or false positives. Unanticipated situations such as streetcars (in San Francisco) or heavy snowfall (in Boston) confound some sensors, while battery life diminishes in cold conditions ( 16 ). Boston planners said that in one pilot, they needed approximately one camera for every two parking spaces, and it was ultimately cheaper for interns to manually collect data. In Washington, D.C., DDOT estimated the cost of sensors for its 18,000 metered parking spaces to fall between $2.25 million and $4.8 million, with added annual operating costs of between $1 million and $3.2 million. Likewise, San Francisco curb managers deemed the 11,917 real-time sensors (1.45 per parking space) piloted in the SF Park program too expensive for long-term use ( 16 ). In Boise, ID, however, parking managers said that in-ground parking sensors, used in combination with two license plate recognition vehicles, have efficiently managed occupancy and time-limited spaces.
Numina, a Brooklyn-based startup founded in 2014, has installed cameras equipped with machine-learning capabilities in 20 cities around the U.S.A., Canada, and Europe ( 34 ). Their sensors can distinguish between cars, trucks, pedestrians, or bicyclists, and measure dwell time for passenger, freight, and TNC vehicles. The process is energy-intensive and requires a hard connection to a power source. Similarly, Cleverciti, a German technology company operating in 200 cities worldwide, attaches sensors to light poles, drawing power at night and recharging batteries for daytime use ( 35 ). Their sensors record parking events, process information about dwell time and vehicle length onboard the device, and broadcast it to dynamic messaging signs, online dashboards or mobile apps, through either a cellular network or wi-fi connection. Sensors classify all vehicles 22 ft in length or below as passenger vehicles, and any vehicle above this length as a commercial vehicle. The sensors cannot currently identify passenger vehicles being used for commercial purposes, but Cleverciti is developing algorithms to identify company logos on the sides of vehicles.
Pittsburgh-based startup Allvision markets a GPS-enabled sensor mounted atop cars ( 36 ). The sensor combines photography with LiDAR (light detection and ranging), a method of bouncing lasers off objects to form three-dimensional images. In a 2019 pilot, the company inventoried Pittsburgh’s Strip district, one of the city’s most congested neighborhoods, in a matter of days. However, this technique is capital-intensive and difficult to scale. Deep “urban canyons” disrupt GPS signals, making it difficult to obtain the foot-by-foot accuracy needed to pinpoint locations along a blockface. Parked cars can also obscure signs, leading to gaps in data. Moreover, curb regulations change so frequently that up-to-date data collection requires numerous passes with the survey vehicles. Allvision hopes to ultimately hand off this task to public works vehicles such as buses or street cleaners, and solely manage the platform that interprets the data.
The most market-ready technologies appear to be enhancements to manual collection. Coord, a NYC-based curb technology startup, created “Collector,” an augmented reality smartphone app ( 37 ). The technology can survey 0.9 miles of curb per field collector hour. Using the app, a five-person team from the engineering firm AECOM inventoried 101 miles of Philadelphia curbs in seven days ( 38 ). Municipalities including Columbus and Omaha launched digital collection pilots with Coord. The app, free for anyone to download and use, collects images of curb assets including freight loading and passenger pick-up/drop-off zones, street parking signs, or fire hydrants, and automatically references the position of those objects along the curb. For a fee, firms or agencies can send the data to Coord, where a proprietary “rules engine” interprets features (like parking signs, fire hydrants, and paint), and determines which regulations apply. As of March 2020, Coord’s inventory covered 15 cities, with a goal of reaching 100 by 2021 ( 37 ).
In San Francisco and Seattle, Shared Streets piloted its “curb wheel,” an iPhone camera and a small computer, called a Raspberry Pi, affixed to a measuring wheel. The parts cost around $100 and are designed to be easily assembled. The computer and iPhone sync via wi-fi to automatically match photographs to measurements. The system still requires manual data entry, that is, the data collector must view the photos they took and, with the help of Shared Streets’ interface, enter attributes for each feature ( 39 ). Neither the Coord nor Shared Streets systems can capture moving vehicles or pedestrians, or provide real-time data.
Emerging and Future Opportunities
Data Partnership and Standardization
Some cities gained access to TNC data by negotiating curbspace access in the public right-of-way. In Omaha, NE, through a combination of offering more loading space and “arm twisting” over citations, the city secured neighborhood-level, hexbin heatmaps of PUDO data from Uber and Lyft. Similarly, when Uber and Lyft learned that Columbus would make additional PUDO zones available to them as part of its pilot with technology company curbFlow, they consented to sharing aggregated data through Shared Streets. The Columbus parking manager said that the city overcame years of unsuccessful negotiations with ridehailing operators by showing a willingness to trade additional loading space for data.
Third-party standards for curb data sharing are gaining acceptance. In 2019, Shared Streets launched CurbLR, a standard format for cities to publish curb data ( 40 ). The open-source specification is funded by Bloomberg Philanthropies and maintained by NACTO and Open Transport Partnership. Through linear referencing, CurbLR generates line segments that represent streets and points that depict intersections. This abstracts the original data, allowing companies and cities to protect their proprietary basemaps. Another advantage of linear referencing is the ability to refer to more specific segments of curb, measured by feet from an intersection. Officials in Bellevue, WA described their transition to CurbLR as a “labor-intensive,” but worthwhile, process. Using the Shared Streets curb wheel, the only technology that could provide measurements with enough precision, data collection for 300 blockfaces required two months with 1.5 full-time staff. The city is digitizing the information and designing an interactive mapping application to query its curb inventory. One challenge with this process, planners say, has been finding a way to continually update the dynamic data.
The presence of an intermediary between mobility operators and public agencies appears to substantially increase companies’ willingness to share curb data. Platforms such as Shared Streets or San Francisco-based technology company Populus anonymize and aggregate curb data to protect users and proprietary information. In pilots in Toronto, Washington D.C., Minneapolis, Pittsburgh and Los Angeles, Shared Streets aggregated Uber and Lyft pick-up and drop-off data before encoding it in CurbLR. This allowed Shared Streets to provide more detailed information—down to pick-ups and drop-offs by 10 m segments of curb.
The open-source Mobility Data Specification (MDS) provides another way for cities to digitally communicate curb rules ( 41 ). Regulations continually change, making real-time updates a desirable feature. Lacuna Technologies, a Palo Alto-based company, is exploring curb-specific use cases for the MDS policy and geography application programming interfaces (APIs). An API provides a platform where cities can continually broadcast curb regulations in machine-readable format. Shared mobility devices, ridehailing vehicles, or smartphone applications could then query the API for the rules and respond to real-time changes in parking availability or time limits. Lacuna staff stressed the importance of open sourcing data standards to enable cities and companies to log issues and collaborate on solutions. Expanding the use of these standards could promote clarity and consistency in curb regulations, while allowing cities to update their rules in real-time.
New Curb Uses
Green loading zones (GLZs): GLZs designate curb space for fuel-efficient or zero-emission vehicles. To encourage commercial companies to adopt electric fleets, NYC in planning to pilot GLZs reserved for electric commercial vehicles. They studied a potential GLZ pilot program and concluded that it could prove as effective as cash subsidies for fleet electrification ( 42 ). Fleet managers said that GLZs could lower operating costs by reducing parking fines, providing time-based delivery assurances, and reducing truck cruising time for parking.
Food pick-up zones: When restaurants closed to facilitate social distancing during the COVID-19 pandemic, several cities converted parking spaces into food pick-up zones, or outdoor dining areas. For example, Seattle installed more than 400 temporary three-minute food pick-up zones outside local restaurants. The city plans to make some of these zones permanent, and work with technology companies on navigation apps to guide customers there.
Shared micromobility storage space: The Los Angeles Climate and Equity plan recommends converting parking spaces to bike corrals or dedicated carshare parking ( 43 ). Arlington, VA has also created on-street scooter parking corrals in the curb lane, based on Populus’s heat maps of historic scooter parking events. Most cities charge scooter companies per ride or per scooter, but the city of Omaha is piloting a novel fee structure based on parking sessions. In collaboration with the digital payments company Passport, the city plans to set rates based on geographic area. The proposal involves geofencing curb zones on three levels to balance the distribution of scooters across the city. In “green” zones, the city will provide incentives for companies to drop off scooters; in “yellow zones” it will require devices to be moved within two or three hours; and “red” zones will be auto-enforced for no drop-off, with significant fees for violations.
Smart Parking Reservation
Smart parking reservation technologies allow drivers of trucks, passenger, on-demand delivery, or TNC vehicles to find and reserve available parking spaces through an app or website. These technologies save time, reduce double parking, and curtail cruising for parking and consequently vehicle miles traveled and associated emissions.
San Francisco-based curbFlow ( 44 ) has established an app-based loading zone reservation system for commercial vehicles. In a 2019 pilot, DDOT replaced parking spaces at nine locations with curbFlow zones for 12 weeks. Delivery trucks or private vehicles “acting in a commercial manner” registered with curbFlow to use its mobile app for free. They could reserve a curb space 30 min in advance by checking into the app. The number of vehicles double parked in the study area dropped by 64%, and 85% of drivers rated their satisfaction with the system at least a 9 out of 10 ( 45 ). In a 12-month Columbus pilot completed in June 2020, curbFlow collected freight operator data and partnered with the city to designate eight loading zones in delivery hotspots. Around 90% of participating drivers worked for on-demand delivery services such as DoorDash or GrubHub, and 83% of them reported saving at least 2 min per pick-up or drop-off. From driver surveys, curbFlow estimated that the pilot prevented 9,700 illegal parking events ( 46 ). The cities have not yet released an independent report verifying these benefits.
Currently, the curbFlow reservation system relies on city staff for enforcement, a financial challenge for cities. In response, the company developed an enforcement app that alerts police officers if an unauthorized vehicle parks in a curbFlow space, and hired curbspace “ambassadors” who inform users of regulations. However, some planners interviewed in this study were concerned how this solution scales beyond a few blocks, and say that curbFlow must take on more responsibility for enforcing violations in the zones to make the concept financially feasible for cities ( 47 ). CurbFlow’s “ambassadors” have no authority to write tickets. The company says that it cannot currently take on a broader enforcement role, but suggests that better signage, higher fines, and branded barricades can enhance the visibility and authority of loading zones.
Recently, other technology companies have launched smart parking and reservation services. Lacuna offers a digital platform that allows cities to remotely allocate reservable curb spaces, automate enforcement, and communicate policies. Cleverciti debuted a sensor-based smart parking system for 770 parking spaces in Cologne, Germany, as part of a Smart City initiative aimed at reducing transportation emissions. Drivers receive occupancy information and directions to the nearest open space from dynamic messaging signs and a mobile app. In June 2020, Coord chose four cities for a “smart zones” pilot of a reservable, app-based commercial vehicle loading zone program ( 48 ). The selected cities expressed willingness to charge fleets for using the zones in the future.
Many city authorities interviewed expressed a need for automated enforcement and revenue-collection enhancements to reservation services, but these features are still in early development. Cleverciti has developed a battery-powered, credit card-sized device that freight operators can obtain when they register for permits to use commercial loading zones. The card will be placed in the vehicle, and when a driver stops, it activates and transmits credentials (such as license plate number, driver name, and carrier) to a city database. Using this technology, cities can charge vehicles for parking by the minute, or check for time-of-day or zone-based restrictions on the vehicle’s parking privileges. In the future, Cleverciti sensors could also flag vehicles over 22 ft without a card and transmit this information to parking enforcement officers via apps or handheld devices. This technology has limited potential for on-demand delivery vehicles, as it is difficult for sensors to distinguish cars used for commercial purposes from other passenger vehicles.
Curb Management Evaluation
Staff from nearly every city said that their curb metrics are not always quantitative and are often based on intuition or institutional knowledge. City authorities most commonly rely on ticket and parking meter data, which does not capture the full spectrum of pick-up and drop-off activity.
Phoenix, Houston, and other cities with a more traditional approach to curbspace management valued surveys, feedback from adjacent business owners, and data on economic activity. A parking strategist at the City of Phoenix said the city’s curb management approach is highly uncoordinated and decentralized, based on complaints from businesses and the revenue performance of individual parking meters. Cities including Boston, Columbus, Bellevue, Seattle, Washington D.C., and NYC reported seeking a more quantitative approach to evaluating curb performance. In general, these cities were more likely to describe their curbspace management approach as “data-driven,” and reported more pilots and partnerships with technology companies.
Table 2 presents a comprehensive list of metrics developed to date for evaluation of curb management pilots and policies, along with the corresponding data sources, and cities or technology companies collecting those data. These metrics are compiled based on the conducted interviews, existing literature, and reviews of pilot projects implemented by cities in the study. They include both longstanding methods, such as manual data collection, and emerging data sources. Cities may select the most relevant metrics for assessing the effectiveness or efficiency of their programs based on their goals for curb management strategies and in the context of their broader transportation initiatives.
Metrics for Evaluating Curb Performance
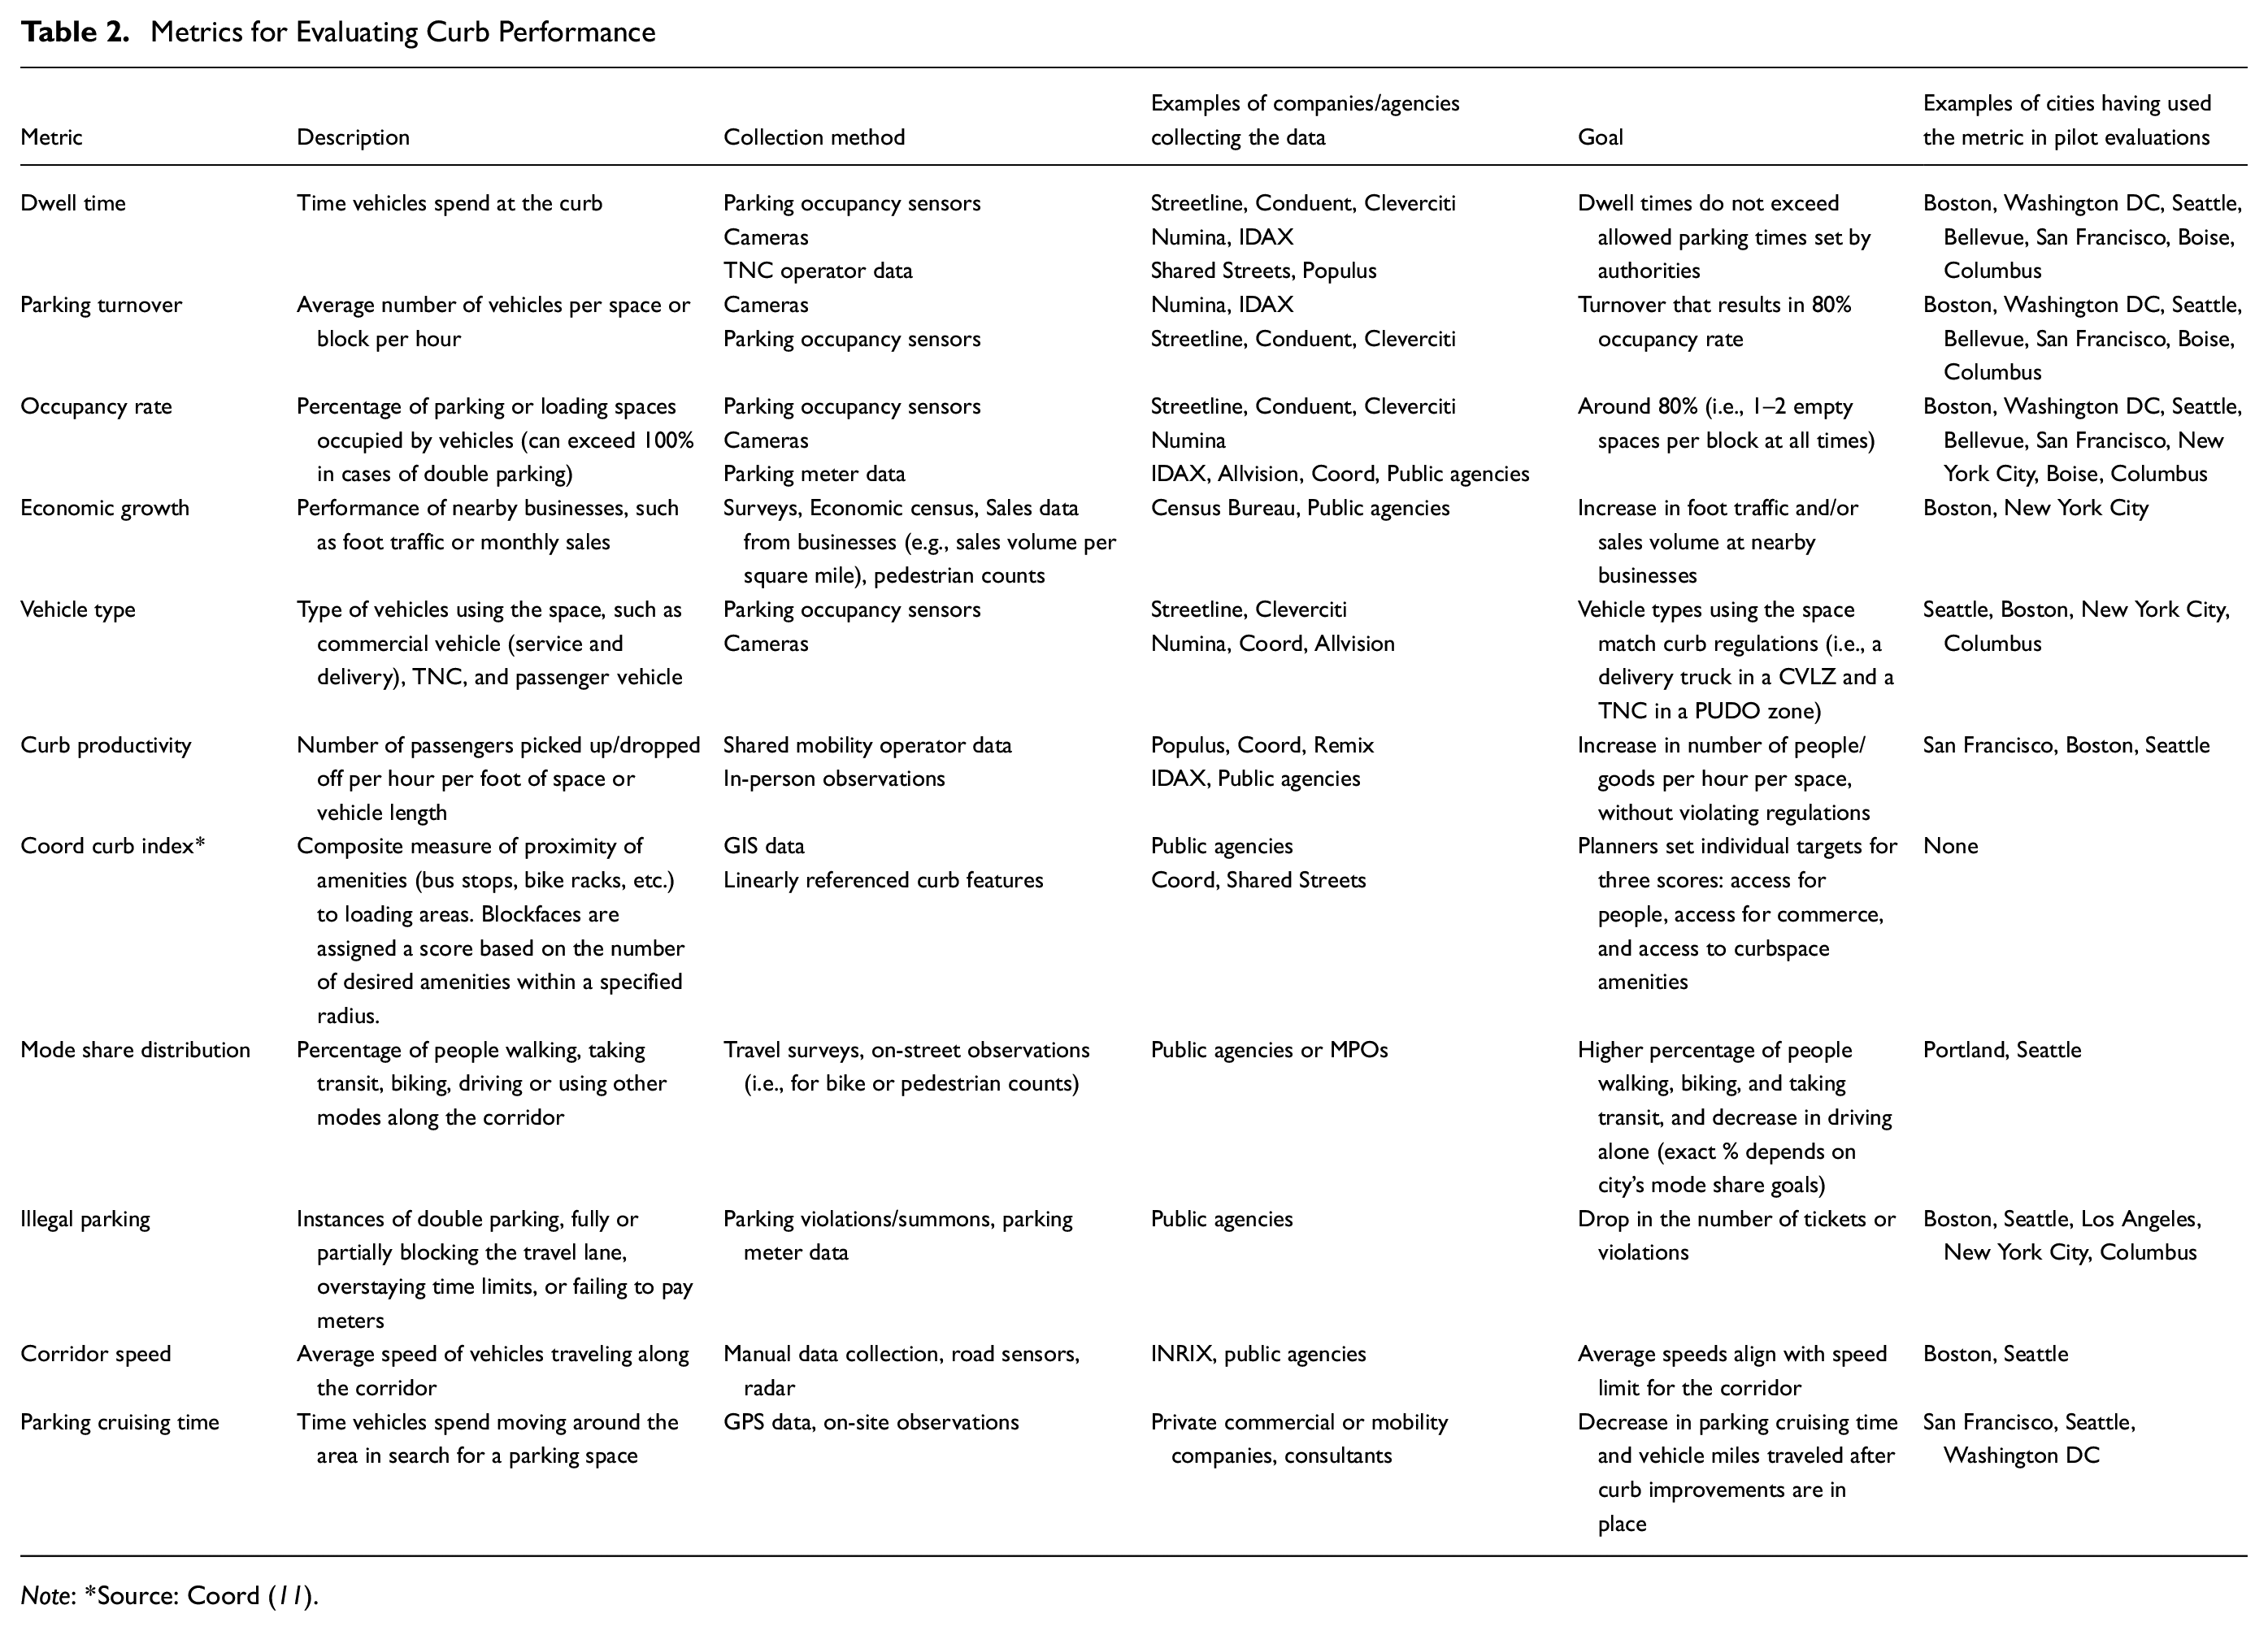
Note: *Source: Coord ( 11 ).
Conclusion
Regardless of city size or location, staff at most agencies reported similar challenges and goals for their curbspace. Many of the cities in the study lacked measurable, citywide policy goals for curbspace performance. Staff at cities nationwide described their curb management processes as “disjointed,” decentralized,”“ad hoc,”“reactive,”“complaint-based,” and replete with “competing interests” and “tension,” and noted challenges with integrating the goals and functions of the myriad departments that manage the curb. Every city in the study struggled to provide consistent enforcement, limiting the effectiveness of pilot programs. Cities faced similar perceived threats to their parking meter revenue from replacing on-street parking spaces with flexible curb uses. Some wished to resolve this issue through enforcing automated payments for short loading and unloading events. As curbspace grows more dynamic, with rules changing weekly or even hourly, cities expressed needs for continuously updated digital inventory and real-time communication with operators. We observed great diversity in the technological sophistication and regulatory flexibility of each jurisdiction.
While real-time curb management technologies are undergoing rapid prototyping and development, the majority of cities still manage their curbs through traditional methods, such as manual data collection, ticketing, and periodic surveys. Some public agency staff viewed the present offerings of curb technology companies as inaccurate, prohibitively expensive, or unfit from a legal or procurement standpoint. There are also legal barriers; for example, some cities, including Seattle and Minneapolis, maintain prohibitions against camera technology or license plate recognition. However, most cities expressed a willingness to collaborate with technology companies in the future to automate data collection, communication, enforcement, and payment.
Increasing reliance on private companies presents additional challenges for cities, including equity concerns. For example, it may enable users with access to smartphone apps or automated parking technologies to gain greater access to curbspace than those without these advantages. Furthermore, because some of these companies partner with or receive their curb data from TNCs or shared mobility providers, they might have a bias toward promoting use of the curbspace for those modes over other modes that are favored by lower-income users or prioritized in a city’s modal plans, such as buses or paratransit. Ceding control of curb data to private vendors also poses the problem of “vendor lock-in” or the city government becoming too dependent on one company.
The public and private sector staff interviewed shared a common set of themes that define successful curbspace management pilots and policies:
Continuous and aggressive enforcement of new loading zones or experimental uses. Clear communication to the public should occur early and frequently.
Providing exclusive loading spaces can encourage changes in operations: Cities reported success in obtaining data from operators in exchange for offering them additional loading space. Reserving space for low-emission vehicles or other priority uses can be as valuable to operators as cash subsidies in prompting them to make changes to their fleets accordingly.
Adoption of open-source tools and technologies. A consistent, nationwide data standard for publicizing the ever-changing rules and location of curb assets would benefit both public agencies and the private sector. Open-source technologies allow cities and companies to log issues and collaborate on solutions.
Engagement with parking violators: Illegal behavior is often symptomatic of operational or regulatory failures at the curb. Agencies that engaged parking violators through focus groups and surveys, and adjusted their regulations in response, often saw the greatest improvements to curbspace issues.
Automated systems to enforce and monetize passenger/goods pick-up and drop-off. This approach would recover revenues at the curb, save staff hours, and ensure that users have up-to-date information on regulations.
The curb is a dynamic space that encourages experimentation. Emerging technologies and data standards offer more consistency among cities, yet no single approach works for every municipality. Gaining a better understanding of public and private sector challenges and capabilities in this space will encourage collaboration and innovative technology and policy solutions that result in mutual benefits and more efficient curb management. The findings from this study can be used to develop a set of best practices that complements existing doctrines by providing more guidance on technology requirements and collaboration between public and private sectors.
Future interview-based research on curbspace management could expand on the conclusions of this study by examining the tensions between various stakeholders and assessing whether some of these tactics, such as automated parking systems or more aggressive enforcement, are feasible or desireable for cities. A more structured, survey-based approach with a larger sample of cities could also enrich and reinforce the conclusions presented here. In addition, although this paper has outlined metrics for evaluating curb performance as a starting point, future research is needed to detail the benefits and drawbacks, data collection and technology requirements, and effectiveness of each metric. Finally, it would be beneficial to compare and contrast curb management practices in the U.S.A. with those in other countries.
Footnotes
Acknowledgements
The authors would like to thank interviewees for their generous contributions of time and information. The authors also thank Pacific Northwest Transportation Consortium (PacTrans) for funding the study.
Author Contributions
The authors confirm contribution to the paper as follows: study conception and design: A. Ranjbari, A. Goodchild; data collection: C. Diehl, A. Ranjbari; analysis and interpretation of results: C. Diehl, A. Ranjbari; draft manuscript preparation: C. Diehl, A. Ranjbari, A. Goodchild. All authors reviewed the results and approved the final version of the manuscript.
Declaration of Conflicting Interests
The author(s) declared no potential conflicts of interest with respect to the research, authorship, and/or publication of this article.
Funding
The author(s) disclosed receipt of the following financial support for the research, authorship, and/or publication of this article: Pacific Northwest Transportation Consortium (PacTrans).