
Abstract
Ridepooling is a new mobility service mainly for people in cities and urban areas. By matching the routes of customers with similar start and end points while driving in an optimally pooled manner, meaningful reductions in road traffic and related emissions can be achieved. Such services must meet customers’ demands appropriately to achieve sustainable customer acceptance. Service providers face diverse customer expectations and prejudices that differ from those toward existing transportation modes. Today, most ridepooling trips are conducted with only one customer, confirming impressions of non-optimal operation. Using a survey-based approach, possible relevant constructs for the acceptance of and intention to use ridepooling services are analyzed. Testing constructs from the Unified Theory of Acceptance and Use of Technology 2 and environmental awareness, partial least squares analysis was performed with the software SmartPLS to investigate a dataset of 224 respondents. Results suggest that attitude toward use, perceived usefulness, and performance expectancy have an influence on the behavioral intention to use ridepooling services. In contrast, environmental awareness, price value, and effort expectancy do not have such an influence. The study expands the literature about customer acceptance of ridepooling service as well as new mobility services in general. Further, the paper provides research implications and recommendations for the development and implementation of the ridepooling concept for service providers.
Alongside the overall growth of the world’s population, the share of people living in urban areas has been increasing rapidly and is expected to reach 66% by 2050 ( 1 ). People’s needs for individual transport have led to an increased demand for mobility, especially in cities. The term urban mobility describes passenger movement within the city environment. Besides private vehicle ownership and public transport, people can choose mobility-as-a-service, for example, taxi, carsharing, or bikesharing to carry out their daily activities. Mobility-as-a-service can be defined as a linkage between public and private transport operators and predicts the integration of tools, for example, mobile applications, and services a traveler needs to conduct a trip ( 2 ). Emerging developments such as digitalization, high-speed computing, location data, accurate sensors, wireless connectivity, social media expansion, and new pricing schemes have enabled so-called new mobility services, a subcategory of mobility-as-a-service ( 3 ). The following new mobility services are relevant in this context. Carsharing involves users paying money based on the required time or distance when renting a car. Ridesharing (or carpooling) involves a private vehicle being shared by individuals traveling together from similar starting points to similar destinations, organized by an intermediary company or an informal system of users. Ridehailing involves a passenger determining the trip’s start and end point and demanding a transport service offered by a professional or part-time driver. Ridepooling (or shared ridehailing or ridesplitting) involves users hailing a shuttle to designated pick-up points near their location such that passengers with similar routes are matched and transported together in one vehicle ( 4 ). This study focuses on ridepooling services from designated pick-up points near customers’ locations, ordered through a mobile application.
As urban areas face a multitude of traffic-related challenges such as high emissions, poor air quality, large traffic volumes, and constant congestion, new mobility services can contribute to a reduction in road traffic and its negative impacts ( 5 ). The total number of driving and parked vehicles can be reduced because the use of shared transportation partially substitutes private car ownership, consequently reducing traffic density, travel cost and time, fuel consumption per person, and air pollution ( 6 , 7 ). The different new mobility services can help to satisfy various mobility needs, whereas typical users of these services are described in a rather consistent manner. Most users are characterized as young low-to-middle incomers, who are city dwellers with limited or no access to a private vehicle ( 8 , 9 ). The reasons for the non-availability of private vehicles are most often cost-related but also environmental aspects ( 8 ). In the case of a high utilization of ridepooling vehicles, the reduction of the number of vehicles on the road as well as the distances covered are particularly higher, compared with other new mobility services. Theoretically, ridepooling offers economic, environmental, and societal benefits ( 10 – 13 ).
Despite the high potential for ridepooling services to satisfying the mobility needs of city dwellers while reducing environmental effects, the service is still scarcely used. Besides political and bureaucratic reasons (e.g., concessions and passenger transport laws), a notable barrier to general use appears to be the acceptance and the ultimate usage by city dwellers themselves ( 14 , 15 ). For instance, the German provider Berlkönig had 410,000 users in the first six months of operation in Berlin (January–June 2019) with passenger pooling, achieved in 44% of the trips. As only one passenger undertook every second trip, the demand was too low for appropriate pooling of users ( 16 ). As to the environmental effect of ridepooling, one critical factor is the mode of transport the ridepooling customers usually use. According to Schaller ( 17 ), in American cities most users switch from non-car modes to shared rides, increasing overall vehicle mileage. Providers themselves ( 18 ) also acknowledge resulting negative impacts. These circumstances demonstrate that the theoretical benefits of ridepooling can only be achieved if the usage is sufficiently high and there is a large demand.
Quantitative studies have helped to identify the pertinent critical success factors for acceptance models. The most used and established models are the technology acceptance model (TAM) ( 19 ) and the Unified Theory of Acceptance and Use of Technology 2 (UTAUT2) ( 20 ). Sonneberg et al. ( 15 ) investigated the acceptance of potential ridepooling customers in Germany, finding that perceived compatibility had the highest impact on (potential) customers’ behavioral intention (BI) to use ridepooling services. However, as no other scientific studies focusing on the acceptance of potential ridepooling customers have been conducted so far, the field lacks further empirical evidence. Guided by the future research direction of Sonneberg et al. ( 15 ), this study empirically tested new constructs, namely environmental awareness and constructs from the UTAUT2 to receive a more detailed view about critical success factors for ridepooling services.
With the extension of new constructs and the collection of new empirical data, a more precise and sustainable understanding of the acceptance of ridepooling can be achieved. The study extends the scientific literature about relevant acceptance factors and provides new insights to the emerging transport service of ridepooling. The results are presented and compared with prior acceptance studies in new mobility services contexts. The conducted survey reveals important insights for the business model of ridepooling, and presents practical recommendations for ridepooling providers. Such an investigation can lead to further development, for example, of appropriate marketing activities (21). The following research questions guide the approach:
What are significant relationships among customers’ intention to use ridepooling services, environmental awareness, price value, performance expectancy, effort expectancy, and other related variables?
What recommendations can be drawn from these relationships for ridepooling providers?
The paper is structured as follows: The next section provides theoretical foundations of the study. Afterwards, the underlying hypotheses are derived. Next, the methodology is described, followed by the presentation of the empirical analysis and its results. The findings are discussed, and recommendations and implications for academics presented. The discussion reflects on the study’s limitations, giving indications for further research, before the paper is summarized within the concluding remarks section.
Theoretical Foundations
In the scientific literature, TAM is the most cited model for investigating the acceptance of an innovation ( 19 ). TAM is an adaptation of the theory of reasoned action originally developed by Fishbein and Ajzen ( 22 ) to predict human behavior. It aims to explain and predict individual actions by assuming that people behave rationally and make use of all available information ( 22 ). Davis ( 23 , 24 ) adapted the ideas of the theory of reasoned action to acceptance research in information system contexts and used it to explain the relationship between individuals’ reactions to using a technology, their intention, and actual usage ( 25 ). TAM relies on BI to predict actual behavior and focuses on the identification of critical success factors for adopting an innovation or technology ( 26 ). Both TAM and the theory of reasoned action are based on individual beliefs, which determine attitudes toward a technology in a given situation ( 27 ). These beliefs are internal psychological variables that function as mediators of all external variables, which may also affect the usage of an innovation ( 28 ). Therefore, beliefs have an indirect effect on BI ( 23 ). In TAM, beliefs consist of the two interacting factors of perceived usefulness (PU) and perceived ease of use (PEOU). TAM also covers the motivational variables that lead to actual system usage, reflecting a tendency that arises at the very beginning of contact with the innovation, which enables researchers to measure the acceptance of an innovation at an early stage ( 23 ). UTAUT2, on the other hand, was originally proposed as a theoretical advancement over existing theories concerning user acceptance and adoption behavior in the course of technology usage in an organizational context. Therefore, Venkatesh et al. ( 25 ) reviewed, mapped, and integrated factors from eight theories, for example, TAM and the theory of reasoned action. By conducting a comprehensive synthesis and integration of these theories, UTAUT2 is a new model in the area of information technology (IT) adoption and diffusion, which facilitates the examination of a user’s intention to use a system and their actual usage behavior. In the course of the development of UTAUT, Venkatesh et al. ( 25 ) operationalized the following four constructs serving as independent variables and direct predictors of user’s BI to use a technology and usage behavior: performance expectancy, effort expectancy, social influence, and facilitating conditions. While UTAUT was developed to explain user acceptance and adoption behavior in an organizational context, UTAUT2 explains consumers’ acceptance of technology and adoption behavior outside of organizational contexts. Venkatesh et al. ( 20 ) extended the original UTAUT model by integrating three additional constructs, namely hedonic motivation (HM), price value (PV) and habit (HT).
In the past, several researchers examined acceptance factors and rationalities for the usage of new mobility concepts. Al-Ayyah et al. ( 29 ), for example, modeled the demand for shared-ride taxi services. Their study revealed that subjective factors like attitudes toward usage (ATU) positively affect attitudes toward ridesharing services ( 29 ). The study of Lavieri and Bhat ( 30 ) set another focus and examined willingness to share and investigated the adoption of shared rides. Hou et al. ( 31 ) investigated the willingness to pool in ridehailing trips with linear regression and machine-learning models. They found that the willingness to share rides is at first a time–cost tradeoff. Alonso-González et al. ( 12 ) examined the value of time and reliability for urban pooled on-demand service. With an experimental approach, they found that the value of time for pooled on-demand services ranged from 7.88 to 10.80 euros per hour. Another study, by Kostorz et al. ( 32 ), from an online survey of almost 12,000 respondents, found that ridepooling is mainly used for occasional trips and during the evening and night. However, these studies did not use TAM or UTAUT2 as the underlying theory for their examinations.
TAM and UTAUT2 can be employed to quantify customer behavior. This can be achieved if these theories are expanded by different additional constructs, for example, environmental awareness (EA), or contextual factors, which are expected to be relevant for the specific investigation case ( 33 ). TAM and UTAUT2 have been also used for conceptualization and measurement of acceptance in the mobility context. Osswald et al. ( 14 ) used the constructs of TAM and UTAUT and proposed an acceptance model focusing on car IT. Wang et al. ( 34 ) examined customers’ ridehailing acceptance with TAM, and Lee et al. ( 35 ) studied the acceptance of people traveling in autonomous vehicles with constructs borrowed from TAM and other theories. In the field of user analysis and acceptance studies, limited research using theoretical backbones like TAM or UTAUT2 is available on ridepooling, even though the long-term success of a ridepooling service depends heavily on customer acceptance. A holistic view and measurement of the acceptance on ridepooling was conducted by Sonneberg et al. ( 15 ). The authors applied TAM to investigate BI to use ridepooling services. In that German study, the strongest impact on such services was perceived compatibility, while perceived safety and PEOU were not relevant. This paper will expand the understanding of relevant acceptance factors for ridepooling, testing new constructs from UTAUT2 as well as EA.
Hypothesis Development
For the study, BI to use ridepooling services was chosen as one of the dependent variables for acceptance measuring. As described by Lee et al. ( 36 ), actual systems usage is difficult to measure, especially for new services, which are in the beginning of implementation. This statement also holds for the rather new service of ridepooling ( 15 ). However, actual systems usage can be approximated through BI, as several studies have found in different contexts ( 37 ). ATU affects BI to use services, because if people have a positive affect toward systems, then intentions to perform behaviors arise ( 38 ). For example, Giang et al. ( 27 ) examined the effects of the intention to adopt ridesharing applications in Vietnam, finding that ATU was a strong predictor of BI to use ridesharing services. In the case of ridepooling services, this leads to the following hypothesis:
H1: ATU has a significant positive influence on BI to use ridepooling services.
Usefulness is described as the subjective chance that using an information system will increase individual performance ( 24 ). PU can directly influence BI to use services. In Davis et al. ( 38 ), people perceived that they could increase their job performance by using specific information systems. In the case of on-demand car-related services, Kim et al. ( 39 ) examined the positive effects of PU on ATU for such services. A higher usefulness of transportation services was perceived, with a higher degree of ATU resulting in BI to use. The following hypotheses about PU of ridepooling services are proposed:
H2: PU has a significant positive influence on ATU ridepooling services.
H3: PU has a significant positive influence on BI to use ridepooling services.
PEOU is described as users’ expectation of how easy a system is to use ( 38 ). As described by Bandura ( 40 ), ease of use influences behaviors based on self-efficiency beliefs, and easier performance of activities strengthens self-efficiency ( 40 ). Previous work has assumed that PEOU influences the PU of services and innovations ( 41 ). Kim et al. ( 39 ) found a positive influence of PEOU on ATU for on-demand car-related services. Based on these statements and findings, the following hypotheses for PEOU in the context of ridepooling services are proposed:
H4: PEOU has a significant positive influence on ATU ridepooling services.
H5: PEOU has a significant positive influence on PU of ridepooling services.
Kahn ( 42 ) proposed a direct influence of a person’s environmental ideology and ideas on their behaviors. In a more recent study, Chen and Hung ( 43 ) suggested that high level of environmental knowledge is closely related to environmental behavior and awareness. Potential customers with high EA prefer to use green products and services ( 44 ). Wang et al. ( 34 ) found a significant positive relationship between EA and BI to use ridesharing services. Therefore, insofar as ridepooling services aim to reduce emissions and traffic in urban areas, such customers should value and use such services more highly, leading to the following hypothesis:
H6: EA has a significant positive influence on BI to use ridepooling services.
PV is defined as the “cognitive tradeoff between the perceived benefits of the applications and the monetary costs for using them” ( 20 : 161). Clewlow and Mishra ( 4 ) revealed that the price of parking in cities is one of the most common reasons for using ridehailing services instead of personal driving. König et al. ( 45 ) noted the high relevance of fares in a ridepooling context with conjoint analysis. Consequently, the PV for mobility services plays an important role for BI to use mobility services. Thus, customers of ridepooling services can also be influenced by their perceived PV in their BI to use such services. As result, the following is assumed:
H7: PV has a significant positive influence on BI to use ridepooling services.
According to Venkatesh et al. ( 25 : 450), effort expectancy (EE) can be defined as the “degree of ease associated with the use of the system.” Most recently, Bernard et al. ( 46 ) examined an automated public transport context, finding that EE does not have an influence on BI to use such services. The effort required to use a service can influence BI to use a special service, positively or negatively. Concerning ridepooling services, a positive EE influences BI to use ridepooling. As a result, the following is proposed:
H8: EE has a significant positive influence on BI to use ridepooling services.
In UTAUT2, performance expectancy (PE) is a driver for BI to use systems. It is defined as the “degree to which an individual believes that using the system will help him or her” ( 25 : 447). Fleury et al. ( 47 ), for example, used the UTAUT and its constructs to measure the acceptance of car sharing acceptance factors. Their study revealed that PE is a strong predictor for BI. With regard to ridepooling service, significant PE can also influence BI to use them. For potential customers, ridepooling services can help to achieve expected transportation, for example, to train stations, thus:
H9: PE has a significant positive influence on BI to use ridepooling services.
All the developed hypotheses are visualized in the following proposed structural model (see Figure 1), which serves as the basis for the quantitative examination.
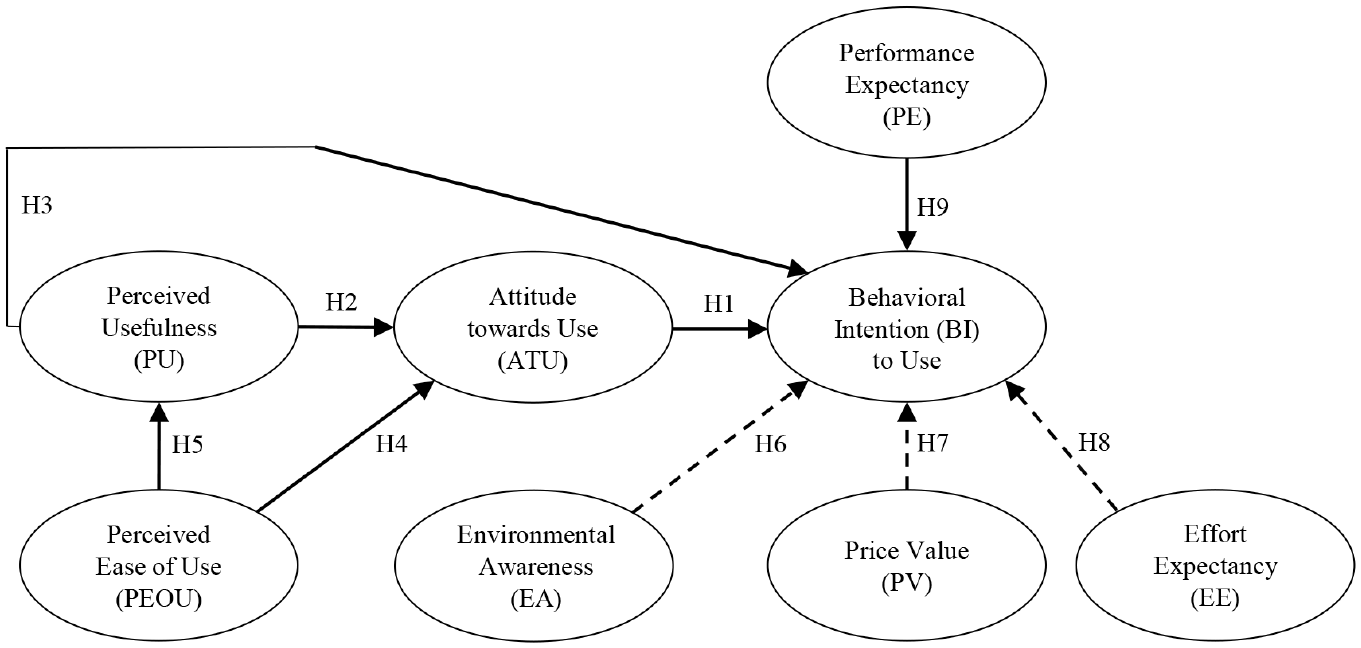
Proposed structural model and hypotheses.
Methodology and Data Collection
The research model and the hypotheses were tested using data collected from an online survey conducted via the open-source survey software LimeSurvey. The survey questionnaire was distributed on social media pages like Facebook and LinkedIn, internal social media platforms from the authors’ university, and e-mail through the authors’ transportation research network to collect a new dataset with respondents of (potential) ridepooling customers. Data collection for this study was conducted from May 2019 to June 2019. From the beginning of 2018, there was an increasing number of ridepooling providers in Germany, allowing respondents to get to know the service and potential customers to use it.
A short introduction to the topic of ridepooling services was presented to ensure similar levels of understanding of the service. A consistent understanding of the research objective raises the interest of the respondents, which can reduce non-response bias ( 48 ). Demographic information was collected on aspects such as age, gender, and usage of ridepooling services. Confidentiality and anonymity were guaranteed with a statement of the responsible usage of the data for research purposes ( 49 , 50 ). With this procedure, the researchers were able to build trust of the survey respondents to ex ante reduce the probability of non-response bias in participants’ answers because of theory-in-use prejudices ( 48 – 50 ).
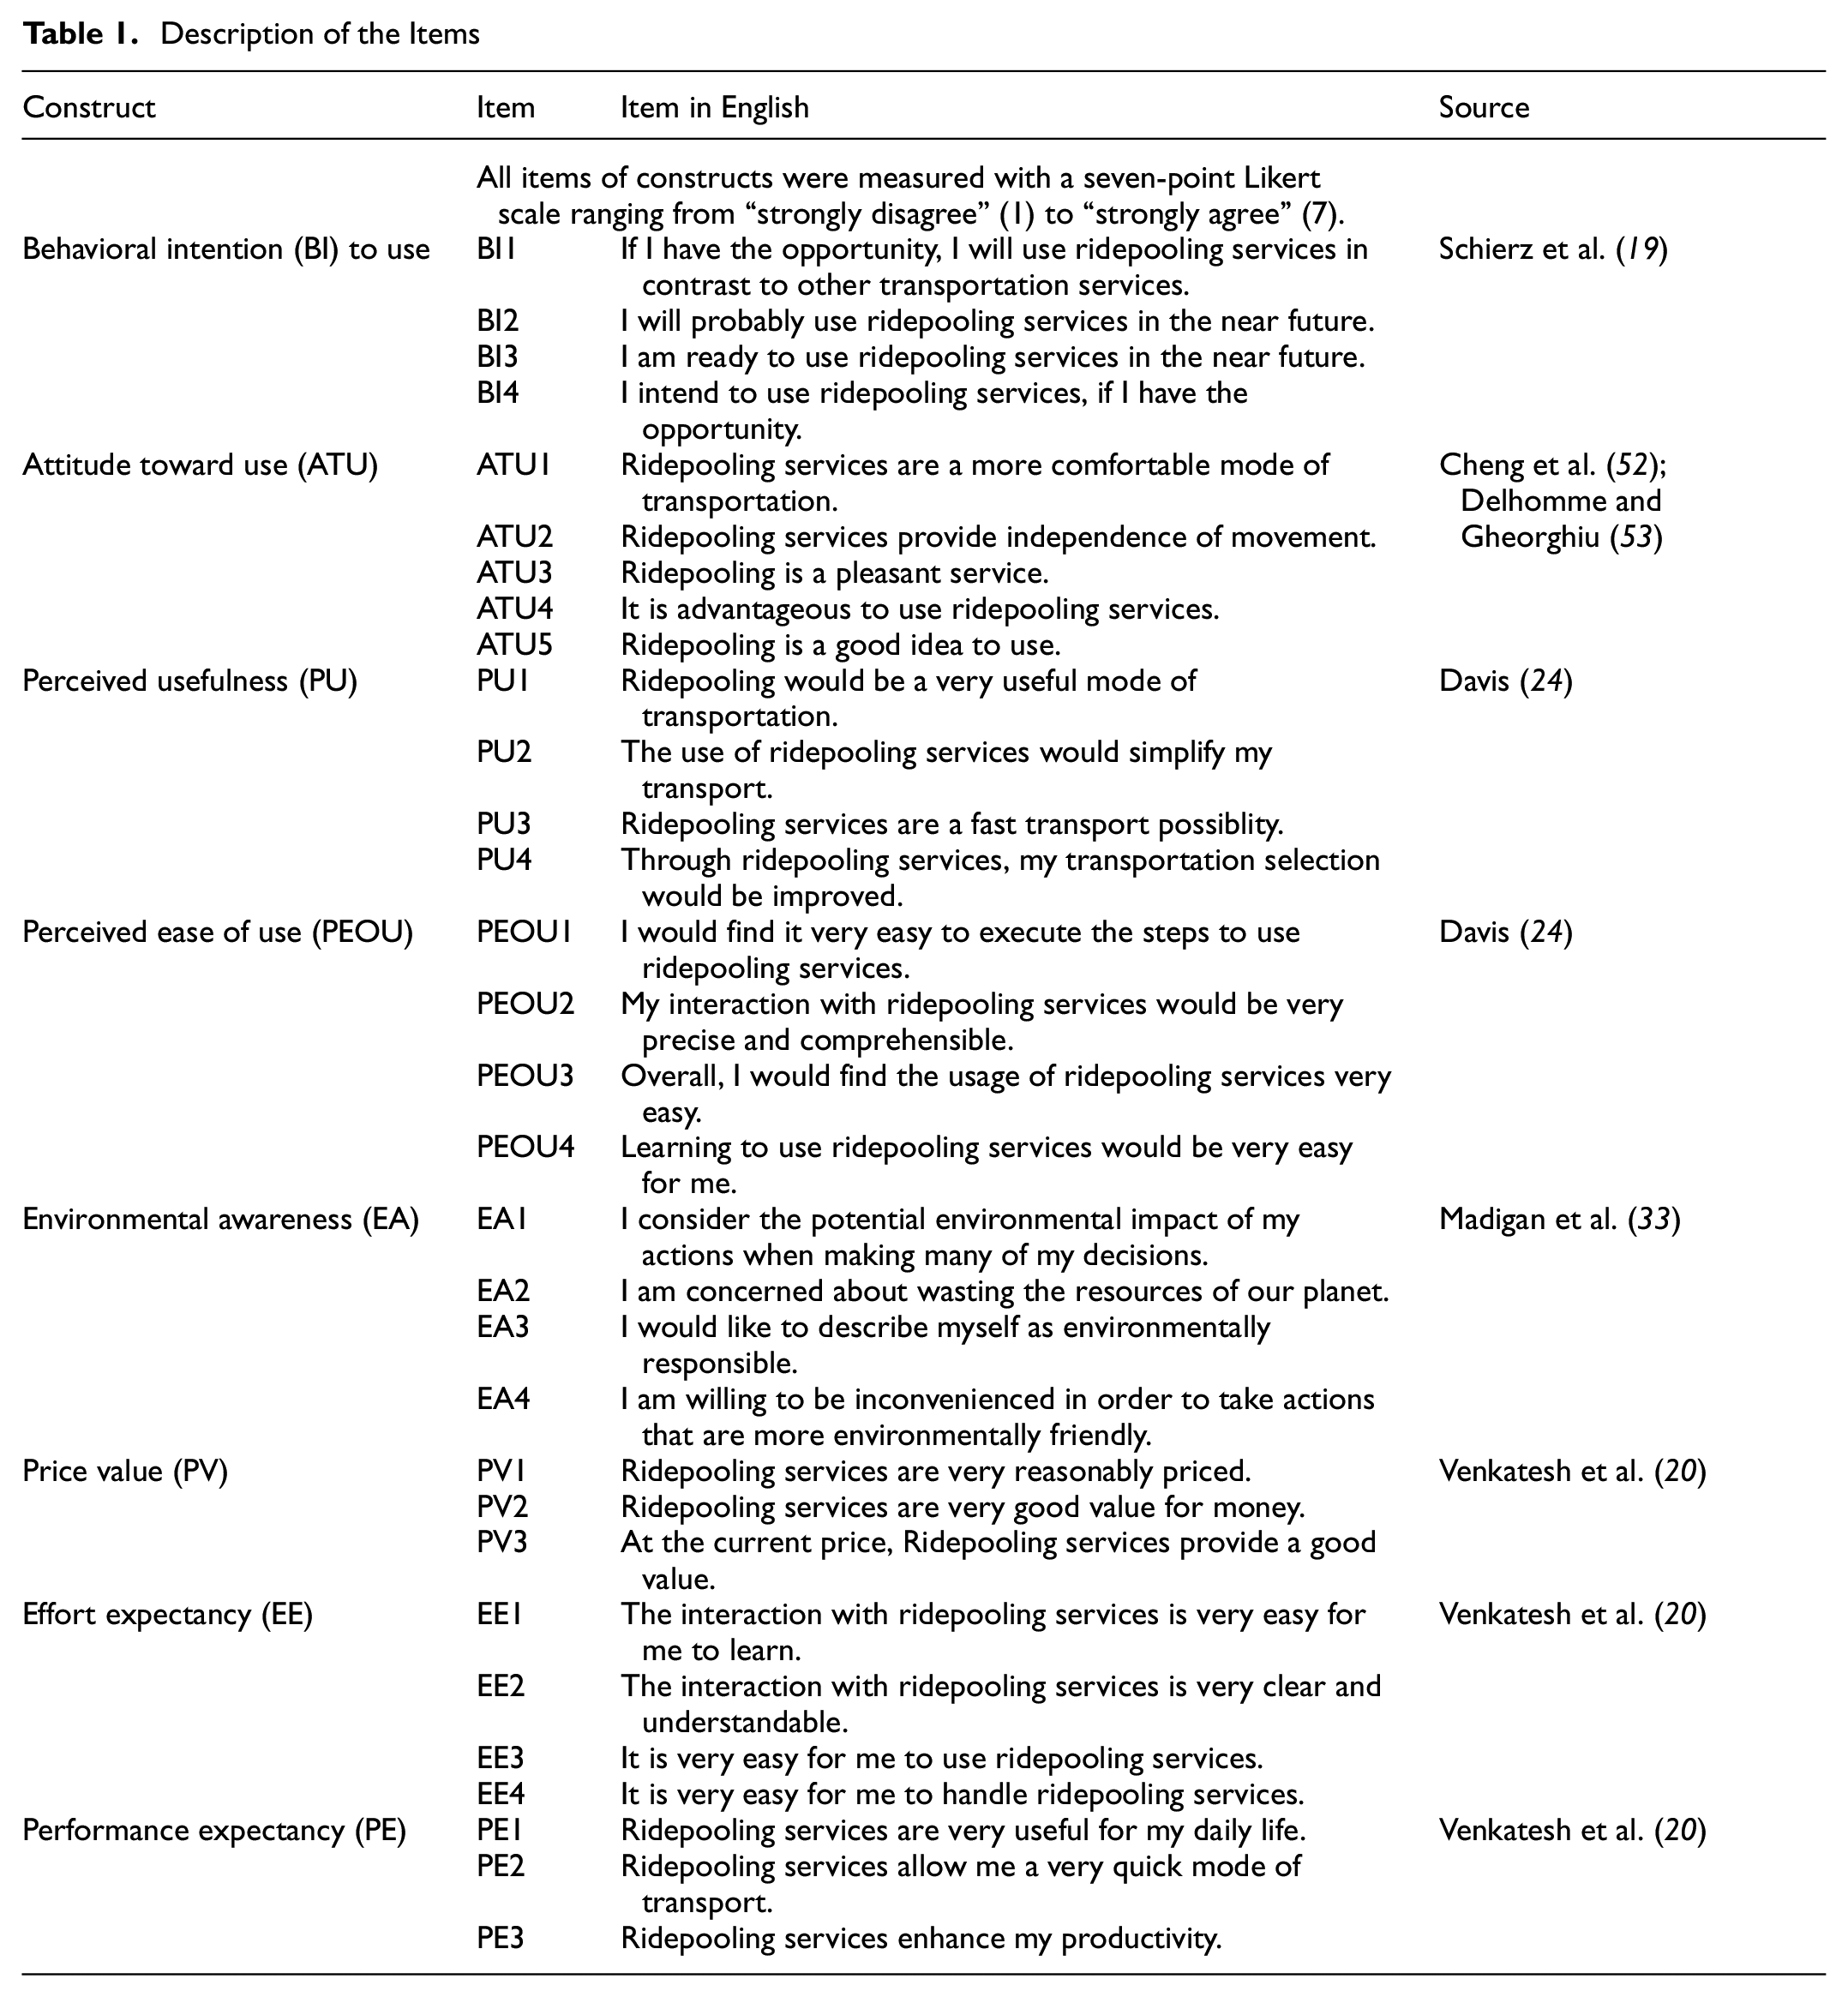
All construct items were measured on a seven-point Likert scale ranging from “strongly disagree” (1) through “neutral” (neither disagree nor agree) (4) to “strongly agree” (7). Item scales for measuring the dependent and independent constructs were carefully designed based on existing scales used in different validated publications ( 50 ). The items from Sonneberg et al. ( 15 ) were used for the constructs of ATU (five items), BI (four items), PEOU (four items), and PU (four items), which were already adapted to the ridepooling context. Furthermore, four items for the construct of EA were adapted from Madigan et al. ( 33 ). Three items for PV, four items for EE, and four items for PE were used from the Venkatesh et al. ( 20 ) UTAUT2 model and adapted to the ridepooling services context. Content validity was ensured by asking colleagues and doctoral students to identify potential problems with the phrasings of the questions, reducing common method variance in the implementation of the questionnaire ( 49 ). Because the survey was only distributed in Germany, all the questionnaire items were translated from their English sources into German, and the entire questionnaire was in German. Back-translation techniques were used to avoid translation bias ( 51 ). The underlying codebook with all items and sources can be found in Table 1:
Description of the Items
From the survey, 311 responses were collected. After identifying incomplete ones, 87 responses were deleted. In total, 224 complete responses were used for the analyses, representing an answer rate of 72.03%. The descriptive statistics (Appendix A.1) show a small majority of female respondents (126) over male respondents (98), and a majority of respondents (172) were between 20 and 29 years old. The participants were mainly students (157) with a monthly net income of less than 1,000 euros. The vast majority of respondents held a driver’s license (206), but only 123 had a car available. Most of the respondents lived in the city (144). With regard to ridepooling services, 124 respondents had already heard of them, whereas only 45 respondents had already used them. As potential reasons to use ridepooling services, the participants stated leisure activities (mentioned 93 times), travel to work (83), or travel to airports (127) (see Appendix A.1 in the supplemental material for all replies).
Results
Partial least squares structural equation modeling was performed. This was oriented on the guidelines of Hair et al. ( 54 ), who proposed that a sample size should be at minimum 10 times the maximum number of relationships at a dependent variable. Since BI to use ridepooling services is influenced by six constructs and the sample size is 224, partial least squares structural equation modeling is applicable. It is further appropriate for this analysis, because of the simultaneous testing of the measurement and the structural model ( 55 ). The software package SmartPLS version 3.3.2. was used for the empirical analysis. In line with Hair et al. ( 54 ), the structural equation modeling results were systematically analyzed with a two-step approach by (i) evaluating the measurement model. This is followed by (ii) the evaluation of the structural model which includes hypotheses testing.
The constructs’ Cronbach’s alpha values were first checked, with 0.6 as the lower bound for internal consistency reliability ( 54 ). The analysis found Cronbach’s alpha values ranging between 0.823 (PE) and 0.929 (PEOU and EE). The reliability and validity of the measurement model was evaluated by examining the factor loading of all items to the corresponding concepts. As suggested by Chin ( 56 ), all items with a threshold value of 0.7 and higher were included to investigate indicator reliability, which means that at least 50% of the variance is shared with the corresponding construct. Factor loadings ranged from 0.745 (PU1) to 0.947 (PV2) (see Appendix A.2 in the supplemental material for all factor loadings). All the composite reliability values of the constructs were over the threshold value of 0.7 as the upper bound for internal consistency reliability ( 54 , 57 ).
The values of average variance extracted were all above 0.5 ( 54 ), verifying the convergent validity of the data (see Appendix A.2 in the supplemental material). To check the discriminant validity of the dataset, the Fornell and Larcker criterion was used by comparing the square roots of the average variance extracted values with the correlations between constructs ( 58 ). All of them were higher than the correlations between constructs (see Table 2). Because of ongoing critical discussion of the Fornell and Larcker criterion (e.g., Voorhees et al. [ 59 ]), the heterotrait-monotrait ratio ( 60 ) was also investigated. The heterotrait-monotrait ratio is an estimate of the correlation between two constructs, with one indicating a lack of discriminant validity ( 60 ). In this case, the confidence interval of the heterotrait-monotrait ratio statistic was not one for any combinations of constructs, establishing discriminant validity. Table 2 presents the means, standard deviations, composite reliabilities, square roots of average variance extracted in bold face, and the correlations between all constructs.
Means, Standard Deviations, Composite Reliabilities, Square Roots of Average Variance Extracted, and Correlations between All Constructs
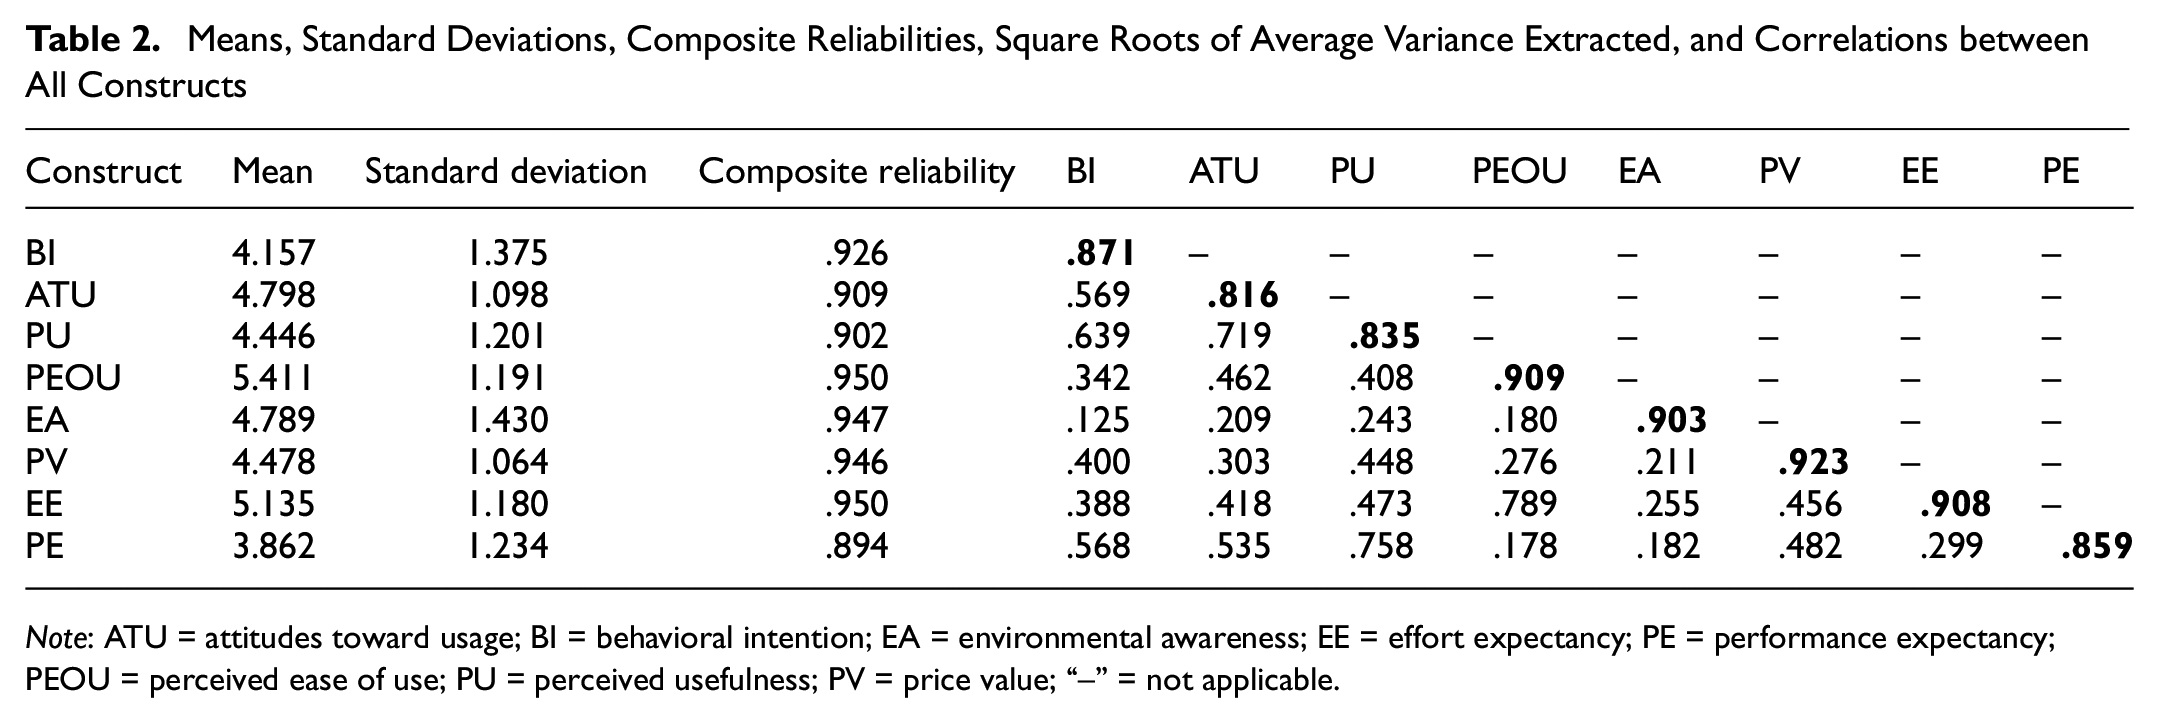
Note: ATU = attitudes toward usage; BI = behavioral intention; EA = environmental awareness; EE = effort expectancy; PE = performance expectancy; PEOU = perceived ease of use; PU = perceived usefulness; PV = price value; “–” = not applicable.
To evaluate the structural model, a bootstrapping procedure was performed with 5,000 replications ( 60 ), calculating the path coefficients and the coefficients of determination (adjusted R2). To test for multicollinearity, variance inflation factors were computed and they were found to be less than the conservative threshold of 5 ( 54 ), thus suggesting that multicollinearity is not a major issue in this study.
Relevant factors for the acceptance of ridepooling services were investigated by hypothesis testing. Three of the nine hypotheses were not significant (p-values ≥ 0.1) and six were significant (p-value < 0.1). Based on the results, it was found that ATU has an influence on BI to use ridepooling services (H1) (β = 0.23; p-value < 0.1). There was a high positive influence of PU on ATU (H2: β = 0.64; p-value < 0.001) and a positive influence of PU on BI to use (H3: β = 0.27; p-value < 0.1). PEOU has a high positive influence on PU and ATU for ridepooling services (H4: β = 0.20; p-value < 0.001 and H5: β = 0.41; p-value < 0.001). No significant influence of EA (H6: β = −0.06; p-value ≥ 0.1) on BI to use ridepooling services was found. No significant influence of PV (H7: β = 0.01; p-value ≥ 0.1) and EE (H8: β = 0.08; p-value ≥ 0.1) on BI to use ridepooling services was found. PE has a significant influence on BI to use ridepooling services. Therefore, H9 is supported (H9: β = 0.18; p-value < 0.1).
Concerning the endogenous variables, the adjusted R2 was 0.16 for the construct of PU, 0.55 for ATU, and 0.45 for BI; thus, the model explains 16% of PU, 55% of ATU, and 45% of BI. All the results of the path analysis and bootstrapping procedure are visualized in Figure 2.
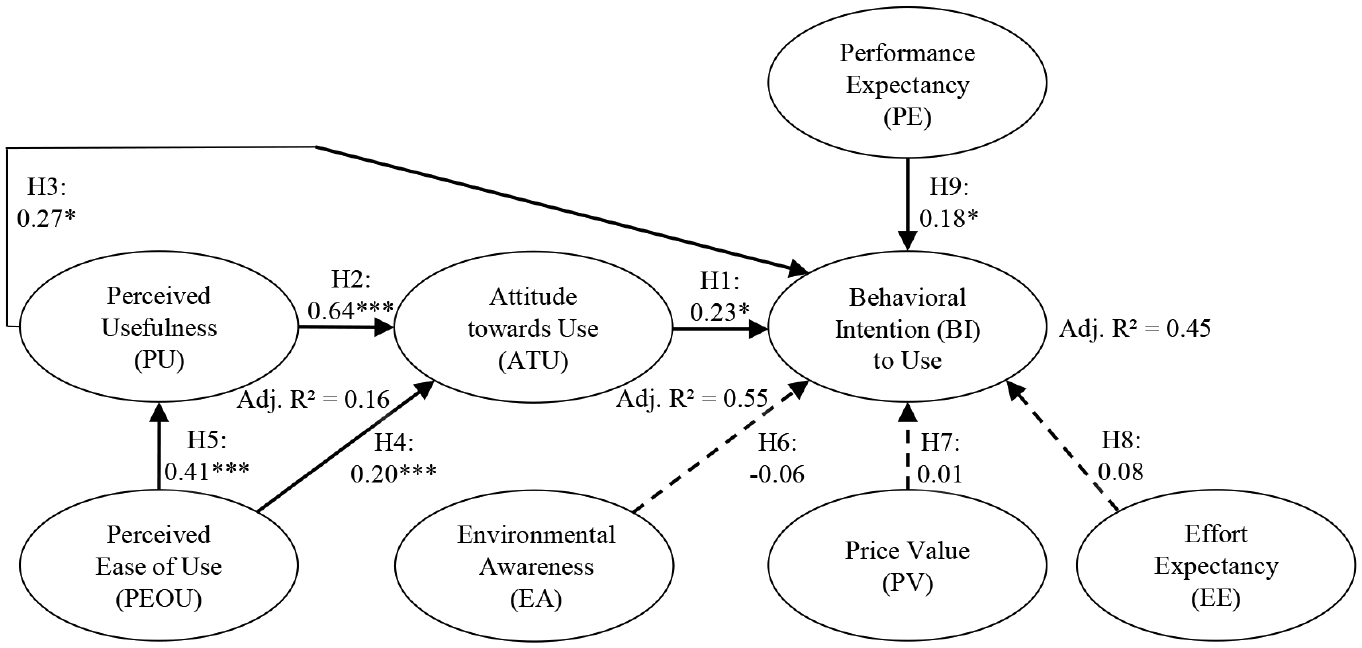
Results of the bootstrapping analysis for the structural model.
Discussion, Recommendations, and Implications for Academics
Based on these results, it is concluded that ATU has an influence on BI to use ridepooling services (H1). As this is one of the major relationships in TAM, this result is not surprising. Davis et al. ( 38 ) stated that people’s ATU for a service positively influences their behavior. As mentioned in the hypothesis generation section, Giang et al. ( 27 ) determined that ATU was a strong predictor of BI to use ridesharing services. The data in this study supports this relationship, indicating that customers’ ATU for a service is a prerequisite for BI to use that service. In line with this, Sonneberg et al. ( 15 ) found a strong effect of ATU on BI to use ridepooling services. However, as attitude is a critical success factor for BI to use services ( 38 ), ridepooling providers must affect customers positively with regard to their services, for example, through a clear communication of the benefits.
Consistent with Sonneberg et al. ( 15 ), a high positive influence of PU on ATU (H2) was found. In other words, higher PU of ridepooling services leads to a higher ATU for such services. A slightly, but still significant, relationship was found between PU and BI to use (H3), in contrast to Sonneberg et al. ( 15 ). These findings confirm that PU is an important factor in both ATU and BI to use ridepooling services, as indicated by some research, including Premkumar and Bhattacherjee ( 61 ). Therefore, to achieve continuous usage of ridepooling, providers must be aware about the PU of customers and deliver a service that is perceived as practical. This means to provide useful and accurate transportation services.
In contrast to Sonneberg et al. ( 15 ), it was found that PEOU has a positive influence on the PU and ATU for ridepooling services (H4 and H5). In this result, different results were obtained for this construct and its relationships. This study cannot confirm Lee et al.’s ( 36 ) partially identified doubtfulness of the construct of PEOU in the measurement of customer acceptance. However, it is in line with Giang et al. ( 27 ), who found a positive relationship of PEOU on ATU in a ridesharing context. For ridepooling providers, the current investigation implies that PEOU is a critical success factor for usefulness and the attitude toward ridepooling. Only if customers perceive ridepooling services easy to use, they will perceive a usefulness of this service and build up an attitude toward such services. Therefore, providers must be aware of the benefits of a simple and clear booking process (e.g., through a mobile application) as well as an intuitive and easily understandable handling.
No significant influence of EA (H6) on BI to use ridepooling services was found, in contrast to other researchers’ findings in the new mobility services context, for example, Wang et al. ( 34 ). Furthermore, Lo and Morseman ( 62 ) also argue that pooling services can be beneficial for the environment. The data in this study indicate that customers’ environmentally friendly inclinations are not significantly associated with the use of ridepooling services. In this dataset, most of the respondents were from the age group of 20 to 29 years (see Appendix A.1 within the supplemental material). It seems that this age group do not consider EA aspects in their decisions to use ridepooling services. A German study on door-to-door demand responsive transport in a rural area found that an environmentally friendly mindset of customers is negatively associated with willingness to pay (and in the end with the usage) for motorized transport ( 63 ). Luo and Nie ( 64 ) found, with an approximation approach, slightly positive environmental aspects of ridepooling services, as they are used as a feeder service to public transportation stations. With a higher awareness that ridepooling can have positive effects on overall traffic performance and in result lead to more efficient transportation services for customers and operators ( 64 ), an environmentally friendly view of the service should be achieved and thus attract more customers. This public relations measure could also attract customers to using zero-emission vehicles ( 65 ). Against these arguments, the findings of this study suggest that highlighting environmental aspects of ridepooling to the customer may not be beneficial for providers. Based on these contradictory results, a more detailed investigation of EA of ridepooling is necessary.
Further, no significant influence of PV (H7) on BI to use ridepooling services was found. This is surprising, as other studies (e.g., Chen et al. [ 66 ]) have found that this construct is relevant in the transportation context. As can be seen from the descriptive statistics (Appendix A.1), the respondents tend to use ridepooling for leisure activities, consistent with the study of Kostorz et al. ( 32 ), rather than for regular transportation (e.g., commuting). This led to the assumption that ridepooling is a service for short and occasional rides, whereas ridesharing is used for longer trips between cities. Ridesharing services feature higher prices and are affected by the price pressures of other transportation modes, like trains. The majority of the respondents in the sample were students, who already have discounted seasonal tickets for local transportation in the city, explaining why PV is not relevant to them for short and occasional trips. Most recently, Hou et al. ( 31 ) investigated the willingness to pool in ridehailing trips. They found that the willingness to share rides is primarily a time–cost tradeoff. Negative aspects associated with sharing rides with others are mainly of a secondary nature. These rationales can explain why PV is not a necessary construct, that is, a critical success factor for BI to use ridepooling services. Another possible reason for this non-significant relationship in the present study could be the isolated view on PV. General questions were asked with regard to the PV of ridepooling (see the items in Table 1). Against this, the study of Kostorz et al. ( 32 ) found that the decision of ridepooling could also be influenced by cost tradeoffs with parking costs for own cars in city centers. Such tradeoffs are not reflected in the present model. However, based on the data in this study, ridepooling providers should not exclusively focus on monetary advantages, but rather on the beneficial aspects of the transportation service itself.
The construct of EE does not have a significant influence on BI to use ridepooling services (H8), suggesting that higher or lower effort expectancies do not influence BI to use ridepooling. The perceived ease with regard to interaction and handling of ridepooling services seems not relevant for the intention, which is consistent with Bernhard et al. ( 46 ) in a mobility context. In contrast, EE was a strong predictor for BI to use mobile Internet ( 20 ). In the context of this study, arguably, a mobile application is necessary to book the ridepooling service and lead the customer to the next starting point. The mostly young respondents in the present dataset (20–29 years old) do not have any concerns about the effort to use ridepooling services. This can be interpreted as meaning that the booking process is intuitive for them, in other words, the need to use a mobile application is not a barrier for the acceptance of ridepooling. This view is supported by the study of Kostorz et al. ( 32 ), reflecting a very good review of the booking process from users of the German ridepooling provider MOIA. However, besides this insignificant relationship, ridepooling providers should always be aware that the booking process, for example, via mobile apps, should be easy, understandable, and achievable with minimal effort for the (potential) customers.
A low significant positive relationship of PE to the intention to use ridepooling services (H9) was found. In line with the literature, for example, Fleury et al. ( 47 ) in a carsharing context, PE is important for usage. Ridepooling services must fit into daily routines for the customer. Intuitively, they should allow quick and reliable transportation. As seen from the survey responses, the reasons for using ridepooling services mainly lay in transportation to nearest train stations, leisure activities, and for working proposes (see Appendix A.1 in the supplemental material). Ridepooling providers must focus on these aspects, that is, diverse purposes of usage, to achieve continuous acceptance and a sustainable business. This can help ridepooling providers to distribute customers across the whole day and would lead a better degree of capacity utilization, also suggested by Kostorz et al. ( 32 ).
Overall, the results indicate a lower adjusted R2 for the dependent variables (PU and BI) than those in Sonneberg et al. ( 15 ). There may be several reasons for this. The present sample differed from that of Sonneberg et al. ( 15 ), as fewer respondents in this survey had knowledge of ridepooling services (55.4%, as shown in Appendix A.1 in the supplemental material, vs. 67.0% [ 15 ]). However, both studies had similar percentages of participants who had not previously used ridepooling (79.9% in this study, as shown in Appendix A.1 in the supplemental material, vs. 79.0% [ 15 ]). A longer availability of ridepooling for customers makes other concepts for the acceptance of ridepooling important and calls for diverse examination of new concepts that differ from those in the present study and Sonneberg et al. ( 15 ). For ridepooling providers, arguably, consistent with academic research, a continuous observation of customer demands and wishes is necessary to examine the relevant acceptance factors for ridepooling services. This can be achieved through exploratory questionnaires before and after trips, for example, in the booking process within the mobile application.
With regard to the composition of the sample in this study, opinions were collected from mostly young respondents (age 20–29). The study of Kostorz et al. ( 32 ) reveals a more diverse view on ridepooling users, finding that the 20 to 39 age group represented 49% of the user population for ridepooling services. Compared with this, non-users of ridepooling seem to be in the age groups of 50 and older ( 32 ). Based on the sample in the present study, no claims can be made for recommendations on these older target groups, since they are underrepresented in this study. The study mainly derives its recommendations from a young student population and reflects its findings to this age group. However, a study of Aberle ( 9 ) found that the 20 to 29 age group is the main target group for ridepooling services. People in this age group are characterized as young, with low-to-middle income and not having access to a private vehicle. Aberle ( 9 ) and the present study both reveal that ridepooling trips are mainly used for trips to airports, train stations, and leisure activities. Generally speaking, ridepooling providers should focus on the purposes of their customers and concentrate their marketing activities on trips associated for leisure activities.
Answering the research questions mentioned in the introduction section, an overview of the results of this study is now provided. The empirical insights, that is, significant relationships (research question 1) and recommendations for ridepooling providers (research question 2) based on the respondents of the sample in this study are summarized in Table 3:
Empirical Insights and Recommendations for Ridepooling Providers
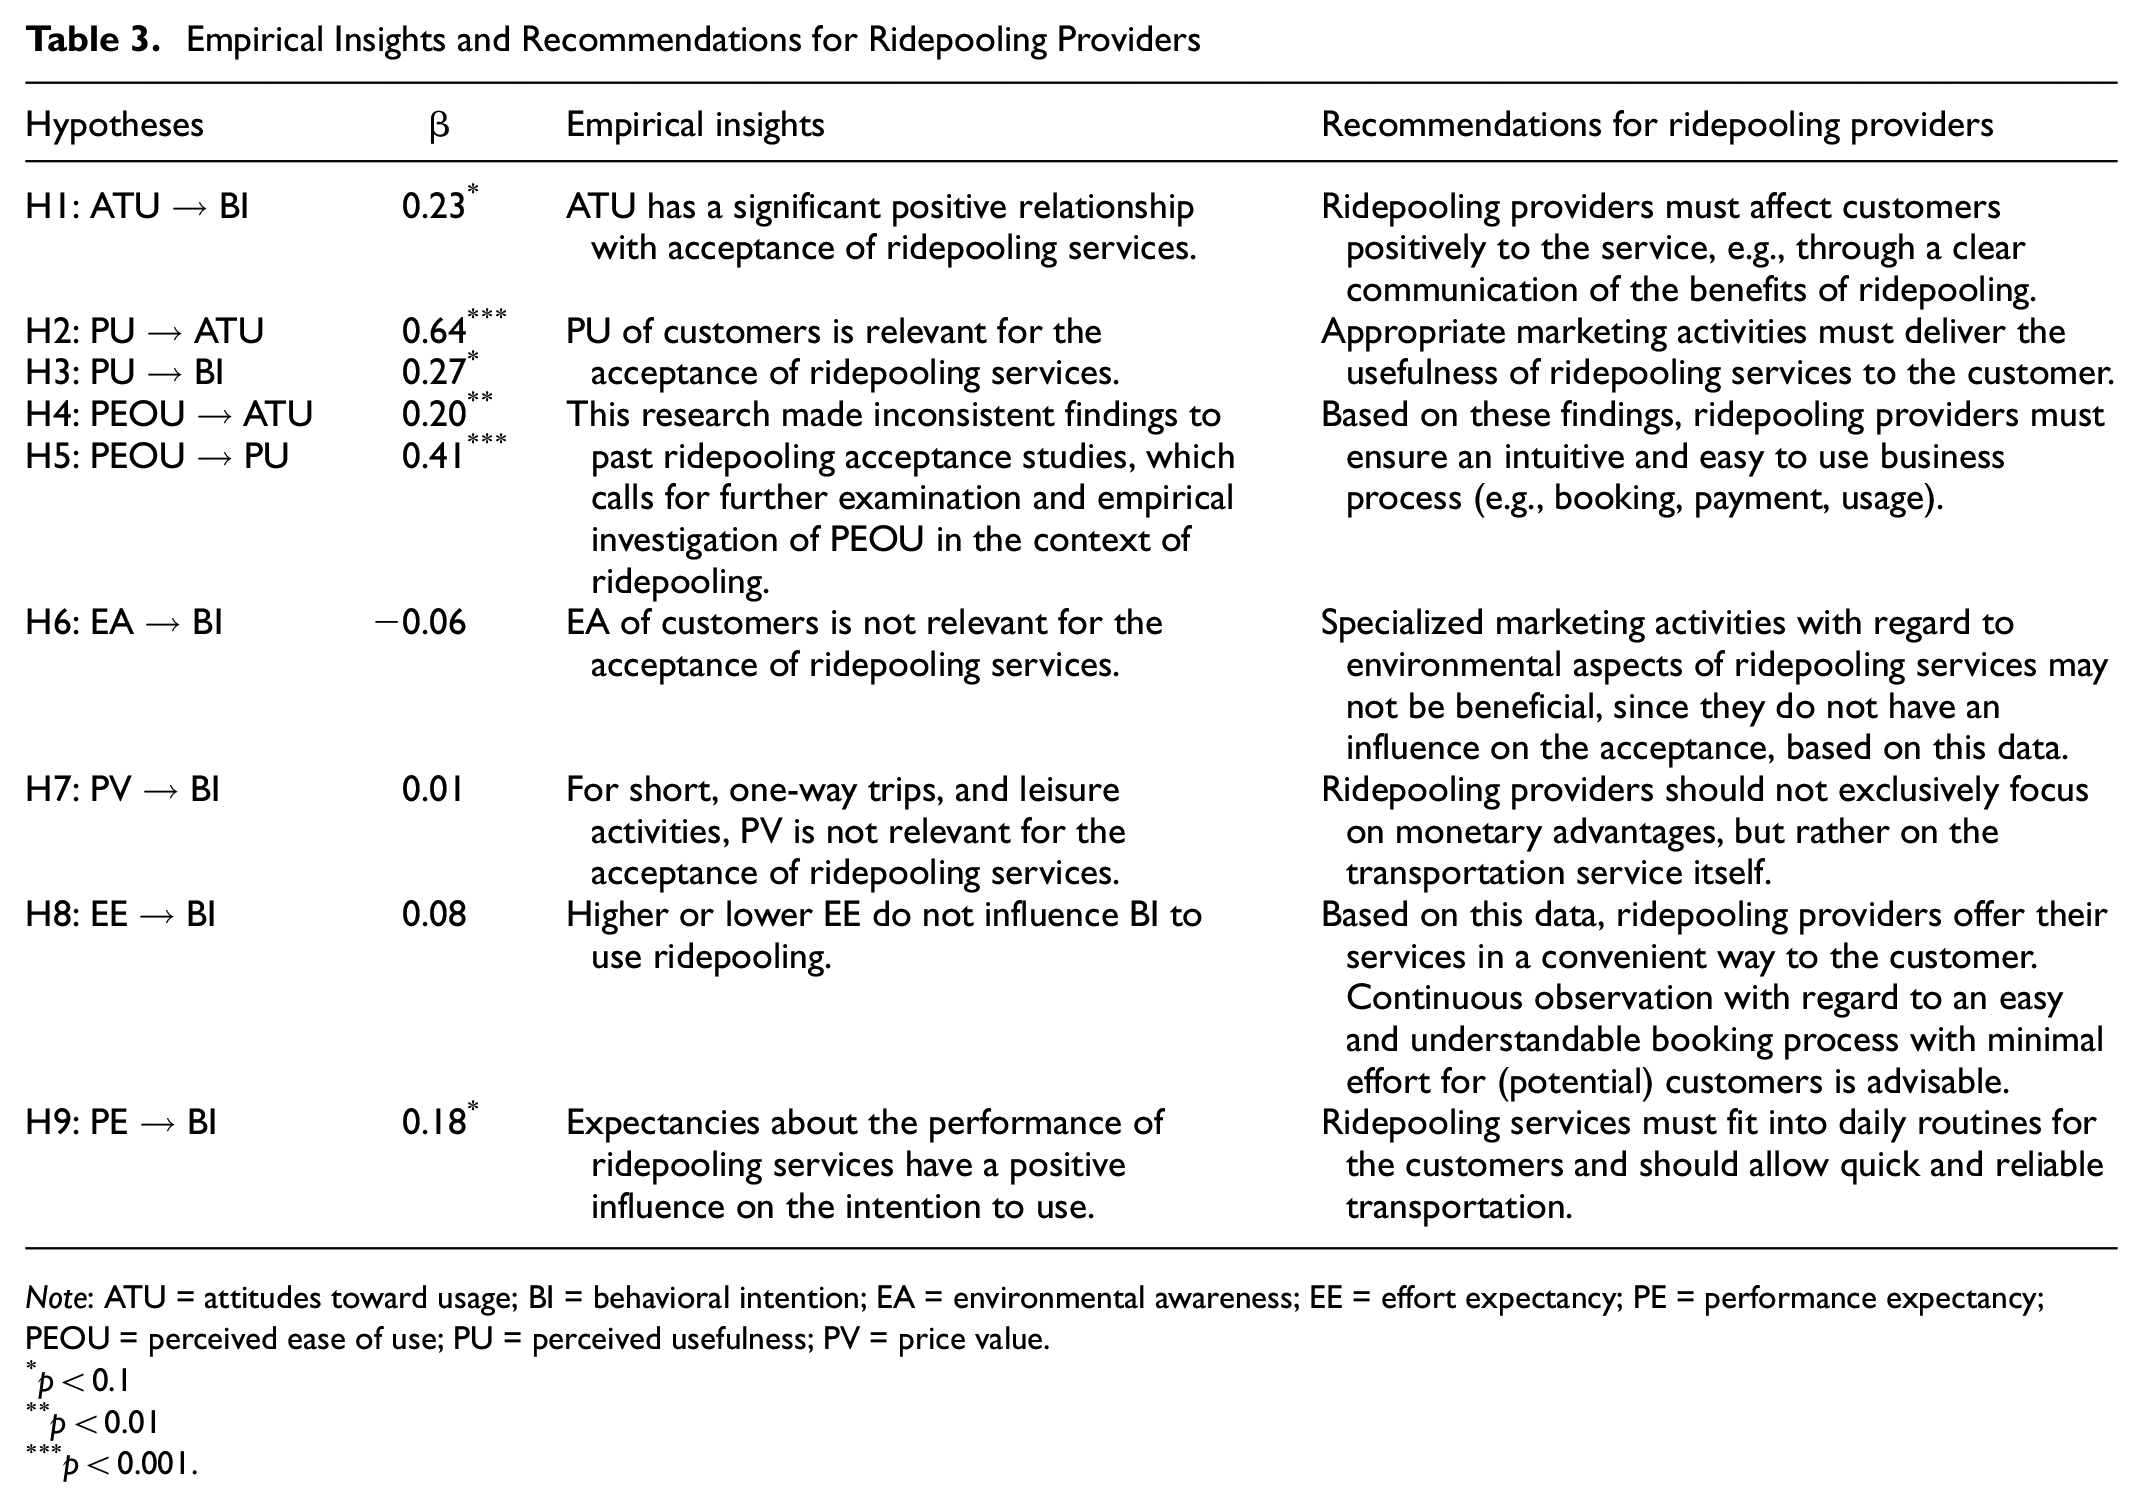
Note: ATU = attitudes toward usage; BI = behavioral intention; EA = environmental awareness; EE = effort expectancy; PE = performance expectancy; PEOU = perceived ease of use; PU = perceived usefulness; PV = price value.
p < 0.1
p < 0.01
p < 0.001.
From an academic point of view, the results of this study were compared with existing studies about the acceptance of new mobility services. Moreover, this study is the first investigation of a rather new mobility concept in Germany that can compare new empirical data with a comparable study, namely that of Sonneberg et al. ( 15 ). With such a comparison, it is possible to find the first patterns and differences of acceptance factors that are crucial for ridepooling services. Regular observation and analysis of the acceptance and diffusion of new concepts are crucial for, among other things, appropriate marketing activities ( 21 ).
Further possible relevant constructs related to BI to use such services were also tested and evaluated. This paper follows, therefore, the future research direction proposed by Sonneberg et al. ( 15 ) and includes constructs from other acceptance theories, that is, PV, EE, and PE from UTAUT2. In addition, this study tested EA as a possible relevant acceptance factor for ridepooling services. Overall, the study enhances the academic understanding of behavioral aspects of the mobility concept of ridepooling. Established relationships, like ATU on BI to use, show consistent results, while others (e.g., effect of EA on BI) show insignificant relationships. These results could serve as a motivation for a diverse usage of different acceptance models for new mobility services.
Limitations and Future Research Directions
Ridepooling providers face various customer expectations and prejudices, and low degrees of capacity utilization. To achieve long-term success, they must meet customers’ demands appropriately and generate sustainable customer acceptance. Most of the respondents in this study had not used ridepooling services and the dataset is restricted mostly to students in the age range of 20 to 39 (88.9% of the total respondents, see Appendix A.1 in the supplemental material). Therefore, the generalizability of the findings is somewhat restricted with regard to other age groups. The study of Kostorz et al. ( 32 ) collected data from nearly 12,000 respondents. They found that the 20 to 39 age group comprised 49% of ridepooling users. Further research equipped with a more diverse dataset from respondents, for example, with different age groups, is required to achieve a higher generalizability for recommendations. Another future research avenue could be the examination of gender-specific aspects, for example, safety issues, on new mobility services like ridepooling. Previous work on ridesharing services can serve as an orientation for such investigations (e.g., Sharma [ 67 ]).
As ridepooling is a relatively new mobility concept in Germany, it is not clear how the diffusion and adoption of the service will develop in the country. To examine the critical success factors for the diffusion of ridepooling services, future research can use and expand the information systems diffusion variance model for quantitative studies, which is based on variables from TAM ( 68 ); for an example in the motor carrier context, see Crum et al. ( 69 ). Continuous observations and measurements of these aspects can lead to greater understanding for both service providers and scientists in this research area.
Conclusion
Using a survey-based approach, this study tested EA as well as three constructs from UTAUT2 (PV, EE, and PE) as possible relevant critical success factors for the acceptance of ridepooling. Aspects such as environmental aspects, price, and effort did not have an influence, but instead it was found that attitude to use, usefulness, and expectancy of performance had a significant positive influence on BI to use ridepooling services. This study expands the literature about service acceptance factors and compares existing research with new empirical data. It indicates several recommendations for ridepooling providers and enriches the ongoing academic and practical discussion on the acceptance and rationales of new mobility concepts like ridepooling.
Supplemental Material
sj-docx-1-trr-10.1177_03611981211026304 – Supplemental material for Examining Customers’ Critical Acceptance Factors toward Ridepooling Services
Supplemental material, sj-docx-1-trr-10.1177_03611981211026304 for Examining Customers’ Critical Acceptance Factors toward Ridepooling Services by Oliver Werth, Marc-Oliver Sonneberg, Max Leyerer and Michael H. Breitner in Transportation Research Record
Footnotes
Acknowledgements
The authors would like to thank Leonard Kiel, Maurice Schwitalla, and the voluntary respondents for their assistance in the survey.
Author Contributions
The authors confirm contribution to the paper as follows: study conception and design: O. Werth, M.-O. Sonneberg; data collection: O. Werth, M.-O. Sonneberg; analysis and interpretation of results: O. Werth, M.-O. Sonneberg, M. Leyerer; draft manuscript preparation: O. Werth, M.-O. Sonneberg, M. Leyerer, M. H. Breitner. All authors reviewed and approved the revised version of the manuscript.
Declaration of Conflicting Interests
The author(s) declared no potential conflicts of interest with respect to the research, authorship, and/or publication of this article.
Funding
The author(s) received no financial support for the research, authorship, and/or publication of this article.
Data Accessibility Statement
The data that support the findings of this study are available from the corresponding author, Oliver Werth, on request.
Supplemental Material
Supplemental material for this article is available online.
References
Supplementary Material
Please find the following supplemental material available below.
For Open Access articles published under a Creative Commons License, all supplemental material carries the same license as the article it is associated with.
For non-Open Access articles published, all supplemental material carries a non-exclusive license, and permission requests for re-use of supplemental material or any part of supplemental material shall be sent directly to the copyright owner as specified in the copyright notice associated with the article.