
Abstract
Pedestrian safety is an important public health issue for the United States, with pedestrian fatalities representing approximately 16% of all traffic-related fatalities in 2016. Nationwide, transportation agencies are increasing their efforts to implement engineering-based improvements that increase pedestrian safety. These agencies need statistically rigorous crash modification factors (CMFs) to demonstrate the safety effectiveness of such countermeasures, and to apply in benefit–cost analyses to justify their implementation. This study focused on developing CMFs for two countermeasures that show promise for improving pedestrian safety: protected or protected/permissive left-turn phasing, and leading pedestrian intervals (LPIs). Data were acquired from four North American cities that had installed one or both of the countermeasures of interest: Chicago, IL; New York City, NY; Charlotte, NC; and Toronto, ON. The empirical Bayes before–after study design was applied to estimate the change in expected crash frequency for crashes following treatment. The protected left-turn phasing evaluation showed a benefit in reducing vehicle–vehicle injury crashes, but did not produce statistically significant results for vehicle–pedestrian crashes. For those crashes a disaggregate analysis did reveal that this treatment could be especially beneficial where pedestrian volumes exceed 5,500 per day. The LPI evaluation showed a statistically significant reduction in vehicle–pedestrian crashes with an estimated CMF of 0.87.
Introduction
Pedestrian safety has become an increasingly important public health issue for the United States. In the early 2000s, pedestrian fatalities numbered approximately 4,900 per year, representing 11% of all traffic-related fatalities. Since that time, the total number of pedestrian fatalities has increased to approximately 6,000 in 2016, and the percentage of pedestrian fatalities has continued to increase, accounting for 17% of all traffic-related fatalities in the United States in 2016 ( 1 ). In recognition of the magnitude of this problem, the Federal Highway Administration (FHWA) sponsored a study to evaluate priority pedestrian safety countermeasures.
The objective of the study was to evaluate the safety effects of two pedestrian safety engineering improvements: (1) adding either protected/permissive or protected-only phasing to one or more intersection legs of signalized intersections, and (2) implementing leading pedestrian interval (LPI) timing on selected or all pedestrian crossings at signalized intersections. The goal was to estimate the safety effectiveness of each strategy as measured by the expected change in crash frequency.
The following target crash types were considered for the protected left-turn phasing evaluation:
Vehicle–pedestrian crashes (all severities combined).
Vehicle–vehicle crashes (all severities combined).
Vehicle–vehicle injury crashes (K, A, B, and C injuries on the KABCO scale, where K is fatal injury, A is incapacitating injury, B is non-incapacitating injury, C is possible injury, and O is property damage only).
For LPI, the following target crash types were considered:
Total crashes (all severities combined).
Total injury crashes (K, A, B, and C injuries).
Vehicle–pedestrian crashes (all severities combined).
Fundamentals of Protected Left-Turn Phasing
Left-turn movements at intersections present drivers with potential conflicts from multiple sources, including oncoming through traffic, same-direction through traffic, and crossing pedestrians. At signalized intersections, several types of signal phasing have been developed to govern left-turn movements. Traffic-signal operation that provides an exclusive phase for left turns and prohibits opposing through movements and pedestrian crossings is known as a protected left-turn phasing. Under fully protected left-turn phasing, conflicts between left-turn and opposing through vehicles and between left-turn vehicles and pedestrians are practically eliminated (barring signal violations). The combination of protected and permissive left-turn phasing is known as a protected/permissive left turn. With protected/permissive left-turn phasing, the left-turning traffic has a permissive movement phase preceded or followed by a protected phase.
Prior studies have found that fully protected left-turn phasing is associated with the lowest rate of left-turn-related vehicle crashes. However, protected-only left-turn phasing may not always provide the operational performance needed at a signalized intersection, making protected/permissive left-turn phasing a common choice to balance safety and operational performance. In this study, a majority of the treated sites assembled for the evaluation were converted from permissive-only to protected/permissive left-turn phasing.
Fundamentals of Leading Pedestrian Interval
At signalized intersections equipped with pedestrian-signal indications, the pedestrian-crossing phasing is coordinated with the concurrent parallel vehicle phases. Pedestrian-crossing phases generally consist of a steady walking person (symbolizing “walk”), flashing upraised hand (symbolizing “do not start crossing”), and steady upraised hand (symbolizing “do not walk”) and may or may not include countdown timers. It is routine practice for the pedestrian walk interval to coincide with the adjacent circular green vehicle phase. In such cases, there exists a potential conflict between turning vehicles and crossing pedestrians. The LPI timing was introduced as a way to provide the pedestrian walk interval a few seconds (at least three) before providing the circular green indication to adjacent parallel traffic. The LPI gives pedestrians the opportunity to begin crossing the intersection before drivers are allowed to proceed. This “headstart” allows pedestrians to establish their presence in the crosswalk and places them in a location that is more visible to drivers. The use of LPI is expected to increase the visibility of crossing pedestrians, reduce conflicts between pedestrians and vehicles, and increase the likelihood of motorists yielding to pedestrians.
Literature Review
The focus of the literature review was on crash-based studies. However, studies that were based on safety evaluation measures other than crashes were reviewed to provide a comprehensive examination of each countermeasure.
Literature on Safety Effects of Protected Left-Turn Phasing Literature
The protected left-turn phasing literature review revealed that the effects of protected and protected/permissive left-turn phasing on pedestrian safety have not been evaluated as extensively as their effects on crashes between vehicles. Crash-based studies from Hauer ( 2 ), Lyon et al. ( 3 ), and Srinivasan et al. ( 4 ) all found that conversion from permissive-only to permissive/protected or protected-only left-turn phasing reduced total crashes and/or left-turn crashes for vehicles, but these studies did not examine pedestrian crashes.
Two studies specifically examined the effect of left-turn phasing on pedestrian crashes. Bonneson et al. ( 5 ) conducted a 2012 literature review to examine the issue of left-turning traffic and pedestrian safety and concluded that research had not established a reliable crash-based relationship between pedestrian safety and protected/permissive signal phasing. Subsequently, an evaluation of 95 New York City intersections converted from permissive-only to protected/permissive or protected-only phasing found a statistically significant 43% reduction in pedestrian crashes based on an analysis of covariance (ANCOVA) approach to correct for regression-to-the- mean ( 6 ). An admitted limitation of this study was the lack of exposure data.
Non-crash-based safety-related studies from Hurwitz et al. ( 7 ) and Pratt et al. ( 8 ) found that drivers turning left under permissive phasing focused less on pedestrians as the number of opposing vehicles increased, and the presence of a protected left-turn phase led to a decrease in pedestrian and left-turning vehicle conflicts.
Literature on the Safety Effect of Leading Pedestrian Interval
There have been studies on the operational effects of LPIs and a few limited crash-based evaluations; see, for example, Saneinejad and Lo ( 9 ). King ( 10 ) presented a crash-based analysis of the effect of LPIs on pedestrian crashes in New York City. The results indicated that LPIs had a positive effect on pedestrian safety, especially where there was a heavy concentration of turning vehicles. The treated sites experienced a 28% decrease in vehicle–pedestrian crash rates relative to control sites. Fayish and Gross ( 11 ) published a crash-based analysis of 10 intersections in Pennsylvania where an LPI of 3 s was implemented. Results suggested a 58.7% reduction in pedestrian–vehicle crashes, which was statistically significant.
Other researchers evaluated crash surrogates to study the behavior of pedestrians and drivers at intersections with LPI, mostly using small sample sizes. Pécheux et al. ( 12 ) observed sites with LPI in Miami, Florida, and found an increase in the percentage of left-turning drivers yielding to pedestrians, no change in the percentage of right-turning drivers yielding to pedestrians, an increase in the percentage of pedestrians who pushed the call button, and an increase in the percentage of pedestrians who crossed during the first 4 s of the WALK interval. Van Houten et al. ( 13 ) conducted observations at three urban intersections with LPIs, and results indicated reductions in pedestrian–vehicle conflicts and pedestrians yielding right of way to turning traffic. Hubbard et al. ( 14 ) analyzed video of a LPIs at one crosswalk in Anaheim, California. Results were inconclusive, and the authors suggested further field evaluation to determine effectiveness. Hua et al. ( 15 ) conducted video observation and intercept surveys at four intersections in San Francisco, California, with 4 s LPIs. Results indicated a significant reduction in percent of vehicles turning in front of pedestrians.
Literature Review Conclusion
To sum up the literature review, existing knowledge is characterized by several issues—samples too limited for crash-based analysis, lack of key data, and single jurisdiction focus. There seems to be a need for multi-jurisdiction, crash-based studies, especially focused on the impact on pedestrians, to provide crash modification factors (CMFs) and guidance that practitioners can confidently apply in planning the implementation of these two treatments. This need provided the motivation for this research.
Overview of Methodology
This evaluation used the empirical Bayes (EB) methodology for observational before–after studies to estimate the effect of the treatment as a CMF. This method is regarded as the gold standard and has been documented in several sources, most prominently in Hauer ( 16 ), so is only briefly summarized here. It accounts for the possible bias due to regression-to-the-mean and properly accounts for temporal effects and changes in traffic volume during the study period. The steps for applying the EB methodology are as follows:
Identify a reference group of intersections without the treatment, but similar to the treatment sites in terms of the major factors that affect crash risk including traffic volume and other site characteristics.
Using data from the reference sites, estimate safety performance functions (SPFs) relating crashes to independent variables, such as traffic volume and other site characteristics.
In estimating SPFs, calibrate annual SPF multipliers to account for the temporal effects (e.g., variation in weather, demography, and crash reporting) on safety. The annual SPF multiplier is the ratio of the sums over reference group sites of observed crashes to the predicted crashes from the SPF for each year of the period before and after treatment.
Use the SPFs, annual SPF multipliers, and data on traffic volumes for each year in the before period for each treatment site to estimate the number of crashes that would be predicted for the before period in each site.
Calculate the EB estimate of the expected crashes in the before period at each treatment site as a weighted sum of the actual crashes in the before period and predicted crashes from step 4.
For each treatment site, estimate the product of the EB estimate of the expected crashes in the before period and the SPF predictions for the after period, divided by the SPF predictions for the before period. This is the EB expected number of crashes that would have occurred had there been no treatment. The variance of this expected number of crashes is also estimated in this step. The sums, over all treatment sites, of the expected number of crashes without the treatment, the variance of this parameter, and the number of reported crashes after the treatment is used to calculate the CMF and the standard deviation of the CMF.
A disaggregate analysis was also conducted to examine how site conditions such as pedestrian volumes and treatment intensity may affect the value of the CMF. This was accomplished by isolating sites having certain levels of a given variable and estimating the separate effects for each level. In the case of continuous variables, such as traffic volume, aggregation occurred over specified ranges of the variable. The estimation of a CMFunction to capture the variation of the CMF was also explored.
When estimating CMFunctions, sites with similar characteristics are often combined. However, this aggregation can lead to loss of useful information and requires a large number of sites and after-period crashes. Because of these difficulties, the approach taken was to model the observed after-period crash counts at each site using generalized linear modeling with a negative binomial error structure, with variables of interest as predictor variables and an offset term equal to the EB estimate of the expected crash frequency without treatment in the after period. The estimated parameters for the variables of interest were then used to infer CMFs.
Site Identification and Data Collection
Each city that contributed data provided a list of potentially eligible treatment sites, which were reviewed for suitability in the study. Potential treatment sites were deemed ineligible if they met any of the following conditions:
Any leg of the intersection was a freeway ramp, driveway, or alley.
There was significant construction or changes in roadway or lane geometry during the study period.
Intersection legs were offset (centerline of one leg extended is outside the bounds of the other leg but within 500 ft. [152.4 m]).
The site was within 100 ft. (30.5 m) of any other intersection.
There was noticeable skew (angle of any two intersecting legs appeared to be less than 80 degrees as judged by the data collector).
There were fewer than three legs or more than four legs.
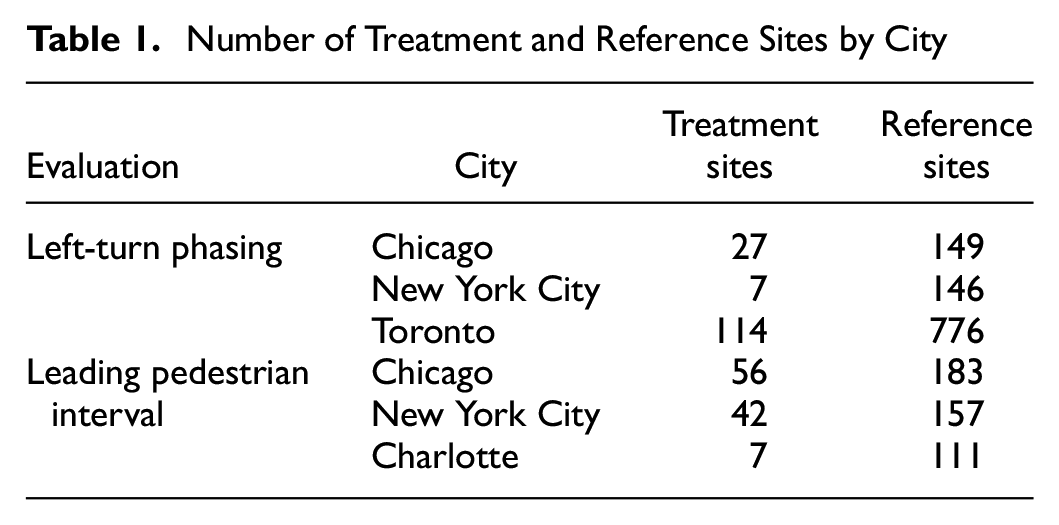
Once all potential treatment sites had been investigated, the overall characteristics of the treatment sites were examined to direct the selection of an appropriately matched set of reference sites. Table 1 presents a summary of the numbers of treatment and reference sites collected by city. The discussion that follows provides an overview on how sites were selected and data were collected by city.
Number of Treatment and Reference Sites by City
Chicago
Treatment Sites
To identify protected left-turn treatment sites, a signal inventory file provided by the City was reviewed and signals identified where protected or protected/permissive left-turn phasing was installed. To identify LPI treatment sites, the City provided a list of signalized intersections where LPI had been installed for crossings of one or both streets. Chicago typically provides a period of 3 s for the LPI. All LPI installations used in this study were from intersections where pedestrian phasing and pedestrian-signal heads were already present before the LPI implementation.
Reference Sites
To identify reference sites for the analysis, signals were selected that were located within 0.5 miles (0.8 km) of a treatment site and were then screened using the same criteria as for the treatment sites.
Roadway and Signal Data
Aerial photography and street-level imagery were used to determine site eligibility and collect roadway characteristics. Archived timelines of imagery were used to determine whether any significant changes had taken place during the study period. Signal plans verified the installation of a treatment during the study period as well as the absence of the treatment before the scheduled installation date. For reference intersections, the absence of the target treatment for any time during the study period was verified.
Vehicle and Pedestrian Volume Data
Data on traffic volume were obtained from the City in spatial format. For pedestrian volumes, data were collected at the study sites in two ways. The first was a manual collection of 1-hour pedestrian counts that were converted to equivalent daily volumes. The second used existing pedestrian counts from the City taken at midblock locations and estimating pedestrian-crossing volumes from these data.
Crash Data
The City provided crash data from 2005 to 2014. Spatial proximity was used to associate crashes with the study intersections. Following Chicago’s standard practice, all crashes within 75 ft. (22.9 m) of the intersection midpoint were taken to be associated with that intersection.
New York City
Treatment Sites
To identify protected left-turn sites, a list from the City of intersections where protected or protected/permissive left-turn phasing had been implemented was reviewed. Historical signal plans were used to determine the configuration and implementation date of the left-turn phasing. For LPI treatment sites, City staff provided a list of signalized intersections where LPI timing was present along with the installation date when the LPI timing was enacted. The City typically provides 7 s for the LPI. At most locations (approximately 90% of the final treatment group), LPI was implemented at the crossings for only one street at the intersection. All LPI installations used in this study were from signals where pedestrian phasing with pedestrian-signal head was already present at the intersection (i.e., LPI retrofits to existing signals). In addition, it should be noted that the City has a citywide prohibition on right turn on red (RTOR) unless otherwise signed.
Reference Sites
The selection of potentially eligible reference sites began by using data on treatment locations, roads with annual average daily traffic (AADT) volume, and an inventory of signal locations and selected signals that were located within 1,000 ft. (304.8 m) of a treatment site. Signal plans provided by the City were used to verify eligibility.
Roadway and Signal Data
Aerial photography and street-level imagery were used to determine the eligibility of treatment and reference site locations and to collect roadway characteristics. Signal plans from the City were used to determine the eligibility of a site location. For treatment intersections, the installation of a treatment during the study period as well as the absence of the treatment before the scheduled installation date was verified.
Vehicle and Pedestrian Volume Data
AADT data were obtained from the online New York State GIS Clearinghouse. Pedestrian volumes were obtained through two sources. The first was short (1 h) manual counts expanded to daily volumes based on expansion factors developed by the City. The second source of pedestrian volume information was existing pedestrian counts collected by the City.
Crash Data
The City provided crash data that covered the years 2001 to 2014 and contained all necessary information to identify all target crash types, such as pedestrian-involved and left-turn, and were associated by City staff to each intersection.
Charlotte
Treatment Sites
The City of Charlotte provided a list of intersections where LPI had been implemented on the crossings for one or both streets. The City typically provides a period of 3–10 s for the LPI. All LPI installations used in this study were from signals where pedestrian phasing with pedestrian-signal head was already present at the intersection.
Reference Sites
A group of 116 signalized intersections with pedestrian signals was identified for the reference group. This group represented signals that were similar in nature and geographical placement to the treatment sites but which did not have LPI timing implemented.
Roadway and Signal Data
Data were provided by the City in spatial format, and web-based aerial photography and street-level imagery were used to determine the eligibility of treatment and reference site locations and to collect roadway characteristics.
Vehicle and Pedestrian Volume Data
Daily vehicle volume data were provided by the City in spatial format and associated manually with the study sites. For pedestrian volume, pedestrian counts were provided by the City as part of its intersection turning movement counts database.
Crash Data
Crash data were provided by the City of Charlotte. To maintain consistency with the other cities used in this study, a distance of 75 ft. (22.9 m) was used as the maximum distance to associate crashes with an intersection.
Toronto
Treatment Sites
Treated sites were identified in a two-step process. First, an electronic file of work orders for signalized intersections was scanned to identify sites where a change in left-turn phasing was made. Using this list, a subsequent search of hard copy signal-timing reports for these sites identified those where the left-turn phasing on at least one approach was changed to either protected/permissive or fully protected at any time of day.
Reference Sites
Reference sites were identified by using the city’s signalized-intersections database to identify sites with a similar number of legs, entering lanes, turning lanes, and AADTs on major and minor roads as the treatment sites. No sites were used that had undergone construction or changes in signal phasing during the study period.
Roadway and Signal Data
All roadway data were obtained from the City’s database of signalized intersections. Historical signal-timing plans were reviewed to determine whether permissive, protected/permissive, or protected phasing was provided at any point in the day or week.
Vehicle and Pedestrian Volume Data
AADT estimates were provided by the City for the major and minor roads, along with 8 h pedestrian volumes for each crossing.
Crash Data
Crash data were provided in electronic form by the City. For the group of older sites, crash data from 1999 to 2007 were used, and for the newer installations, data from 2005 to 2014 were used. Keeping with the city practice, crashes within a radius of 25 m (82 ft.) of the intersection center were identified as related to an intersection.
Safety Performance Functions
SPFs were estimated separately for each city and for each treatment using the corresponding data for reference sites. The SPFs, as noted earlier, were used in the EB methodology to estimate the safety effectiveness of the treatments. Generalized linear modeling was used to estimate model coefficients assuming a negative binomial error distribution, which is consistent with the state of research in developing these models. In specifying a negative binomial error structure, the overdispersion parameter, k, used in the EB calculations, was estimated iteratively from the model and the data.
The SPFs that were developed using data from Chicago for the evaluation of protected left-turn phasing are shown below for illustration and were of the form shown in Equation 1. Parameter estimates and their standard errors are shown in Table 2.
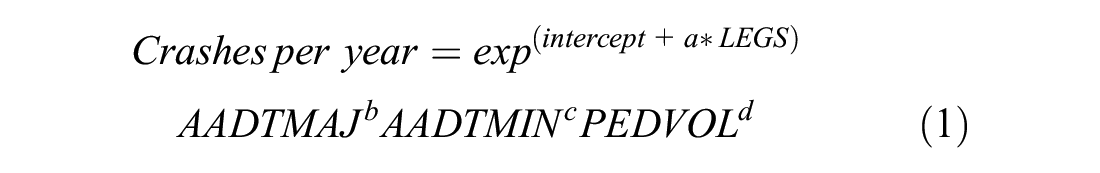
Where:
LEGS = 1 if a 4-legged intersection; 0 if a 3-legged intersection
AADTMAJ = Annual average daily traffic volume on major road.
AADTMIN = Annual average daily traffic volume on minor road.
PEDVOL = Sum of 24 hour pedestrian volumes for all crossings.
intercept, a, b, c, d = Parameters estimated in the SPF calibration process.
Parameter Estimates for Illustrative Safety Performance Functions for Chicago Protected Left-Turn Evaluation
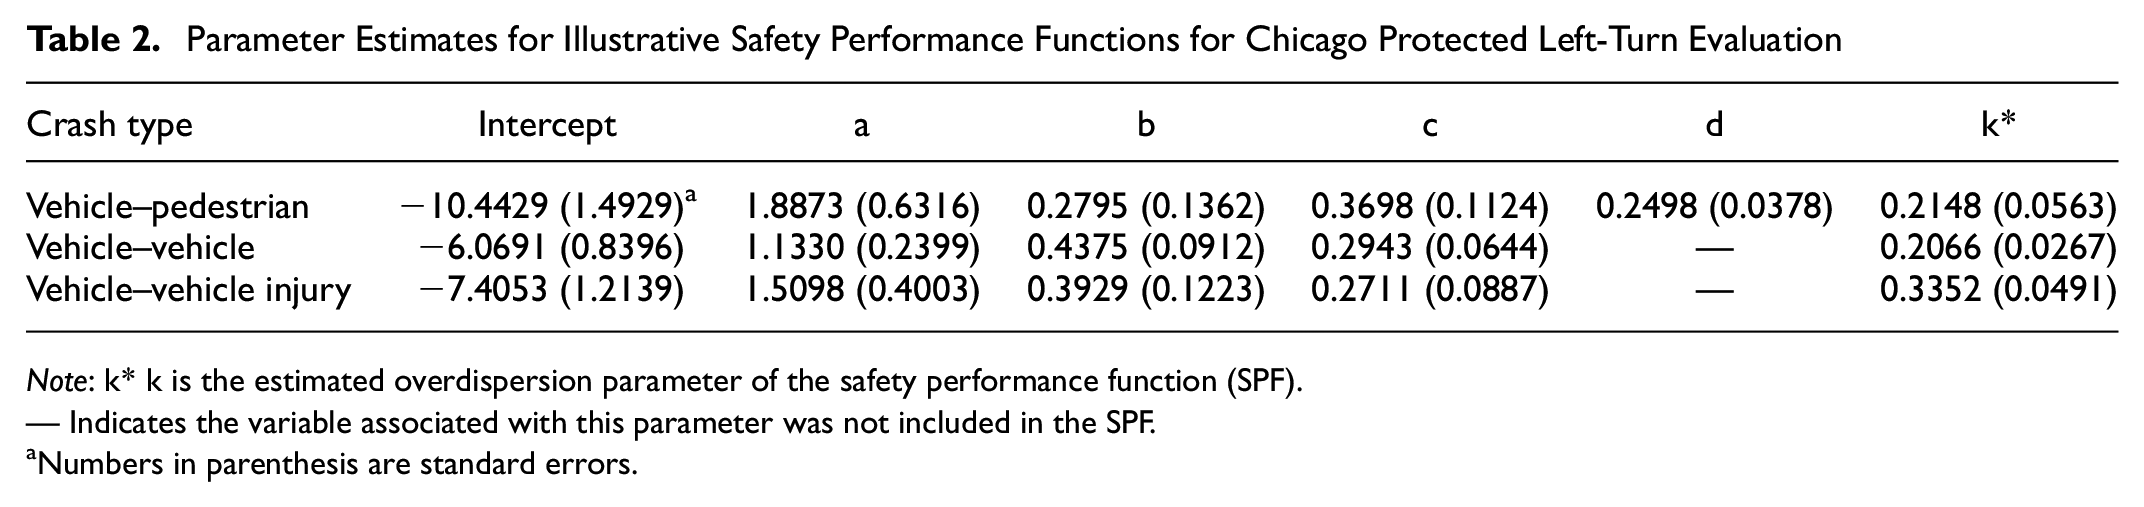
Note: k* k is the estimated overdispersion parameter of the safety performance function (SPF).
— Indicates the variable associated with this parameter was not included in the SPF.
Numbers in parenthesis are standard errors.
Results
Protected Left-Turn Phasing Evaluation
Table 3 summarizes the aggregate results for the protected left-turn evaluation by city and for all cities combined. The aggregate results show that vehicle–pedestrian crashes increased in Chicago and Toronto and decreased in New York City. However, none of these results were statistically significant at the 95% confidence level, and the results in New York City were based on few sites and crashes. For vehicle–vehicle crashes (all severities), small increases were seen in Chicago and Toronto, but these also were not statistically significant. A statistically significant decrease was seen in New York City, although this was based on only 46 after-period crashes. For vehicle–vehicle injury crashes, decreases were seen in all three cities, but only Toronto showed a statistically significant decrease, and, even so, this was less than 5%.
Estimated CMFs for Protected Left-Turn Phasing Evaluation
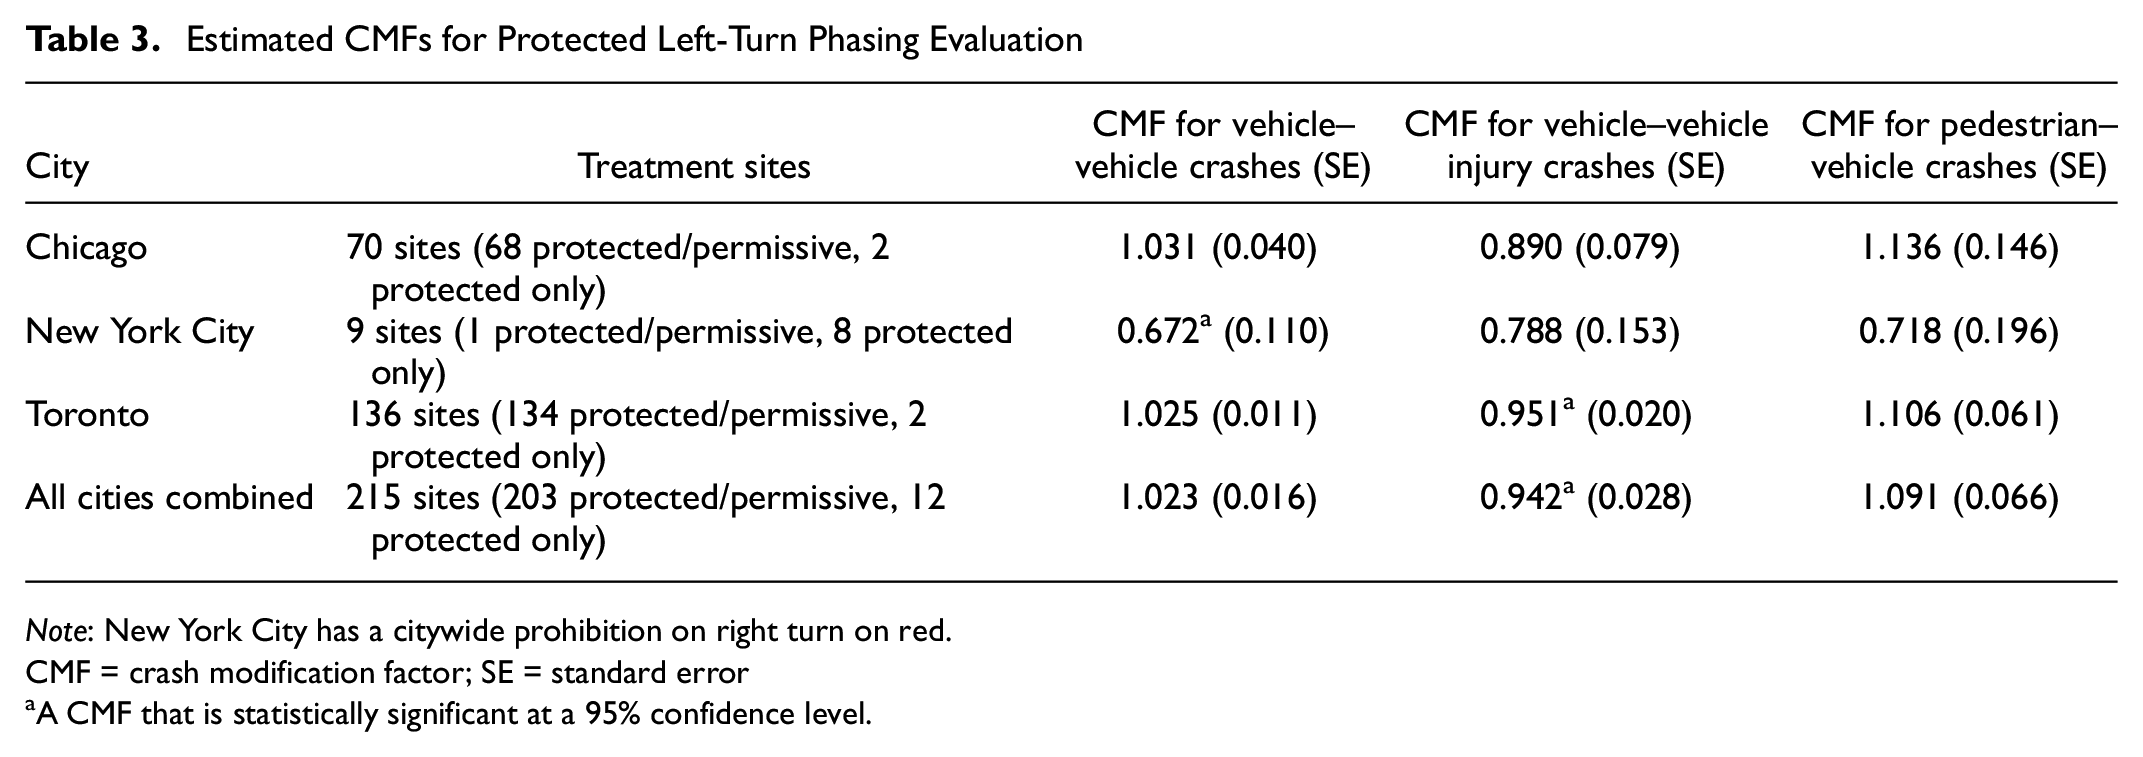
Note: New York City has a citywide prohibition on right turn on red.
CMF = crash modification factor; SE = standard error
A CMF that is statistically significant at a 95% confidence level.
There are two aspects of the New York City sites that are noteworthy, even though the sample size was smaller. First, of the three cities represented in the study of left-turn phasing, only New York City has a citywide prohibition on RTOR. Second, the treatment sites from New York City were dominated by conversion to protected-only phasing, whereas Chicago and Toronto were dominated by conversion to protected/permissive.
For all cities combined, non-significant increases were seen for vehicle–pedestrian crashes and vehicle crashes, whereas a statistically significant decrease of less than 6% was seen for vehicle injury crashes.
The aggregate results, which were dominated by changes from permissive-only to protected/permissive phasing, were reasonably consistent with the previous findings by Hauer ( 2 ), who reported a CMF of 1.0 (no effect) for both left-turn and other crashes for changes from permissive to protected/permissive phasing, and Srinivasan et al. ( 4 ), who reported non-statistically significant CMFs of 1.031 and 0.962 for total and total injury crashes, respectively.
The results by city and for all cities combined did not show that the provision of protected left-turn phasing had a statistically significant effect on vehicle–pedestrian crashes at the 95% confidence level. However, it is possible that positive or negative effects may exist for a subset of site characteristics. This possibility was explored through a disaggregate analysis and development of CMFunctions. Univariate disaggregate analyses were undertaken for all crash types considering the following variables:
Number of treated approaches.
Number of approaches with a protected left-turn phase before treatment.
Number of intersection approaches.
Number of through lanes on major and minor roads at intersections.
Number of left-turn lanes on major and minor roads intersections.
AADT on major and minor roads.
Left-turn AADT on major and minor roads at intersections.
24 h pedestrian-crossing volume.
EB estimate of expected crashes per year at a signalized intersection before treatment.
For vehicle–vehicle and vehicle injury crashes, there were no apparent relationships found between the expected CMF and any of the candidate site characteristics. For vehicle–pedestrian crashes, the analysis indicated that the CMF may be smaller for higher levels of pedestrian and vehicle volumes. In developing CMFunctions, the dependent variable—the observed number of vehicle–pedestrian crashes after treatment—was modeled initially as a function of pedestrian volumes and vehicle AADTs with the EB estimate of expected crashes as an offset.
The effect of vehicle AADTs was not estimated to be statistically significant and did not improve the fit of the model to the data, so this variable was not included in the final CMFunction shown in Equation 2. The parameter estimates for this function are shown in Table 4.

Where:
CMFi = estimated CMF for vehicle–pedestrian crashes for site i
PEDVOL = sum of 24-hour pedestrian counts crossing each leg.
a, b = parameters estimated in the calibration of the model.
k = overdispersion parameter of the model.
CMFunction Model Estimates for Protected Left-Turn Phasing
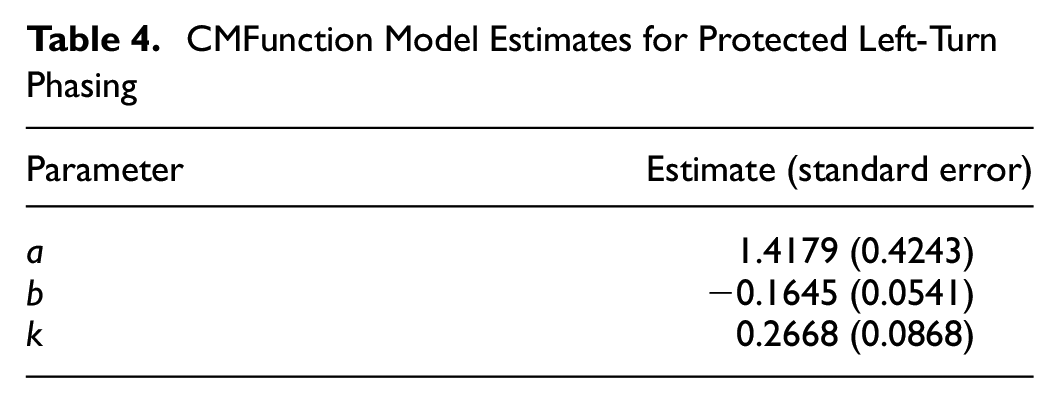
The estimated parameters show that the expected CMF decreases as the pedestrian volume increases. At lower pedestrian volumes, the predicted CMF is greater than 1.0; the predicted CMF is less than 1.0 for values of 24 h crossing volumes of approximately 5,500 and above. At the present time, how to estimate the standard error, and thus statistical significance, of CMF estimates derived in this manner is unknown. Therefore, the CMF estimates derived for a given level of pedestrian volume should not be considered robust given the lack of statistical significance for the results overall and from the univariate disaggregate analysis.
If, as the CMFunction indicates, vehicle–pedestrian crashes do increase following the addition of left-turn protection at low pedestrian volumes, it may be that pedestrians are not obeying the don’t walk signal during the protected left-turn phase and/or left-turn vehicles are turning left at a too high rate of speed immediately after their protected phase is over and pedestrians have begun to cross. When pedestrian volumes are high, this type of behavior may be less prevalent, or it may be that vehicles are more conscious of the presence of pedestrians. This hypothesis is only speculative, however.
Leading Pedestrian Interval Evaluation
The effect of LPIs on total crashes was consistent across all cities individually, with CMFs ranging from 0.84 to 0.90. The CMF for all cities combined was 0.87, which was statistically significant at a 95% confidence level. Table 5 presents the aggregate results of the before–after evaluation of the LPI treatment by city and for all cities combined.
Estimated CMFs for LPI Evaluation
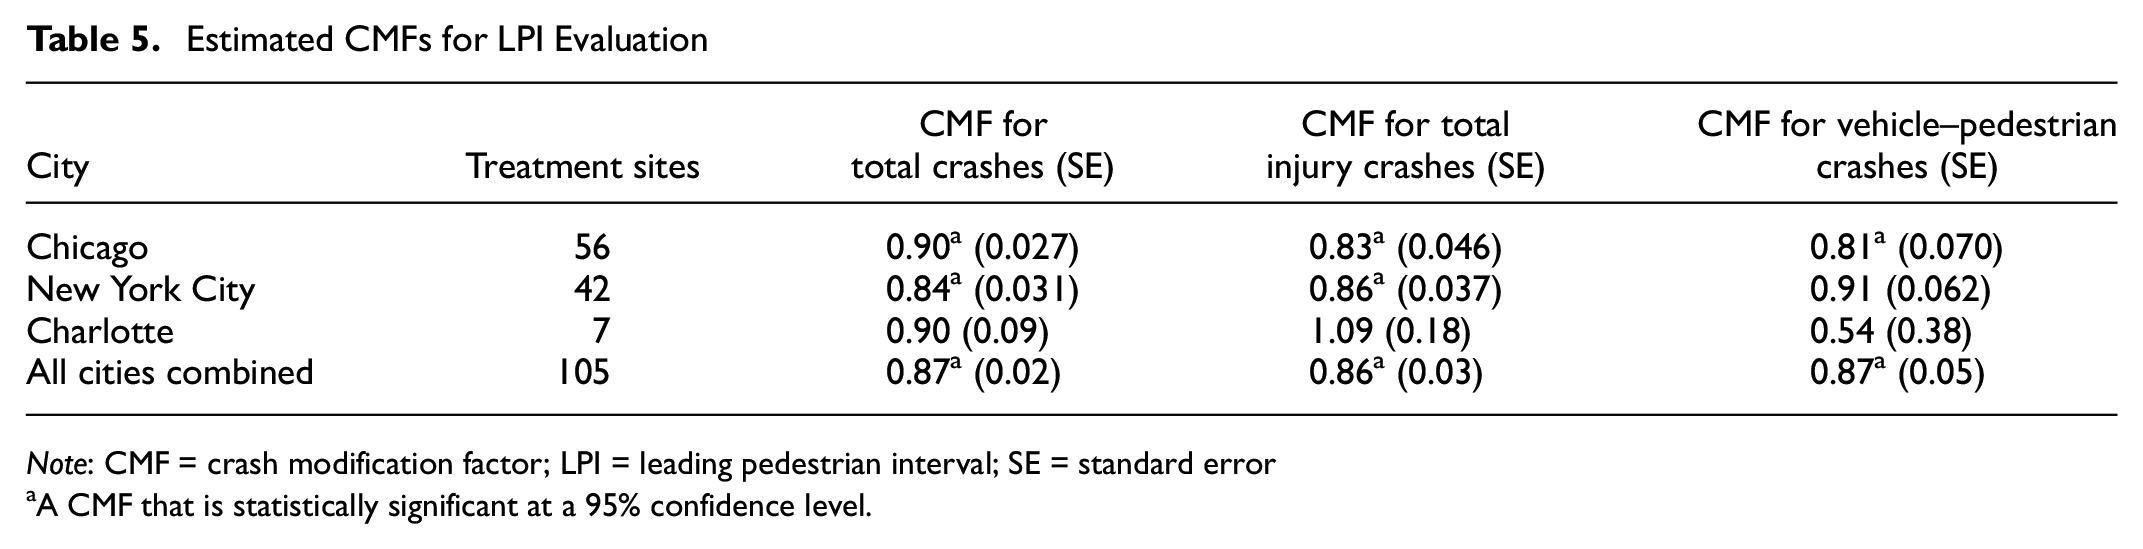
Note: CMF = crash modification factor; LPI = leading pedestrian interval; SE = standard error
A CMF that is statistically significant at a 95% confidence level.
The effect on total injury crashes was also consistent across the cities, ranging from 0.83 to 0.86 (omitting the result from Charlotte, which was not statistically significant). The effect on total injury crashes for all cities combined was 0.86, which was statistically significant at a 95% confidence level.
The effect on pedestrian crashes was generally beneficial, showing decreases in pedestrian crashes across all cities. The results in Chicago showed a CMF of 0.81, which was statistically significant at the 95% confidence level. New York sites showed a beneficial but lesser effect on pedestrian crashes, with a CMF of 0.91, but this result was not statistically significant at a 95% confidence level. The result from Charlotte showed a decrease in pedestrian crashes, but this result was highly unreliable given the large standard error. For the combined group of all cities together, the CMF for pedestrian crashes was 0.87, which was statistically significant at a 95% confidence level.
A disaggregate analysis of the LPI effect based on the manner of installation was conducted. In Chicago, 42 of the treatment sites had LPI implemented on all crossings, and nine intersections had LPI implemented only for crossings across the minor road. A comparative analysis of the LPI effect on these two groups was inconclusive with respect to total crashes and injury crashes. There were insufficient numbers of pedestrian crashes for a disaggregate analysis. The development of CMFunctions involving other potentially influential factors was pursued but was not successful because of convergence issues which were likely caused by small sample sizes.
Summary and Conclusions
This study used data from multiple cities to examine the effect of protected left-turn phasing and LPI on the safety of signalized intersections, with a particular focus on pedestrian safety. For protected left-turn phasing, vehicle–pedestrian crashes increased in Chicago and Toronto and decreased in New York, where there were few sites and crashes. However, none of these results were statistically significant at the 95% confidence level. For vehicle crashes, increases were seen in Chicago and Toronto, but these were also not statistically significant. A statistically significant decrease was seen in New York, although this was based on only 46 after-period crashes. For vehicle injury crashes, decreases were seen in all three cities, but only Toronto showed a statistically significant decrease which, even so, was less than 5%. A disaggregate analysis of the effect of left-turn phasing on vehicle–pedestrian crashes indicated that the CMF was smaller (i.e., the treatment was more beneficial) for higher levels of pedestrian and vehicle volumes, with a developed CMF indicating that the treatment becomes beneficial for pedestrian volumes above 5,500 pedestrians per day.
The LPI evaluation showed that the effect on total crashes for all cities combined was a CMF of 0.87, which was statistically significant at a 95% confidence level. The effect on KABC crashes for all cities combined was a CMF of 0.86, which was statistically significant at a 95% confidence level. The effect on pedestrian crashes was generally beneficial, showing decreases in pedestrian crashes across all cities. The results in Chicago showed a CMF of 0.81, which was statistically significant at the 95% confidence level. New York sites showed a beneficial but lesser effect on pedestrian crashes, with a CMF of 0.91, but this result was not statistically significant at a 95% confidence level. The result from Charlotte showed a decrease in pedestrian crashes, but this result was highly unreliable given the large standard error. For the combined group of all cities together, the CMF for pedestrian crashes was 0.87, which was statistically significant at a 95% confidence level.
The results of these evaluations provide information that can be used by safety practitioners to prioritize safety treatments and estimate potential benefits. The protected left-turn phasing was shown to possibly have a benefit to pedestrian safety if implemented at intersections with pedestrian volumes greater than 5,500 pedestrians per day. A safety practitioner may use this information to prioritize potential treatment sites to give more preference to installing the protected or protected/permissive left-turn phasing treatment at sites with higher pedestrian volumes.
The LPI treatment was shown to have significant benefits for safety, both in reducing vehicle–pedestrian crashes by approximately 13% and reducing vehicle–vehicle crashes (all severities and KABC injury crashes) by approximately 13%. There were clear differences in some aspects of the treatment cities used in the evaluation; for instance, New York City almost entirely prohibits RTOR and Chicago allows RTOR in most cases, but the results for each city were similar. New York City also had generally higher pedestrian volumes than Chicago (sometimes by a factor of 3–4), but again, the results of the effect of LPI were similar.
Despite the valuable results obtained, it would still be of interest to build on this effort in a future study that could benefit from larger samples that would facilitate a more thorough and definitive disaggregate analysis.
Footnotes
Acknowledgements
The authors would like to thank Ms. Roya Amjadi of the Federal Highway Administration for her guidance on the project.
Author Contributions
The authors confirm contribution to the paper as follows: study conception and design: Elissa Goughnour, Daniel Carter, Craig Lyon, and Bhagwant Persaud; data collection: Elissa Goughnour, Daniel Carter, Craig Lyon, Ian Hamilton, Piljun Chen, and Kari Signor; analysis and interpretation of results: Craig Lyon, Bo Lan, Bhagwant Persaud; manuscript preparation: Elissa Goughnour, Daniel Carter, Craig Lyon, Bo Lan, Bhagwant Persaud, Meg Bryson. All authors reviewed the results and approved the final version of the manuscript.
Declaration of Conflicting Interests
The author(s) declared no potential conflicts of interest with respect to the research, authorship, and/or publication of this article.
Funding
The author(s) disclosed receipt of the following financial support for the research, authorship, and/or publication of this article: This research was funded by the Federal Highway Administration, Office of Safety Research and Development under the Development of Crash Modification Factors program for the Evaluation of Low Cost Safety Improvements Pooled Fund Study. The FHWA Program and Task Manager for the project was Ann Do.