
Abstract
Means-based reduced-fare programs can help address transit rider fare equity. The objective of this study is to synthesize the current state of reduced-fare programs for low-income transit riders. The reduced-fare programs of the 50 largest transit agencies in the United States were examined and agencies with programs for low-income riders were compared based on three dimensions: eligibility and enrollment, fare media and discount pricing, and estimated transit expenditure by eligible riders. The results reveal that 17 of the 50 largest transit agencies have low-income reduced-fare programs. Of these, 14 agencies administer the programs themselves, while three use partnerships with social service organizations to administer them. Additionally, nine of the 14 agencies that administer their own programs provide a 50% discount on fares and require participants to have an income at or below 125% to 200% of the federal poverty level for eligibility. Using a method developed to evaluate the “fare burden” of transit riders with different income levels, it was determined that low-income reduced-fare program participants at the income eligibility threshold typically spend an estimated 2% to 6% of their annual income on transit, although very-low-income people may need to spend much higher shares of their incomes on transit fares. These results indicate that agencies may need to reevaluate the structure of their existing low-income reduced-fare programs and implement tiers of discounts to ensure that fare equity is being extended to all riders.
Low-income people make up 37.8% of transit riders in the United States ( 1 ), and 40% of transit riders in the United States use transit because of a lack of vehicle ownership or money for an alternative ( 2 ). A disproportionate population of low-income people are transit dependent and lack the means to change transportation modes even if using transit does not make economic sense ( 3 ), leading to low-income transit riders having to make difficult financial trade-offs, such as foregoing food, housing or personal care to pay for transit ( 4 ). Therefore, the price of transit may take a disproportionately greater toll on the low-income riders who depend on it most ( 5 ).
Transit agencies have developed different equity-related programs to help lessen the impacts transit fares can have on low-income riders. Strategies include adjusting fare prices based on distance and time of day ( 6 ), using smart cards to automatically calculate the best fare for a user ( 7 ), and using free feeder transit lines to increase access to larger transit markets ( 8 ). Another strategy is using direct subsidies targeted to riders with the greatest financial need, basing eligibility on either a specified income level threshold or prior qualification for another state or federal welfare program ( 9 ). This means-based strategy is the focus of this paper.
Despite the societal benefits of administering low-income reduced-fare programs, they are not universally implemented across all transit agencies in the United States. This could make it difficult for an agency considering starting a program to identify what features to implement or for agencies with existing programs to identify ways to make theirs more effective and equitable. This paper serves to fill this gap by contributing a synthesis of existing low-income reduced-fare programs implemented by large transit agencies, a comparison of the programs, the identification of common practices, and a method to evaluate the transit “fare burden” of reduced-fare programs.
Literature Review
This section briefly reviews the existing body of research pertaining to the study, beginning with a summary of past research on the equity of transit pricing and fare policies, and followed by research about existing reduced-fare programs for low-income youth. Then, the most relevant piece of literature is presented, including a discussion of its limitations and gaps in the current literature.
There is a large body of literature pertaining to transit pricing, fare policy, and their equity impacts on transit-dependent and low-income riders ( 10 – 14 ). Several studies analyze the equity impacts attributed to different fare structures. A 1982 study analyzing fare policy changes of the Metropolitan Atlanta Rapid Transit Authority concluded that direct user subsidies to low-income riders provided the most equitable option while maintaining the highest system efficiency ( 9 ). A 2007 literature review of transport policies determined that categorically targeted subsidies (such as those for the elderly or students) are not well-distributed by income and suggested agencies instead distribute subsidies using income level for eligibility ( 15 ). A 2009 paper estimating the potential impacts of fare changes on low-income transit riders in the east San Francisco Bay area found that universal increases in fares disproportionately harm low-income earners, though the focus of the paper was on overarching fare policy and not on reduced-fare programs ( 16 ). A 2017 qualitative study on transit fare affordability in New York City discussed the trade-offs low-income riders must make to pay for transit and described the limitations of reduced transit fares administered by welfare organizations with limited assistance from agencies ( 4 ).
Some of the more relevant prior research focuses specifically on agencies’ use of reduced-fare or free transit passes for youth riders from low-income households, though the focus of this research is mainly on system ridership impacts. A 2004 study on a program that distributed free transit passes to students from low-income households in the east San Francisco Bay area found that a 1 year implementation of the program increased student bus ridership; however, the paper did not discuss the impacts the distribution of passes had on households ( 17 ). Similarly, a 2017 paper discussing ridership impacts of the Massachusetts Bay Transportation Authority’s (MBTA) Youth Pass pilot program found that 13% of trips made by participants would not have been taken had the participant not been in the reduced-fare program, indicating that the program made transit more affordable for participants ( 18 ). Finally, a 2019 analysis of fare subsidization for youth in Madrid found that subsidizing fares for youth from low-income households had little effect on their budgetary restrictions and made public transit overall more affordable, but providing the same subsidized passes to medium- and high-medium-income households significantly increased the individual welfare of higher-income households ( 19 ). Therefore, there is limited existing literature relating specifically to low-income reduced-fare programs and not just those for riders within a target age or ability group.
A very relevant study by Harmony ( 8 ) discussed fare policy strategies used by transit agencies to bridge the gap between their competing goals of earning revenue and providing affordable service. Harmony conducted a univariate analysis on the reduced-fare programs of 61 American transit agencies and found that agency size was not the limitation to using more equitable targeted strategies, but that operational simplicity and a lack of agency education were likely the cause. Harmony also provided three case studies of different fare strategy implementations. In recent years, however, many more agencies have developed low-income reduced-fare programs with unique program elements, which provides the opportunity for an updated comparison of new case studies.
In summary, the literature on low-income reduced-fare programs has primarily focused on the equity impacts of different fare structures and the system ridership impacts of programs for youth riders. The primary contributions of this paper are to address this gap in the literature by conducting an in-depth review of low-income reduced-fare programs for large transit agencies and to provide an evaluation of the “fare burden” that different programs create for different users.
Research Questions
The primary research question of this paper is as follows: How are reduced-fare programs for low-income riders being implemented in the United States? Three additional questions stem from the primary question: What is the enrollment process for different low-income reduced-fare programs and how do they determine rider eligibility? What fare media do the programs use and how do the pricing discounts compare? What is the estimated transit expenditure for eligible riders? The qualitative analysis presented in this paper will help answer these questions and provide transit agencies interested in creating or adjusting their own low-income reduced-fare programs with strategies for potentially improving equity.
Methodology
A multiple case study method was used to examine reduced-fare programs for low-income transit riders. The programs were selected by examining the current fare policies of the top 50 largest transit agencies by number of unlinked passenger trips presented in the 2020 American Public Transportation Association Fact Book ( 20 ). Many transit agencies offer reduced fares for riders with disabilities, seniors, students, veterans, or Medicare recipients; however, only programs that provided a reduced-fare option for low-income riders who do not qualify for any other reduced-fare programs were considered for this study.
The qualifying agencies were subdivided into agencies that administer the low-income reduced-fare programs directly and agencies that utilize an external organization (such as a social service or non-profit organization) to facilitate applicant eligibility evaluation and fare pass distribution. The agency-administered programs were compared on three dimensions: enrollment and eligibility, fare media and pricing discounts, and the estimated transit expenditure for eligible riders.
Documentation used for comparison was collected from the internet. Agency websites and publicly available documents provided information on the terms of eligibility for each program, pricing discounts and other program information ( 21 – 35 ). Fare structures presented on agency websites were used for the transit expenditure calculations ( 36 – 47 ).
Results
This section presents the comparison of case studies. The background information about the transit agencies identified is presented first, followed by sub-sections comparing the programs on three dimensions: eligibility and enrollment, fare media and pricing discounts, and estimated transit expenditure for eligible riders.
Background
Only 17 of the 50 largest transit agencies in the United States offer a reduced-fare option specifically for low-income riders. Table 1 lists the agencies with low-income reduced-fare programs. Agency background information as of 2020, including name, modes of public transportation, fare media available, and program administrator are shown. The agency annual unlinked passenger trips and ranking are from the 2020 APTA Fact Book ( 20 ). The percentage of the population below the federal poverty line for the metropolitan statistical area (MSA) served by each agency is from the 2018 American Community Survey 1 Year Estimates ( 48 ).
Background on Agencies with Low-Income Reduced-Fare Programs
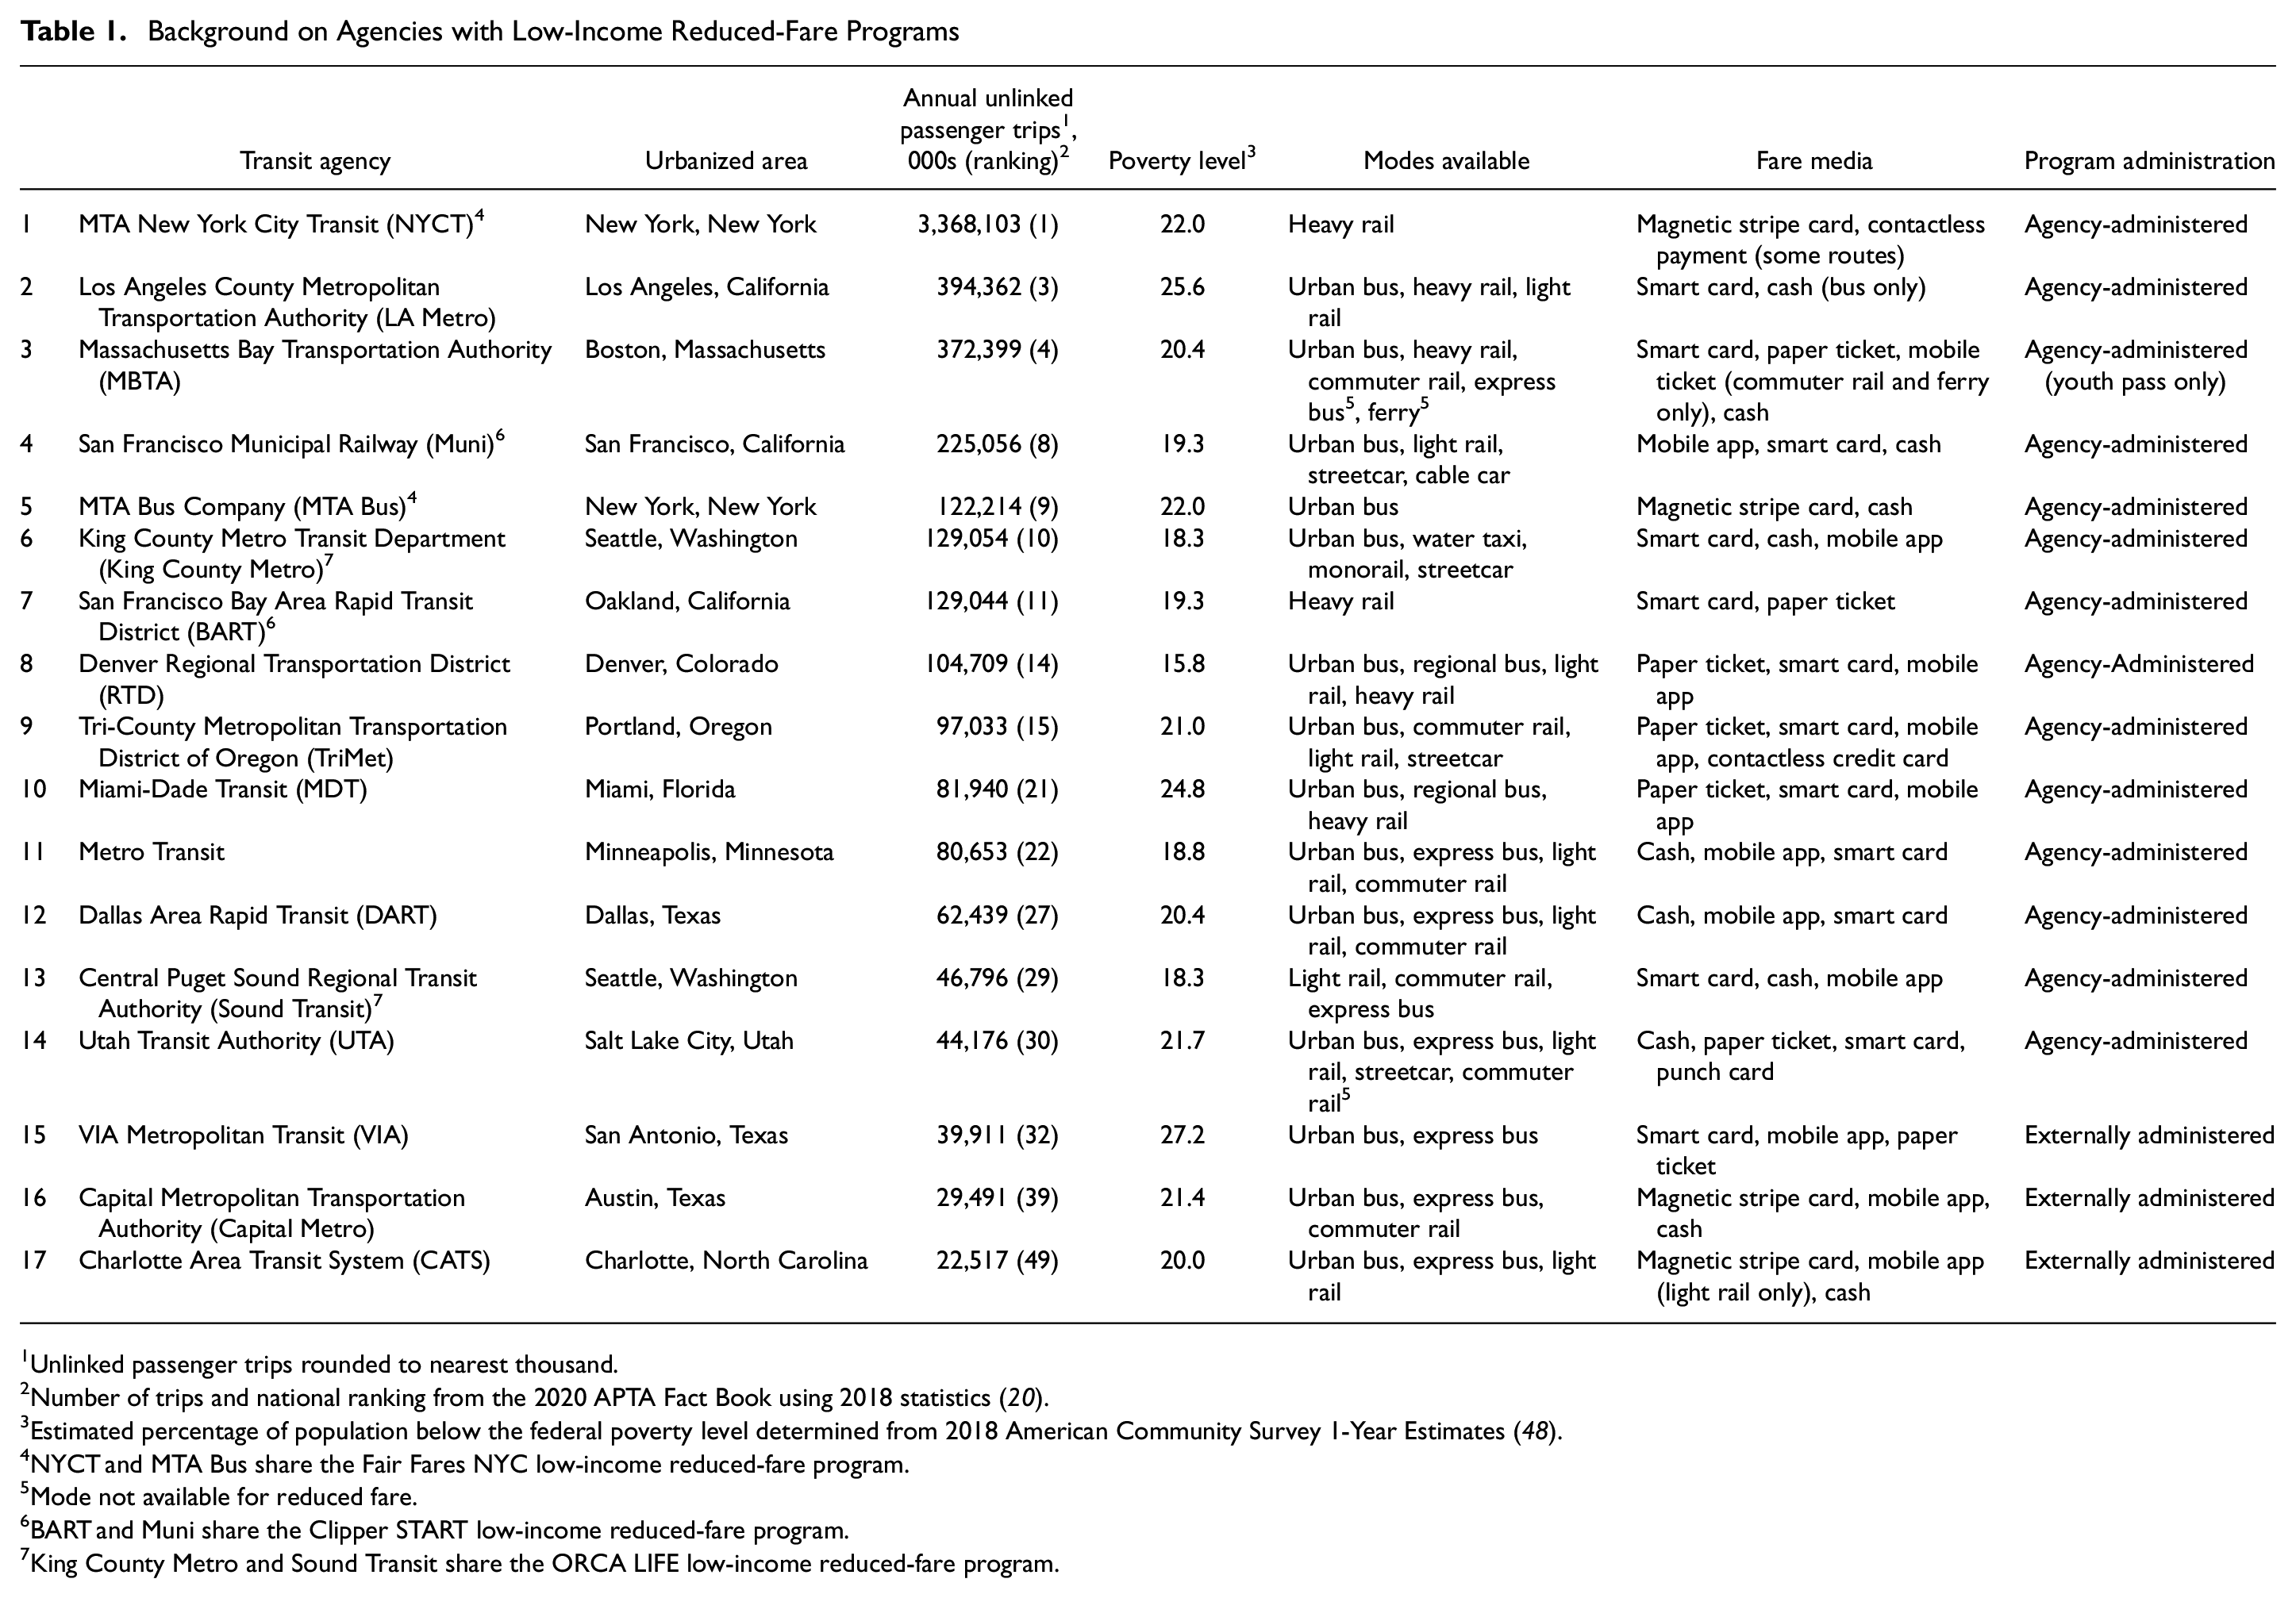
Unlinked passenger trips rounded to nearest thousand.
Number of trips and national ranking from the 2020 APTA Fact Book using 2018 statistics ( 20 ).
Estimated percentage of population below the federal poverty level determined from 2018 American Community Survey 1-Year Estimates ( 48 ).
NYCT and MTA Bus share the Fair Fares NYC low-income reduced-fare program.
Mode not available for reduced fare.
BART and Muni share the Clipper START low-income reduced-fare program.
King County Metro and Sound Transit share the ORCA LIFE low-income reduced-fare program.
Of the 17 qualifying agencies, 14 have agency-administered low-income reduced-fare programs, meaning that most or all rider-facing aspects of enrolling into and using the programs are administered by the transit agencies themselves. All 14 of the transit agencies that administer their own low-income reduced-fare programs are within the top 30 largest transit agencies, and six are in the top 10 largest transit agencies.
Many modes of transit are available to riders enrolled in the low-income reduced-fare programs. Only two of the 17 agencies impose restrictions on the modes available to low-income reduced-fare riders: participants in the Utah Transit Authority (UTA) program are not able to receive a reduced fare on commuter rail ( 31 ) and riders with the MBTA Youth Pass are not able to receive a reduced fare on express buses or ferries ( 23 ).
Three of the transit agencies offer externally administered reduced-fare programs for their low-income riders. This type of program is neither run nor administered by the transit agency, but still serves in providing low-income riders with discounted access to transit. No special fare cards are used, and no enrollment procedures are available through the transit agency. Instead, a low-income individual takes part in the reduced-fare program by picking up a transit pass (usually weekly or monthly) for free or for a discounted rate from a participating social service or non-profit organization. Therefore, an individual is deemed “eligible” for the program by their prior eligibility for that organization. The transit passes are typically sold at a discount from the agency to the organizations.
To be a part of an externally administered reduced-fare program, social service organizations apply through the transit agency’s website or an agency contact. Most of the transit agencies with externally administered programs do not advertise which organizations are partners online, making the rider responsible for identifying which organizations can provide them with reduced fares. One notable exception is Charlotte Area Transit System (CATS), which has a list of partnered organizations publicly available on its website ( 34 ).
The three agencies with externally administered programs are ranked between the 30th and 50th largest agencies. Externally administered programs are likely favored by smaller agencies because of the relatively high administrative costs associated with running a reduced-fare program internally. Partnering with external social service organizations and pooling resources is one strategy to mitigate such costs.
Because details about externally administered programs are specific to the relationship between the social service or non-profit organization and the transit agency, and limited information about these arrangements is publicly available online, this type of program will not be discussed throughout the remainder of this paper. The following sections focus specifically on the 14 agencies that administer their own programs, beginning with enrollment and eligibility requirements.
Enrollment and Eligibility
The enrollment and eligibility requirements for the agency-administered programs vary for each of the 14 agencies, as shown in Table 2. The program names and enrollment processes (whether enrollment takes place online or in person) are presented, followed by information on whether the program requires an applicant’s household income be at or below a certain percentage of the federal poverty level. Also included are additional eligibility requirements, such as age, county or state of residence, or prior qualification for other low-income programs, such as SNAP (Supplemental Nutrition Assistance Program) or EBT (Electronic Benefits Transfer). Additionally, the frequency at which a program participant typically renews their pass is included.
Enrollment and Eligibility Requirements for Agency-Administered Programs
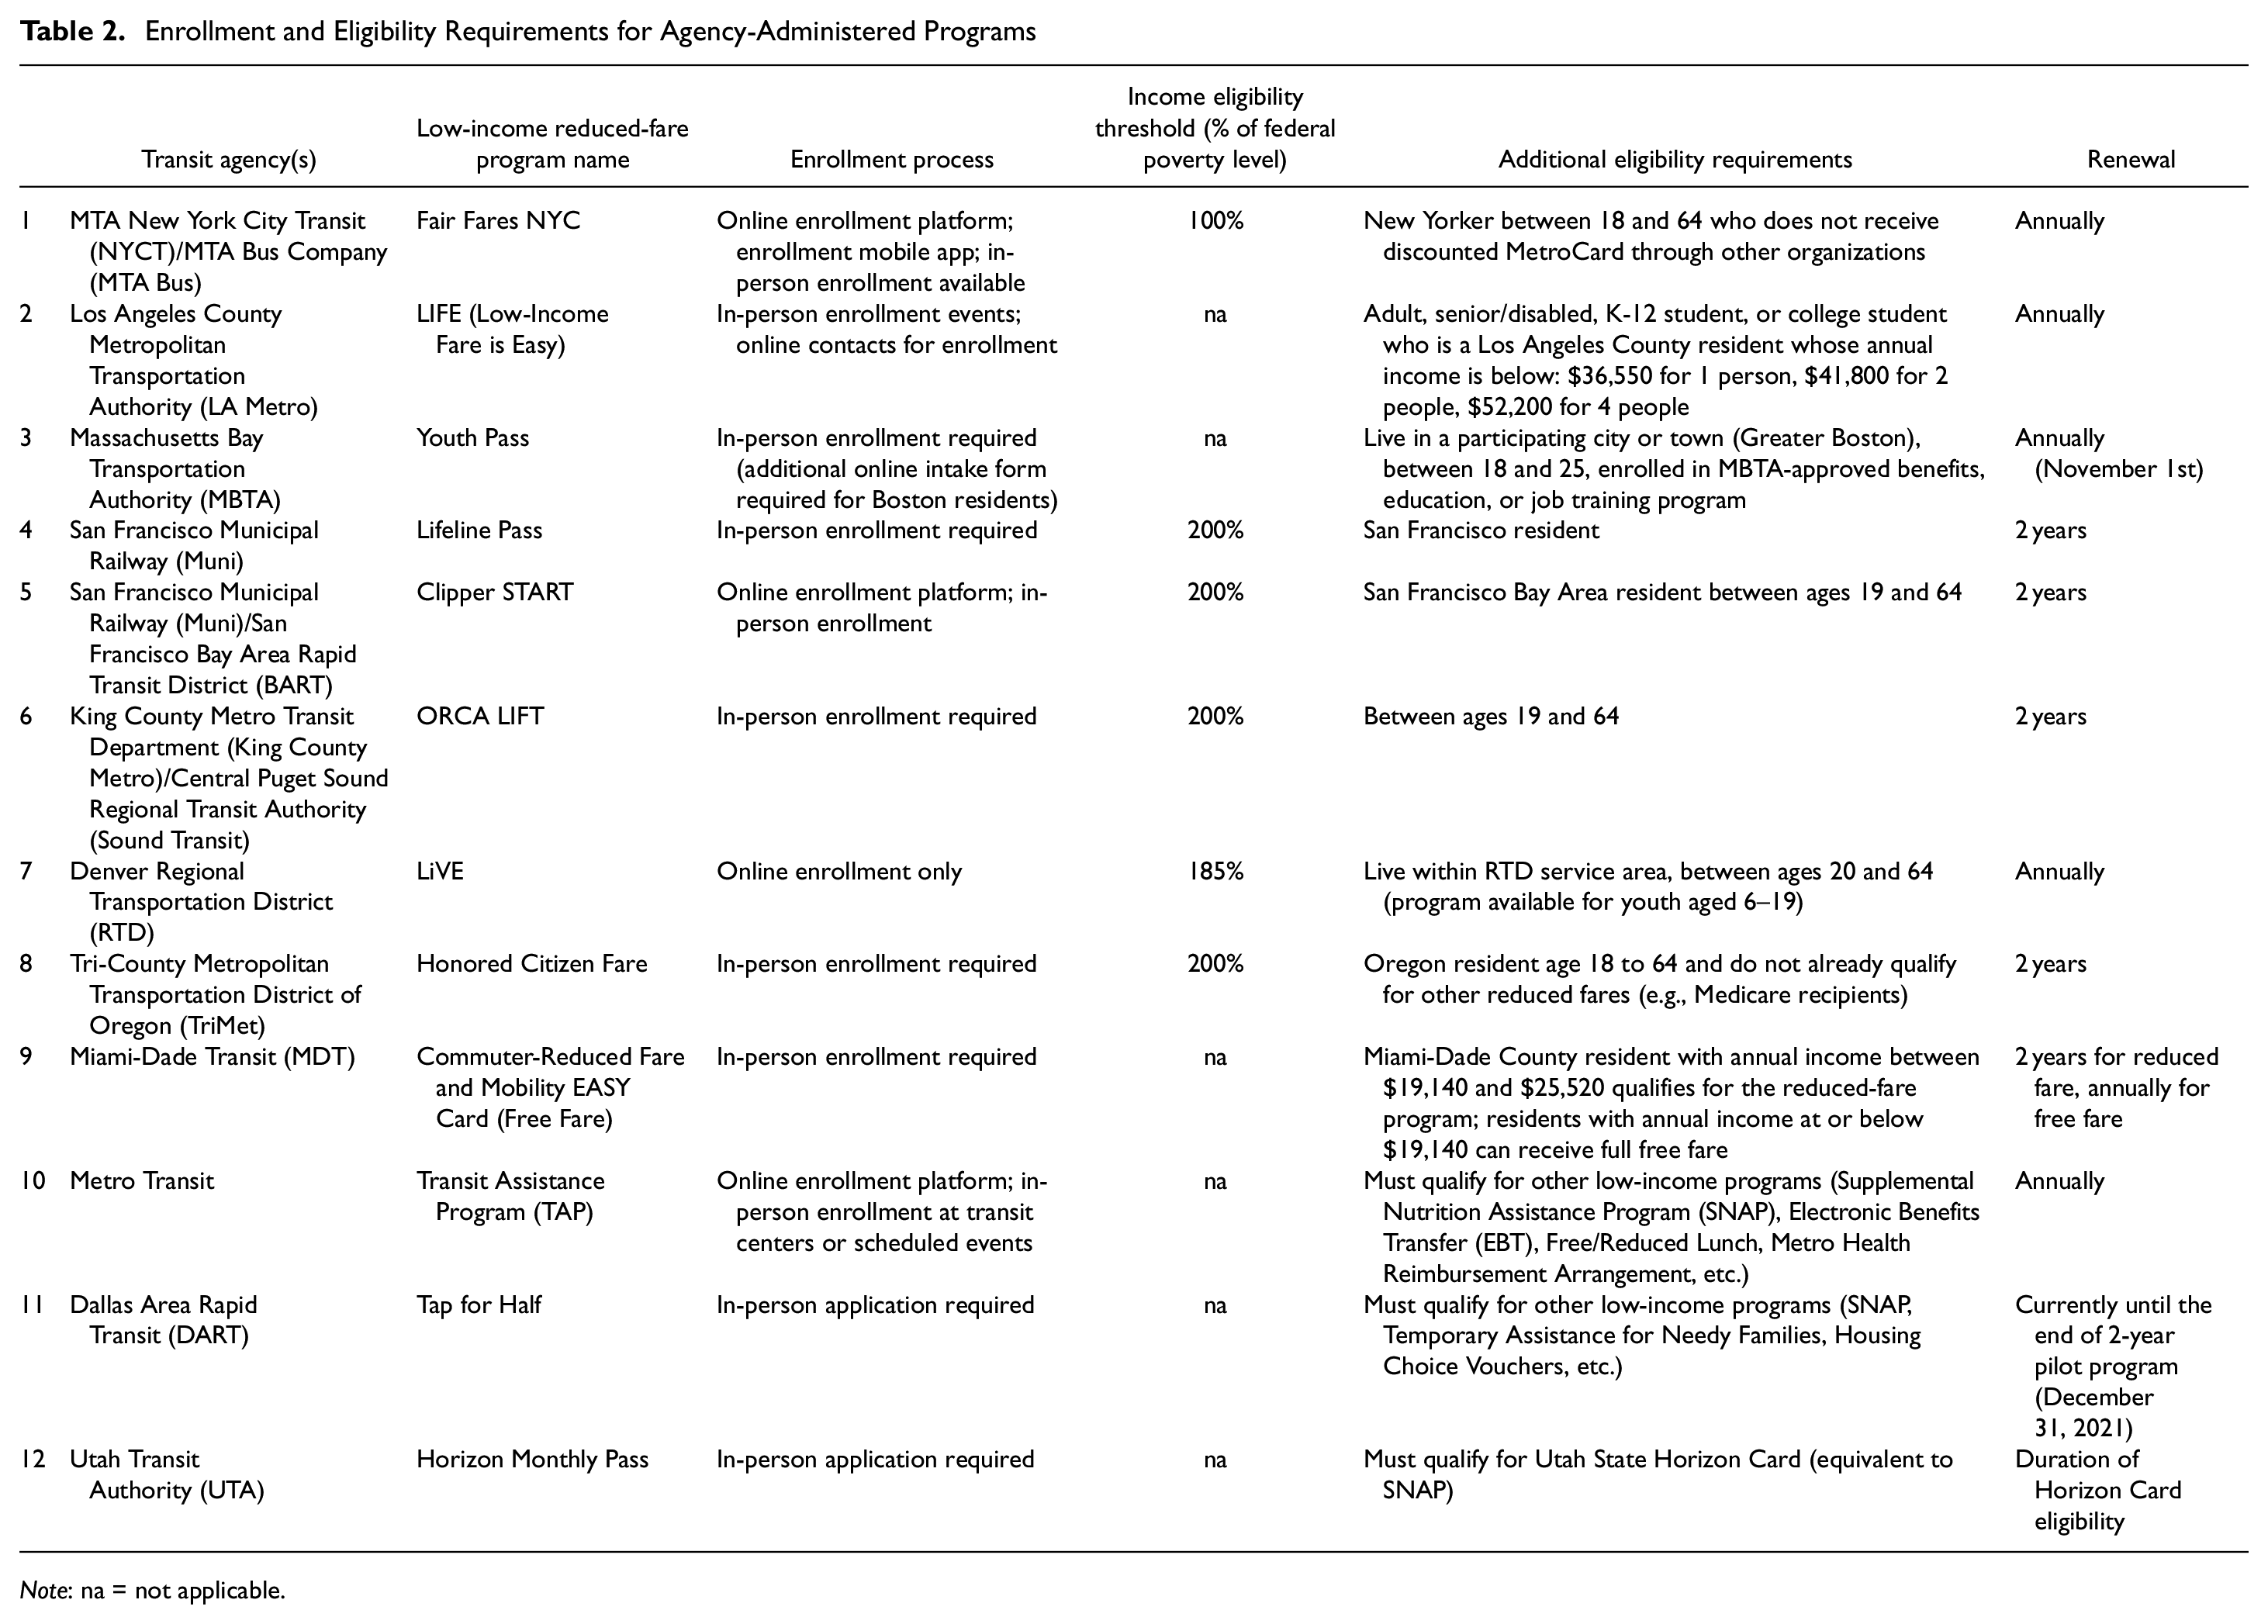
Note: na = not applicable.
The 14 transit agencies that administer their own programs have 12 low-income reduced-fare programs. This is because the agencies that share urbanized areas also share low-income reduced-fare programs. New York City Transit (NYCT) and MTA Bus share the Fair Fares NYC program ( 21 ), King County Metro and Sound Transit share the ORCA LIFT program ( 25 ), and Muni and Bay Area Rapid Transit (BART) share the Clipper START program ( 35 ). These agencies are able to participate in shared programs because they share fare media (the New York area agencies share the MetroCard magnetic stripe card, the Seattle area agencies share the ORCA smart card, and the San Francisco Bay area agencies share the Clipper smart card). Muni also has a separate program from Clipper START for its own transit service—the Lifeline Pass program ( 24 ).
For the enrollment process, Denver Regional Transportation District’s (RTD) LiVE program is the only one that does not have an in-person enrollment option, requiring all applicants to submit their eligibility information online ( 26 ). Eight of the 14 agencies (seven of the 12 programs) require applicants to enroll in person. Fair Fares NYC is the only program that has a mobile app for eligibility evaluation and applicant enrollment ( 21 ). Both Metro Transit and LA Metro offer regularly held enrollment events at different locations throughout their urbanized areas in addition to online and in-person enrollment at transit offices ( 22 , 29 ). MBTA’s Youth Pass program requires only applicants from the city of Boston to submit an online intake form in addition to enrolling in person ( 23 ).
To determine an applicant’s eligibility, six of the 12 programs base eligibility on the applicant’s household income as a percentage of the federal poverty level. Three agencies’ programs—Metro Transit’s Transit Assistance Program (TAP), Dallas Area Rapid Transit’s (DART) Tap for Half, UTA’s Horizon Monthly Pass—base applicant eligibility on prior qualification for a social welfare program available to low-income persons (including SNAP, EBT, Housing Choice Vouchers, Free/Reduced Lunch, etc.) ( 29 – 31 ). MBTA’s Youth Pass program requires an applicant be enrolled in a social welfare program or in an approved educational or job training program ( 23 ). LA Metro’s Low-Income Fare is Easy (LIFE) program uses income level as an eligibility requirement; however, a fixed income reference is used as opposed to a percentage of the federal poverty level. Based on this income reference, the LA Metro income eligibility threshold ranges from approximately 286% of the 2020 federal poverty level for a household of one to approximately 199% of the 2020 federal poverty level for a household of four ( 22 ).
Miami-Dade Transit’s (MDT) program also uses a fixed income reference; however, their program offers two different tiers of fare reductions for low-income riders: for riders with an individual annual income between $19,140 and $25,520 (between 150% and 200% of the 2020 federal poverty level), the rider can enroll in the Commuter-Reduced Fare program and receive 50% off the transit fare; for riders with an individual annual income below $19,140 (150% of the federal poverty level), the rider can enroll in the Mobility EASY Card program and receive completely free transit fares ( 28 ).
The ORCA LIFT program is the only low-income reduced-fare program that does not have an explicitly stated residency requirement ( 25 ). Because in-person enrollment is required for this program, it is likely that minimal fraudulent enrollments by non-residents occur.
MBTA’s Youth Pass requires applicants be between 18 and 25 years old ( 23 ). MBTA provides Student CharlieCards for middle- and high-school students and typical reduced fares for elderly riders 65 and older, but the Youth Pass program is the only low-income reduced-fare program that has an age service gap of this nature. For example, RTD’s LiVE program participants must be between 20 and 64, but RTD has a general reduced-fare program for youth riders aged 6 to 19 ( 26 ). All other low-income reduced-fare programs cover riders from 18 to 64 or require prior qualification for other low-income programs, which have no age restrictions (21, 22, 24, 25, 27-31, 47).
For renewal, five of the 12 programs require participants to re-enroll annually and four of the programs require participants to re-enroll every 2 years. MDT’s tiered program splits the difference: riders in the Commuter-Reduced Fare program must renew every 2 years, but riders in the Mobility EASY Card (free fare) program must renew annually ( 28 ). DART’s Tap for Half program requires no re-enrollment; however, it is a 2 year pilot program that ends at the end of 2021, so applicants who enroll later receive less than the 2 years’ duration for discounts ( 30 ). For UTA’s Horizon Monthly Pass, riders are eligible to purchase discounted transit passes as long as they are eligible for the Utah State Horizon Card (akin to a SNAP card), which requires a case review every 6 to 12 months ( 31 ). MBTA’s Youth Pass requires renewal annually on November 1st regardless of the initial enrollment date ( 23 ).
Fare Media and Pricing Discount
Once a user is deemed eligible for a low-income reduced-fare program, the day-to-day use of each program varies as each uses different fare media to administer the reductions and each program provides a different pricing discount. Table 3 presents the features related to the use of each of the agency-administered low-income reduced-fare programs.
Fare Media and Pricing Discounts for Agency-Administered Programs
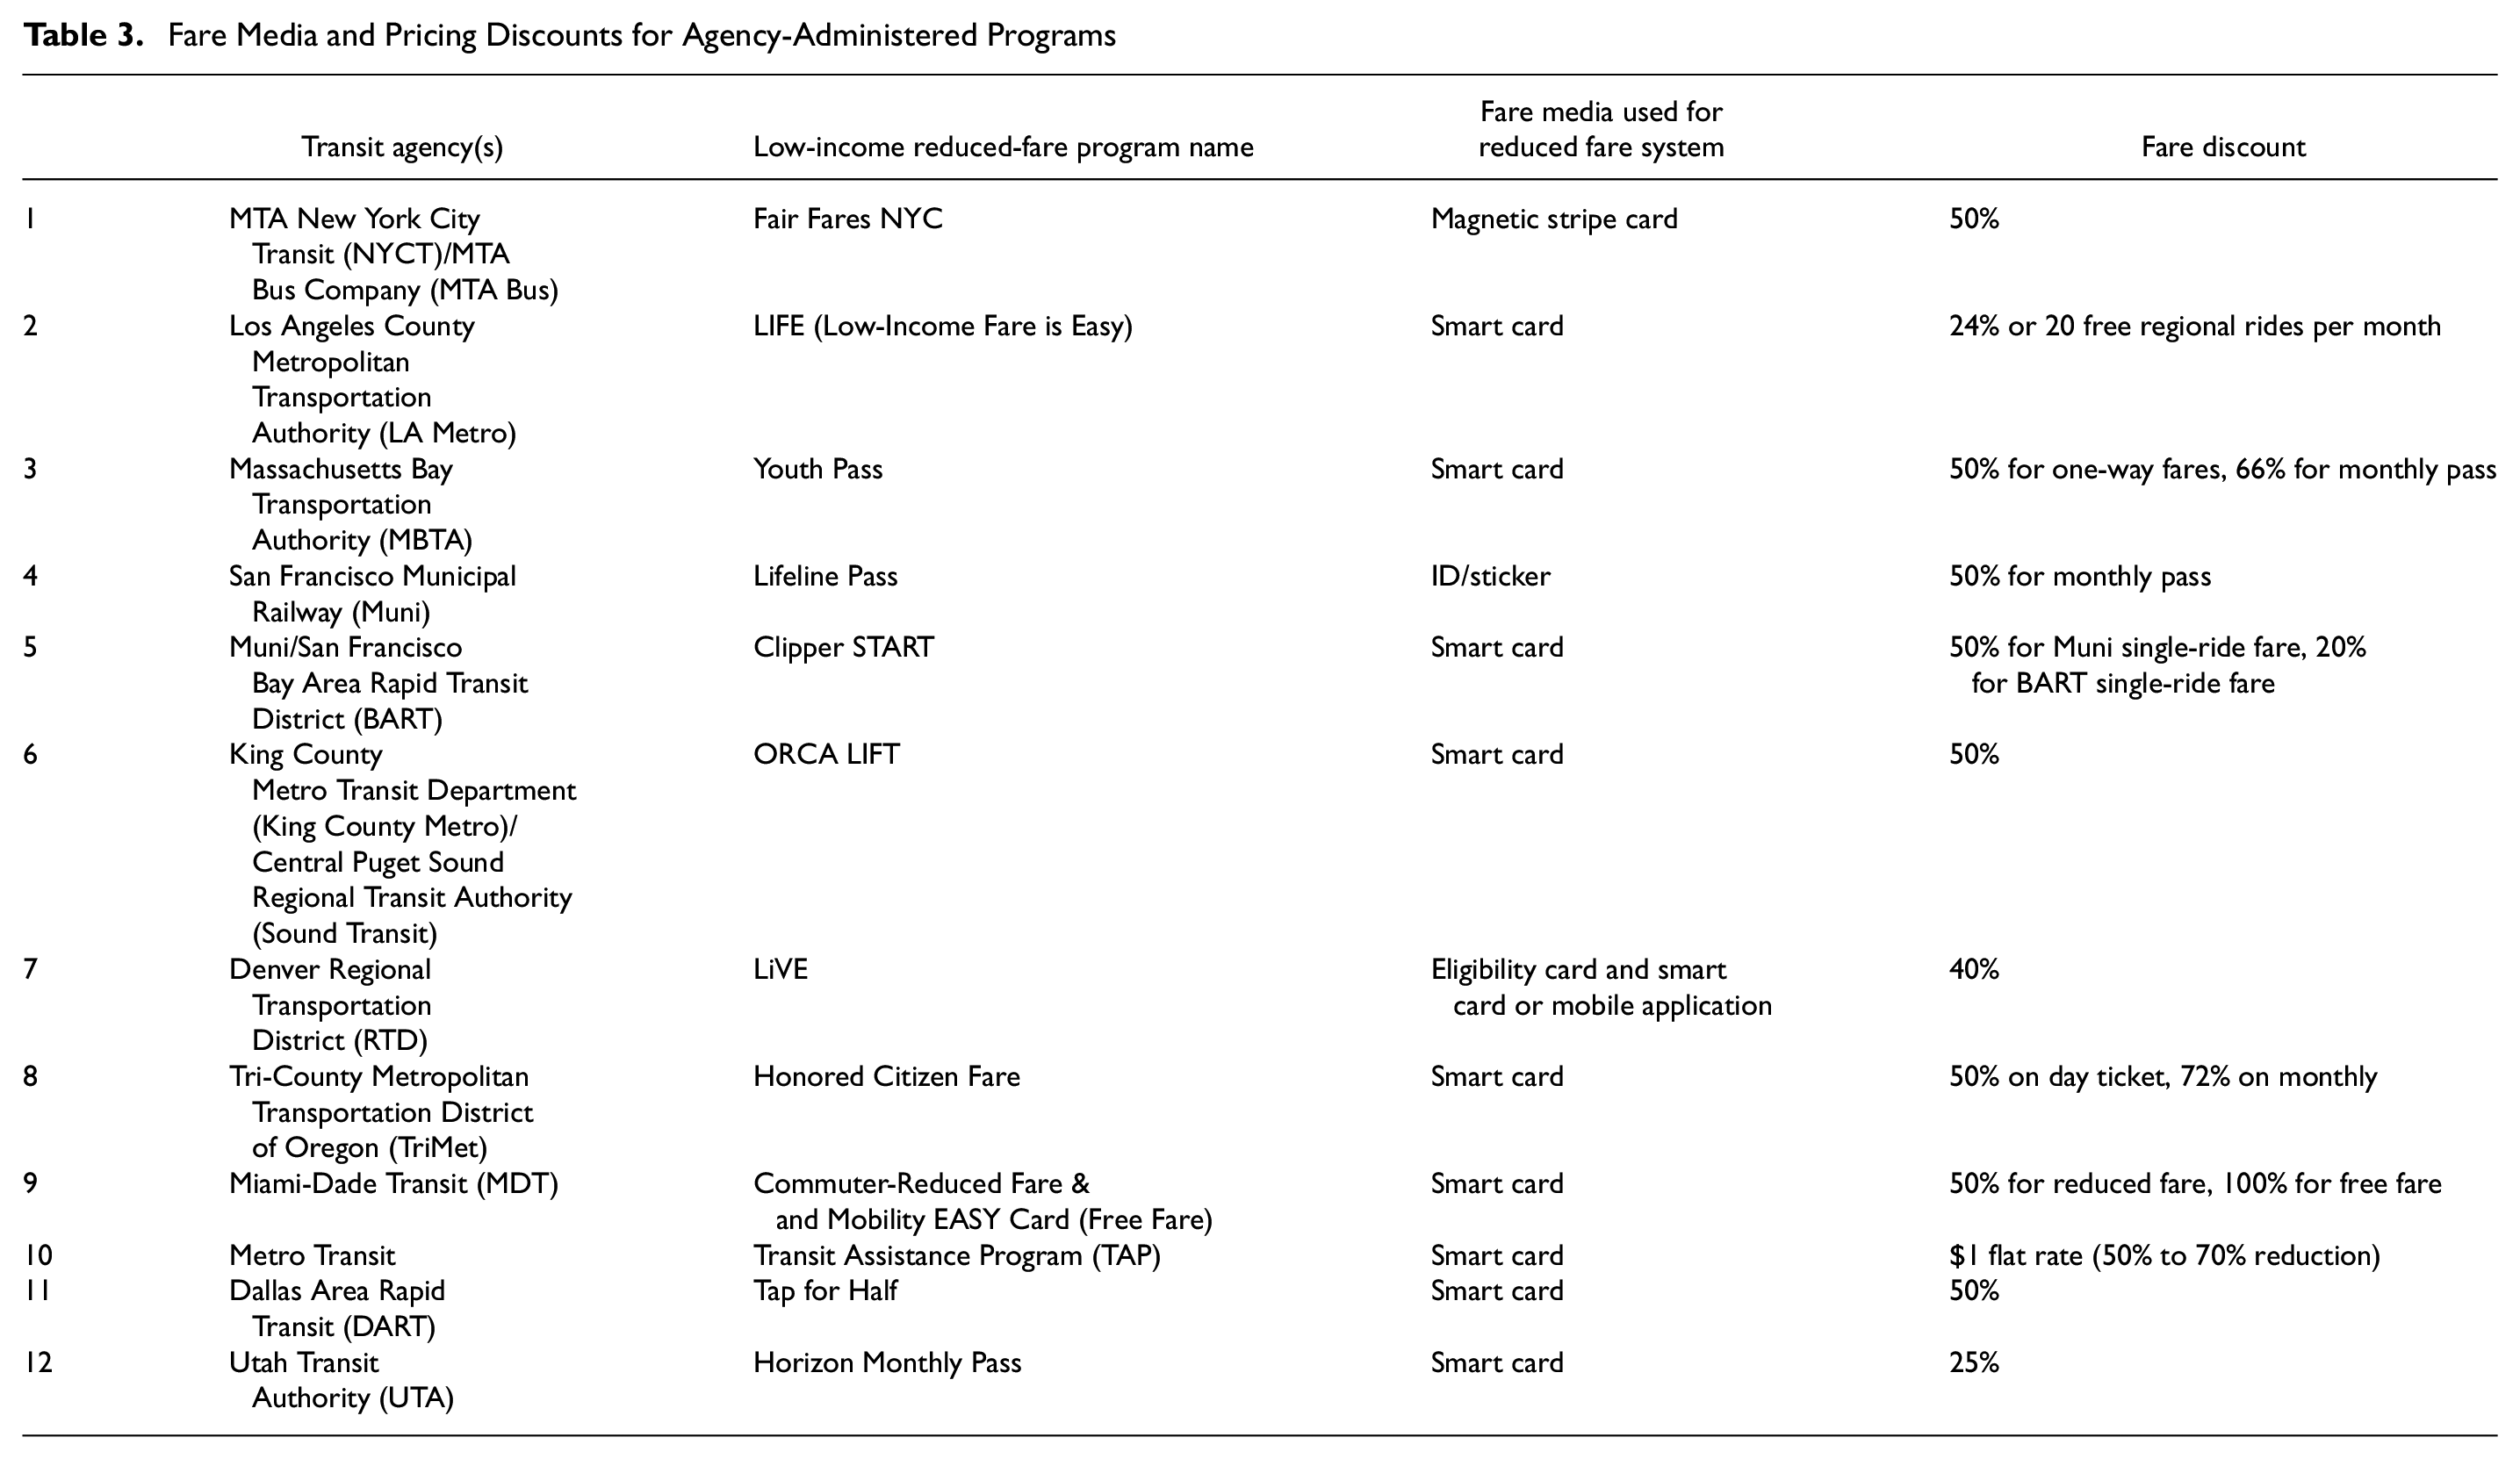
For fare media, 10 of the 12 programs use a specially programmed fare card with the pricing discount automatically applied when the card is refilled with cash value or a monthly transit pass. Nine of the 12 programs use smart cards, while Fair Fares NYC uses a pre-programmed magnetic stripe card ( 21 ). Muni is an exception, as its Lifeline Pass program uses a personalized ID card and monthly sticker as fare media. Participants in Muni’s program are issued the ID card and then purchase a new sticker (to apply to the ID card) every month at the reduced price. The ID card and sticker are then visually inspected by a Muni station agent every time transit is used ( 24 ). RTD’s LiVE program also issues an ID card; however, this is solely used as proof of eligibility. Participants in LiVE purchase a transit trip using a smartcard or mobile app and select the “Discounted” ticket option ( 26 ).
For pricing discounts, most of the programs provide a simple percentage discount to their participants’ fares. LA Metro’s LIFE program gives its participants the option to either purchase a monthly pass with a 24% discount or receive 20 free regional rides per month ( 22 ). Low-income Muni riders who are eligible for a reduced fare have the option to receive a 50% discount on monthly passes (through the Lifeline program) or a 50% discount on single-ride fares (through Clipper START) ( 24 ). Low-income BART riders enrolled in the same program are only eligible for a 20% discount on single-ride fares ( 35 ). Metro Transit’s TAP provides participants with a flat $1 fare regardless of mode or time of day, which equates to a 50% discount on local, non-peak hour bus fare and a 70% discount on express, peak hour bus fare ( 29 ). The MBTA’s Youth Pass and TriMet’s Honored Citizen Fare programs provide fare discount structures wherein participants can purchase single-trip or day fares for a 50% discount or can purchase a monthly pass with a larger discount (66% for MBTA and 72% for TriMet) ( 23 , 27 ).
Comparison of Eligibility and Pricing Discount
The difference between the fare discounts provided by each program can be more clearly visualized by factoring in the income eligibility threshold for each program. Figure 1 was created by the authors and estimates a low-income rider’s fare discount based on the program’s income eligibility requirement as a percentage of the 2020 federal poverty level for a household of one ($12,760 annually) ( 49 ). For programs that base eligibility on an applicant’s qualification for another low-income program, the income eligibility requirement was assumed to be 130% of the federal poverty level, as this is the typical cut-off for state SNAP and EBT programs ( 50 ). The MBTA Youth Pass program is not included in the figure because participants are not required to use income to determine eligibility—a rider could be eligible as a part of an educational or job training program ( 23 ).
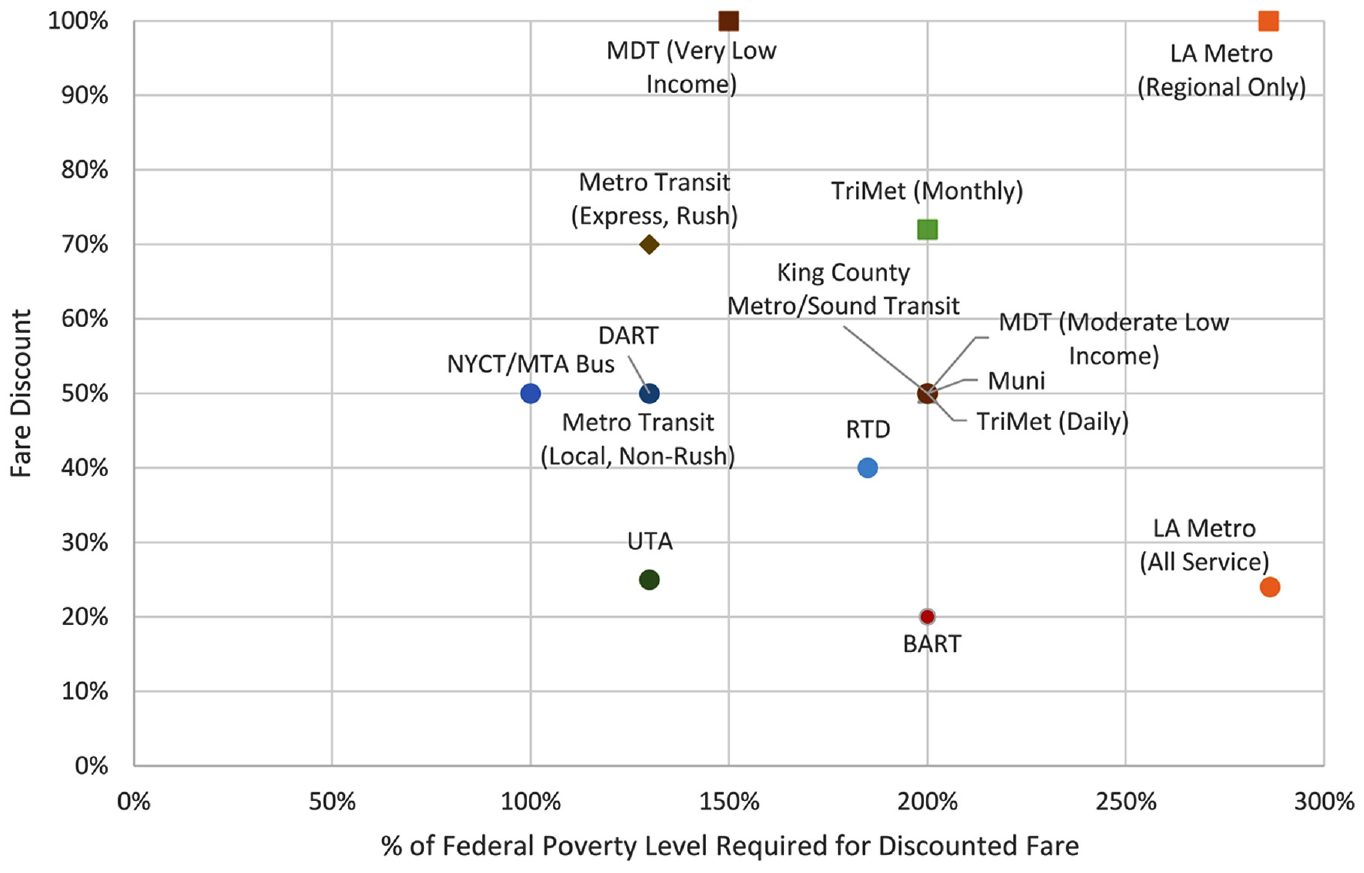
Fare discount versus income eligibility (as a percentage of the federal poverty level).
As can be seen in Figure 1, most of the programs provide a fare discount between 50% and 75% and have an income eligibility threshold of between 125% and 200% of the federal poverty level. BART’s Clipper START program provides the lowest fare discount of 20%. LA Metro’s LIFE program also provides a low fare discount (24%) for riders using the full service; however, it applies to the greatest number of people, with an income threshold of 286% of the federal poverty level for a one-person household. Conversely, NYCT/MTA Bus’ Fair Fares NYC program has the strictest income requirement, requiring applicants be at or below the federal poverty level for eligibility. The program that provides the greatest discount on all types of transit service is MDT’s Mobility EASY Card program, which provides 100% free transit fare for applicants at 150% of the federal poverty level and below.
Estimated Percentage of Annual Income Spent on Transit: Introducing the Fare Burden Concept
One reason reduced-fare programs are implemented for low-income riders is because the full fare for transit consumes a disproportionate percentage of their incomes. The percentage of a person’s income required to pay for transit can be described as that person’s “fare burden.” The goal of low-income reduced-fare programs is typically to make transit more affordable, where the level of discount and the income threshold to qualify for it suggest an implied fare burden range that the agency has determined to be affordable. Figure 2 shows the variation in estimated transit fare burden by income for 12 transit agencies with agency-administered low-income reduced-fare programs (MBTA’s Youth Pass program is not included because it does not use an income threshold to determine eligibility).
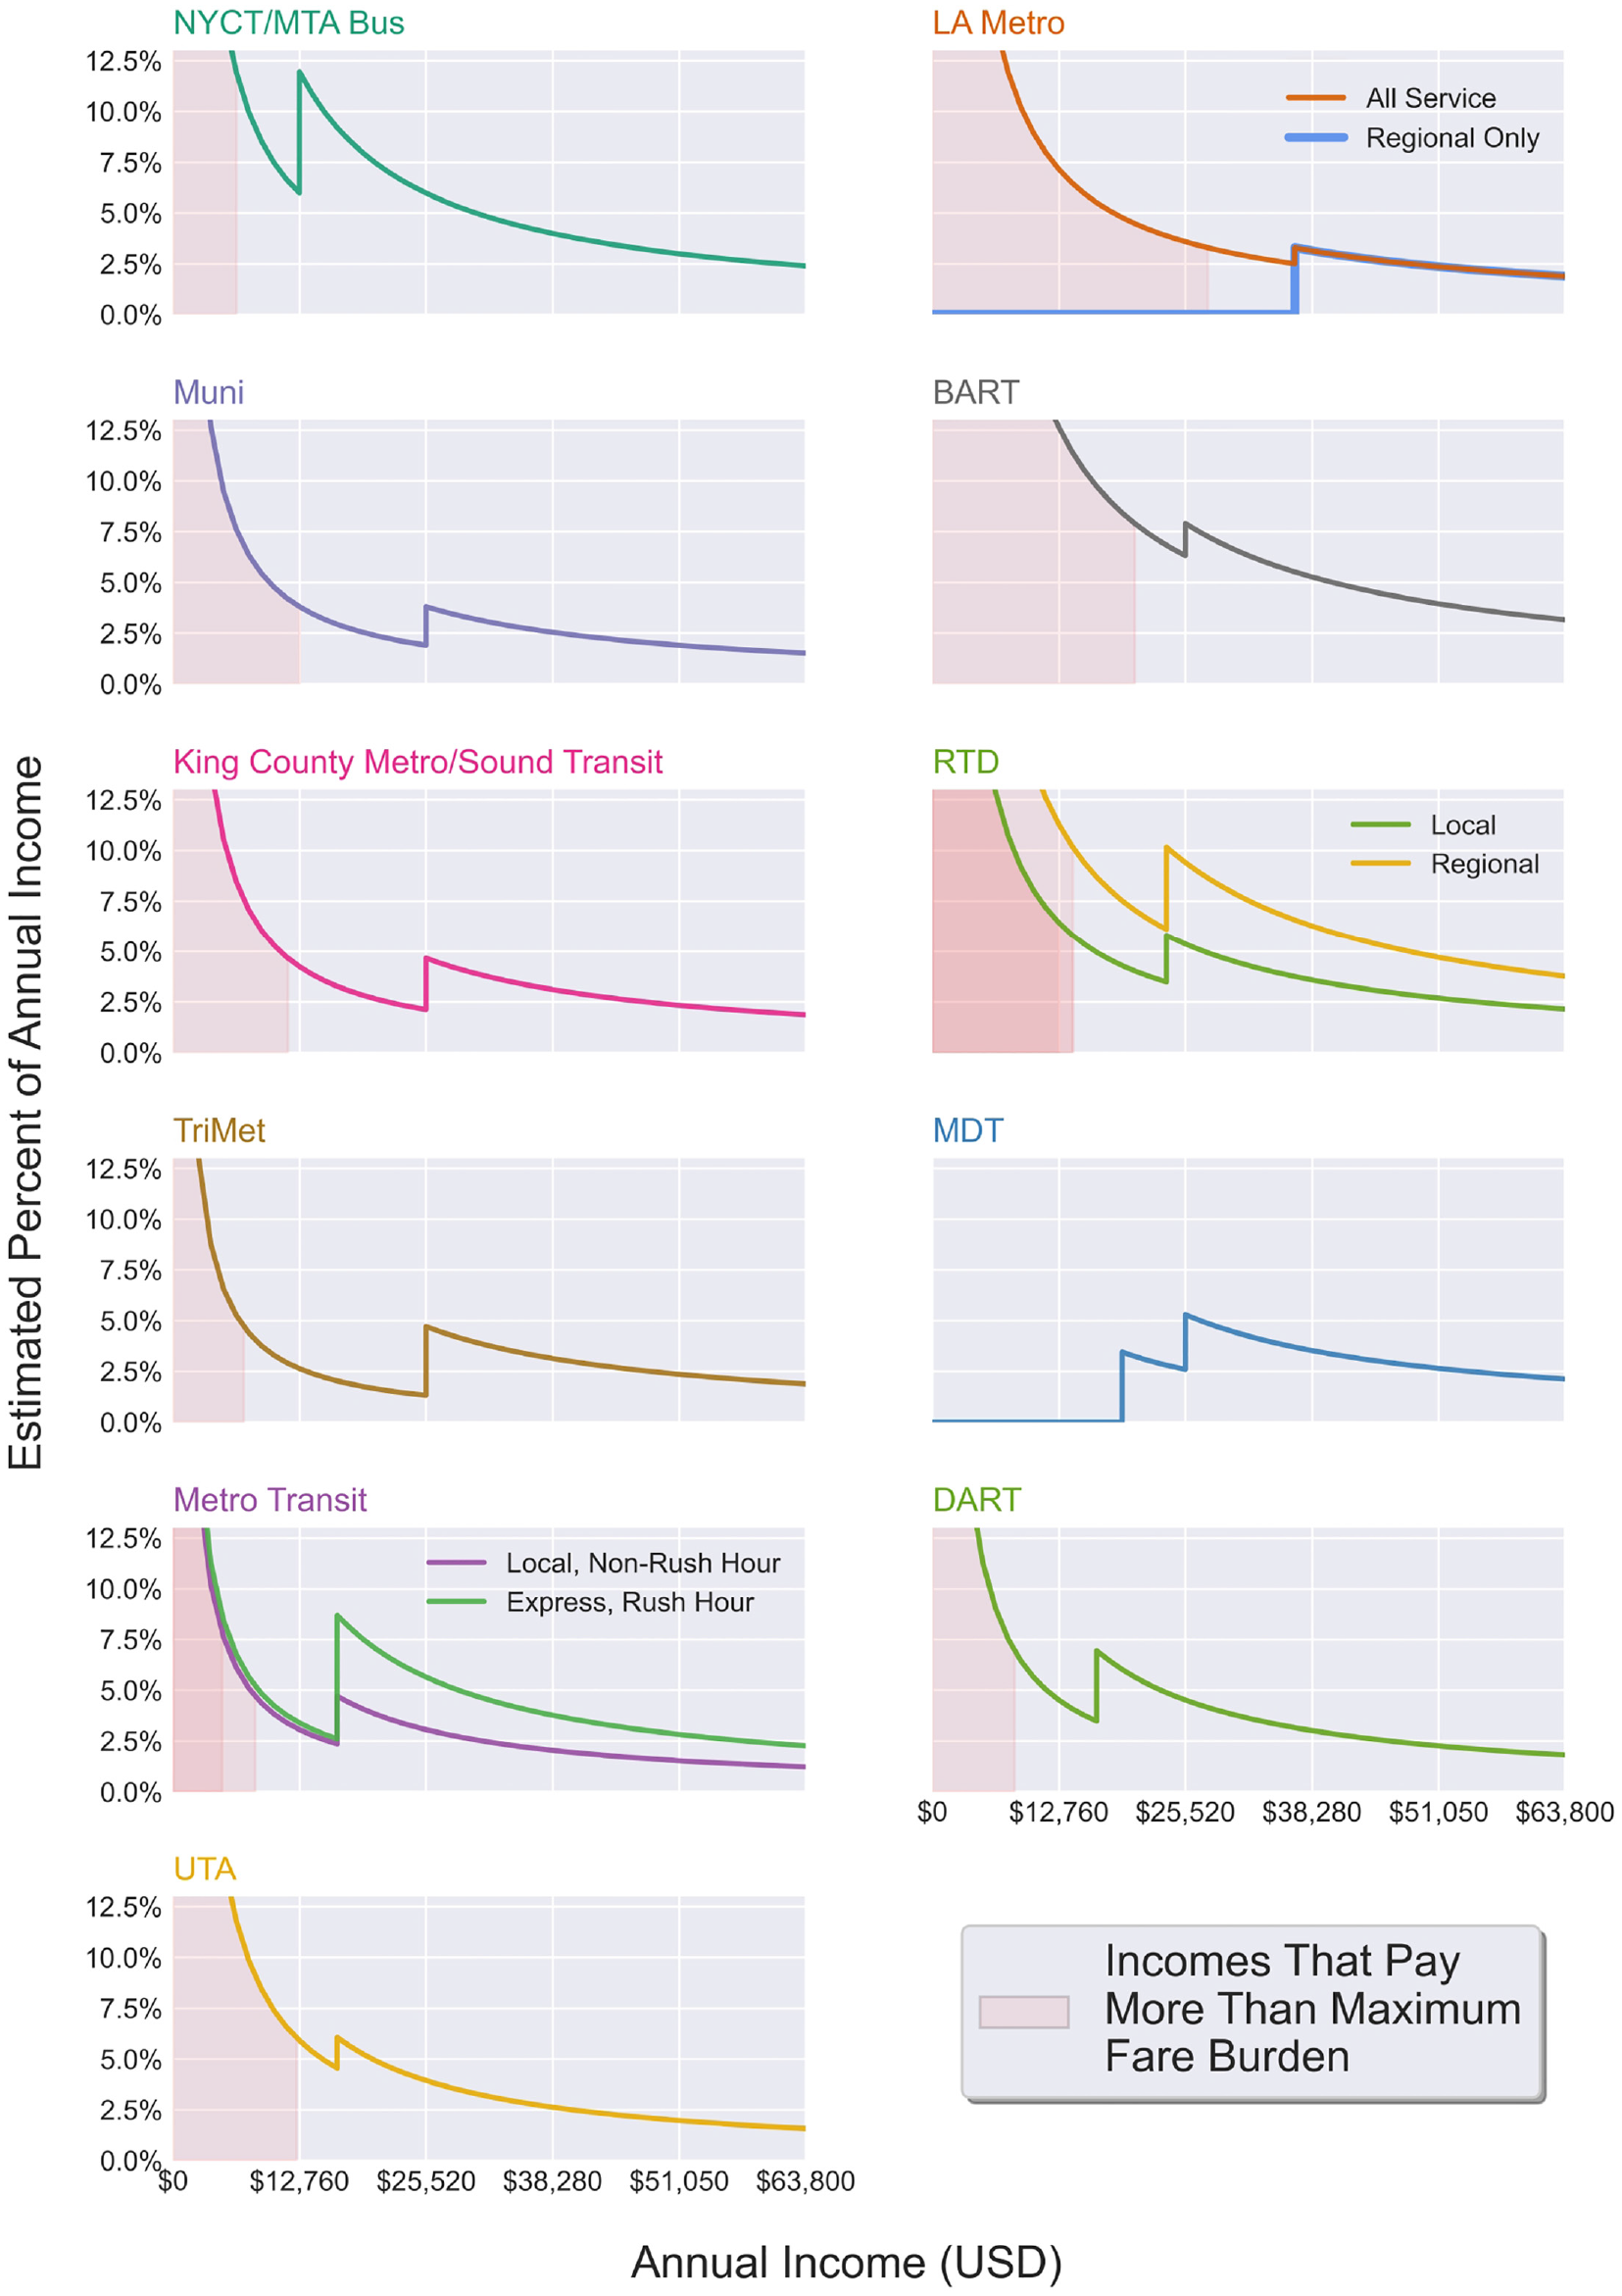
Estimated transit fare burden (shading represents range of incomes where burden exceeds target implied by the reduced-fare program).
Figure 2 was created by plotting the fare burden equation presented below for riders with income levels from $ 0 to 500% of the federal poverty level for a household of one person ($63,800) for each of the 12 transit agencies. First, the annual transit fare payment for each income level (the numerator in the equation) was found by annualizing the full-fare price of an unlimited monthly transit pass M for a transit agency n, and then applying the agency’s percentage fare discount as a function of the income level,

For BART, because the Clipper START program only discounts single-ride fares, the monthly fare price was calculated by multiplying the average single-trip full-fare price of $4 ( 47 ) by 42, the typical number of transit trips a commuter makes per month (two trips per the average 21 workdays each month) ( 51 ). As was done for Figure 1, the programs that base eligibility on an applicant’s enrollment in another low-income program had an assumed income eligibility threshold of 130% of the federal poverty level.
Most of the curves in Figure 2 have a “sawtooth” shape, with a sharp drop in the fare burden at the discount eligibility threshold income. The peak value at that threshold indicates a maximum fare burden that the agency’s program has implied to be acceptable (because individuals with incomes near the threshold who would otherwise have a higher fare burden are eligible for a discount). However, the fare discount strategy breaks down for people with very low incomes who would have a higher fare burden than those who do not qualify for discounts with incomes near the threshold. The income ranges for which this is the case are shown as red shaded areas below the curves in Figure 2. The income ranges (red shaded areas) were found by calculating the fare burden of individuals earning one dollar more than the eligibility threshold for each program (the peak of the “sawtooth”), and then determining the incomes of eligible riders that have an equal or greater fare burden. Based on this analysis, Figure 3 shows the maximum fare burdens implied by the fare discount programs at each agency, and Figure 4 shows the income level below which those who qualify for a discounted transit pass still pay more than the implied maximum fare burden. Some transit agencies serve places with higher costs of living and higher average incomes than others. Figure 5 partly accounts for these differences by showing the percentage of the population in each agency’s MSA with annual incomes below the values in Figure 4. The three agencies that offer separate discount structures for regional/express service and local service are shown separately in Figures 3 to 5.
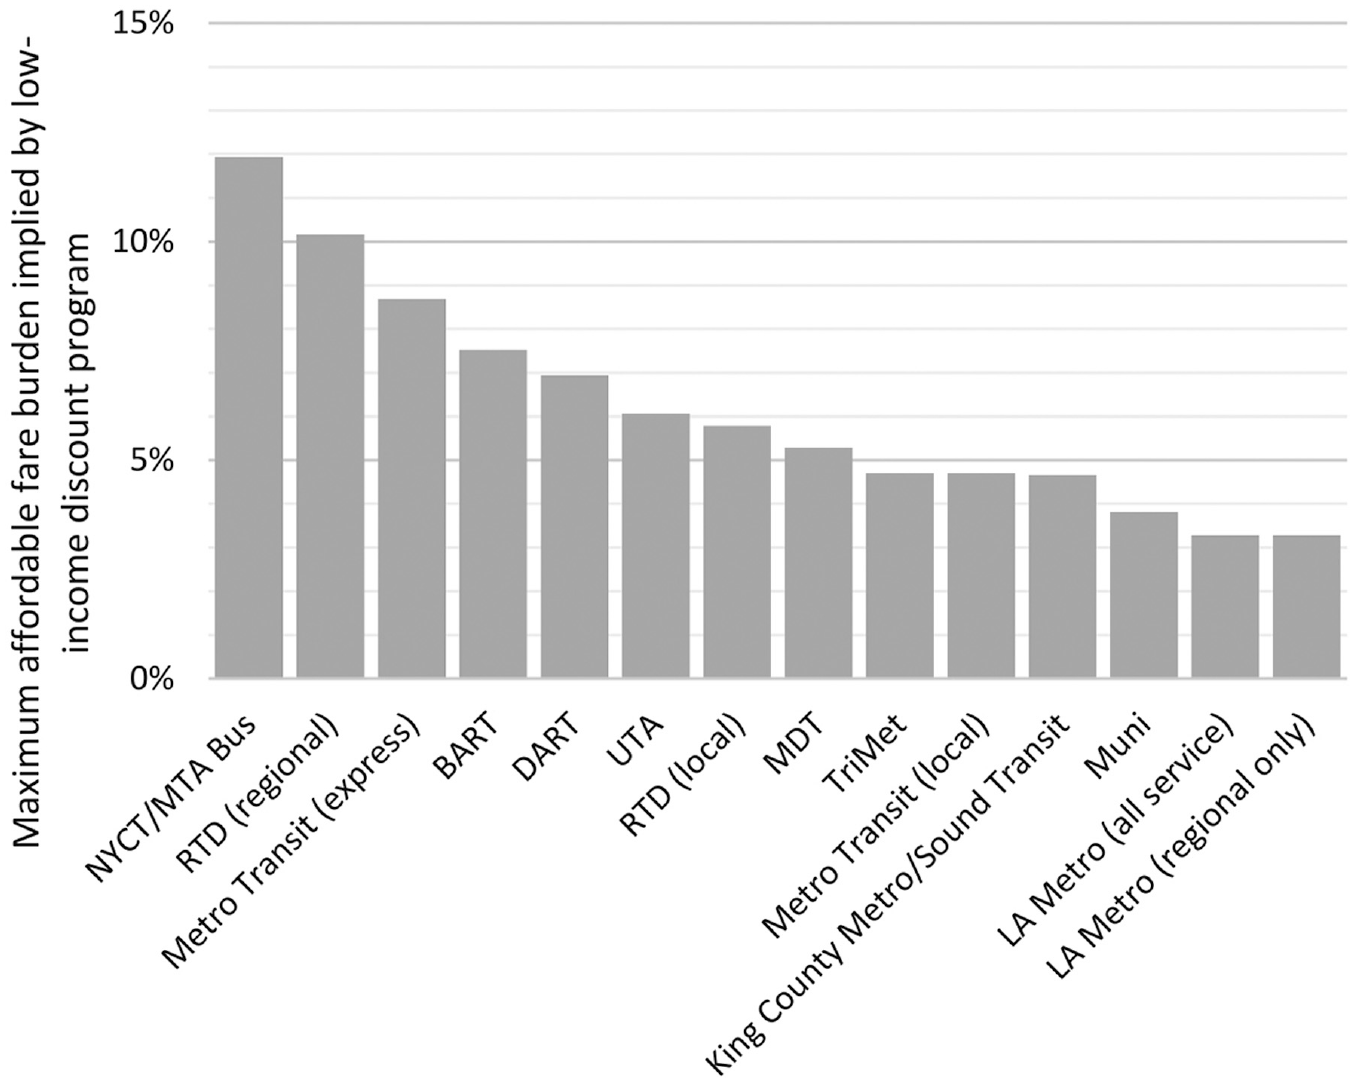
Maximum fare burden as a percentage of annual income implied by 11 agency-administered low-income reduced-fare programs.
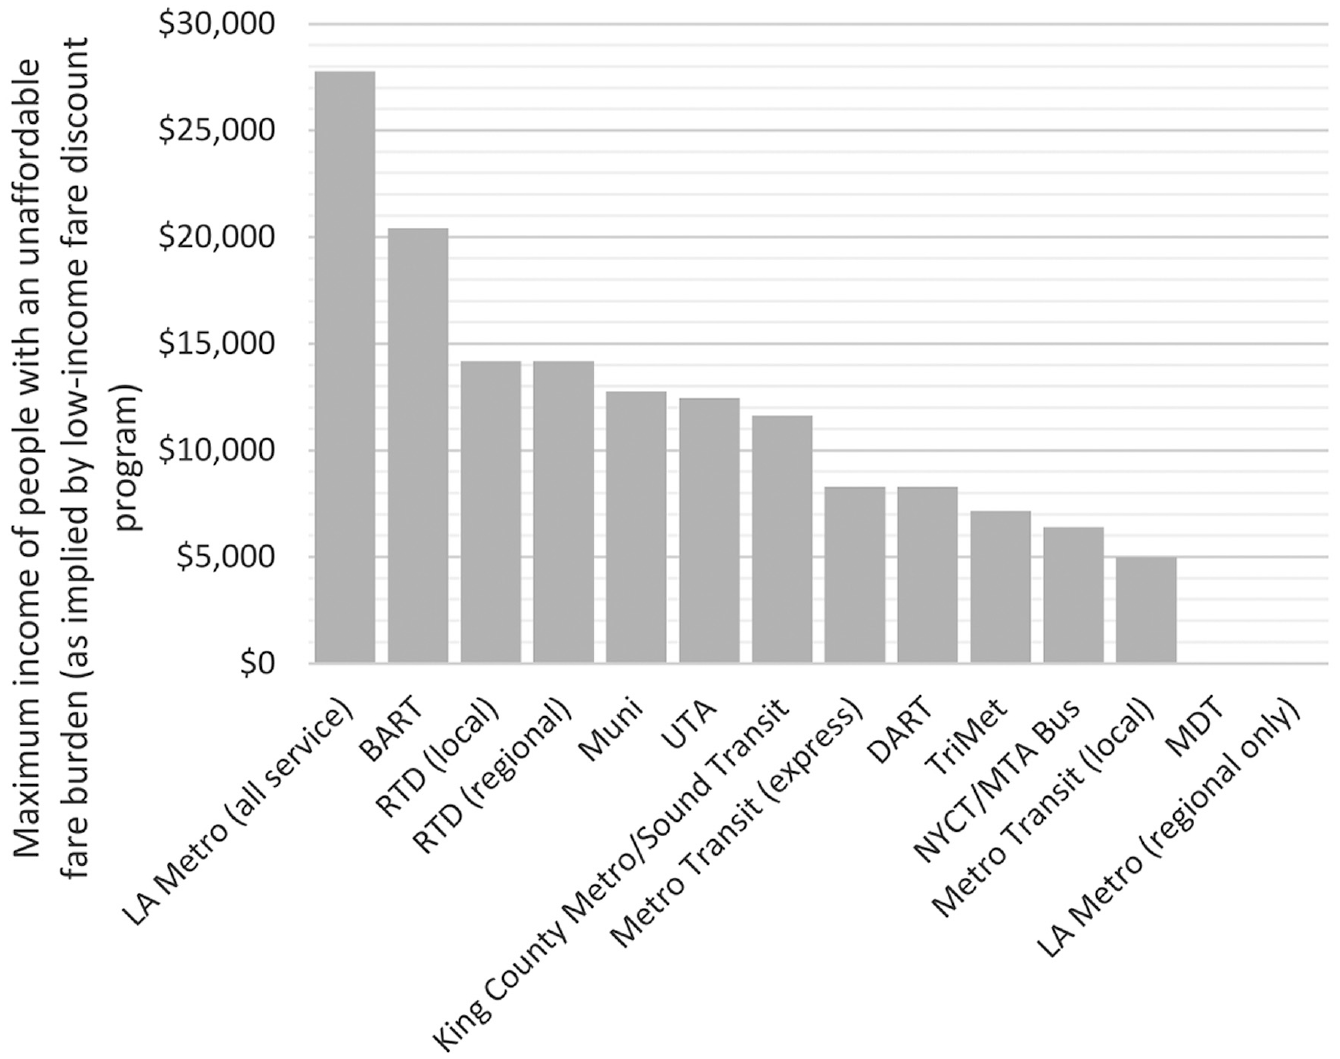
Maximum annual income of riders with a fare burden exceeding the maximum implied by 11 agency-administered low-income reduced-fare programs.
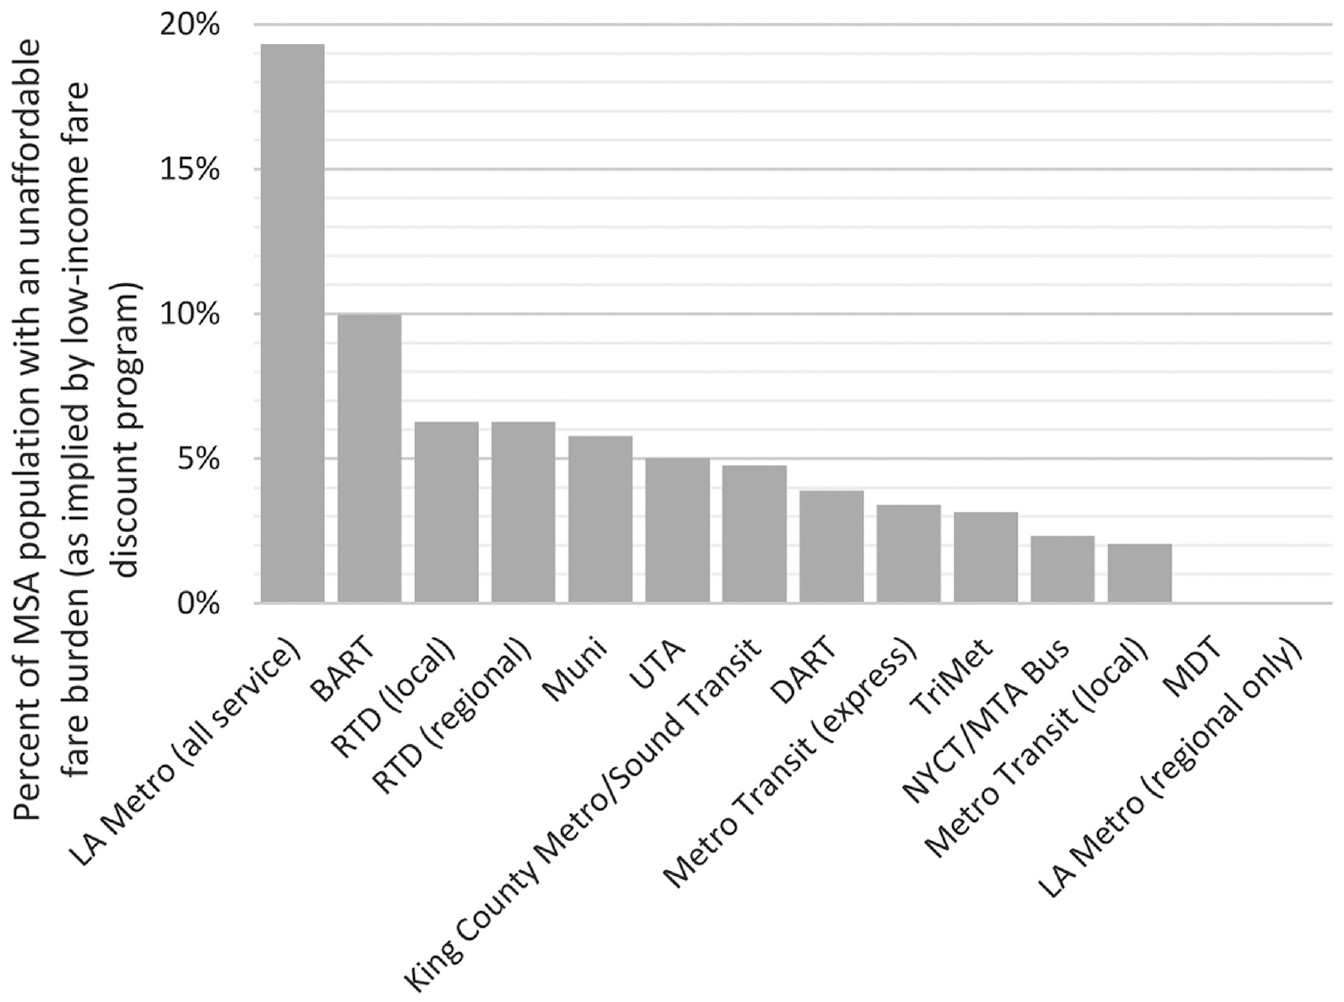
Percentage of metropolitan statistical area (MSA) population with a fare burden that exceeds the maximum implied by 10 agency-administered low-income reduced-fare programs.
Figure 3 shows that the maximum affordable fare burden implied by low-income reduced-fare programs varies from almost 12% for the NYCT/MTA Bus’ Fair Fares NYC program to just over 3% for LA Metro’s LIFE program. The values in Figure 3 were determined from the peaks of the “sawtooths” in the fare burden curves pictured in Figure 2.
Figure 4 shows that for 10 of the 14 discount amounts (counting local and regional/express discounts separately), the income below which individuals who qualify for reduced fares have a higher fare burden than the implied maximums illustrated in Figure 3 varies from about $14,000 to about $5,000 per year. The values in Figure 4 were determined from the right-most edge (highest income value) of the red shaded areas under the fare burden curves in Figure 2. LA Metro’s LIFE program offers the option of a 24% discount applied to rides on any service, or 20 free regional rides per month (which is essentially equal to a free monthly pass for regional trips only). For those who choose the discounted fare across all service, the income level where the fare burden is greater than the fare burden of those who do not qualify for the discount is the highest in the sample in Figure 4 at an estimated $27,778 per year. This high threshold is a result of two factors: first, the fare burden implied by the program is the lowest in the sample at just over 3%. Second, the discount of 24% provided by the program is one of the shallowest in the sample. For participants in LA Metro’s LIFE program who select the option for 20 free regional rides, and for participants in MDT’s low-income reduced-fare program, there is no income below which individuals would pay more than 5% of their income for monthly transit passes. Under the MDT program, riders with an estimated annual income below $19,139 qualify for a free fare. Riders earning between approximately $19,140 and $25,520 receive a 50% discount on their fare (28,43). By offering free fares to low-income riders, MDT and LA Metro (for regional service) ensure that riders earning well below the eligibility threshold are not spending inordinate percentages of their income on transit, which could otherwise be used on food or housing.
Figure 5 shows that a percentage of the population in each agency’s service area earns at or below the income levels displayed in Figure 4 except for MDT and LA Metro (for regional service). The values in Figure 5 were determined using linear interpolation between population percentages for the income level categories in the 2018 American Community Survey 1 Year Estimates ( 52 ). Almost 20% of the population of the Los Angeles metropolitan area would qualify for a discounted transit fare yet still have a higher fare burden than the implied maximum if they selected the 24% discount instead of the 20 free regional trips. For the remaining programs that do not offer free fares for low-income riders, the percentage of the MSA population who are eligible for reduced fares but would still have a higher fare burden than the implied maximum even after fare discounts are applied ranges from 2% for local rides on Metro Transit to 10% for BART.
Conclusions and Future Research
One strategy transit agencies have used to lower cost-related barriers to riding transit is implementing reduced-fare programs specifically for low-income riders. Seventeen of the 50 largest American transit agencies have reduced-fare programs for low-income riders. Fourteen of the 17 agencies administer the programs themselves and three are externally administered by social service or non-profit organizations. Using an external administrator can reduce both the cost and complexity of operating a low-income reduced-fare program, particularly for smaller transit agencies. Nine of the 14 agencies that administer their own programs require participants be at or below 125% to 200% of the federal poverty level for eligibility and provide a 50% discount on fares. Program participants at the income eligibility threshold typically spend an estimated 2% to 10% of their annual income on transit, although very-low-income people who qualify for the programs may still have a high fare burden even with the discounts because a higher proportion of their income is spent on transit fares.
Calculating the transit “fare burden” by income level offers a useful tool for evaluating the potential effectiveness of reduced-fare programs for low-income people. Agencies could explicitly determine an appropriate maximum fare burden and use this to guide the selection of one or more income thresholds for individuals to qualify for discounted fares. Multiple discount tiers, such as those used by the transit agency MDT, could be used to offer more deeply discounted (or even free) fares to riders with very low incomes to ensure that the identified maximum fare burden is never exceeded.
The analysis of fare burdens presented in this paper refers only to monthly passes and does not account for riders who pay fares on a per-trip basis but pay more per month than monthly passholders because they are very frequent riders. Fare capping programs, in which riders are no longer charged fares after their total monthly fare expenditures reach the (perhaps discounted) value of a monthly pass, are a tool that can reconcile this source of inequity.
Many areas for future research have emerged from this analysis. Future research could assess whether the discounts provided by each reduced-fare program are comparable when considering the cost of living in different metropolitan areas. Investigating the spatial distribution of income levels of transit riders could provide opportunities for a more detailed analysis of the trade-off between housing and transportation. Similarly, considering the frequencies of transit service in areas with a higher population of low-income riders could allow for the evaluation of the quality of service received by discounted fare recipients. Interviews and discussions with transit agency administrators could also shed light on the internal decision-making processes related to selecting discount percentages. Publicly available transit ridership data could be analyzed to determine the potential increase in transit trips provided to low-income individuals resulting from reduced-fare programs. Additionally, collecting cost-related data from transit agencies could allow for comparisons between the cost of different program features versus their added benefit to the users, as well as the impact of reduced-fare programs on farebox recovery. This future research could tie in to the fare burden curves for each agency and lead to a more robust model for assessing rider equity, both for those that are eligible for the low-income programs and for those that are ineligible but still earn well below the average annual income for their metropolitan area (i.e., the “working poor”).
This paper contributes to the fare policy literature by providing a synthesis of low-income reduced-fare programs implemented by large transit agencies in the United States, a comparison of the programs, the identification of common practices, and a method to evaluate the transit fare burden of reduced fare. Planners and policymakers at transit agencies with existing low-income reduced-fare programs can use the information provided to perform a self-assessment of their own programs to see how they compare with their peers. Transit agencies that do not currently have low-income reduced-fare programs but have interest in starting one can use this research as a tool to evaluate and establish income level eligibility thresholds based on their target fare burden and as a reference for information about typical features of reduced-fare programs. Though no one-size-fits-all solution exists, reduced-fare programs can be implemented in different ways by transit agencies with varying levels of administrative investment, all in an effort to help make transit more equitable for low-income riders.
Footnotes
Author Contributions
The authors confirm contribution to the paper as follows: study conception and design: C. Brakewood, E. Carpenter, T. Johnson-Praino; data collection: E. Carpenter, T. Johnson-Praino, W. Darling; analysis and interpretation of results: W. Darling; draft manuscript preparation: W. Darling, C. Brakewood, C. Voulgaris. All authors reviewed the results and approved the final version of the manuscript.
Declaration of Conflicting Interests
The author(s) declared no potential conflicts of interest with respect to the research, authorship, and/or publication of this article.
Funding
The author(s) disclosed receipt of the following financial support for the research, authorship, and/or publication of this article: This research was funded in part by the University of Tennessee, Knoxville.
Data Accessibility Statement
All data used in this article are publicly available. Data sources are described in the Methodology Section of this article.