
Abstract
In recent years, two-dimensional (2D) finite element modeling (FEM) has been used to explore how the structural integrity of a corrugated metal pipe (CMP) culvert is affected by simulation of its constituent components (i.e., the pipe metal, surrounding soil, or both). However, under various conditions, the nature of the problem is three-dimensional (3D) and 2D simulations may fall short of producing reasonable predictions. In this paper, the effect of various loading types on the structural response of round CMP culverts is investigated using 3D finite element (FE) models. The validity of the model was assessed by comparing the model output with previously published results from full-scale laboratory testing. The mechanical behaviour of real soil involves a significant degree of non-linearity. In soil-structure interaction problems such as the one considered here, it seems reasonable to expect that the non-linear behaviour of the soil, together with that of the soil-structure interface, would have a significant effect on the response of the structure. Furthermore, 2D models are limited in their ability to account for certain aspects of the actual, 3D problem. Such aspects include surface live load spreading through the cover soil and the structural behaviour of a corrugated pipe. This paper details the development of a comprehensive, 3D, non-linear FE model capable of simulating the behaviour of intact CMP culverts under backfilling and live loading. The analysis showed that the hyperbolic strain hardening model produced predicted response of the culvert that is very close to the obtained experimental data. However, the numerical results obtained using the Mohr-Coulomb or the linear elastic soil models were of less accuracy.
Many culverts are currently in service all over the world. Their abundance is a direct result of their considerable utility; most notably, culverts enable roads to be constructed across watercourses without blocking the flow of water. Any physical system in which a structure is in direct contact with the ground involves some degree of soil-structure interaction (SSI). In certain situations, however, the relationship between the response of the soil and the motion of the structure, and vice versa, is more integrated than in others. Buried flexible corrugated metal pipes (CMPs) subjected to earth and live loading, for example, interact with the surrounding soil to such a degree that they behave as composite (soil-metal) structures. The nature of this SSI is not straightforward where the main difficulty arises because the structural response of a CMP culvert relies on a complex interaction between the pipe and its surrounding soil ( 1 ).
The early history of buried flexible pipe analysis is described by Watkins and Anderson ( 2 ). In the early 20th century, Iowa State College Dean of Engineering, Anston Marston, was conducting research on buried rigid pipes with the goal of developing design procedures for highway pipes and culverts. He assigned his student M.G. Spangler the task of burying samples of rigid pipe and measuring the soil loads on them so that they could be related to the failure loads obtained from parallel-plate load tests ( 3 ). During this time, the prevalence of CMPs was on the rise. Spangler realized that, for these flexible pipes, the parallel plate load tests were not representative of buried conditions. This led to his development of the Iowa formula for predicting the increase in horizontal diameter produced by earth load placed above the crown of the pipe ( 4 ). Decades later, with the help of his student R.K. Watkins, he published a refined version of the equation which became known as the modified Iowa formula ( 5 ).
Although culverts have been constructed using a variety of cross-sectional shapes, one of the simplest and most common shapes is the round (i.e., circular) pipe. In this case, the culvert is constructed by first placing the round pipe on a layer of prepared bedding. Next, the pipe is enveloped by an engineered backfill soil, which is placed and compacted in successive layers (typically 150–300 mm thick) up to some height above the crown (top) of the pipe. A major part of the design process for culvert structures is the selection of the pipe material. Corrugated steel pipes (CSP) were developed at the end of the 19th century and were used as culverts as early as 1896 ( 6 ). The corrugated geometry provided the pipe with additional stiffness and strength without increasing the thickness of the pipe wall, as would be necessary if using a plain pipe of the same diameter. Because of its lower initial cost and relative ease of installation, corrugated metal soon surpassed concrete as the preferred material for culvert construction. However, the design implications of using this new, relatively flexible pipe remained poorly understood. In 1941, Merlin Spangler developed the famous Iowa formula, which provided a theoretical basis for the design of buried flexible conduits ( 4 ). Spangler’s work, in combination with the post-World War II infrastructure boom of the 1950s and 1960s, led to the proliferation of corrugated metal culverts around the world.
The overall mechanical behaviour of a buried flexible pipe is dependent on a complex interaction between the structure (pipe) and the surrounding soil, as mentioned above, making it difficult to predict using analytical methods. However, numerical techniques, such as the finite element (FE) method in which a large system is analyzed by discretizing the overall geometry into a (finite) number of smaller, simpler components (elements), has proved very useful in this regard. Two-dimensional (2D), elastic FE analyses have recently been performed to evaluate the stability of corrugated metal culverts (7, 8). 2D models, however, rely on simplifying assumptions to approximate certain three-dimensional (3D) aspects of the real problem, such as live load spreading through the cover soil. Moreover, the use of linear elastic constitutive soil models may be insufficient for modeling the observed non-linear force-displacement response of real flexible culverts subjected to incremental earth and live loading ( 9 ). Linear elastic soil models neglect the shear strength and stress-dependent stiffness of real soils.
This paper develops a 3D FE model capable of predicting the structural forces that develop in intact, round CMP culverts during backfilling and live loading. The 3D FE model should account for the construction sequencing, compaction effects, behaviour of the soil-pipe interface, and the non-linear behaviour of the surrounding soil ( 7 ). The results from the 3D FE model are performed using three different constitutive soil models, Linear Elastic (LE), Mohr-Coulomb (MC), and Hardening Soil (HS). Furthermore, the numerical results are then compared with published results from full-scale laboratory testing and previously published results from a 2D linear elastic model.
The 3D FE Model Development
Full-scale laboratory experiments carried out by Mai et al. at Queen’s University are considered here for validation of the new 3D model ( 10 ). Specifically, the intact culvert from the experiment is modeled during construction (dead loading) and under live loading conditions. This experiment was selected for calibration purposes because of the availability of well-documented details (e.g., geometry, material properties, test methodology), in addition to the comparatively high degree of accuracy that might be expected for measurements made in a controlled laboratory environment versus those made in the field.
The geotechnical engineering FE software package Plaxis 3D AE.01 was used to develop the model described here ( 11 ). The use of the 3D modeling is more accurate and maybe even mandatory when simulating live loading, which is 3D in nature, or deterioration in the culvert body which requires the 3D effect to be included in the simulation process. Numerical methods such as the FE method are well suited to deal with complex boundary value problems such as those involving soil-structure interaction ( 12 ). The first step in the FE method is to discretize the entire problem domain into a finite number of geometric entities (volumes, areas, and/or lines), which are referred to as “elements.” Adjacent elements are connected to one another by shared points, or “nodes,” which, at a minimum, are located at the corners of the elements (for line elements, nodes are located at each end).
The total dimensions of the 3D model measured 8.0 m long, 6.0 m wide, and 3.4 m high. The extents of the side and bottom boundaries of the model correspond to those of the walls and floor of the concrete test pit that was used in the experiment, respectively. Therefore, any end effects that may influence the results of the 3D model should have also been present in the experiment. Default boundary conditions were maintained at all stages of the analyses (i.e., top = free, sides = normally fixed, and bottom = fully fixed). The soil continuum in Plaxis 3D is discretized into ten-noded tetrahedral (3D) soil elements. The CMP was modeled using plates, which are discretized into six-noded, triangular (2D) plate elements. The interface between the soil and the CMP was modeled using interface elements, which consist of pairs of nodes that are compatible with the six-noded triangular side of a soil or plate element. The mesh was automatically generated by specifying a global coarseness value of “fine” (which corresponds to a relative element size factor, re, equal to 0.7) at the outer regions of the model, with local refinement (re = 0.5) near the CMP. The resulting mesh consisted of 179,069 soil elements and 258,844 nodes.
Ideally, the geometry of the CMP would be explicitly modeled in 3D using volume (or “soil”) elements ( 13 ). However, since the corrugation profile of the pipe plate (67.7 mm pitch x 12.7 mm depth x 4.5 mm thick) in this case is very fine relative to the total dimensions of the model, this approach would require an extremely large number of very small elements. The common approach of modeling the corrugated plate of the pipe as an “equivalent” plain plate with orthotropic material properties was adopted. Actual (isotropic) properties of the intact CMP plate are given by Mai et al. in Table 1 ( 10 ). The properties of the equivalent orthotropic plate were computed using the method developed by Aagah and Aryannejad ( 14 ). These equivalent (orthotropic) plate properties are given in Table 2. The actual behaviour of soil can be simulated to various degrees of accuracy depending on the constitutive model used. Simple soil models are advantageous in the sense that they require fewer input parameters and result in relatively quick calculation times. More advanced soil models generally have more inputs (some of which may be difficult to estimate or measure) and are computationally expensive, but often produce more realistic results. Three different constitutive soil models from the Plaxis 3D library were evaluated in developing the model: Linear Elastic (LE), Mohr-Coulomb (MC), and Hardening Soil (HS). Table 3 presents the soil properties used for the three material models including the elastic modulus, the dry unit weight, and the Poisson’s ratio. These parameters were obtained experimentally by Mai and Mai et al. (10, 15). The other parameters were estimated based on the measured soil data and the proposed utilized material model.
The Actual (Isotopic) Material Properties of the Intact Corrugated Metal Pipe (CMP) by Mai ( 15 )
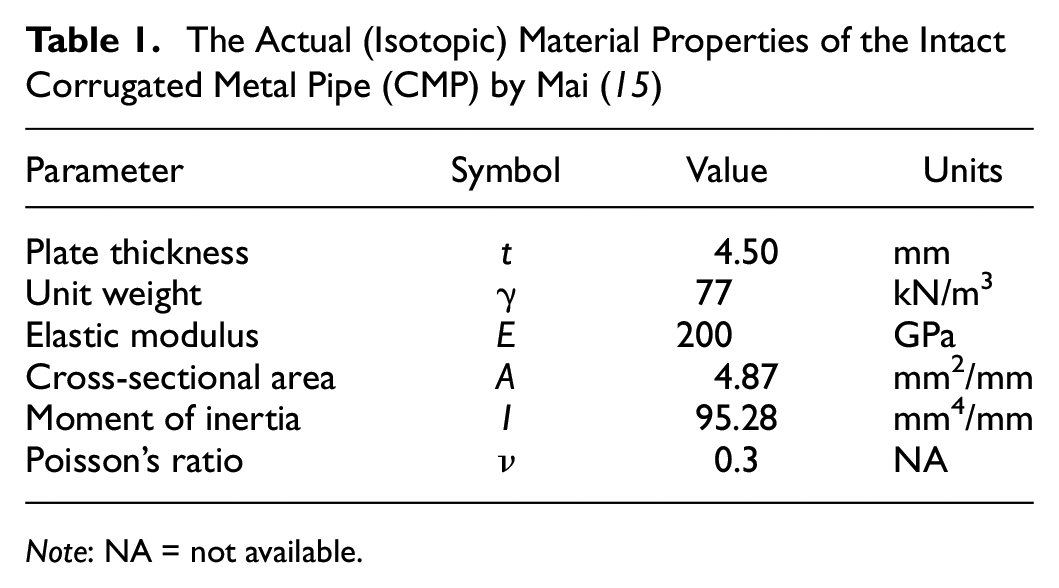
Note: NA = not available.
Equivalent (Orthotropic) Material Properties of the Intact Corrugated Metal Pipe (CMP)
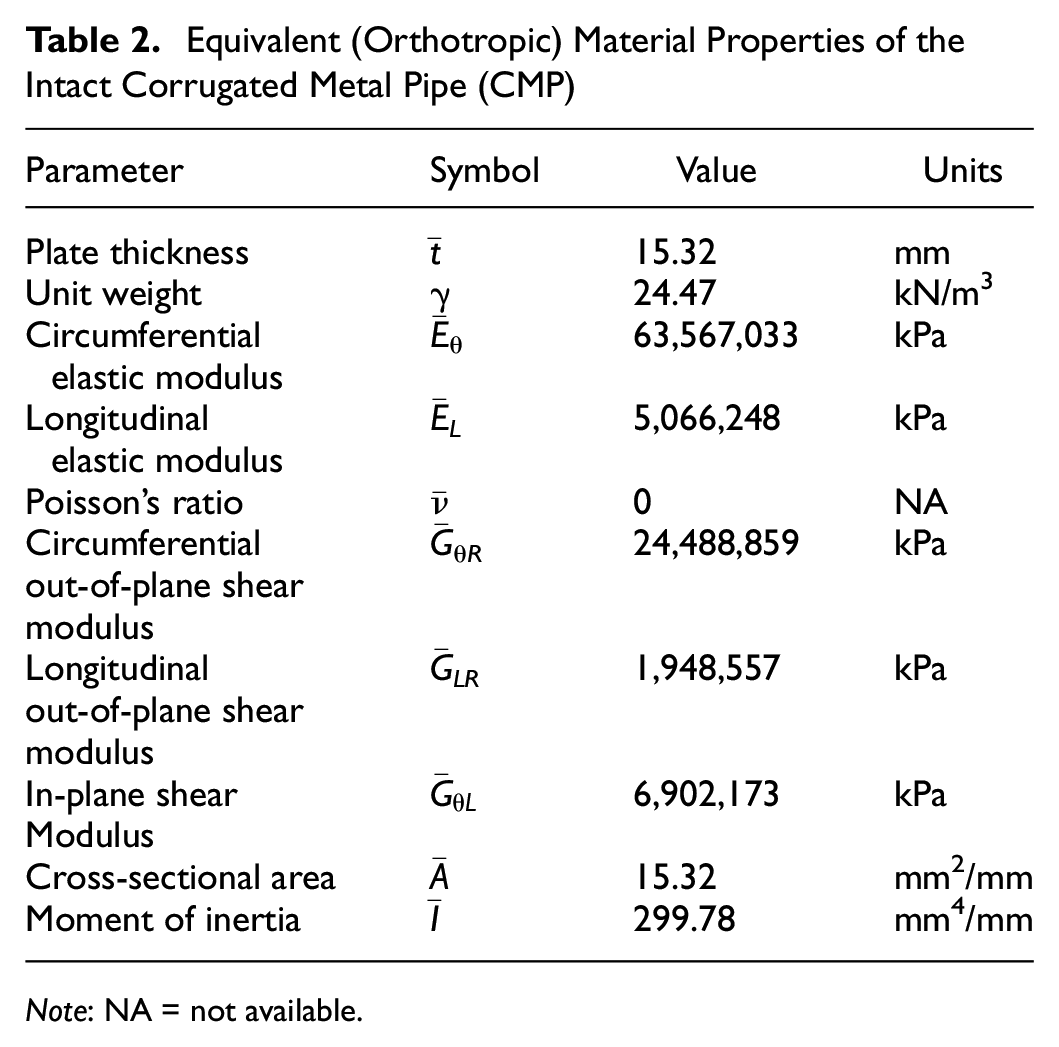
Note: NA = not available.
Soil Properties used for Linear Elastic (LE), Mohr-Coulomb (MC), and Hardening Soil (HS) Material Models
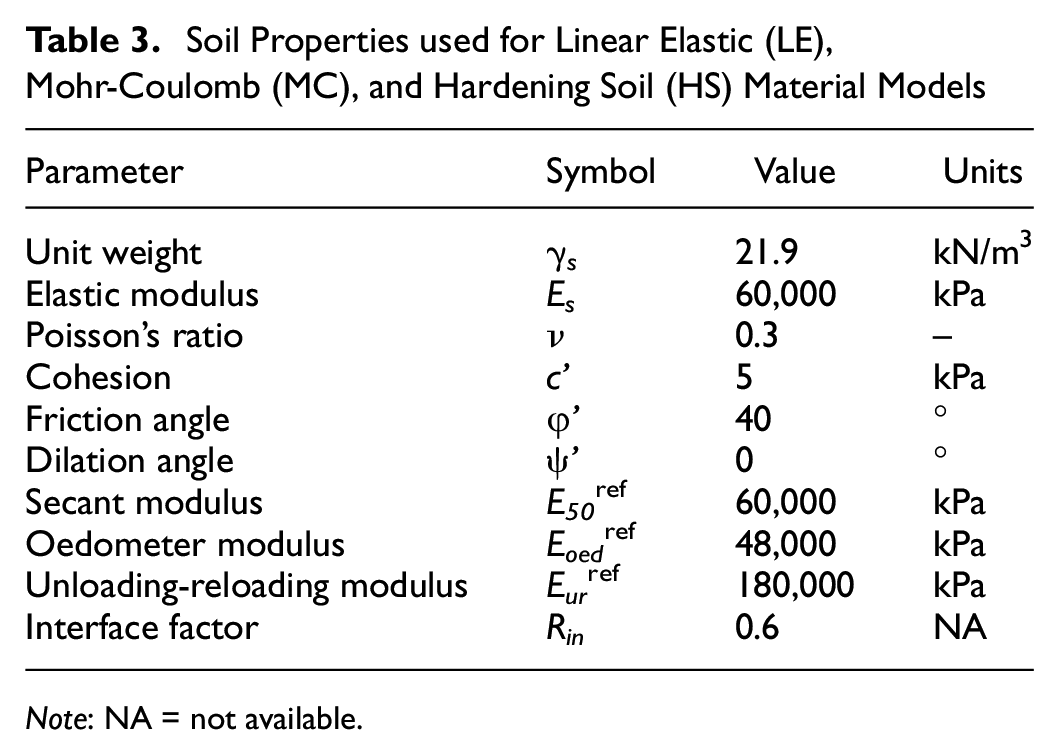
Note: NA = not available.
The modeling sequence for the construction (i.e., dead loading) of the culvert is illustrated in Figure 1. Here, a simplified case is presented, in which compaction effects are ignored. Incorporating the effects of compaction, as will be discussed later, requires an additional phase for each layer that is compacted. In the first phase, the bottom layer (0.6 m thick) was activated. In phase 2, the 100 mm thick bedding, the CMP, and the soil-CMP interface were activated. The side fill was activated in six layers (approximately 0.3 m thick each) in phases 3 to 8. In phases 9 to 11, 0.3 m of cover soil is progressively activated, up to a total cover depth of 0.9 m.
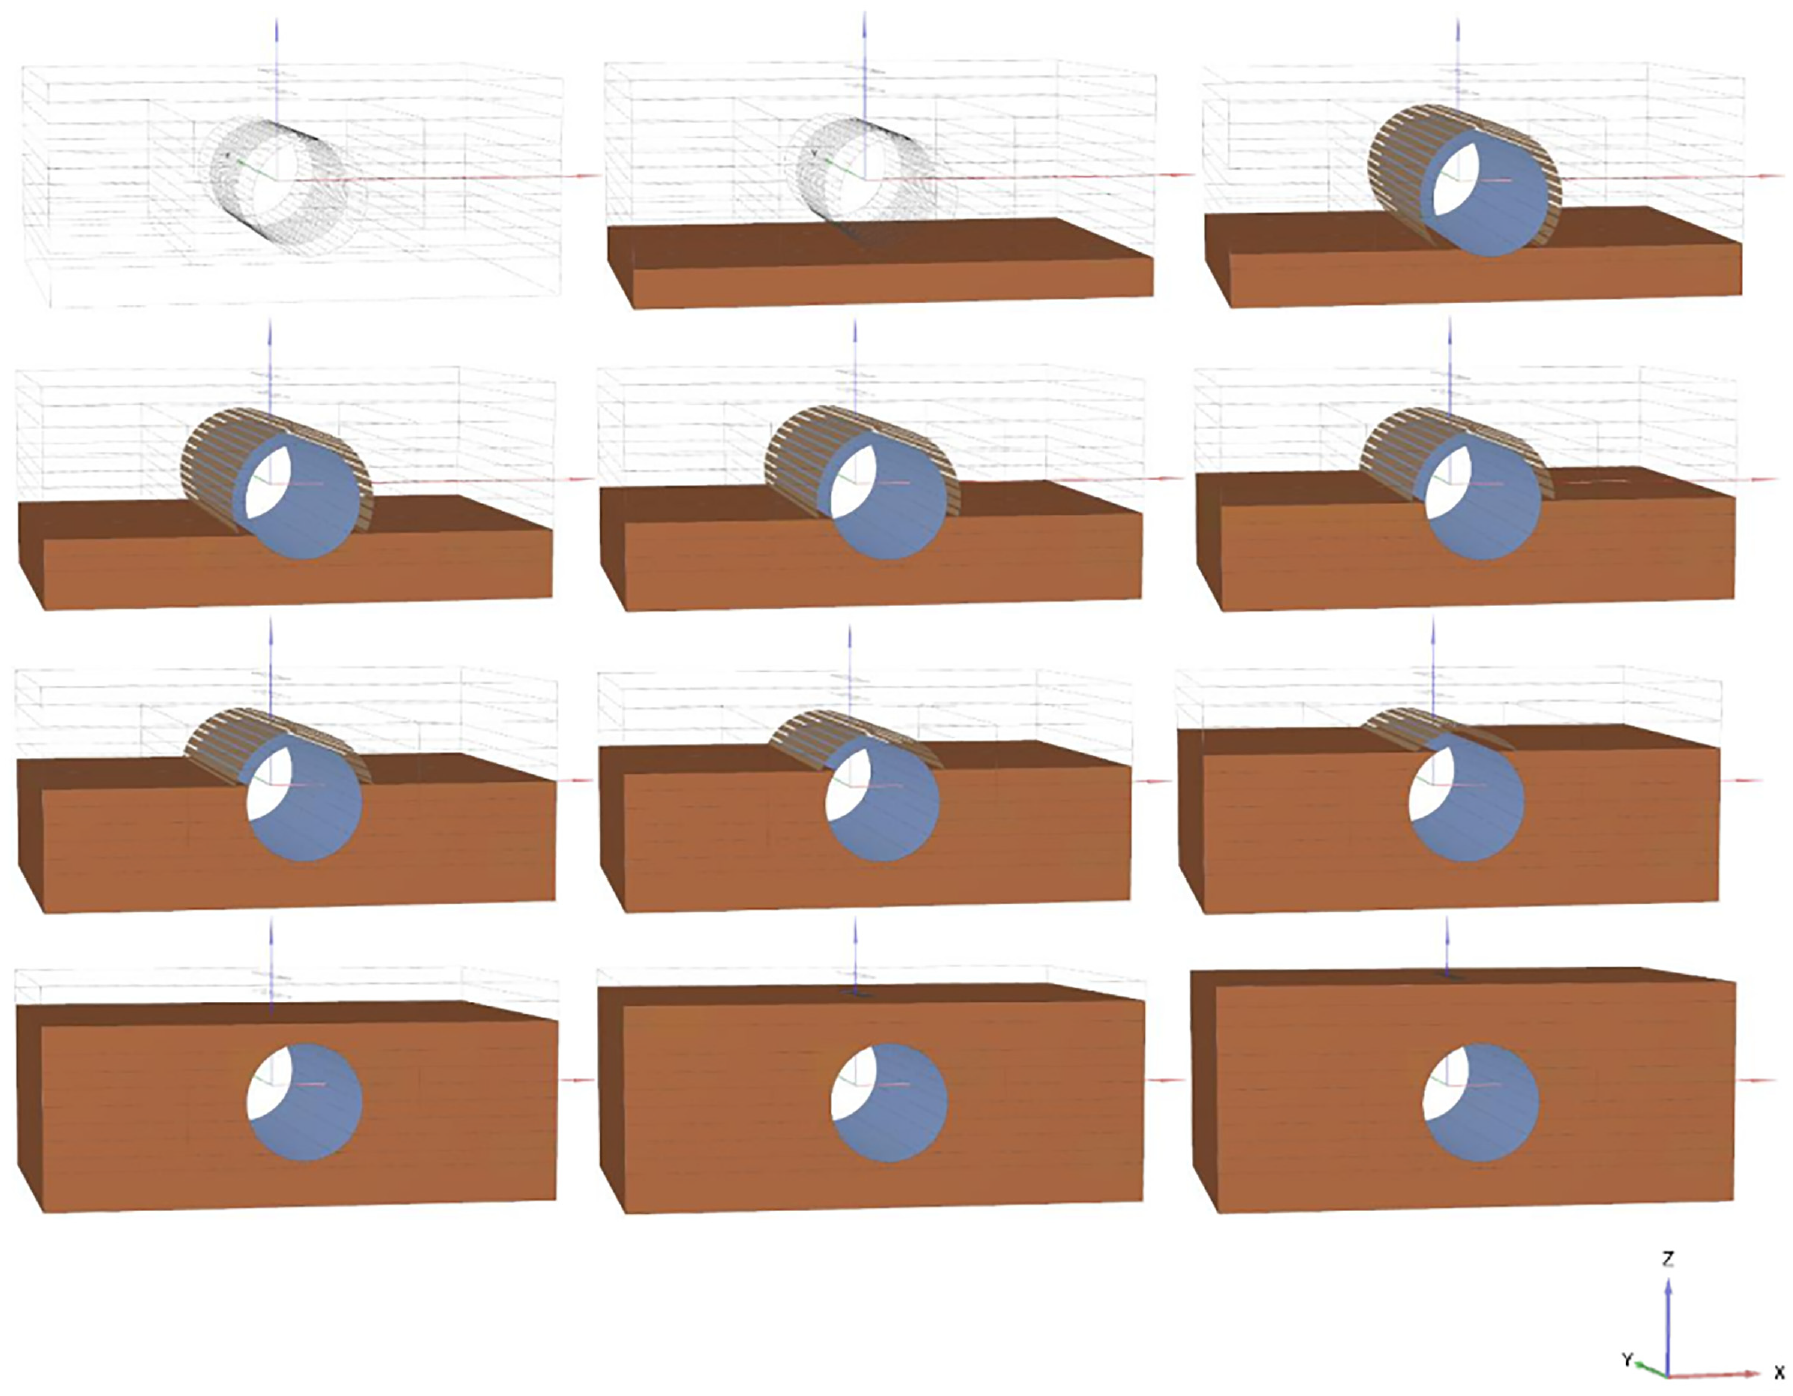
Modeling sequence for culvert construction without compaction effects.
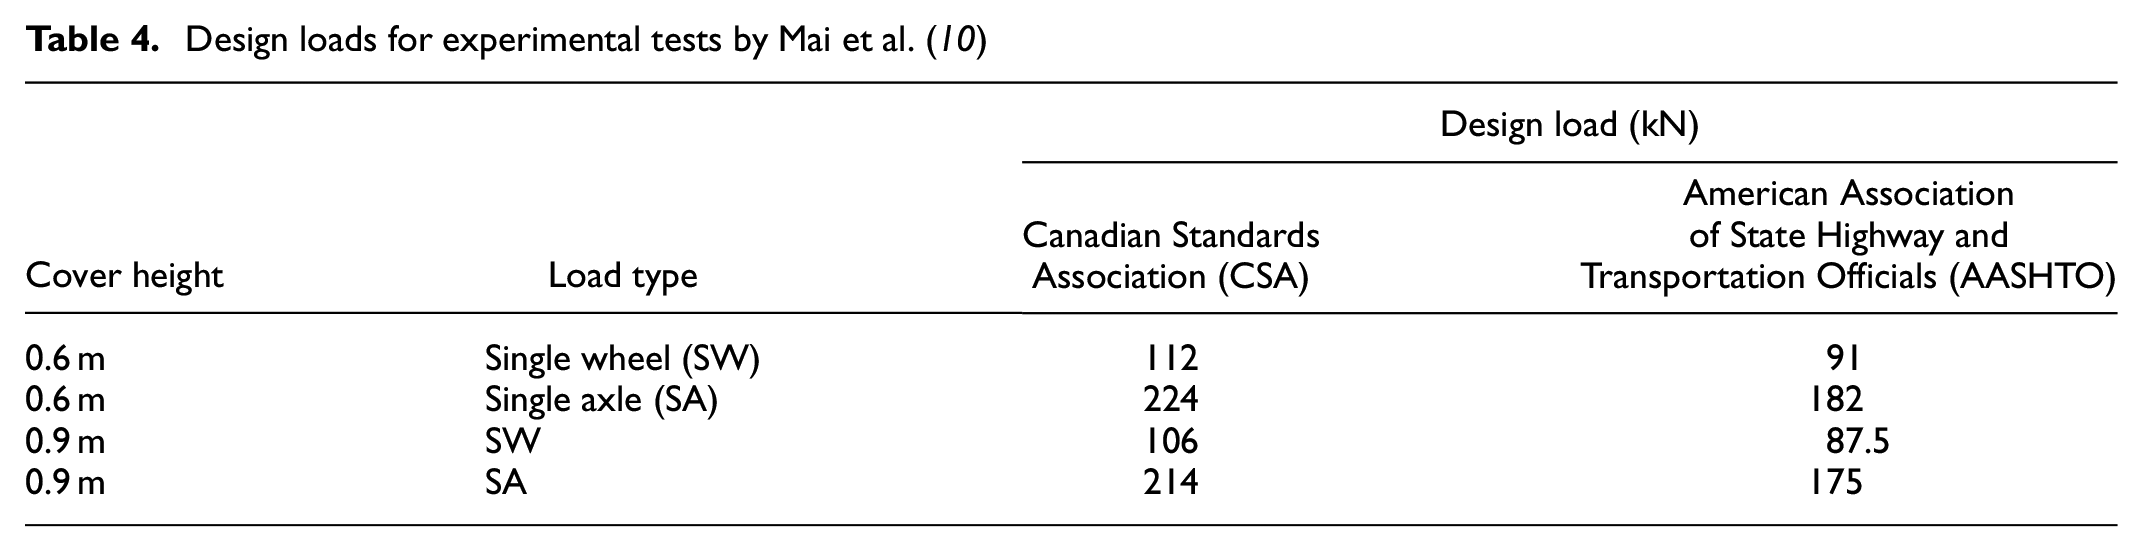
Live loading of the intact pipe was modeled for the four load cases shown in Table 4 according to the Canadian Standards Association (CSA) and the American Association of State Highway and Transportation Officials (ASSHTO) ( 15 ). The total applied force was converted to a uniformly distributed surface load and applied to a rectangular loading plate at the ground surface. The loading plate was 0.6 m long x 0.25 m wide (area = 0.15 m2) and positioned at the centerline of the culvert (both longitudinally and transversely). The total live load was applied in incremental phases such that the load-deflection response of the model culvert could be analyzed and compared with the experimental measurements.
Design loads for experimental tests by Mai et al. ( 10 )
Compaction Effects
During construction, the soil is placed on either side of the pipe (and therefore referred to as “side fill”) and compacted in successive layers, which are typically 150 mm to 300 mm thick. The compaction process can result in high residual lateral soil pressures. These pressures effectively squeeze the pipe and can cause the crown to “peak” (i.e., deflect upwards). It is not entirely clear whether this peaking response during side filling has an influence on the resulting stress regime in the pipe. Therefore, one of the objectives of this model is to explore this question. If there is an influence, it would be desirable to account for it in the model. Explicit modeling of the compaction process including densification of the soil would add enormous complexity to the model and is not essential to the problem considered in this study. Therefore, the objective here is simply to account for the effects of side fill compaction in relation to the structural response of the CMP. Recent efforts to incorporate compaction effects in culvert models consisted of specifying a large value for the coefficient of lateral earth pressure, K, which was then used by the software to generate the post-compaction stresses in each layer (8, 16, 17). In Plaxis 3D, however, horizontal stresses are not computed using K, except during the initial calculation phase (for LE and MC soil models, the horizontal stresses generated from gravity loading are a function of Poisson’s ratio). Therefore, the same approach could not be used here.
An alternative procedure for incorporating the effects of compaction in the 3D model using the HS soil model is illustrated in Figure 2. Each compacted layer is applied in two phases. The first phase consists of activating the new layer and applying an effective uniform vertical compaction load to the surface (the magnitude of which must be empirically determined). In the second phase, the compaction load is removed. As a result of hardening of the soil, residual lateral stresses should be developed, as in reality. It is anticipated that this technique would not produce the desired results when either the LE or MC soil models are used, since their material behaviour is largely (or entirely) elastic, and removing the compaction load would simply cause all incremental stresses and strains to be completely reversed. Figure 3 shows the horizontal stress distributions produced from a simple numerical experiment employing the technique described above for three 0.3 m thick layers of laterally confined soil and a vertical compaction load of 30 kPa. Separate tests were performed using the LE, MC, and HS soil models. Using the LE and MC models, the resulting horizontal stress distribution remains unchanged compared with before the compaction load was applied. Using the HS model, the resulting horizontal stress distribution is close to that expected ( 18 ).
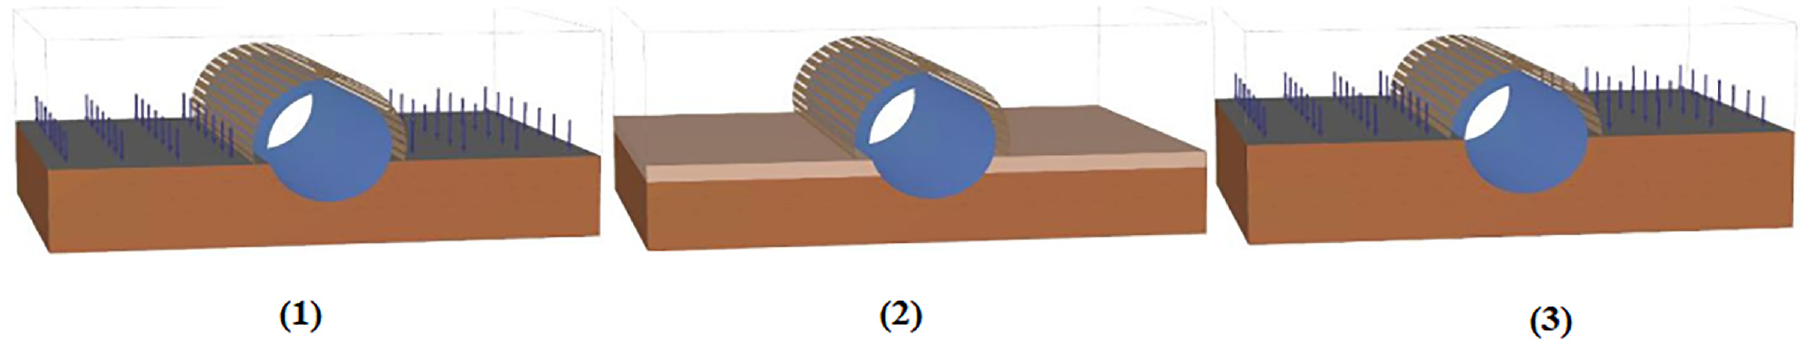
The procedure for simulating the effects of compaction next to a culvert pipe: (a) activate layer and apply load, (b) remove load, and (c) repeat for next layer.
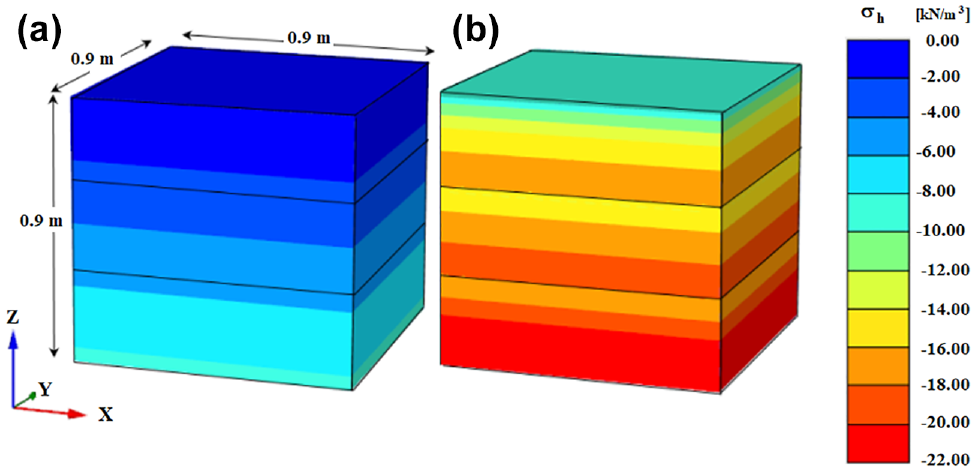
Horizontal stress distributions resulting from a simple numerical experiment to assess compaction effects: (a) Linear Elastic (LE) and Mohr-Coulomb (MC) models, and (b) Hardening Soil (HS) model.
Results for Dead and Live Loading
During backfilling, the incremental changes in vertical and horizontal diameters are plotted in Figure 4. As expected, both the LE and MC soil models were unable to accurately capture the peaking response of the pipe that was measured in the experiment. The LE model produced less than 1 mm of deflection in both vertically and horizontally. This is not surprising since any lateral strains that result from the application of the compaction load are completely recovered on its removal. The MC model produced some noticeable peaking response, yet to a much smaller degree than was measured experimentally; a vertical expansion of 1.8 mm and horizontal contraction of 0.5 mm were computed on completion of backfilling up to 0.9 m cover, versus experimental values of 4.2 mm and 6.1 mm, respectively. This can be attributed because some portion of the compaction-induced lateral strains are not recovered because of local yielding of the soil on removal of the compaction load. The HS model captured the peaking response quite well. Vertical and horizontal deflections (5.0 mm and 4.3 mm, respectively) were within 19% and 30% of experimental values (4.2 mm and 6.1 mm). These results indicate that the strain hardening behaviour of the HS soil model was effective at transferring the compaction-induced lateral loads to the pipe.
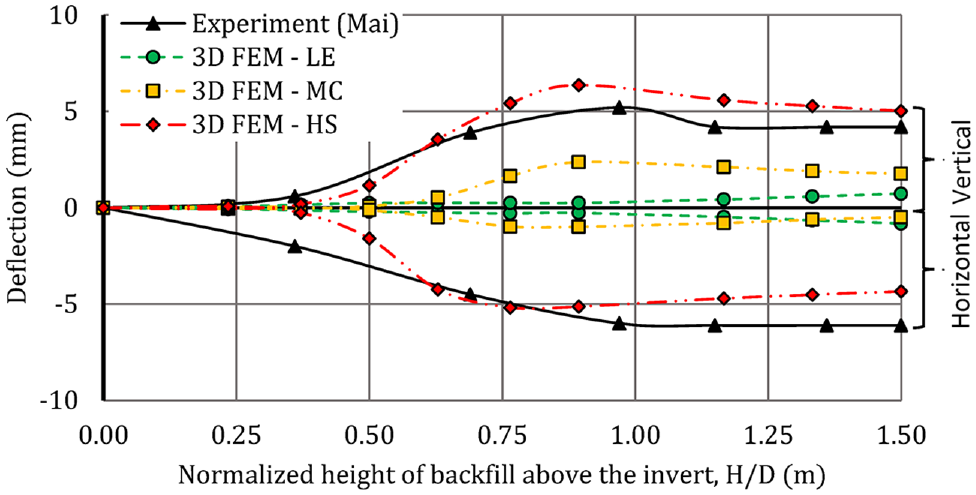
Vertical and horizontal deflections during backfilling of the corrugated metal pipe (CMP) up to 0.9 m cover.
For thrust (normal force), Figure 5 shows the total circumferential thrust distribution around the CMP predicted by the model on completion of backfilling up to 0.9 m cover. Experimental results are shown only near the crown (from shoulder to shoulder) because, as noted by Mai, there was unexpected tension measured in the bottom half of the pipe, which was likely erroneous ( 15 ). Results from the 3D FEM match relatively well with experimental results across the top half of the pipe for all soil models. However, the thrust at the crown is slightly underestimated using the LE model. This seems reasonable, given that no yielding occurs in the LE soil, and thus the arching effect would be greater (and resulting thrust in the pipe smaller) compared with the MC and HS models. The dead load thrust distribution around the pipe is relatively uniform for the MC and HS models. Maximum values are observed at the springlines (about 23 kN versus 19 kN at the crown for the HS model) for both the MC and HS models. In contrast, the location of maximum dead load thrust for the LE model was at the haunches (32 kN, compared with 12 kN at the crown and 24 kPa at the invert).
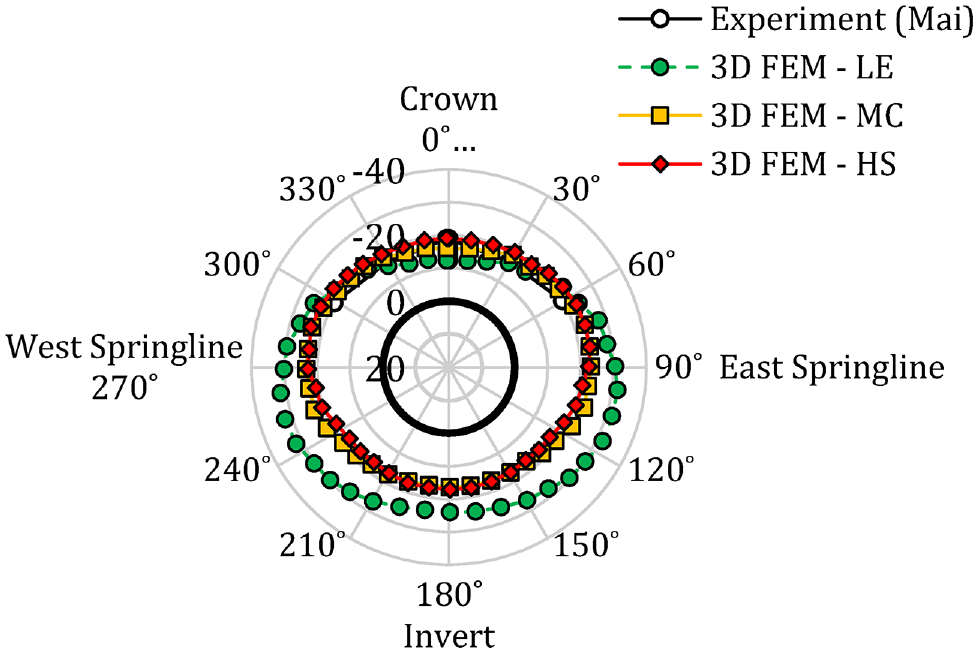
Circumferential thrust distributions around the corrugated metal pipe (CMP) on completion of backfilling with 0.9 m cover.
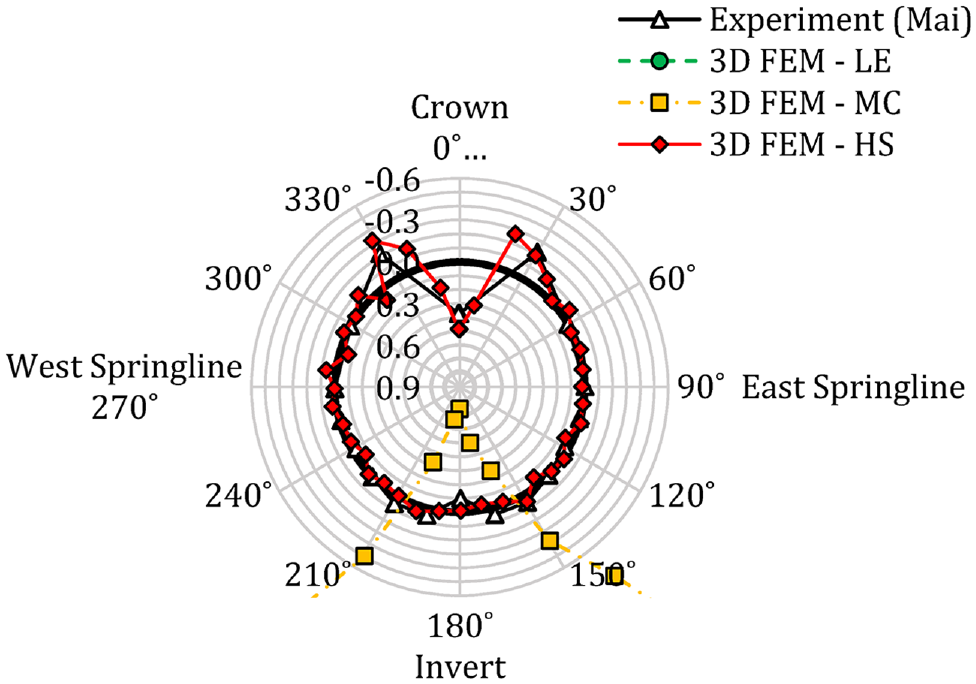
For service live loading, Figure 6 shows the model results for vertical and horizontal deflections during live loading with the SA load and 0.6 m cover. It is evident that the non-linear relationship between deflection and applied load was not captured by the 3D FE models using linear elastic soils. The 2D FE model by Mai and Mai et al., which also utilized a linear elastic soil model, was similarly unsuccessful in capturing this trend (10, 15). However, the trend was captured reasonably well by the 3D FE model using either the MC or HS soil models. The incremental circumferential thrust distribution around the pipe resulting from a single axle (SA) load of 87.5 kN with 0.9 m cover is shown in Figure 7. The magnitude of thrust at the crown for the LE model was only about 36% of the experimental value. Live load thrust distributions from the MC and HS models were very similar (i.e., within 1% of each other), both of which matched the measured values very closely except at the crown. The experimental thrust distribution indicates a reduction of approximately 13 kN from the shoulder to the crown, while the 3D FE results remain relatively constant between the shoulders, with maximum values occurring at or near the crown. Notably, only one experimental data point exists between the shoulders. Therefore, any error potentially associated with that data point would have a significant influence on the interpreted thrust distribution across the top of the pipe. Further supporting this possibility is the fact that a similar reduction of thrust at the crown was not observed in any of the other experimental load cases.
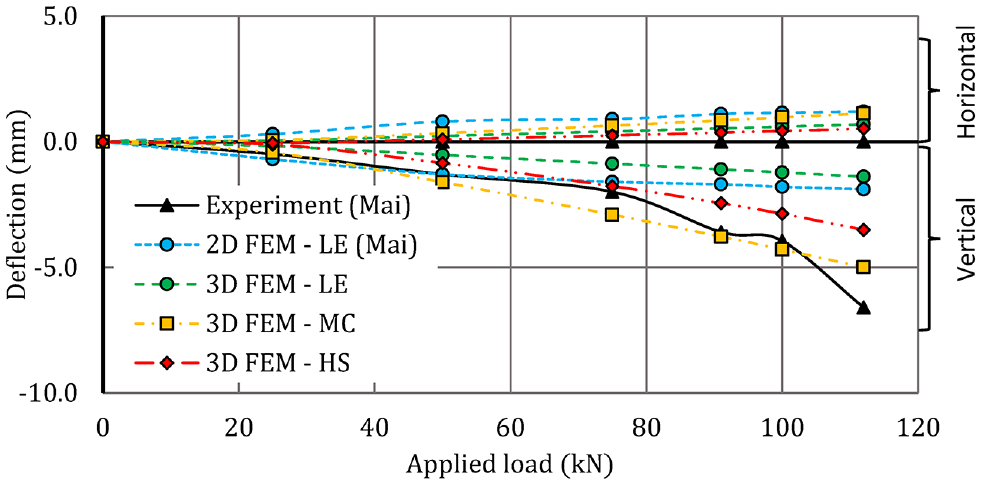
Vertical and horizontal deflections in the corrugated metal pipe (CMP) during single axle (SA) loading with 0.6 m cover.
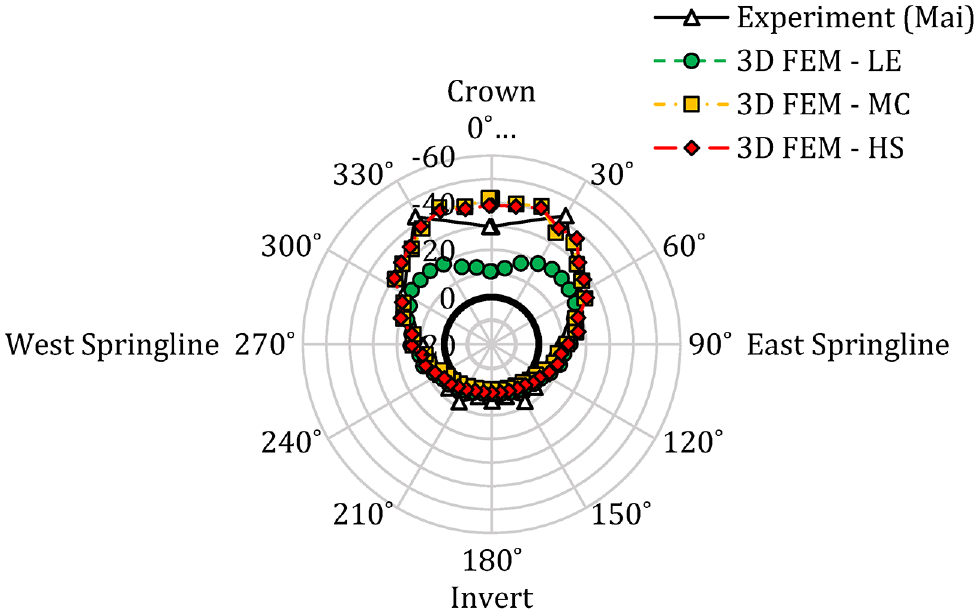
Incremental thrust distribution around the corrugated metal pipe (CMP) resulting from 87.5 kN single axle (SA) load with 0.9 m cover.
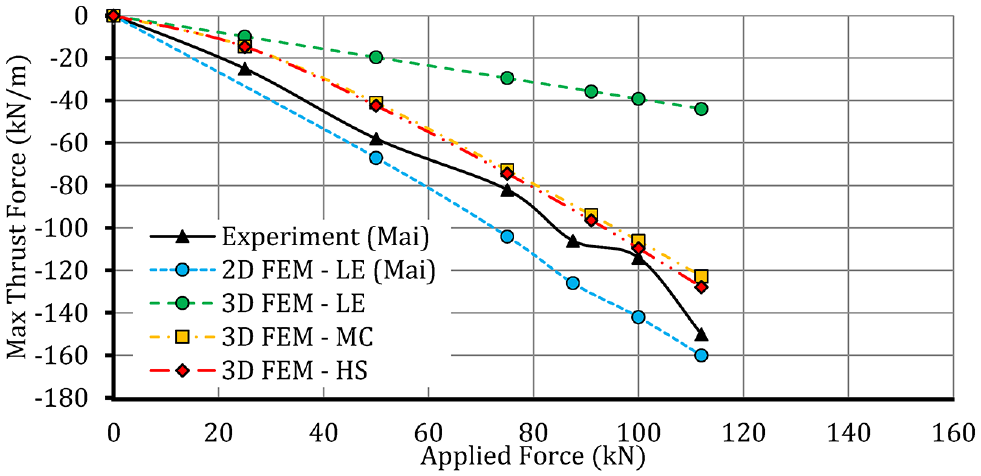
The maximum thrust force in the CMP during SA loading with 0.9 m and 0.6 m cover is plotted in Figures 8 and 9, respectively. Both cover depths show similar trends; only the magnitudes of thrust are higher for the case with 0.6 m cover. The thrust forces predicted by the 3D FE model with the LE soil were significantly less than measured values (39 kN versus 114 kN at an applied load of 100 kN).
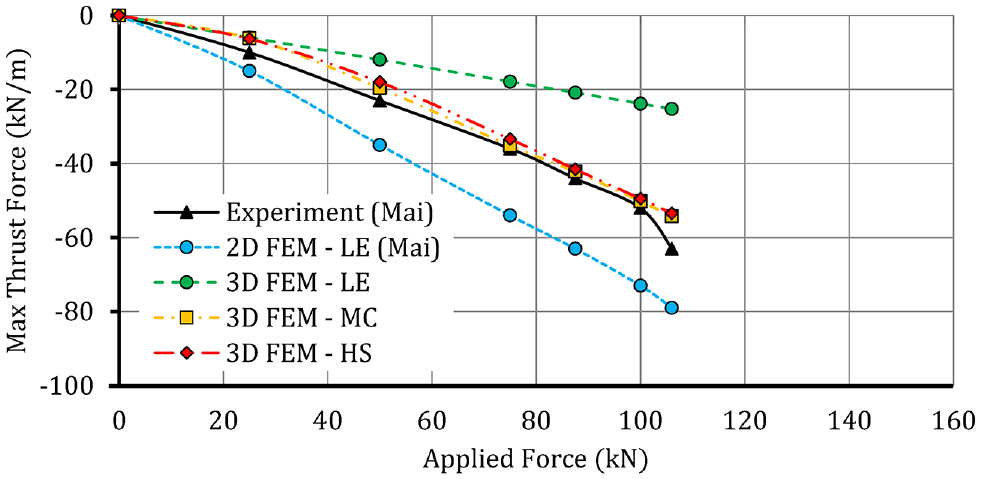
Maximum incremental thrust in the corrugated metal pipe (CMP) during single axle (SA) loading with 0.9 m cover.
Maximum incremental thrust in the corrugated metal pipe (CMP) during single axle (SA) loading with 0.6 m cover.
Furthermore, the LE model produced a linear load-thrust trend, in contrast to the non-linear response measured experimentally. Although the 2D model by Mai also failed to capture the non-linear behaviour of the culvert, it did provide a much more accurate prediction of live load thrust than the 3D model (15). The most likely explanation for this is that the 2D model relied on the use of a load-spreading factor for determining an “equivalent” line load to apply at the ground surface. This factor was developed to produce (generally) conservative values of thrust for typical loading conditions. Conversely, load spreading in the 3D model is accounted for explicitly. Since the LE soil model has infinite strength, the load spreading is maximized, and a smaller portion of the applied load is transferred to the pipe. Live load thrusts from the 3D FEM using the MC and HS models are nearly identical (106 kN and 110 kN, respectively, for an applied force of 100 kN). Both models agree closely with the experimental results in relation to both magnitude and the non-linear trend. However, the experimental curve diverges from the 3D FEM results at the very end of the curve. This could be as a result of the small amount of cohesion (5 kPa) that was necessarily assigned to the MC and HS models to provide numerical stability. This amount of cohesion may be sufficient to prevent some of the local yielding within the soil, thereby reducing the portion of the applied load that is transferred to the pipe.
For bending moments, the incremental circumferential bending moment distribution resulting from an SA load of 87.5 kN is shown in Figure 10. The magnitudes of the bending moments are small (i.e., < ±0.5 kN.m/m), owing to the relative flexibility of the pipe considered. Regardless, the distribution of live load bending moments around the CMP was well captured using the HS model, and, to a lesser degree, using the MC model. The live load bending moments were underestimated when the LE model was used. The maximum live load bending moment in the pipe during SA loading with 0.6 m cover is shown in Figure 11. The general trend (i.e., non-linear) observed in the experiment was clearly captured by the MC and HS models, while the results produced by the LE model were linear and less accurate. Overall, the model predicted the structural response of the culvert observed in the experimental tests with reasonable accuracy, especially using the HS soil model.
Maximum incremental bending moment distribution around the corrugated metal pipe (CMP) resulting from 87.5 kN single axle (SA) load with 0.9 m cover.
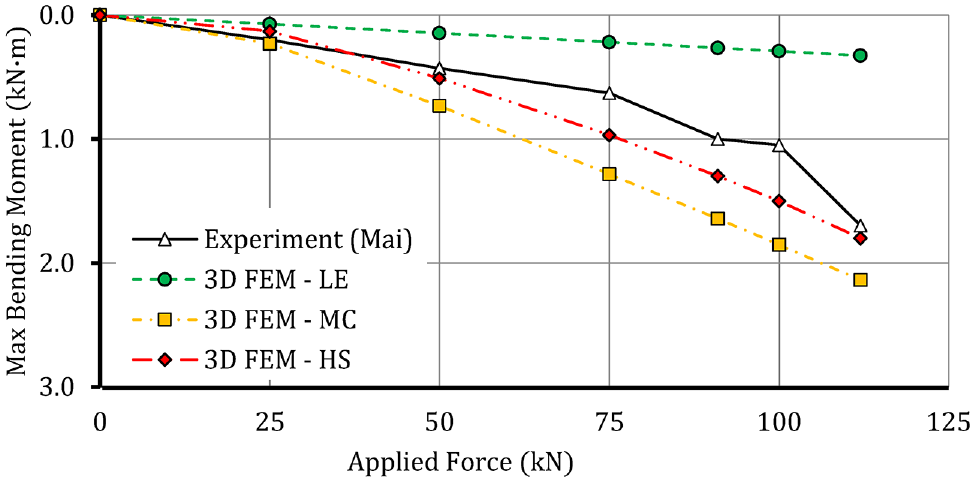
Maximum incremental bending moment in the corrugated metal pipe (CMP) during single axle (SA) loading with 0.6 m cover.
Conclusions
Based on the previous analysis from the numerical modeling, the following conclusions are made:
The HS soil model accurately captured the experimental peaking response of the culvert during backfilling. The MC model was less accurate, and the LE model was inaccurate. The HS model was therefore effective at transferring the simulated compaction-induced loads from the soil to the pipe.
The LE soil model did not predict the dead load thrusts as well as the MC and HS models.
Live load thrust distributions from the MC and HS models were within 1% of each other, and both matched the experimental data closely everywhere except at the crown.
The non-linear load-bending moment curve observed in the experiment was well captured by the MC and HS models; the results produced by the LE model were linear and inaccurate.
Footnotes
Acknowledgements
The authors wish to express their gratitude to the Natural Sciences and Engineering Research Council of Canada (NSERC) for supporting this research.
Author Contributions
The authors confirm contribution to the paper as follows: study conception and design: H. El Naggar; data collection: A. Campbell; analysis and interpretation of results: A. Campbell, H. El Naggar; draft manuscript preparation: A. Campbell, H. El Naggar, I. Ezzeldin. All authors reviewed the results and approved the final version of the manuscript.
Declaration of Conflicting Interests
The author(s) declared no potential conflicts of interest with respect to the research, authorship, and/or publication of this article.
Funding
The author(s) disclosed receipt of the following financial support for the research, authorship, and/or publication of this article: Natural Sciences and Engineering Research Council of Canada (NSERC) RGPIN-2016-05428.
Data Availability
All data, models, and code generated or used during the study appear in the submitted article.