
Abstract
Goals for public transit agencies and new public transport infrastructure projects include attracting new riders and retaining existing system users. An understanding of the public transport market and its preferences, habits, and attitudes can help public transit agencies reach these goals by shedding light on how to increase customer satisfaction. To understand potential users of one of Montreal’s most recent major transport projects, the Réseau express métropolitain (REM), we conducted a survey in Fall 2019 while the light-rail system was under construction. Drawing on vetted transport market-segmentation frameworks, this study employs an exploratory factor analysis to reveal factors that affect respondents’ propensity to use the REM. A k-means cluster test is applied to the factors to articulate market segments. The analysis returned four clusters that form a clear spectrum of least likely to most likely REM users: car-friendly non-users, urban core potential users, transit-friendly users, and leisure and airport users. Positive opinion, proximity, and desire to use the REM for leisure or non-work trips are three key characteristics of likely users. There is a visible relationship between clusters who are likely to use the REM and clusters who agree that the REM will benefit their neighborhood. Improving people’s perception of the potential benefit of the REM to their neighborhood, better accommodating leisure use, emphasizing and communicating appealing destinations, and highlighting transit connections are four core ways that planners could work to potentially increase the number of people who are likely to use the REM.
In 2018, the infrastructure branch of the Caisse de dépôt et placement du Québec (CDPQ-Infra) broke ground on the $6.3 billion Réseau express métropolitain (REM). The state-of-the art, fully automated 67-km light-rail project is expected to become operational in stages between 2021 and 2023, knitting together Montreal’s downtown, its international airport, and far-flung West Island suburban destinations with high-frequency service. Figure 1 shows the new light-rail system in green alongside the existing public transport system. With a predicted initial ridership of more than 161,000 passengers per day, the REM has the potential to radically alter land-use and transport patterns across the Island of Montreal and well beyond, as projects at this scale have done elsewhere ( 1 ). Indeed, the REM’s promoters aim to greatly enhance transit service frequency for current commuter train users, bolster transit reliability through grade/street separation, improve environmental performance through full electrification, and offer an enticing rail connection to the Montreal international airport, which most users currently access by private auto or taxi ( 1 ).
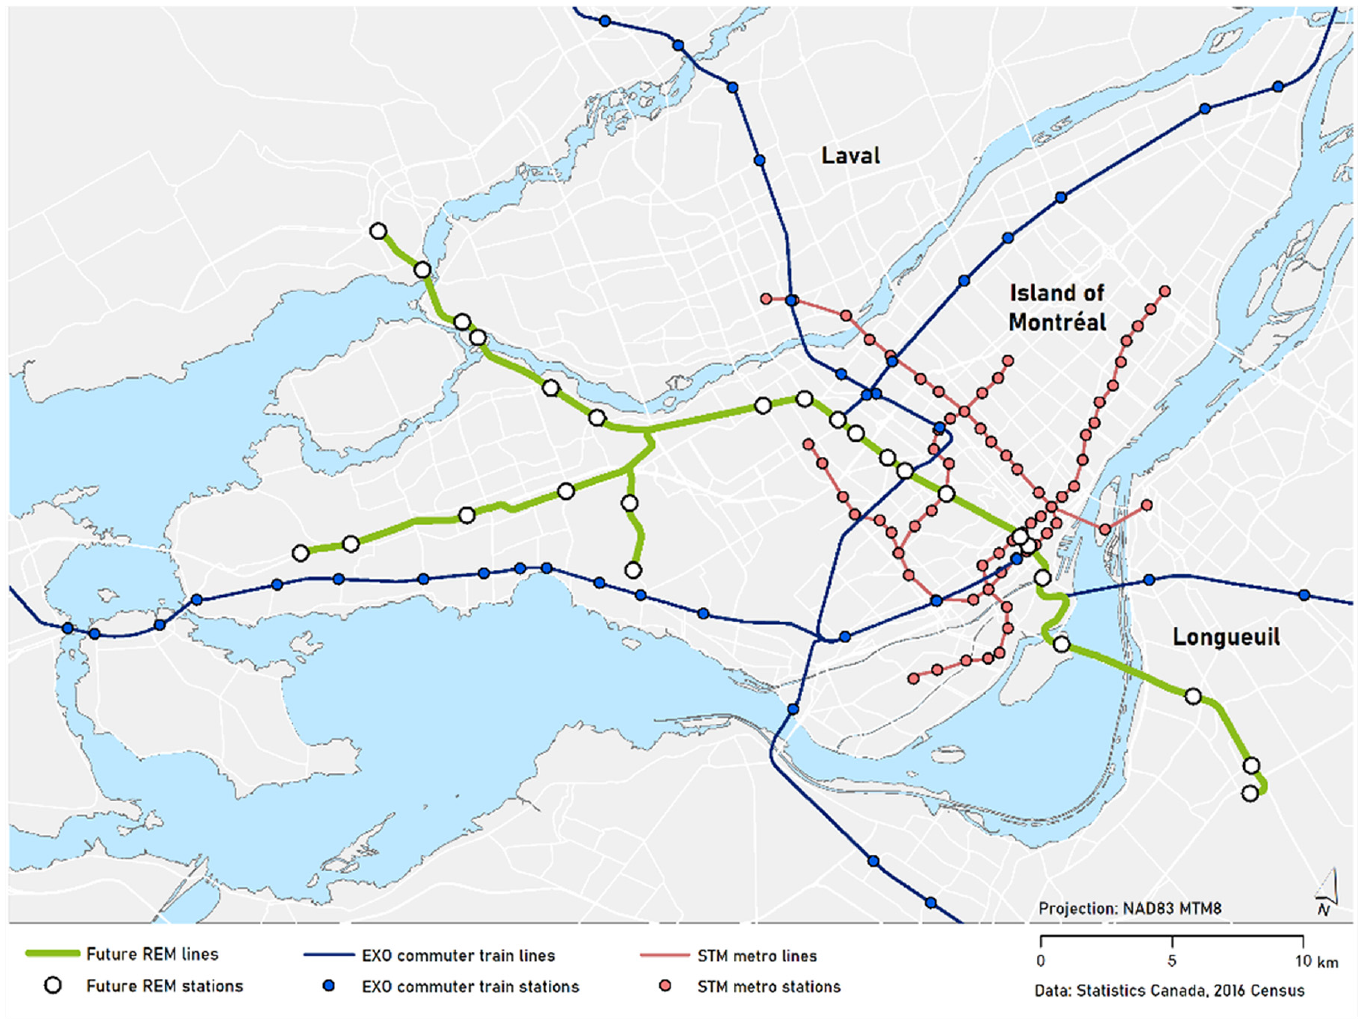
Montreal public transport system, including the Réseau express métropolitain (REM) line.
For the REM to be a success, it must attract new riders to the system and maintain existing public transport users ( 1 ). This aim cannot be accomplished without a clear understanding of the public transport market in Montreal. Preferences, habits, and opinions on public transport are important components that can shed light on what could transform potential and existing public transport users into actual and continuing public transport users. This is achieved by better understanding how to maximize customer satisfaction ( 2 ) and providing services that meet their needs and preferences. Factor-and-cluster analyses of survey responses have been leveraged to group respondents into transport market segments, which reveal trends in the needs and preferences of different groups ( 3 ). This paper applies a factor-and cluster approach to a survey of Montreal residents before the REM is operational to group the population into segments based on preferences, attitudes, behavior, and anticipated REM use. We conducted the market segmentation with the goal of revealing who will use the REM.
To achieve this, we conducted a large-scale survey in Fall 2019 (3,683 complete responses) to measure perceptions of the REM and its expected impacts while under construction and before it begins operating. This survey includes questions on travel time and behavior, health, satisfaction, and well-being. To avoid influencing participants’ responses, the survey was not advertised as focusing on the REM, but rather about seeking opinions about all major transport infrastructure projects in Montreal. Findings from this research can benefit not only professionals in Montreal but also those around the world who are working toward implementing new major public transport projects at this scale. This study provides insights into the public transport market and attitudes toward new public transport infrastructure in a region with a well-established existing public transport network.
Literature Review
Public Transit Ridership Market Segmentation
Part of transport research seeks to understand habits and preferences of groups of public transit riders with the goal of suggesting policies that public transit agencies can implement to increase ridership ( 2 , 3 ). Traditionally, public transit riders are grouped into captive riders and choice riders, which are defined by income and access to a car (2–4). Captive transit riders are historically defined as people who do not have access to a car and are low income ( 2 , 3 ), or only have one travel option ( 5 ). Choice transit riders are defined as people who have access to a car ( 2 , 3 ), or have multiple travel mode options and view transit as a superior mode ( 5 ). Factor-and-cluster analysis is often used to categorize responses to surveys about travel behavior and preferences, which, in turn, generate the market segments ( 2 , 3 , 5–8). Krizek and El-Geneidy, for example, shed light on the habits and preferences of captive and choice transit riders to better understand how specific aspects of transit service could influence demand for transit ( 3 ). Using one survey for public transit users and one survey for non-users, they found that the overall population could be grouped into eight different segments; overarching categories of those groups include: choice transit users, captive transit users, auto captive non-users, and potential transit rider non-users ( 3 ). They suggest that transit agencies should focus their improvements on increasing the satisfaction of transit riders who are choice riders and non-transit riders who are potential riders, which together make the population area to market transit population ( 3 ). Examples of overlapping preferences of the choice and potential riders include: reliability, travel time, type of service, and comfort ( 3 ). Abenoza et al. support this finding, and clarify that service attributes are similarly important across the range of public transit users and non-users, yet more frequent transit use is associated with higher service satisfaction ( 7 ). To complement efforts to increase transit ridership, Beirão and Cabral highlight that car use can similarly be targeted ( 8 ). They suggest focusing on market segments that are the most motivated to change their travel behavior ( 8 ).
van Lierop and El-Geneidy conducted an analysis of two customer-satisfaction surveys from public transport providers in Montreal (the Société de transport de Montréal) and Vancouver (TransLink) ( 2 ). Their analysis revealed a third group of public transport riders: captive-by-choice riders. Captive-by-choice riders do not have car access and are not considered low income, thus choosing to be captive riders. The literature suggests different market segmentation approaches ( 5 , 6 ). Beimborn et al. proposed including accessibility measures by mode and connectivity to transit into market segmentation and found that travel time differences between car and transit have less of an impact on mode choice, while walking access to transit has a larger impact on choice users than previously thought ( 5 ). Other research advocated for the incorporation of spatial and contextual factors in addition to riders’ preferences and satisfaction to generate market segments ( 6 ). This allows for more targeted service interventions that are geographically sensitive to different segments of users ( 6 ). Therefore, transit agencies can prioritize interventions in areas with high proportions of socially vulnerable people who depend on transit ( 6 ).
New Light-Rail Users
Although several studies use cross-sectional surveys to investigate the impacts and perceptions of light rail ( 9 , 10 ), limited research exists that includes a longitudinal survey approach to studying light rail. This is surprising given that cross-sectional surveys cannot fully control for self-selection based on travel preferences ( 11 – 13 ). We have identified three projects for which studies were conducted using a pre–post survey approach to examine light-rail impacts: Los Angeles, CA (Exposition Line) ( 11 , 14 ), Charlotte, NC (South Corridor Light Rail) ( 15 ), and Salt Lake City, UT (TRAX Light Rail) ( 16 ). The studies included surveys of participants before the implementation of new light-rail infrastructure, and then as many of those same participants as possible after the light-rail infrastructure was active ( 11 , 15 , 16 ). The surveys were conducted through a variety of methods including online, mail, and mobile tracking, which included GPS and activity monitoring ( 14 ) in addition to surveys conducted on the phone ( 15 ) and through in-person interviews ( 16 ).
Only one of the studies focused on segmenting riders and non-riders ( 16 ), yet the other two revealed interesting findings about the impacts of light rail more generally ( 11 , 15 ). The study in Los Angeles employed travel logs and odometers for cars, as well as an experiment-control group study design, and a variety of statistical tests and models (chi-square and t-tests, between-group differences, and difference-in-differences regressions) ( 11 ). It found that people living within 1 km of the new light-rail transit drove 10 mi less and used rail three times more than those not living near the Expo line once it opened ( 11 ). The investigation in Charlotte used a propensity score weighting approach to compare characteristics of people who reported using the light rail and those who did not to address impacts on body mass index, obesity, and physical activity ( 15 ). It found that race and planning to use the light rail in the future were main differences in those who used the light rail and those with similar characteristics who did not ( 15 ). The study in Salt Lake City categorized survey respondents into four groups based on expectations about using the light rail before TRAX was operating and ridership after it was functioning: no expect/no ride, no expect/ride, expect/no ride, and expect/ride ( 16 ). Using generalized linear models, estimated means, and standard error approaches, the authors compared the impacts of different variables on the different groups about the built environment and expected impacts ( 16 ). Their analysis focused on an area before and after a light-rail extension and identified a correlation between ridership and expectations of a positive impact on their neighborhood ( 16 ).
Data and Methods
Recruitment
Recruitment for this survey took place between October and December 2019. In keeping with best survey practices, there were multiple recruitment methods and incentives provided to recruit participants and secure a diverse and representative sample ( 17 ). Some of the recruitment efforts targeted people in the areas that would be directly affected by the REM and its construction, including people living within 2 km of existing commuter train lines that will be shut down because of REM’s construction. These lines were the Deux-Montagne and Mascouche Exo lines. Other recruitment efforts targeted the general Montreal population as a control. Recruitment methods included hiring Leger, a company that specializes in gathering public opinion surveys, to collect 1,800 completed surveys. Additionally, the research team posted links to the survey in social media groups, such as a Facebook group for Deux-Montagnes train users to attract “affected” residents, and the r/Montreal Reddit channel, to reach residents more generally. The research team also purchased geographically targeted advertisements on Facebook. In-person recruitment with flyers took place near public transport hubs that bring commuters to downtown Montreal from other areas, including the Gare Central train station, and at store locations located on McGill’s downtown campus. The research team also drafted a press release with McGill University to advertise the survey and spoke to the press on the radio in both French and English.
Survey Data Cleaning
The total number of complete and partial survey responses at the end of the recruitment period was 5,942. We first removed all incomplete responses for a total of 4148 completed surveys. We then removed responses that were completed too quickly to be deemed reliable. The survey’s potential length and duration to complete depended on respondents’ reported travel behavior (i.e., if they traveled to work, traveled to school, traveled to both work and school, or if they did not travel at all). Therefore, we divided the responses into these travel-behavior categories and removed the fastest 10% in each category ( 18 ). Other potentially unrealistic responses that were used to filter out survey responses include a reported a birth year before 1920, thus being over 99 years old, and reporting spending over 200 min, or about 3 h and 20 min, commuting by walking or bicycling per day, leading to a sample of 3,683 complete responses. Overall, the survey sample was socioeconomically diverse and largely reflective of Montreal’s population, with the exception of a slight overrepresentation of transit users, likely because of targeted recruitment, a slight overrepresentation of women ages 25–35, and underrepresentation of all people 75 and older. Figure 2 compares the age and gender of Montreal, the affected area, and the survey respondents.
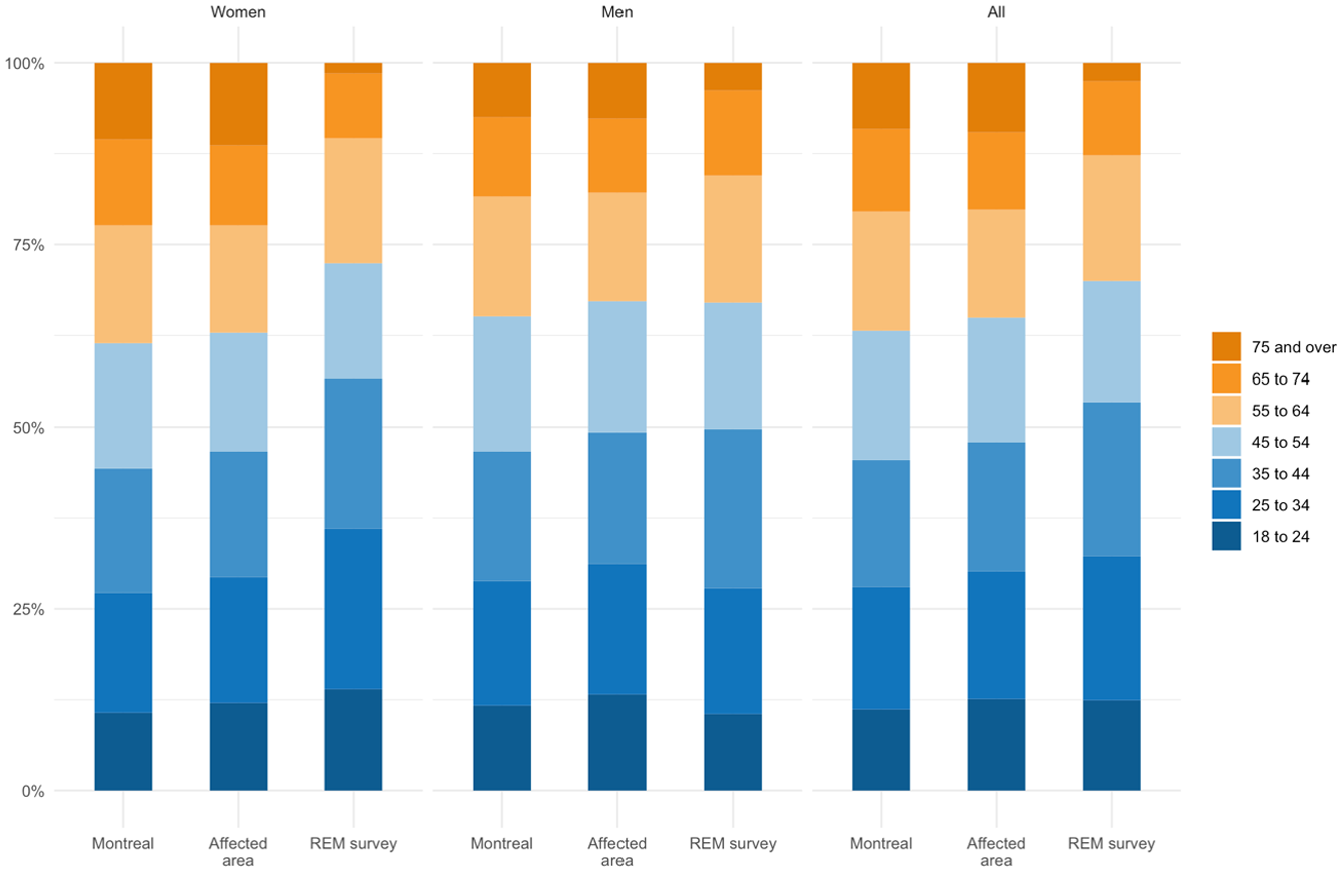
Réseau express métropolitain (REM) survey respondents by age and gender compared to the population of Montreal and the directly affected areas, within a 1 km radius of the REM (2016 Census Data).
Exploratory Factor Analysis and Cluster Test
To interpret the survey results and understand which populations are more likely to use the REM when completed, this paper uses an exploratory factor analysis to expose groups of related variables (factors). This approach offers an interpretation of the patterns seen among survey respondents, rather than assessing the results of each question in isolation. The factors are then used to identify clusters of respondents through a k-means cluster test. Other transport studies employ the same tests for identifying cycling and public transit user typologies. These precedents show how typology categories can help planners and engineers understand the potential markets for different types of public transport infrastructure ( 3 , 19 ). Exclusion criteria for the factor analysis and cluster test were: (a) not having heard of the REM project before the survey (n = 562) and (b) not providing a home location (n = 149), bringing the total cases included in the analysis to 2,972. Factor extraction was completed on SPSS Version 24, using an Unweighted Least Squares method with an oblique rotation (Normalized Promax) to accommodate ordinal data and allow for some correlation among factors ( 20 , 21 ). Lastly, respondents’ home locations were mapped and color-coded by cluster group to enhance findings with an interpretation of geographical patterns.
Results
Survey Overview and Summary Stats
As part of the survey, respondents were asked: “How likely are you to use the REM when it is complete and operational?” Response options ranged from 1 (“very unlikely”) to 5 (“very likely”). Of the retained sample for the factor-and-cluster analysis, 628 people reported being “very likely” to use the REM; 977 said they were “likely;” 297 said “neutral;” 568 said “unlikely” and 502 said “very unlikely.”
The retained sample included 1,492 (50.2%) respondents who identified as women, 1,434 (48.3%) as men, 21 as non-binary (1.1%), 23 (1.0%) who preferred not to answer, and 2 (less than 1.0%) as other. The largest proportion of respondents fell within either the 35–44 age group (640 or 21.5%) or the 25–34 age range (598 or 20.1%). The majority of respondents commuted to work, 1,762 or 59.3%. Of those who commuted to work, 50.9% or 896 respondents used public transit as their main mode. Driving a personal vehicle to work was the main mode for 32.1% or 566 respondents. An additional 488 respondents from the whole sample (16.4%) commuted to school. Among these students, the most popular main commute mode was the metro (184 or 37.7%) followed by the bus (90 or 18.4%), walking (81 or 16.6%), or driving a personal vehicle (62 or 12.7%).
Factors
Some 102 variables were identified as relevant to the analysis of who is most likely to use the REM. These initial variables covered themes such as anticipated REM use, attitude toward the REM project, current commute modes for work or school, neighborhood self-selection, mode satisfaction, and socioeconomic status. By interpreting the natural breaks of scree plots (a line plot showing eigenvalues of principal components) and using model fit indices to verify goodness-of-fit, 35 variables were included in the final analysis, revealing seven factors. A Kaiser–Meyer–Olkin Measure of Sampling Adequacy score of 0.835, which indicates the proportion of the variance within the variables caused by underlying factors, and a significant result for the Bartlett’s Test of Sphericity (p < 0.000), which helps determine if the included variables are sufficiently related for factor-and-cluster analysis, indicate an appropriate model ( 22 ). The resulting pattern matrix provides loading scores, revealing the weight by which the overarching factor predicts a variable outcome, summarized in Table 1. Taken together, the seven factor groups explain 53.8% of variation in the survey data. Factors are described in the list below and named based on the variable groupings.
The REM is convenient and travels to preferred destinations,
Transit use and having a transit pass,
Being happy with current work or school commute mode,
Less car use and less economic stability,
Positive opinion of the REM as good for Montreal and the environment,
Choosing your neighborhood based on comfort and affordability, and
Urban upbringing.
Factors, Variables, and Loadings (Pattern Matrix)
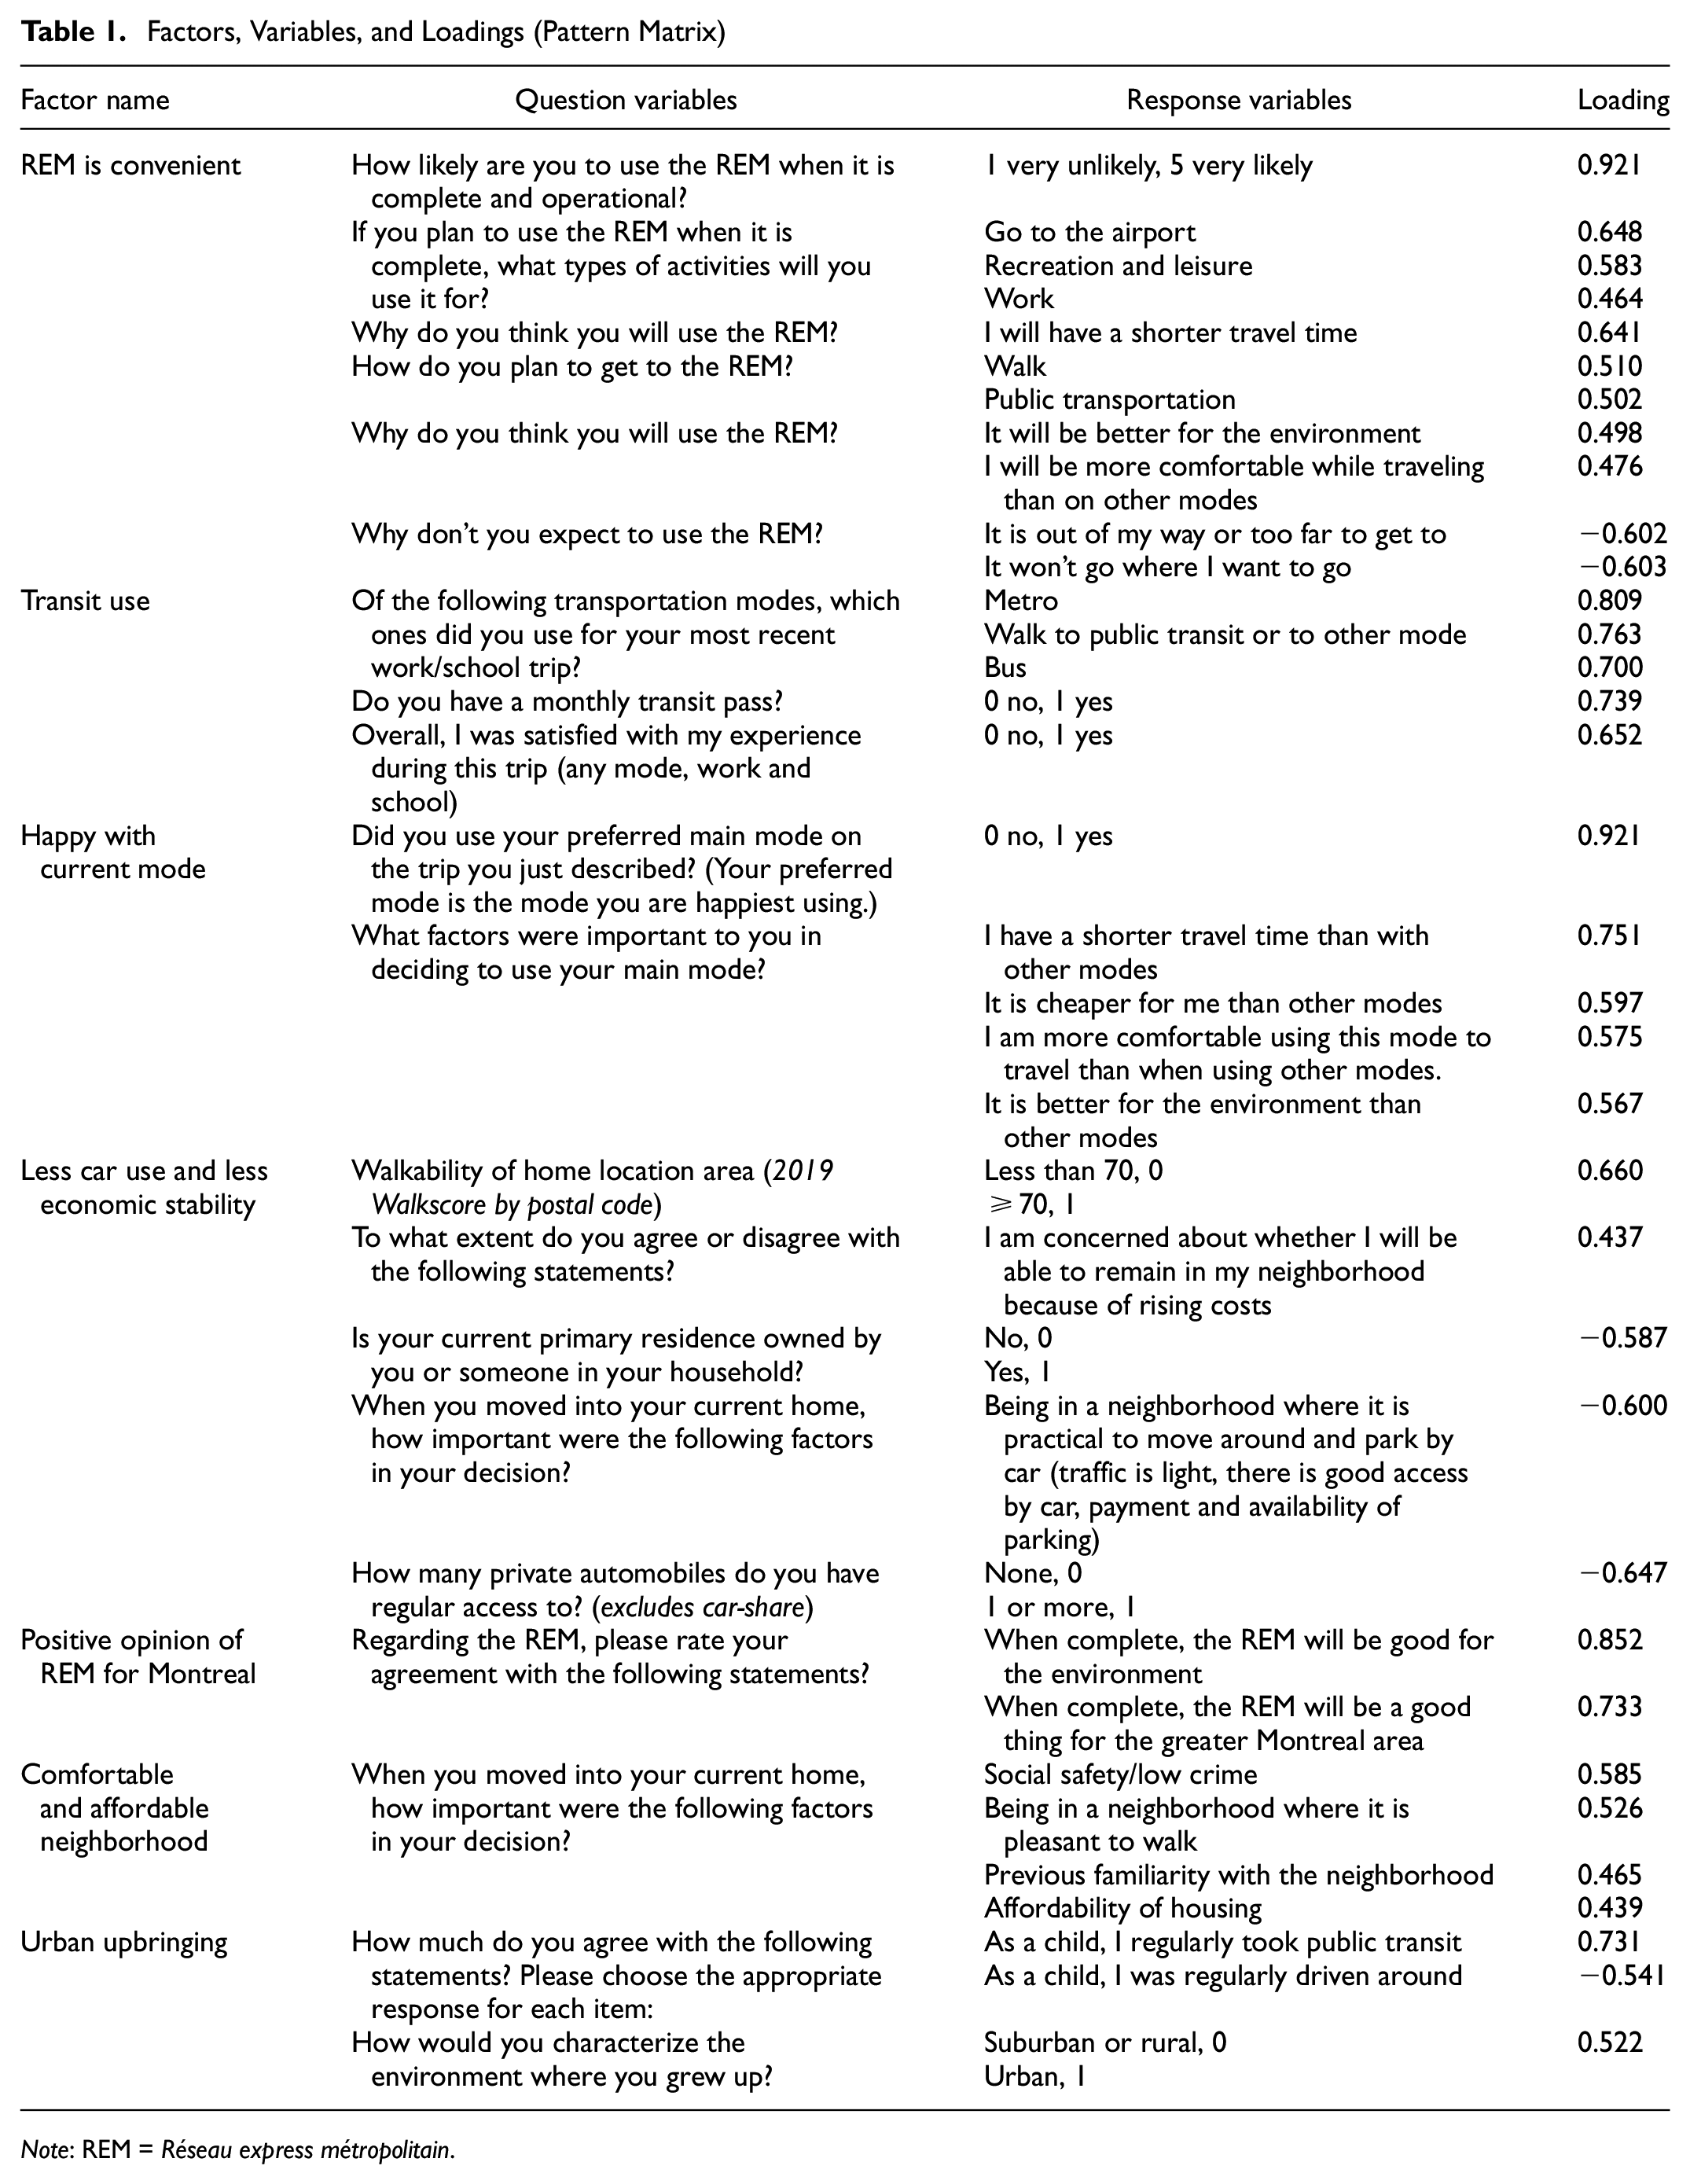
Note: REM = Réseau express métropolitain.
The largest correlation between two factors was 0.45 between factors 2 and 3. This may reflect that among this sample, transit users were both satisfied with their trips and considered transit to be their preferred mode (Table 1).
Clusters
Using SPSS, a k-means cluster test was attempted with between two and four groups, with four returning the most logical results ( 23 , 24 ). The resulting four clusters are named to reflect their likelihood of using the REM and for their distinguishing characteristics: Car-friendly non-users, urban core potential users, transit-friendly users, and leisure and airport users (Table 2). Table 2 further explores how socioeconomic characteristics and commute modes differ among the clusters. It is important to note that when reporting commute modes, the proportions refer to the mode used for work or school for any portion of the trip; thus, respondents sometimes selected more than one mode.
Socioeconomic Data by Cluster
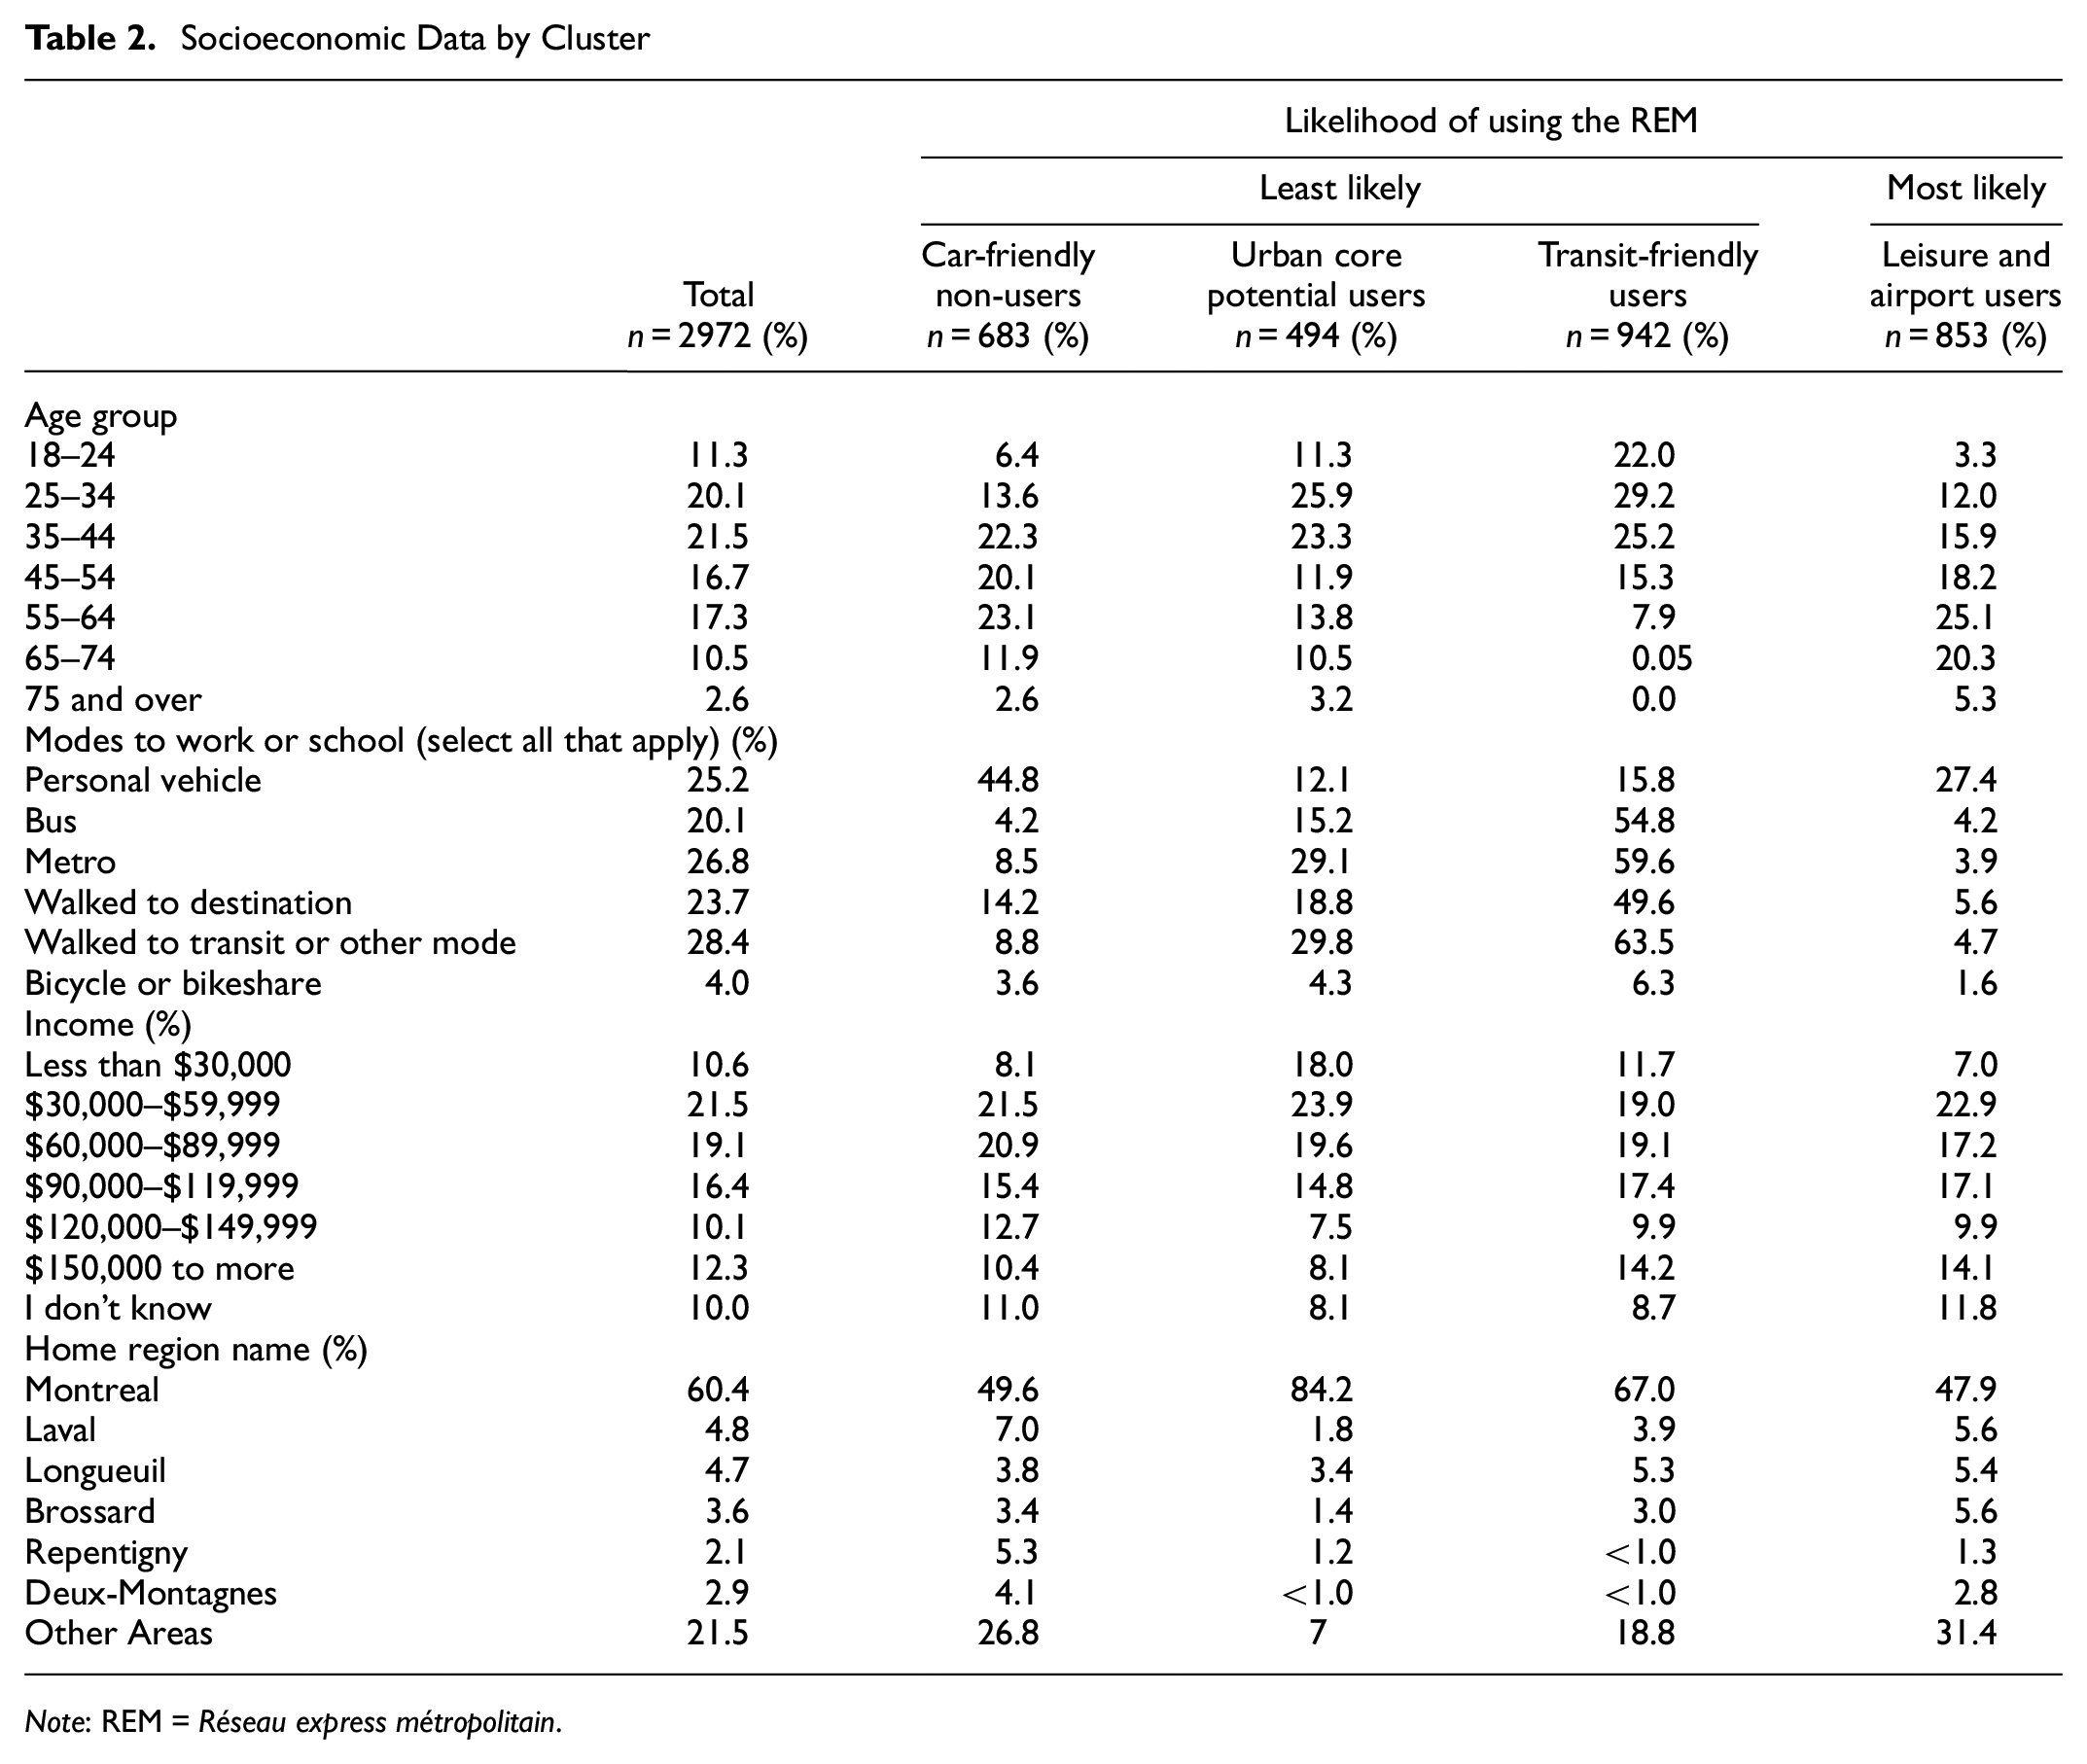
Note: REM = Réseau express métropolitain.
Figure 3 uses positive and negative scores for each of the seven factors to describe the four clusters. Essentially, a positive score indicates that the group tends to share these characteristics and a negative score means the cluster does not largely display these characteristics. In the following narrative, each cluster’s relationship to the seven factors is discussed along with additional data that enhances the understanding of each typology.
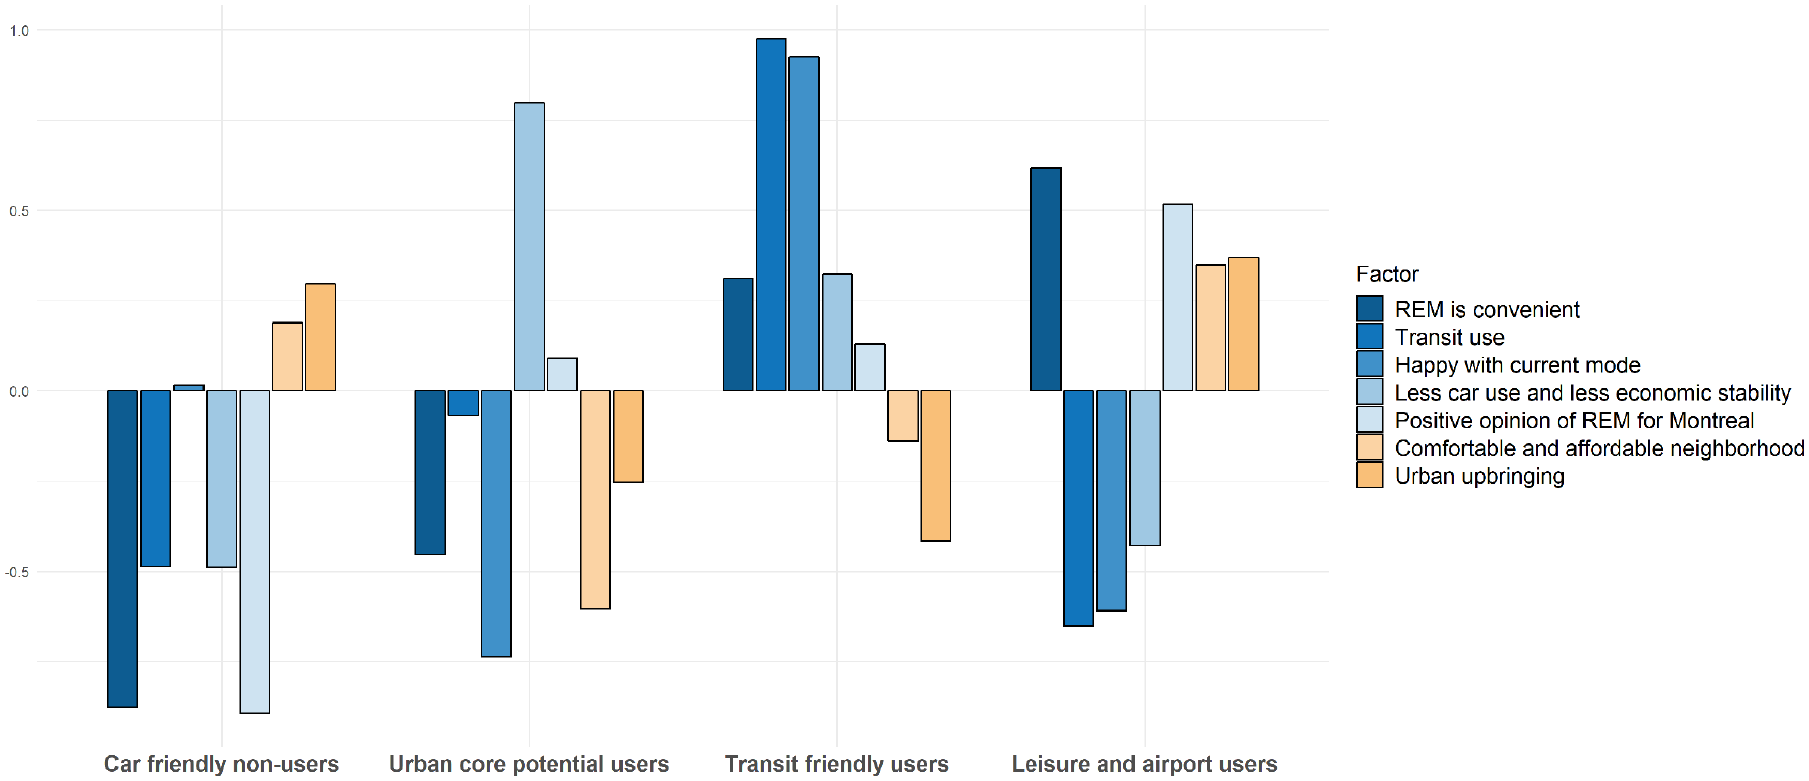
Factors and clusters.
Car-Friendly Non-Users (23%, n = 683)
Car-friendly non-users are the least likely group to use the REM (76.8% very unlikely or unlikely). The two most common reasons provided are that the REM will be too far out of the way to get to (37.0%) or will not go to where they want to go (34.0%). This cluster expresses that their current mode is preferred because of speed, cost, and comfort. They were less likely to agree that the REM will be good for Montreal or the environment, and 40.4% disagreed or strongly disagreed that the REM would be good for their neighborhood, the highest rate of disagreement from any cluster.
The car-friendly non-user cluster is distinguished by its relatively high private-vehicle use. Some 44.8% use a private vehicle to get to school or work compared with 25.2% of the whole sample, and they are less likely to use transit or have a transit pass. Compared with the other three clusters, respondents in the car-friendly category contain more residents of Montreal’s further suburban areas, including Repentigny or farther-flung portions of Deux-Montagnes that will be distant from the future REM line. They are more likely to have reported selecting their current home based on social safety or low crime, a pleasant walking environment, neighborhood familiarity, and affordability. Despite the relatively high suburban representation, car-friendly non-users are likely to have used transit in their childhood.
Urban Core Potential Users (16.6%, n = 494)
The urban core potential users group represents the smallest cluster of the four. Slightly more than half of the urban core group reported being unlikely or very unlikely to use the REM (57.9%). This more-even split renders this cluster as a potential user market. A high proportion of respondents living in central Montreal distinguishes the urban core from the others, with 84.2% living in Montreal proper, largely east of the future REM line (Figure 4). Although the urban core group generally possesses a positive perception of the REM as beneficial for the environment and Montreal, this cluster also indicates that the REM will not go to their preferred destinations (34.0%) or that it will be too far out of the way to reach (28.5%). Approximately 59.7% of this cluster neither agreed nor disagreed that the REM will be a good thing for their neighborhood.
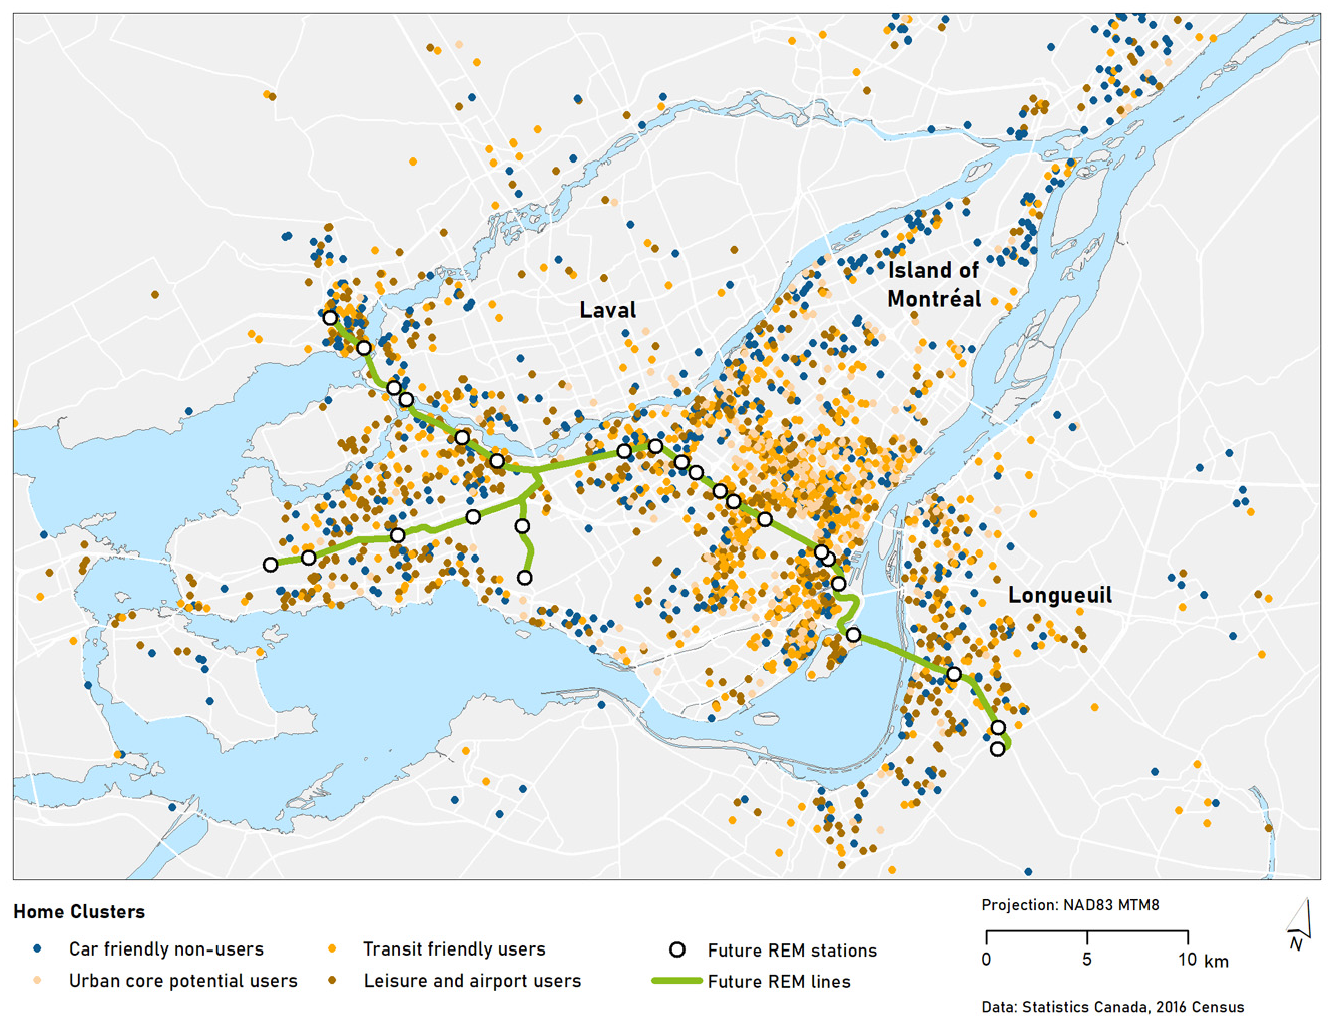
Home locations by cluster.
Urban core respondents reported a slightly lower income bracket than the entire sample, though 51.8% had access to at least one privately owned vehicle. They are very likely to live in a walkable neighborhood (88.7%), more likely to be renters (61.5%), and more likely to be concerned about rising costs in their neighborhood (46.4%). The majority are not satisfied with their current main commute mode (69.8%).
Transit-Friendly Users (31.7%, n = 942)
Transit-friendly users are where the clusters shift to being more likely REM users: two-thirds of this cluster say they are likely or very likely to use the new system when it is complete and operational. The most likely uses among this sample are shopping and running errands (54.4%), work (34.7%), and recreation and leisure trips (31.2%). Half of the sample said they would take public transportation to access the REM station (50.1%) and 34.6% said they would walk. This group has the youngest population and the highest proportion of students (33.9%) of any cluster (this includes students who also work), and they are also notably more likely to use the bus, metro, or a combination of walking and transit to reach their destinations. They also are highly satisfied with their current transport modes (87.4%).
Like the urban core, transit-friendly users are more likely to live in a walkable neighborhood (64.3%) and slightly over half are homeowners (52.2%). Although only 15.8% used a personal vehicle for their recent school or work trip, a majority (62.6%) report having access to at least one car. Despite this, they think positively of the REM project for the environment and Montreal. Slightly less than half agree that the REM will be good for their own neighborhood (42.6%). Their home and work locations are grouped more centrally or west of the central area on the Island of Montreal, with a notable cluster who work downtown. Most (89.4%) said being near public transportation was important when choosing their home. Transit-friendly users are also more likely to live in census dissemination areas with lower median household income than other clusters.
Leisure and Airport Users (28.7%, n = 853)
Leisure and airport users are the most likely cluster to use the REM: 84.9% said they are likely or very likely to use the infrastructure when it is complete. For this cluster, the REM is a new opportunity to use transit: Although two-thirds grew up using transit (66.0%), most do not currently travel this way and show the lowest proportion of transit-pass holders of any cluster (17.8%). Unlike the other clusters, this cluster’s leading reasons for using the REM are recreation and leisure trips (63.5%) and traveling to the airport (62.3%). Less than one-third reported that they would use the REM to get to work (29.7%). To get to the station, 39.0% of the sample said they would take public transportation and 33.2% would walk. Leisure and airport users think positively of the REM in relation to its beneficial effects on the environment and Montreal, and 62.7% agreed or strongly agreed that it will be good for their own neighborhood.
Half (50.7%) of this group are aged 55 or older, with 34.7% being retired and not working compared with 17.4% of the sample. It was important or very important for this group to choose to live in a neighborhood where it is pleasant to walk (88.3%). The majority (88.6%) have access to at least one car and 73.6% own their current home, reflecting a high degree of economic security. Almost all respondents said it was important or very important to be in a neighborhood with social safety and low crime (91.2%). Their home locations are often clustered on the West Island or other nearby suburban areas like Laval, Longueuil, and Brossard. They are more likely to live in census dissemination areas with higher median home incomes.
Discussion
The cluster analysis returned four typologies that describe unlikely, potential, and likely REM users. The seven factors articulate relationships between each cluster’s socioeconomic characteristics, travel habits, and stated propensity to use the REM in the future. The following themes distinguish the potential and likely REM user populations from non-users.
Positive Neighborhood Perception
Generally, respondents agree that the REM project will benefit Montreal and the environment, but not necessarily their own neighborhood. People who perceived benefits to their neighborhood were most likely to use the future infrastructure. This pattern also applies in reverse: Those least likely to use the REM disagreed more often that the REM would be a good addition to their neighborhood (Figures 5 and 6). The urban core potential user group is largely indifferent to this question, demonstrating a potential opportunity for improving the perceived benefits of the REM among this population. Because only 30.2% of this potential user group is satisfied with their current mode, ensuring that more Montreal residents understand how the REM improves transport speed, flexibility, cost, and comfort may possibly prove an effective strategy for encouraging ridership.
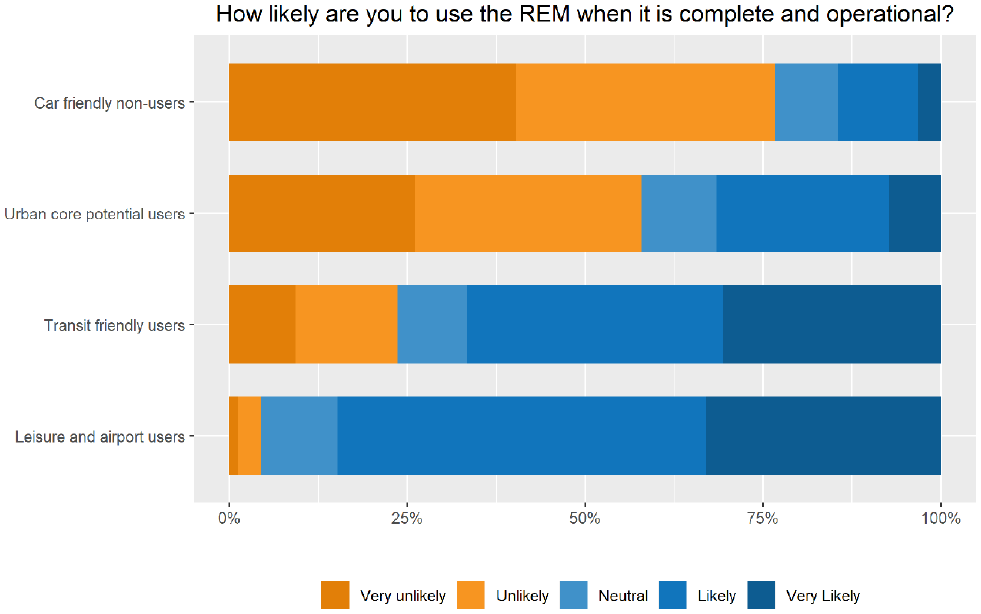
Likelihood of using the Réseau express métropolitain (REM).
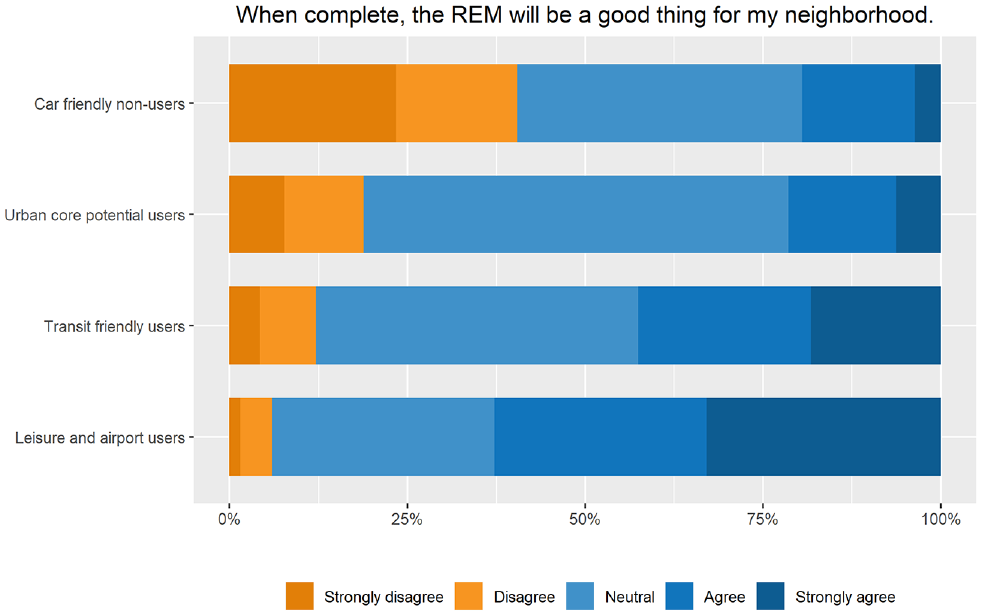
Perceived neighborhood benefit of the Réseau express métropolitain (REM).
Proximity
The analysis demonstrates a relationship between self-reported likelihood of riding the REM and living closer to the line. One indicator is that the leisure and airport users and the transit-friendly users both said they can access the station on foot or by other public transport. Another indicator is examining the spatial distribution of home locations for each cluster (refer back to Figure 4), which confirms that leisure and airport users tend to live near the future REM line and stations, especially in Longueuil and the West Island. Although some car-friendly non-users live near to the REM, they are also most likely to be scattered farther east on and off the island. Urban core potential users and transit-friendly users live more centrally in Montreal and to the east of the new line. Centrality to urban destinations and use of existing public transit infrastructure may also reduce some residents’ likelihood of needing to use the REM as compared with someone in a suburb.
Choice Ridership for Leisure Uses
The REM will initially see more users voluntarily choosing to use the REM—rather than captive audiences—for travel to recreational destinations. The most enthusiastic group are an older, socioeconomically stable population who do not use public transportation often and see the REM as a new option for getting to the airport or other recreational destinations. The transit-friendly cluster, a younger and more urban population, is already satisfied with the bus, metro, and walking, and the REM expands their range of accessible destinations rather than replaces an existing mode. Both the car-friendly non-user and urban core potential users indicated a lack of destinations of interest to them as a main reason for their disinclination to use the REM.
Conclusion
Using an exploratory factor analysis and typology study of 2,972 retained survey respondents, this study provides a framework for understanding populations who are least and most likely to use the future REM in Montreal. The four clusters show distinct traits that can guide resource investments and marketing for transport planners. Potential and likely users share positive perceptions of the REM project and 60.4% of the sample fall into two clusters that are most likely to use the REM. Positive opinion, proximity, and desire to use the REM for leisure or non-work trips are three key characteristics of likely users.
Recommendations
Improving perceived neighborhood benefit, accommodating leisure use, working to enhance destinations, and highlighting transit connections are four core ways that planners may be able to work on to increase the number of people who are likely to use the REM given their correlation with stated ridership intentions. Specific policy recommendations are discussed below.
Strengthen positive neighborhood perceptions: Because seeing the REM as an asset to one’s neighborhood is correlated with a greater likelihood of riding, the REM’s operators should consider advertising the economic, social, health, and environmental benefits of having a light rail in the area. Previous research has supported this approach ( 16 ). One method to do this is by ensuring that REM infrastructure fluidly and visibly connects to residential districts. Pedestrian-friendly design near REM stations also would increase visibility of the new infrastructure and offer clear, direct routes to access. This is consistent with previous research that found that walk access to public transit has a significant impact on the mode choice of choice users ( 5 ). New wayfinding to and from bus and metro infrastructure to the REM would ensure fluidity from other public transport modes.
Accommodate leisure use: A distinguishing characteristic of the likely user market is interest in using the REM for non-work trips, especially going to the airport, recreational trips, and running errands. REM planners should consider improving and adding direct airport links that minimize transfers. Frequent service during off-peak hours when recreational trips are more likely will accommodate more users and could enhance the service’s appeal to these types of users as an option.
Emphasize and enhance destinations: Among the urban core potential user group, there appears to be a general opinion that the REM will not serve the destinations they are interested in accessing. This could be a result of the REM’s “commuter” structure, which primarily provides a direct connection between suburban points and Montreal’s downtown core. To bolster ridership among this group—and thus ensure that the benefits of the REM flow to a broader range of users—planners may wish to investigate through surveys and other means the destination preferences of this particular segment of the population. To the extent the desired types of destinations are already projected to be served, planners could promote them more directly through advertisements to enhance people’s knowledge of how the infrastructure fits into their lifestyle and habits. For example, the REM could direct users to recreational destinations through station wayfinding and encourage destinations like parks, restaurants, and retail to advertise if visitors can easily reach them on the REM. If the desired destinations for urban core potential users are not already expected to be available, planners could work with other transit providers to develop better linking services from REM stations. Planners also should work with the city to promote land-use changes around suburban stations that provide additional amenities and destination opportunities.
Help people understand transit connections: Because both the urban core potential users and transit-friendly users are comfortable taking transit and walking, REM advertising and wayfinding in Montreal’s urban areas should focus on access from the metro or popular bus routes. Promoting seamless connections between home and REM infrastructure would potentially make distance from the station less of a barrier and matches existing travel habits for the urban population.
Future Research
The data for this study derive from a longitudinal, multi-year analysis of the REM’s long-term impact on health, well-being, and travel behavior. The research presents numerous opportunities to refine and expand on the market-segmentation techniques used in this paper. These opportunities include inquiring about REM use once the light rail is operational. This would allow researchers to compare and contrast earlier expressions of subjective propensity of use with actual travel behavior. For future waves of the survey before the REM becomes operational, the researchers may also include additional questions that require respondents to weigh trade-offs between the REM and other modes for different types of trips. This approach would potentially provide a more accurate indicator of true future usage patterns and demand ( 25 ).
Footnotes
Acknowledgements
The authors would like to thank Boer Cui for her help in designing the survey, and Anastasia Belikow, Zane Davey and Hanna Demyk for their help in the data cleaning and maps preparation.
Author Contributions
The authors confirm contribution to the paper as follows: study conception and design: Dent, Hawa, DeWeese, Wasfi, Kestens, and El-Geneidy; data collection: DeWeese, Wasfi, Kestens, and El-Geneidy; analysis and interpretation of results: Dent, Hawa, DeWeese, and El-Geneidy; draft manuscript preparation, Dent, Hawa, DeWeese, Wasfi and El-Geneidy. All authors reviewed the results and approved the final version of the manuscript.
Declaration of Conflicting Interests
The author(s) declared no potential conflicts of interest with respect to the research, authorship, and/or publication of this article.
Funding
The author(s) disclosed receipt of the following financial support for the research, authorship, and/or publication of this article: This research was funded by The Canadian Institutes of Health Research (CIHR) and The Natural Sciences and Engineering Research Council of Canada (NSERC) Collaborative Health Research Projects (CHRP) Program (Project numbers CIHR CPG-170602 and CPG-170602. The content and views expressed in this article are those of the authors and do not necessarily reflect those of the Government of Canada.