
Abstract
The objective of eco-drive technology is to reduce fuel consumption and resulting emissions using advances in communication and traffic control technologies with capability to support infrastructure-to-vehicle connection in a signalized network. On the human factors side, there is growing interest across the world in advising drivers to take eco-drive actions by effectively using the green phase of the signal cycle time to save fuel and reduce emissions. This paper describes a large-scale real-world research project in Ottawa (Ontario, Canada) on this subject. The technology and methods that support the green light optimized speed advisory (GLOSA) system were refined and all 1,178 traffic signals in the city were equipped to connect with a fleet of vehicles. Field study data were analyzed for speed trajectories, fuel consumption, and GLOSA compliance. Greenhouse emissions and fuel cost changes were computed. An anonymous questionnaire study investigated driver perception of the usefulness of the signal data displayed on an in-vehicle unit as advice on driving adjustment decisions made under prevailing traffic conditions. The over 65% compliance with GLOSA and the results of the driver questionnaire were mutually consistent. The fuel saving amounted to 7.6% but was adjusted to 5% because of uncertainties in daily vehicle travel. The reduction in carbon dioxide equivalent and fuel cost reported in the paper are based on a 5% adjustment. These results can be used for cost–benefit studies. Also, simulation-based research projects can verify their findings with the real-world experience reported in this paper.
The Connected Vehicle Reference Implementation Architecture (CVRIA) was developed by the U.S. Department of Transportation in association with several other agencies as a means to better communicate the many uses and functions of connected vehicles (CVs) and their applications ( 1 ). The CVRIA classified CV applications into four categories: safety, mobility, environmental, and support. The environmental applications were further divided into Applications for the Environment: Real-Time Information Synthesis (AERIS) and road weather applications. The eco-drive application is one of the five operational scenarios and applications of AERIS, assisted by eco-signal operation. The scenarios are eco-signal operations, eco-lanes, low emission zones, eco-traveler information, and eco-integrated corridor management. Although eco-drive in general and the effect of green light optimized speed advisory (GLOSA) provided to drivers in particular have attracted research attention, most studies reported results based on the simulation approach without the benefit of detailed field study (2–4).
This paper describes a large-scale city-level real-world research project carried out in Ottawa (Ontario, Canada) to investigate the effectiveness of eco-drive technology and methods in enhancing environmentally friendly and economic movement of persons and goods. The paper consists of sections on the theoretical basis of GLOSA effect, knowledge gaps, research framework, technology and human factors, and the effectiveness of the GLOSA system. The indicators used in the effectiveness of the GLOSA system are the extent to which drivers were able to use the advice at equipped intersections, reduction in average fuel consumption, reduction in greenhouse gas (GHG) emissions, and fuel cost saving.
Theorical Basis of GLOSA Effect
In urban road networks controlled by traffic signals, drivers maintain headways and change lanes according to their perception of safety and efficiency in driving. Interrupted driving caused by signals results in stop-and-go operations, causing an adverse effect on fuel consumption and emissions. The availability of GLOSA enables drivers to avoid an interruption in their speed trajectory. Figure 1 illustrates the speed profile of two drivers. As this concept diagram shows, one driver is able to avoid stopping at the traffic signal because of the availability of GLOSA and compliance and the other either did not receive the advice or did not change speed in spite of advice. The slope of a trajectory reflects the speed of the vehicle.
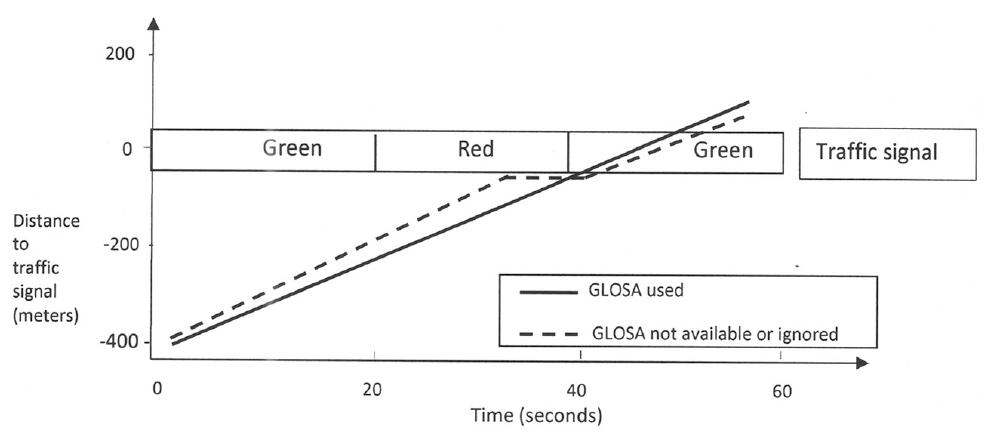
Concept diagram of driving trajectories with and without GLOSA under favorable traffic conditions (Adapted from the study by Eckhoff et al. [5]).
Theoretically, availability of reliable GLOSA and acceptance of advice by the driver should reduce the frequency and intensity of speed changes and save fuel. However, there are some known limitations of GLOSA that compromise the achievement of the full potential of the technology. The success in altering the driving trajectory to avoid stopping at a signalized intersection can be compromised because of the density of traffic. That is, the driver’s ability to travel at their desired speed or to change lane is affected by prevailing traffic density. Another limitation is that the intent of a driver to follow GLOSA can be compromised by a leading driver who does not receive the information or is not following the advice.
State of Knowledge
Several researchers have advanced the base of knowledge in eco-drive. However, a recent study reviewed 64 papers published between 2006 and 2019 and found that the typical reviewed paper evaluated GLOSA benefits based mainly on simulation of equipped vehicles. The authors concluded that there is a lack of investigation of driver behavior for compliance with GLOSA in real-world traffic networks ( 2 ). Selected research studies on the effectiveness of GLOSA are noted below.
A notable project, the NordicWay 2, co-financed by the European Union’s Connecting Europe Facility program, investigated cooperative intelligent transportation system services in the Nordic countries (Denmark, Finland, Norway, and Sweden). Among other benefits, environmental effects of services were studied. Although “time to green or optimal speed” information provided to the users was included in the project, the reduction in carbon dioxide (CO2) was measured on the basis of changes in modal choice, vehicle-kilometers driven, and changes in vehicle speeds ( 3 ). Therefore, the effectiveness of GLOSA cannot be inferred from the data reported in Reference ( 3 ). As for the usefulness of GLOSA information to users, responses were obtained on a scale of 1 (“not at all”) to 7 (“very important”). Responses covered the entire range and peaked at 5 (for urban streets).
Eckhoff et al. ( 5 ) investigated the potential and limitations of GLOSA systems. Their simulation study found that low traffic densities could lower emissions by up to 11.5%. However, in dense traffic their results were not favorable. Bauer et al. ( 6 ) used an on-line prediction system of traffic signal states for assisted driving on urban streets. They reported pilot experiences in the United States, China, and Germany. Their results showed that when fully deployed, GLOSA can help reduce carbon emissions from traffic by up to 15%. Stevanovic et al. ( 7 ) investigated the impact of signal phasing information accuracy on GLOSA systems. They noted that fuel savings achievable can be low in a signalized network operating under actuated-coordinated signal operations and highlighted the need to update advice frequently. They also recommended studies on the effect of traffic density on GLOSA-enabled fuel savings ( 7 ).
Stebbins et al. ( 8 ) investigated GLOSA trajectories for platoon-based optimization. They primarily focused on delay reduction and claim that their algorithms are ideal for connected autonomous vehicle environments because of the ease of automated systems to manage vehicles’ trajectories. Saunier et al. ( 9 ) reviewed studies on the impacts of CVs on GHG emissions. However, there is a lack of detail on the conditions under which studies were carried out as well as results obtained.
Several other studies have been reported on GLOSA systems. Stahlmann et al. ( 10 , 11 ) reviewed selected GLOSA system simulations and field study results. Their reviewed studies, some with limited scope for network coverage and controlled operating conditions, reported fuel savings in excess of 13%. For example, see the studies by Xia et al. ( 12 ) and Chen et al. ( 13 ). Karoui et al. ( 14 ) investigated a path planning GLOSA-based simulation approach in a large-scale and realistic scenario. Their simulation study carried out under free-flow and peak-hour conditions showed that GLOSA offers a balanced scale between travel time reduction and fuel savings. Bradai et al. ( 15 ) reported a GLOSA system for reduced CO2 emissions that was implemented on a demonstration car. The test results of this single car study were reported to be promising ( 15 ). Xin et al. ( 16 ) studied connected eco-drive technologies for adaptive traffic signal control. Two sites were selected for simulation studies and their results indicate that the eco-driving strategy reduced fuel consumption and emissions even with non-optimal signal timing information from adaptive signals ( 16 ).
Research Framework
A large-scale real-world research project was carried out in Ottawa (Ontario, Canada) to investigate the effectiveness of eco-drive technology and methods in enhancing environmentally friendly and economic movement of persons and goods ( 17 ). In a previous pilot research project, completed in 2018, the City of Ottawa in association with the Ministry of Transportation of Ontario and Transport Canada demonstrated the eco-drive system using 12 traffic signals in the Hunt Club Road corridor, Ottawa, by equipping freight vehicles and an instrumented passenger van ( 18 , 19 ). The large-scale project described in this paper, funded by Transport Canada’s Program to Advance Connectivity and Automation in the Transportation System, benefited from research and application of technology in the previous small-scale study. The large-scale project included a fleet of seven vehicles and all 1,178 traffic signals in the City of Ottawa were equipped to connect with these vehicles. Improvements were made to the latency of data communicated between infrastructure and vehicle. In addition, accessibility was improved for the signal phasing and timing and intersection geometry data provided by the City of Ottawa. The large-scale project commenced on December 1, 2018 and was completed in early 2020 ( 17 ).
The research framework for the large-scale project consisted of components described next. Following planning, technology implementation, and driver training steps, the field data acquisition commenced using seven city vehicles. The drivers, while traveling in the network performing their assigned duties, contributed real-world data for research purposes over 8 weeks. The decision to equip all signalized intersections offered the opportunity to capture data from various parts of the City of Ottawa’s signalized network that potentially exhibits different traffic environments. The data were merged with geographic information system data attributes to include additional spatial components. These were filtered to exclude engine shutdown, excessive idling (more than 90 s), highway speeds (greater than 95 km/h), and “intersection out-of-range of GLOSA.” Filtered data were analyzed for human factors (i.e., GLOSA compliance) and for reduction in fuel consumption and emissions as a result of GLOSA. Results of analyses were used to evaluate the technology with regard to fuel saving, emission reduction, and economic benefits.
Eco-Drive Technology, Study Network, and Equipped Vehicles
An infrastructure-to-vehicle CV system shown in Figure 2 was developed by the City of Ottawa in association with consultants with the capability of (1) geometry, status, and timing plans, (2) signal timing prediction data, and (3) GPS location and heading. The high-level architecture of the system consists of back-end and front-end subsystems. Figure 2 shows the communication linkages, as well as the visual link between the signal head/controller and the driver. Working together, the system illustrates that the driver was able to confirm the data presented in the in-vehicle unit (IVU).
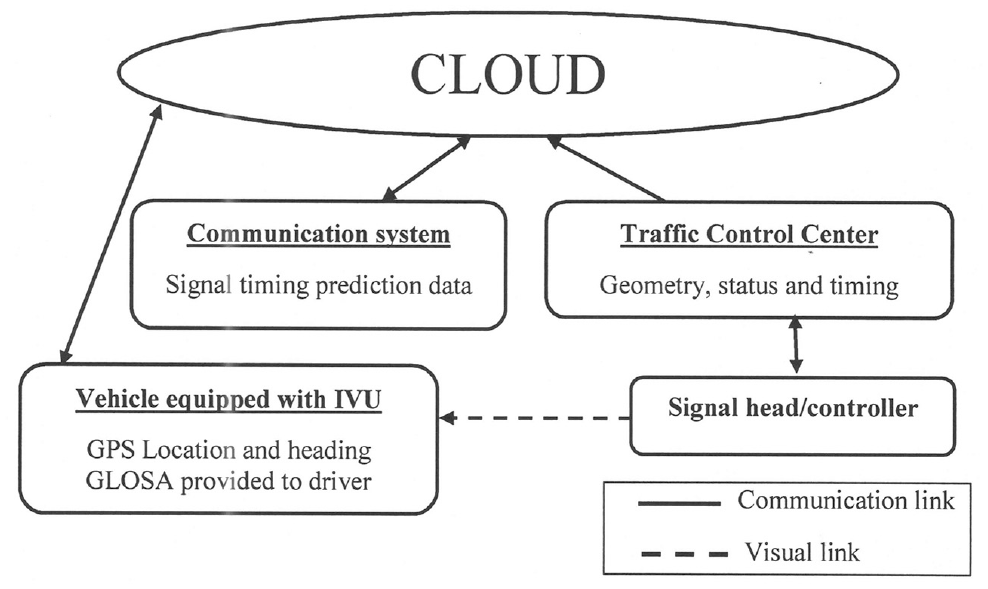
Connected vehicle (adapted from the City of Ottawa program [17]).
The City of Ottawa defined the study area as the entire roadway network. The majority of data collected were outside of the downtown core, where traffic signal spacing would provide sufficient distance for drivers to make speed adjustments based on the recommended GLOSA. The cellular-based GLOSA communications used in eco-drive provided advanced knowledge to a driver at longer distances than traditional dedicated short-range communication systems.
Seven vehicles were selected by the City of Ottawa for field studies. Six pickup trucks had gasoline engines of various sizes and one sprinter van had a turbo diesel engine. The test vehicles are representative of the majority of the City of Ottawa’s light duty fleet that includes approximately 130 passenger cars and 700 SUVs and pickups (excluding police vehicles and cargo vans).
Each vehicle was equipped with a dedicated Android cellphone mounted on the dashboard with the eco-drive app installed. It was used as the IVU driver interface. Drivers were expected to periodically glance at the IVU to benefit from the GLOSA information/recommendation. Figure 3 shows a sample display of the IVU installed in a vehicle.
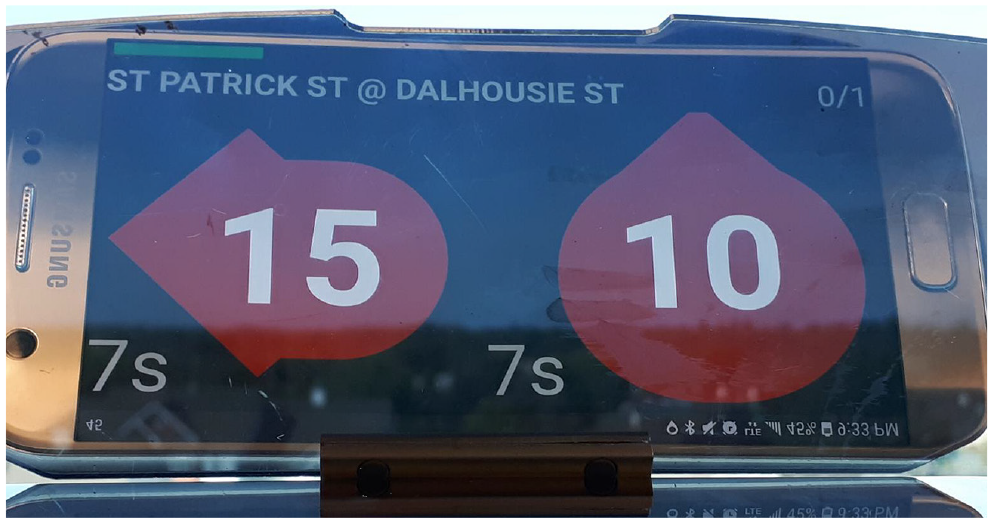
In-vehicle unit.
The human–machine interface design used was dynamically altered based on the information received from the system. In the case of no data or missing data, the intersection name was changed to “no data,”“intersection out-of-range,” or similar message. The user interface was designed to display a blank screen for the through direction and a simulated speed limit sign in the left-turn area when signal timing data were unavailable or showed uncertainty in the message. Similarly, if there was no left turn allowed at an intersection, the left-turn area would display the speed limit. If the intersection was a T-intersection, then the through direction area would display a right-turn marker.
The study was carried out over 8 weeks. Figure 4 illustrates the nature of data collected in the eco-drive study. Detailed analyses of the technology evaluation task were based on a subset of data that took into account driver experience in using GLOSA technology.
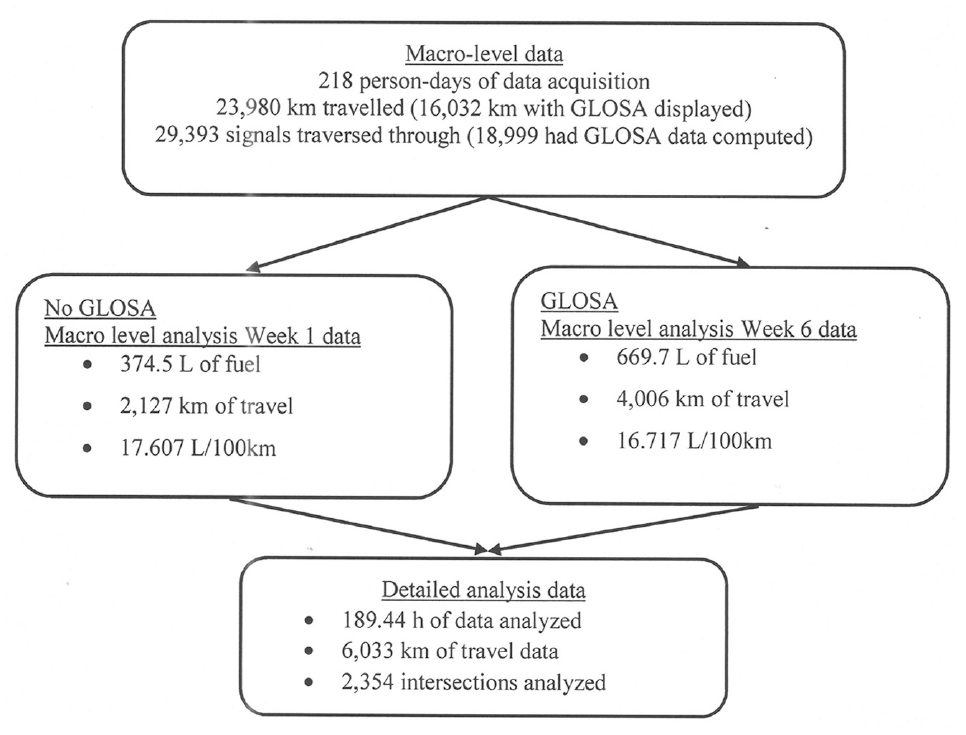
Eco-drive field study data and analysis.
The data for each vehicle-week combination were filtered for use in GLOSA and fuel consumption analyses. The following filtering (exclusion) criteria were applied: idling more than 90 s, high speeds (i.e., highway travel at speeds greater than 95 km/h), engine shutdown, and “intersection out-of-range.”
The one-second resolution of data on vehicle movement trajectory (i.e., defined by speed and frequent speed changes) and fuel consumption profile enabled the analysis of the driving behavior and its effects. In addition, the analysts were able to study whether the driving pattern was influenced by messages provided by the eco-drive system via the IVU (i.e., the signal timing information, until green and GLOSA). Theoretically, for safety and efficiency in driving, drivers aim to maintain selected headways under ambient traffic conditions and initiate lane change maneuvers to position themselves to follow a selected route or to overtake a slow-moving vehicle. The GLOSA information is intended to assist the driver to achieve this objective.
Study Results of Human Factors: Vehicle Driver Perception of Technology Effectiveness
During the field data collection period, the City of Ottawa obtained feedback from drivers about their experience of the use of the technology. Table 1 shows anonymous questionnaire survey results on the usefulness of traffic signal information, driving experience, and driver action influenced by the information. The results reported on a five-point scale are based on 17 responses obtained from participating drivers at the end of 3 weeks when the signal information was displayed to seven drivers. The potential total responses obtainable from seven drivers was 21.
Driver Perceptions
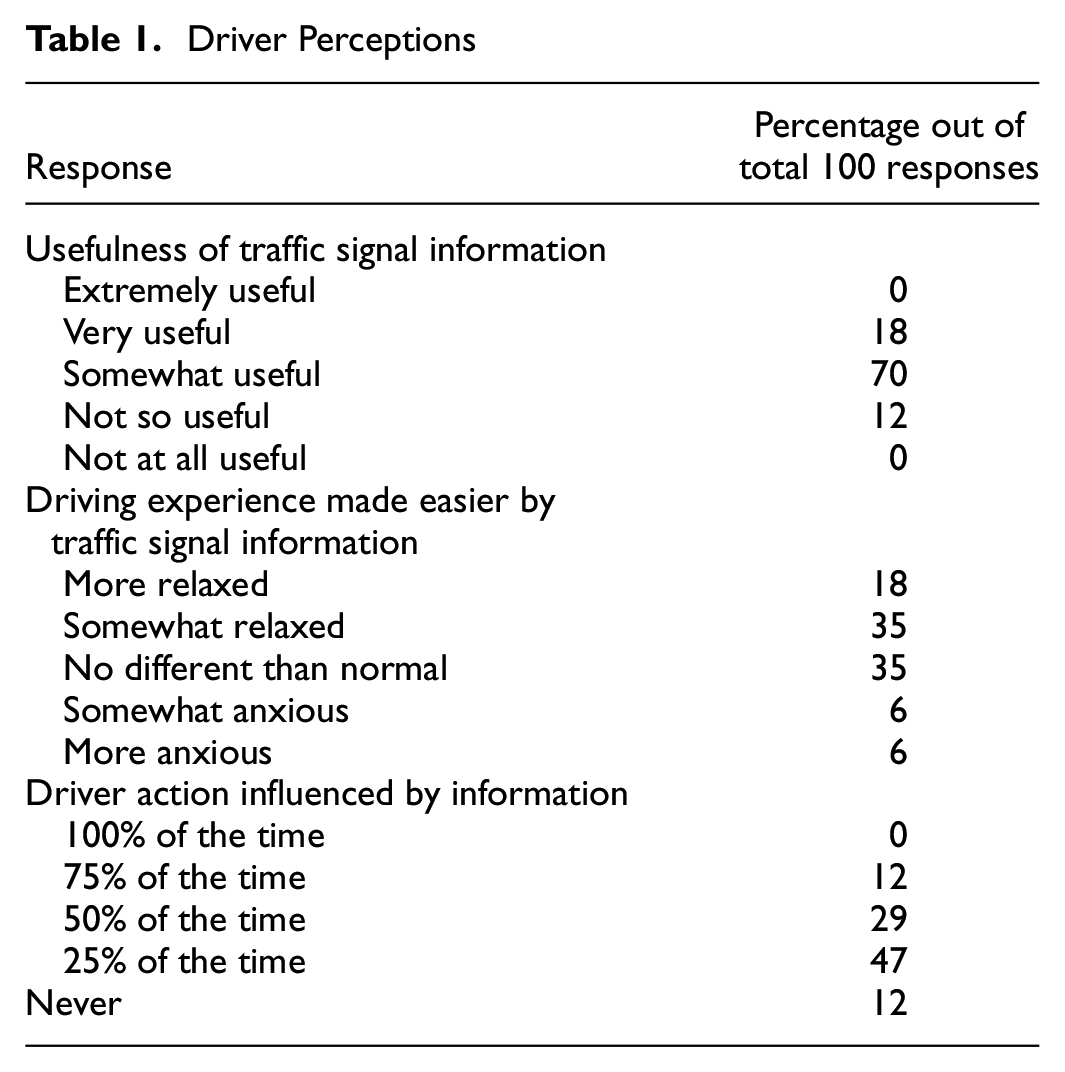
The drivers were asked to respond to the following question: “How useful did you find the traffic signal information?”. The results show that 88% responses were positive. The highest percentage of responses (i.e., 70%) was classified as “somewhat useful” and no responses were classified as “extremely useful.”. Also, a notable result is that respondents did not check the answer labeled as “not at all useful.”
The question “How did having the information make you feel about driving and waiting at lights?” produced results described next. A majority of responses (i.e., 53%) showed “more relaxed or somewhat relaxed” driving as a result of traffic signal information and 12% of responses indicated “somewhat anxious” or “more anxious” because of availability of information. Over one-third of responses perceived “no different than normal” driving experience.
The respondents were asked the following question about their perception of the influence of traffic signal information on their decision to adjust their driving: “How often did you adjust your driving because of the information shown?”. This was a difficult question to answer for the reason that driver action could potentially be influenced by the signal information as well as prevailing traffic conditions. The results indicate that only 12% of responses showed no influence. In the case of 88% of responses, various levels of the effect of signal information were indicated, but a high 47% of responses suggest 25% of time drivers adjusted their driving. The questionnaire survey did not ask for reasons for lack of action in adjusting driving, but the empirical analysis section on GLOSA compliance sheds more light on this subject.
On balance, the anonymous questionnaire survey of drivers in the city-level study showed that the eco-drive information provided to them was perceived to be useful, made the driving experience better and easier, and resulted in adjusting driving to achieve the eco-driving objective. Similar feedback was received from commercial vehicle drivers who participated in a previous corridor-level eco-drive study ( 19 ).
Study Results of Human Factors: GLOSA Compliance
As part of the research study, analysts looked at how often the GLOSA recommendation from the eco-drive application was usable for the driver to cross the intersection with the recommendation. In addition to compiling compliance data, the analysts noted the impeding effect of traffic that prevented the application from working as desired.
Other traffic flow issues were determined when the driver had to reduce the speed of the vehicle below 20 km/h as it approached a signalized intersection that was in a green phase. This vehicle behavior indicated the likely presence of a major backward-forming shockwave or queue. In such cases, the GLOSA recommendations were correct, but the prevailing traffic conditions were not favorable.
If there was evidence of non-compliance, the analysts were advised to find the reason (e.g., peak traffic condition as inferred from the time stamp, inaccurate prediction of travel condition by the system if it was possible to make this inference, or no reason found).
The results of GLOSA compliance for the eco-drive project are illustrated in Figure 5. At the city level, over 2,354 intersections were studied and results are generally consistent with the corridor-level study findings that were based on 303 GLOSA recommendations. The through and right-turn movement compliance for vehicles is reasonable at the average rate of about 67.9% in real-life driving conditions at the city level. It should be noted that if the vehicle encountered the “green wave” of the traffic control system, there was no need to alter travel speed. Further, this would be indicative of well-timed signals to ensure smooth traffic flow.
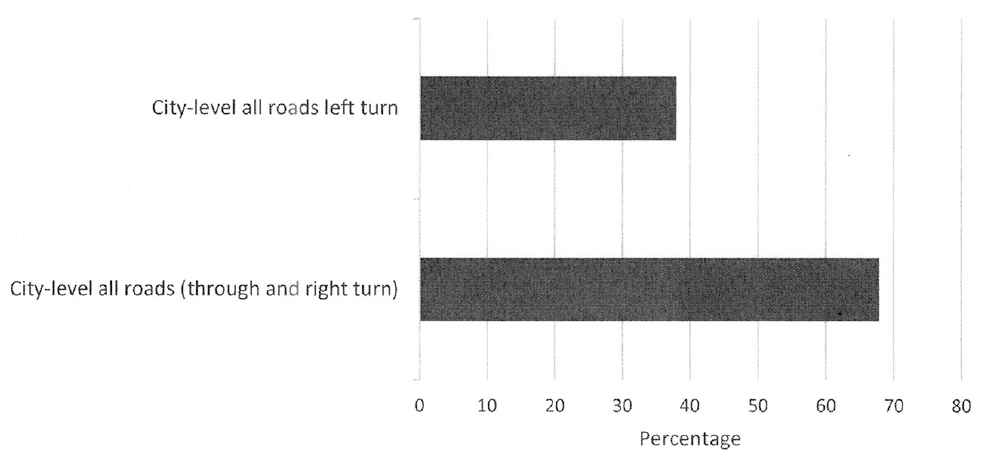
Percentage compliance with GLOSA (city-level results).
As expected, the compliance rate for left-turn movement was lower than for straight and through movements because of perception of risk in left-turn movement and use of protected left-turn phases. In addition, peak-period traffic delays/congestion caused non-compliance. At the city level, peak-period traffic flow was found to be responsible for non-compliance at 232 intersections out of over 2,354 intersections. However, under low to moderate traffic conditions and in the absence of lane blockages caused by traffic incidents or roadworks, the driver was able to use available gaps in traffic and, if necessary, change lanes to effectively use green time. On the other hand, under heavy traffic conditions, the freedom to maneuver was highly constrained and, therefore, the driver of the equipped vehicle had no choice but to follow the traffic.
The quantitative data indicate that drivers benefited from the information and advice displayed by the eco-drive IVU. Given that the drivers of equipped vehicles were constrained in modifying their driving trajectory in the presence of even moderate traffic volumes, the eco-drive system is effective to the extent that was expected.
Reduction in Fuel Consumption and GHG Emissions Attributable to GLOSA
Before describing these results, two fuel consumption measures are defined. Also, it is useful to note at the outset that liters of fuel are reported in gasoline-equivalent terms for calculating fuel consumption rates. The first measure of fuel consumption is the liters of fuel consumed per hour (L/h). This is obtained from the on-board diagnostics (OBD) and includes driving and idling fuel consumed as the vehicle goes through the acceleration, cruise, deceleration, and idling parts of the driving cycle. The liters of fuel consumed per 100 km is computed from the per-second OBD outputs of travel time, liters of fuel consumed per hour, and speed (km/h).
For an appreciation of differences between liters of fuel consumed per hour and liters of fuel consumed per 100 km, it is useful to view the relationship of average speed and fuel consumption. Figure 6 illustrates the relationship of liters of fuel consumed per hour and speed for the travel trajectories of seven vehicles during Week 1 of the field study when GLOSA was not visible to the driver. The results show that as the average operating speed increases, average fuel consumption rises. On the other hand, an examination of Figure 6 shows that liters of fuel consumed per 100 km drops as the speed increases. This is because increasing speed enables greater distance to be covered and, therefore, the liters of fuel consumed per 100 km shows a reduction. Both measures of average fuel consumption are valid.
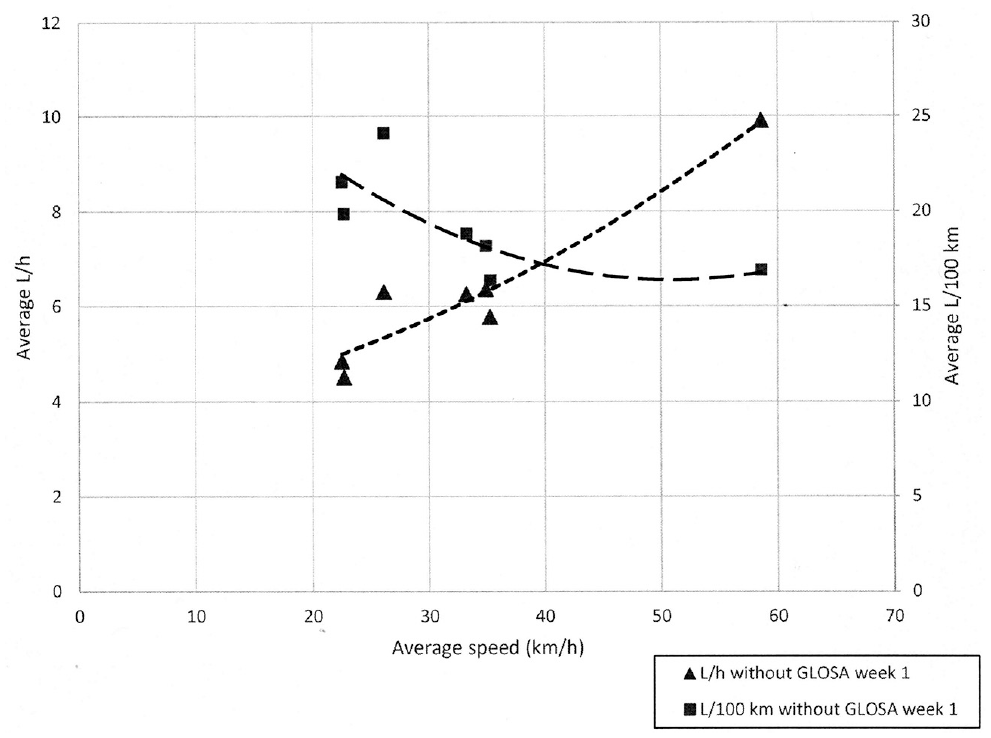
Change in fuel consumption rates (average liters per hour and liters per 100 km) owing to change in average speed (all vehicles) in Week 1.
The effect of eco-drive technology on fuel consumption varied significantly when viewed on an individual vehicle basis. However, reasonable percentage improvement results were obtained when considering all seven vehicles used in the eco-drive city-level study, based on average liters of fuel consumed per hour and liters of fuel consumed per 100 km.
The vehicles used for data analysis were Chevy or Ford gasoline pickup trucks (ranging from 4.3 L to 6.2 L), along with one Mercedes Sprinter Van (3.0 L turbo diesel) and each vehicle was driven by the same driver throughout the project. Four “inspector” vehicles operated daily within specific zones of the city (outer core or suburbs) and the remaining three “installer” vehicles operated throughout the city in different areas daily.
For all seven vehicles traveling on all road types, there was an average of 7.6% reduction in liters per hour fuel consumption and 7.8% reduction in liters per 100 km. The average reduction in fuel consumption for travel on arterial roads amounted to 7.8% for liters per hour and 6.8% for liters per 100 km. The average reduction in fuel consumption for travel on collector roads was 28.1% for liters per hour and 16.5% for liters per 100 km.
Figure 7, based on city-level study results, illustrates reduction in fuel consumption as a result of GLOSA. The likely reason for greater effectiveness of GLOSA on collector roads compared with arterial roads is the absence of traffic congestion. The lower traffic volumes on collector roads enable more speed adjustments by the driver to benefit from GLOSA. The signal timing and phase lengths may also play a role, given that longer arterial phases may dampen the role of GLOSA for arterial versus collector roads.
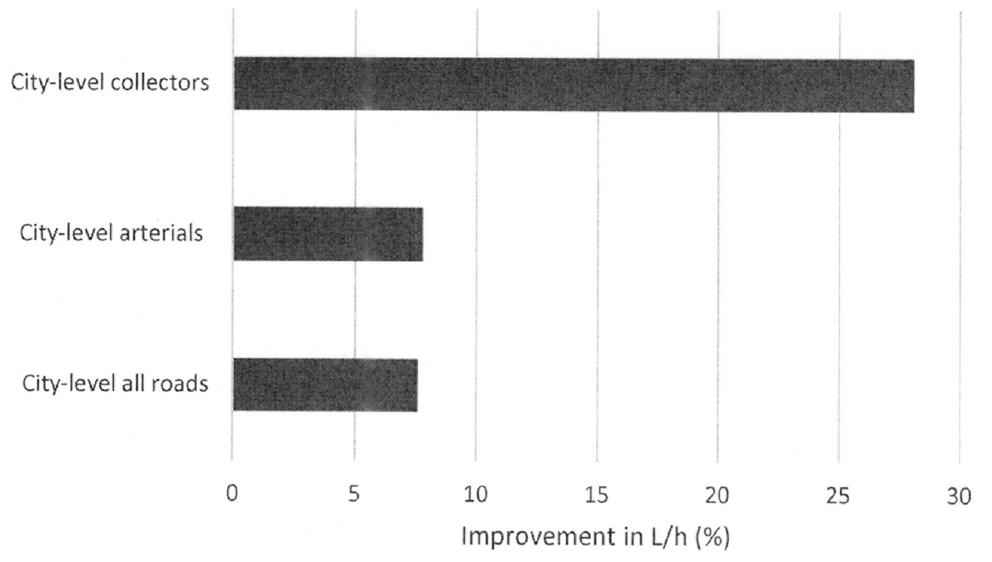
Reduction in fuel consumption.
The above-mentioned results are in general supported by the 9.4% improvement in an instrumented van’s fuel consumption found with the application of the U.S. Environmental Protection Agency’s (EPA) motor vehicle emission simulator model in the previous corridor-level project ( 18 , 19 ). In the previous corridor-level project, the percentage improvement for freight vehicles and passenger van was just under 10% ( 18 , 19 ).
The eco-drive analysis that generated the 7.6% savings was focused on only driving periods where GLOSA could be generated. When the City of Ottawa performed a high-level analysis using all data collected from the test vehicles during a full day of travel, the results showed a 5% savings overall. Therefore, it was decided that 5% would be a reasonable number to use when assessing the overall effectiveness of the technology on an overall fleet level ( 17 ).
Another reason for this lower percentage improvement is the human factor that not all drivers may act according to the eco-drive advice. However, the anonymous survey of drivers showed that although they were positive toward the use of technology, some did not show very high levels of enthusiasm.
Given that this project was not a simulation study, the base driving condition could not be controlled and held constant for the investigation of GLOSA effect. However, the field data collection period was selected as May to June 2019 to benefit from the generally uniform driving environment to the extent possible.
External factors can certainly play a role in influencing the results of data collection in the real-world environment. Random and isolated factors such as congestion and traffic incidents can be partially excluded by the large volume of data collected over many weeks for the overall analysis. Although they may influence results over an hour or an afternoon, there was an equal chance for such events to occur in any/all weeks of the study.
The analysts considered a potential effect of data collection in different weeks on the results, but an effect was assessed to be very low. The analysis conducted consisted of both a detailed analysis of travel by each vehicle across two different weeks (baseline versus eco-driving) and an overall analysis of all data collected over the project. The detailed analysis did not find any extended periods of slow-moving travel and it also filtered out any periods of idling that exceeded 90 s, both of which would be indicative of traffic congestion, incidents being encountered by the vehicle, or both.
Additionally, four of the participants exclusively operated in different pre-defined areas of the city and the remaining three participants were rovers that traveled throughout the city, so a particular incident may affect one participant but not all simultaneously. Other factors like weather conditions and air temperature were monitored to consider the possible impact of air conditioner use increasing fuel consumption, but no significant difference in conditions occurred during the project.
As GHG emission rates have a direct relationship with fuel consumption rates, improvement in fuel consumption also applies to GHG emission reduction in CO2 equivalent terms. Reduction in fuel consumption reduces GHG emissions and saves vehicle-operating cost. As explained in the following section, there is sufficient evidence that the eco-drive system results in achieving these environmental and economic benefits.
Environmental and Economic Benefits
A 5% improvement in fuel consumption caused by the eco-drive technology is likely to result in a corresponding saving of fuel cost and a reduction of GHG emissions. Although saving of fuel applies to private sector organizations as well as public sector entities, this paper provides estimates of economic and environmental benefits for a public sector organization, such as the City of Ottawa, that relies on fleets of light duty vehicles (LDVs) and heavy duty vehicles (HDVs) for providing mandated services.
Table 2 shows that the eco-drive technology has the potential to save 0.48 L/h for a light duty or lower-power heavy duty pickup truck (based on the average result for a fleet of seven vehicles). The fuel saving of 0.48 L/h is based on 7.6% improvement in fuel consumption. However, for reasons noted earlier, a 5% reduction in fuel consumption is used in the following computations of fuel cost saving and reduction of GHG emissions. Starting with 6.28 L/h under no GLOSA operation, a 5% reduction results in 0.3 L/h fuel saving for a fleet of LDVs vehicles. On the assumption that a fleet of such vehicles can benefit from GLOSA for an average of 2 h per day and 225 days per year, the fuel savings can be estimated.
Average Effectiveness of Eco-Drive Technology: All Participating Vehicles under Normal Traffic Conditions
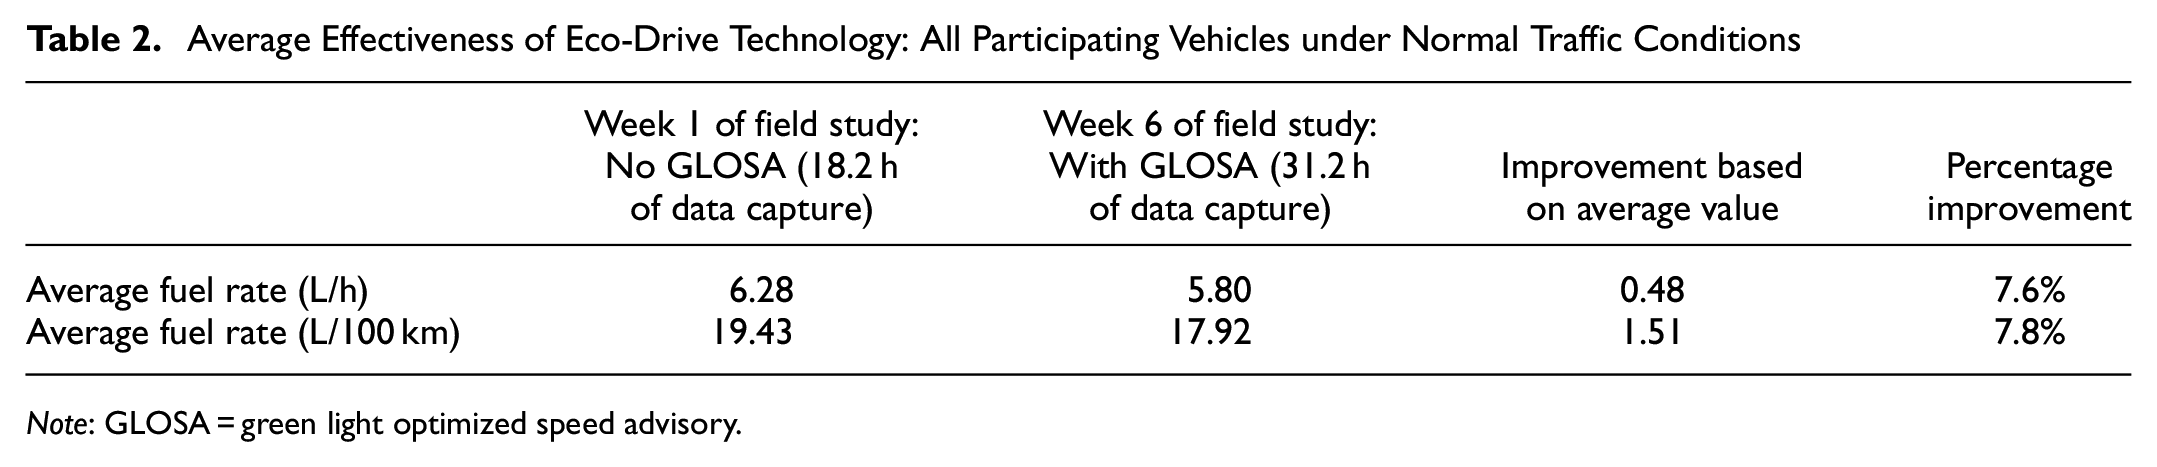
Note: GLOSA = green light optimized speed advisory.
The time period of 2 h was used as an estimate of the average number of hours fleet vehicles are typically in use and being driven on city streets where GLOSA is available. Applying the 5% reduction to the total annual fuel consumption is an alternative method but can overstate the total savings, given that it would include highway travel and vehicle idling that is not driving related.
Table 3 presents estimates of fuel savings for fleets of LDVs (i.e., gasoline and diesel LDVs), light duty diesel trucks (LDDTs), and heavy duty diesel vehicles (HDDVs). In the calculations, the following fall 2019 typical fuel prices in Ottawa are used: gasoline $1.07/L, diesel $1.20/L. The fuel cost savings are $137,900/year for the LDV fleet and $421,200/year for LDDT and HDDV fleets.
Estimates of Fuel Saving Caused by Eco-Drive Technology by Vehicle Type
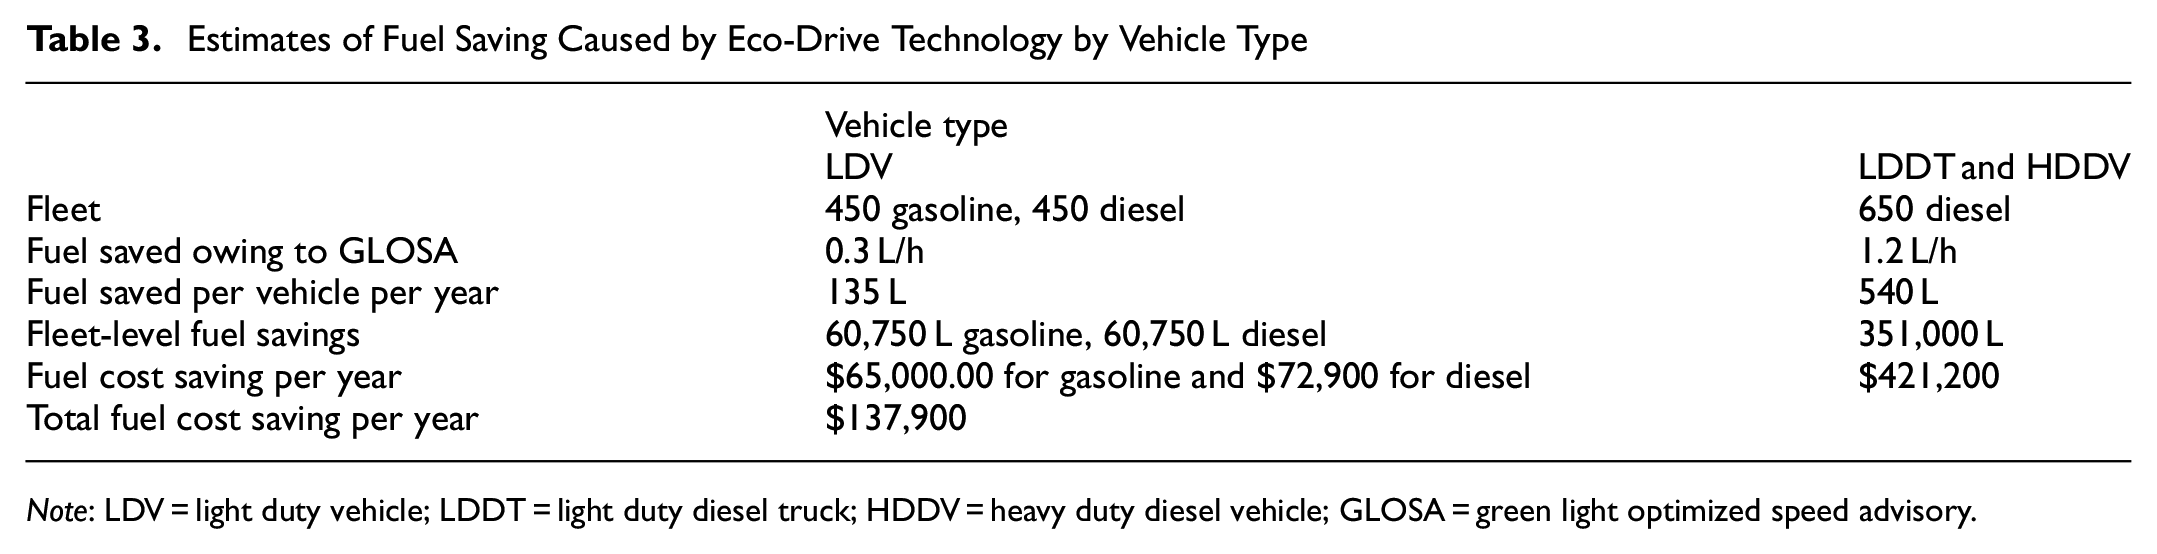
Note: LDV = light duty vehicle; LDDT = light duty diesel truck; HDDV = heavy duty diesel vehicle; GLOSA = green light optimized speed advisory.
The 5% fuel reduction effect of eco-drive technology can be applied to LDDTs as well as HDDVs. An organization such as the City of Ottawa can potentially use a fleet of 650 such vehicles exhibiting various sizes and functional capabilities. Some are diesel trucks similar to those used by courier companies in urban areas and others may resemble full-sized dump trucks such as those used for plowing snow. Based on the previous corridor-level study results, a courier truck consumes 9.005 L/h (operating at the average speed of 26.5 km/h). On the other hand, a heavy truck uses 38.53 L/h when operating in urban areas at an average speed of 35.6 km/h ( 17 , 19 ). On the assumption that the fleet of 650 HDVs consists of equal number of vehicles with the above-noted fuel consumption characteristics, the average value of 23.8 L/h is applied to the entire fleet. The fuel saved at 5% GLOSA effect amounts to 1.2 L/h.
The HDVs are used for various tasks throughout the year. Although snow plowing is a winter activity, the intense use of snow plows in winter and other applications during snow-free months can result, on average, in a usage level similar to other trucks in the fleet. In this study, it is assumed the HDVs are used for 225 days per year on average and that the GLOSA benefit can be availed for an average of 2 h/day. Table 3 presents results of fuel savings per year. As noted earlier, $1.20/L for diesel fuel is used for calculations. The fuel cost saving for the HDV fleet amounts to $421,200. The total saving in fuel cost for the LDV plus HDV fleet is $559,100/year.
The estimated fuel saved per year owing to eco-drive technology presented in Table 3 is converted into GHG emission reduction with the application of emission factors sourced from EPA ( 20 ) and the Environment and Climate Change Canada’s National Inventory Report ( 21 ) (Table 4). On the basis of estimated reduction in fuel consumption presented in Table 3 and selected emission factors noted in Table 4, GHG reductions were computed and results are presented in Table 5. The total GHG reduction amounts to 1,269,549 kg/year.
Emission Factors
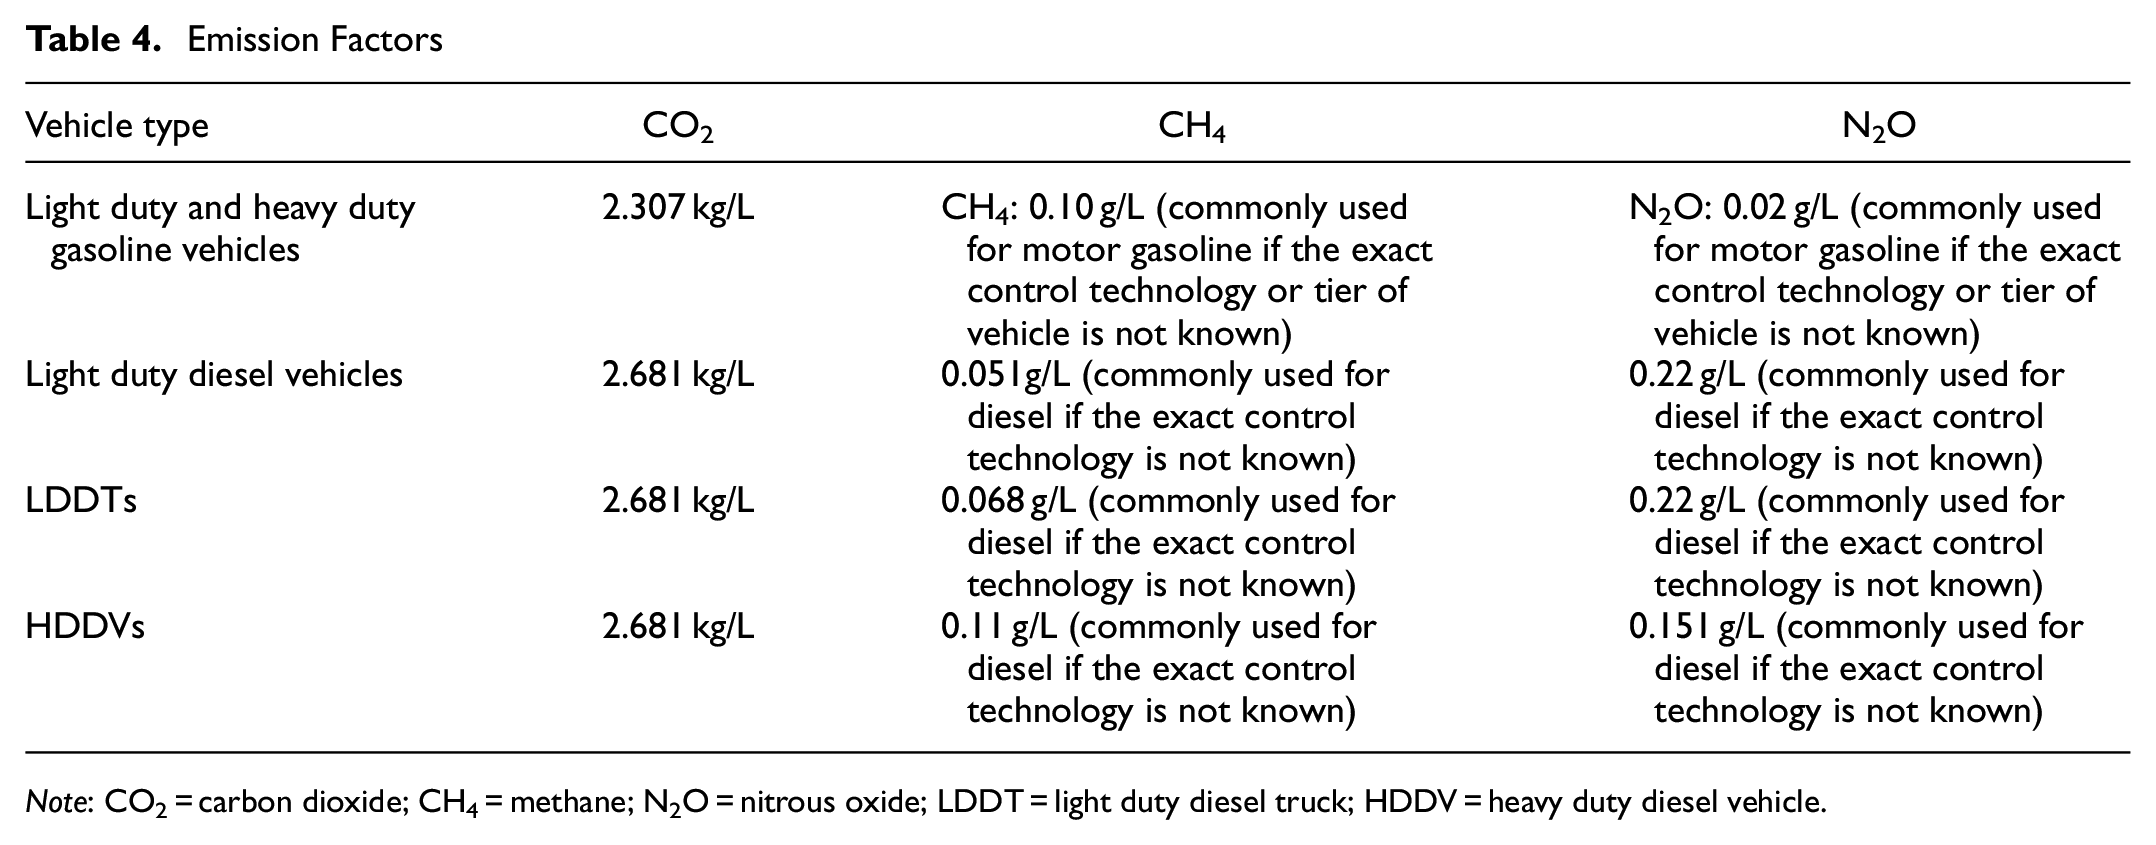
Note: CO2 = carbon dioxide; CH4 = methane; N2O = nitrous oxide; LDDT = light duty diesel truck; HDDV = heavy duty diesel vehicle.
Estimation of Greenhouse Gas Emission Reduction Caused by Eco-Drive Technology
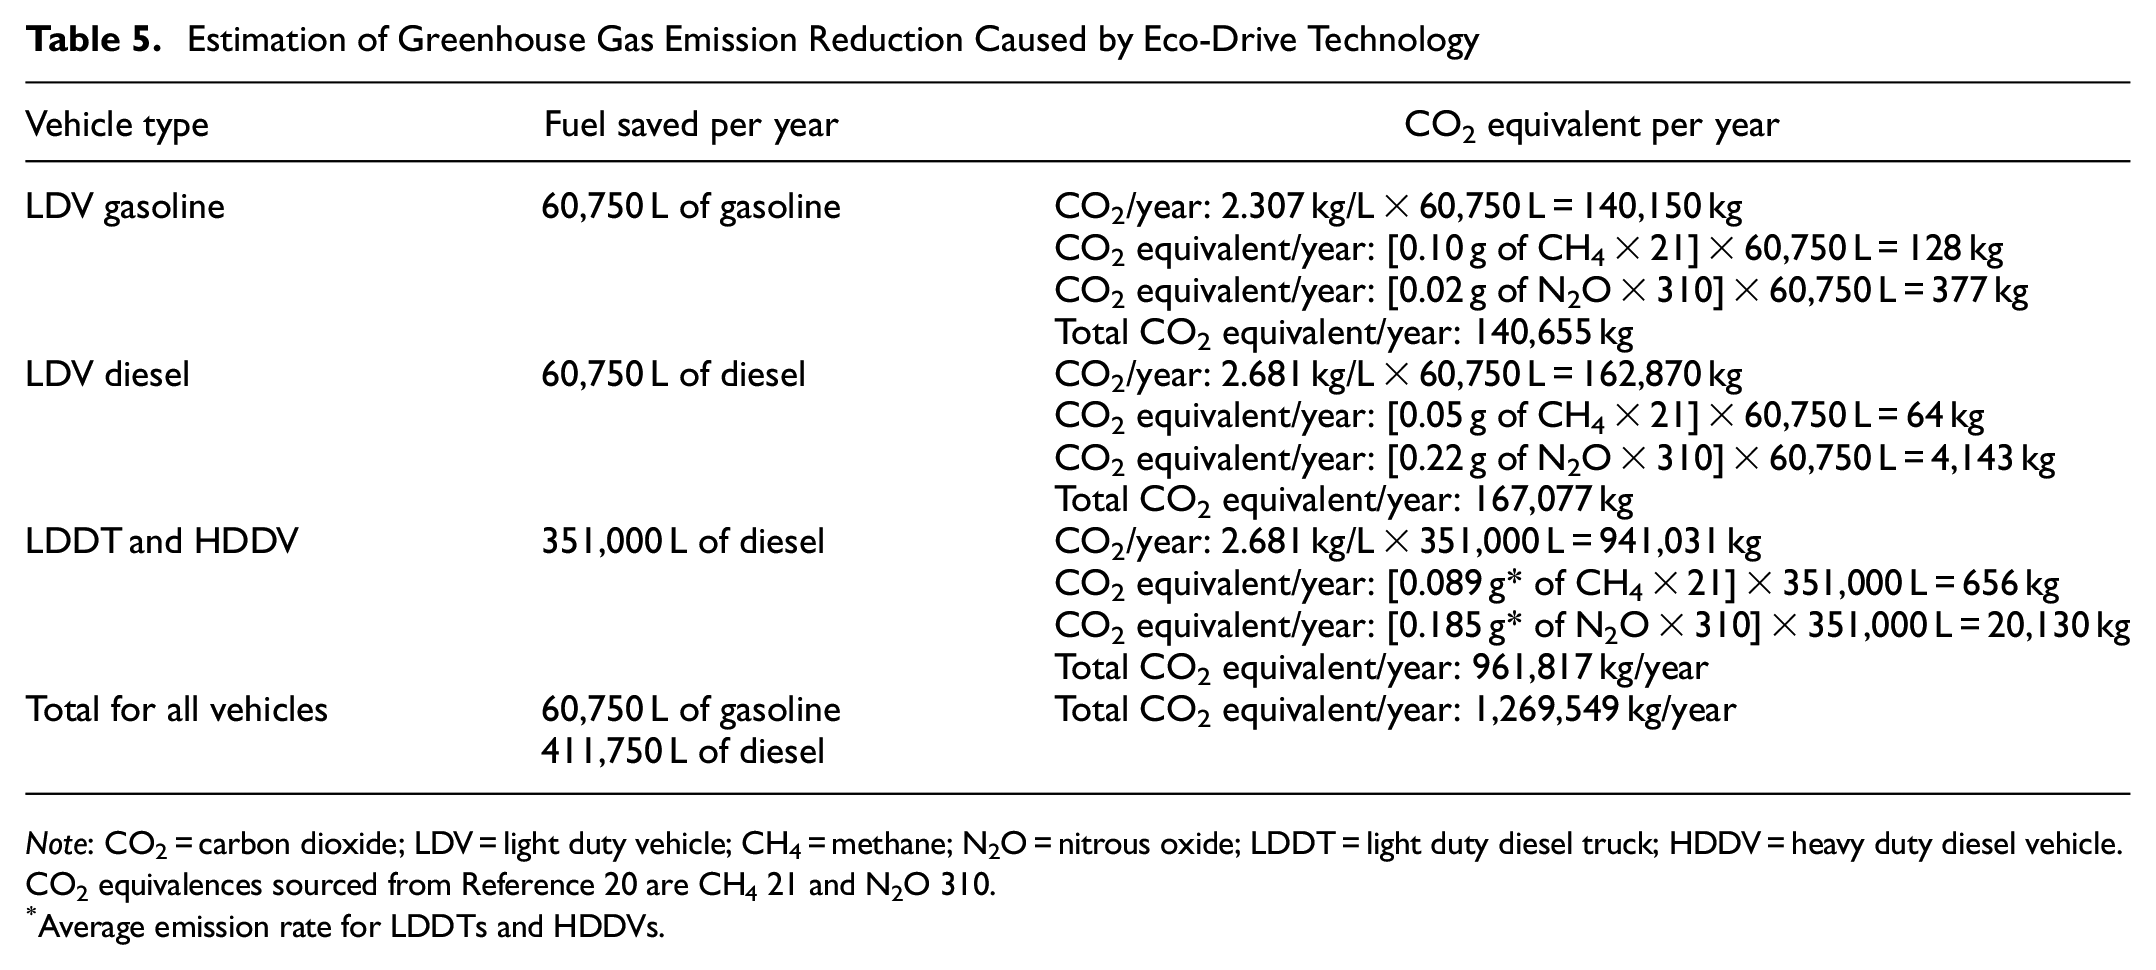
Note: CO2 = carbon dioxide; LDV = light duty vehicle; CH4 = methane; N2O = nitrous oxide; LDDT = light duty diesel truck; HDDV = heavy duty diesel vehicle.
CO2 equivalences sourced from Reference 20 are CH4 21 and N2O 310.
Average emission rate for LDDTs and HDDVs.
Conclusions
A large-scale project in Ottawa (Ontario, Canada) at the city level, investigated the acceptance of GLOSA and consequent reduction in fuel consumption and GHG emissions. The following observations are based on analysis of actual data obtained from field studies.
The empirical analysis of GLOSA compliance data and driver perception study results are favorable for user acceptance of GLOSA and these have general mutual consistency. In addition, these human factor results are consistent with traffic conditions under which driving took place.
Given the effect of prevailing traffic conditions and those of non-equipped vehicles in the traffic stream, the GLOSA compliance of over 65% is an indication of driver acceptance of eco-drive technology.
Based on results, a 7.6% reduction in fuel consumption and CO2 equivalent can be expected from GLOSA. However, for several reasons noted in the paper, 5% is a reasonable number to use when considering uncertainties in all daily vehicle travel. The results of this project can be used for cost–benefit evaluation of GLOSA technology implementation. Also, simulation-based research projects can verify their findings with the real-world experience reported in this paper. Looking ahead, automation in driving has the potential to deliver greater environmental and economic benefits because of more precise and faster response to GLOSA updates than a human driver.
The results of simulation and online research studies reviewed in this paper can be verified with the findings of the large-scale real-world investigation reported in this paper. As noted in the section on the state of knowledge, available simulation and small-scale studies show a much greater level of effectiveness of the technology than large-scale real-world findings reported in this paper. However, these studies do acknowledge the dampening effect of high traffic densities on their results.
Footnotes
Author Contributions
The authors confirm contribution to the paper as follows: study conception and design: A. M. Khan, G. Kent, O. Choudhry; data collection: A. M. Khan, G. Kent, O. Choudhry; analysis and interpretation of results: A. M. Khan, G. Kent, O. Choudhry; draft manuscript preparation: A. M. Khan, G. Kent, O. Choudhry. All authors reviewed the results and approved the final version of the manuscript.
Declaration of Conflicting Interests
The author(s) declared no potential conflicts of interest with respect to the research, authorship, and/or publication of this article.
Funding
The author(s) disclosed receipt of the following financial support for the research, authorship, and/or publication of this article: The authors gratefully acknowledge the financial support received from Transport Canada, Ontario Ministry of Transportation, the City of Ottawa, and the Natural Sciences and Engineering Research Council of Canada.
The views expressed are those of the authors.