
Abstract
Many transit agencies are considering or implementing bus network redesigns. Considering this growing trend, this study investigates the preferences of local residents for a proposed bus network redesign in Chattanooga, Tennessee. The study uses survey data collected by the Chattanooga Area Regional Transportation Authority and its partners as part of a bus network redesign planning process. Using the survey data, three logit models are estimated to explore preferences between different bus network redesign philosophies, transit network improvements, and willingness to pay for proposed transit improvements and expansion. There are three main findings. First, respondents who ride the bus prefer access to more places over frequent bus service, whereas non-riders prefer more frequent transit service. Second, the models suggest that younger generations are more supportive of transit improvements than older age groups. Third, people living near bus routes and those with higher income levels are more willing to pay for proposed transit improvements. The findings of this study should inform transit agencies that are considering or are in the process of redesigning their bus networks.
Many transit agencies are considering or implementing bus network redesigns ( 1 ). City leaders are recognizing that bus network redesigns are currently one of the biggest trends in transit planning ( 2 ). Some reasons for the increase in bus network redesigns include outdated route layouts, decreased ridership, cost concerns, and decentralization of the regions being served ( 1 ). In many transit agencies, individual changes have been made to routes and schedules that have resulted in lower ridership and inefficiencies over time ( 3 ).
The redesign process has two key objectives that can conflict with each other under budget constraints: increasing coverage and increasing frequency. Jarrett Walker has popularized a debate between these two concepts, referring to them as the coverage goal and the ridership goal ( 4 ). Increasing coverage would allow for an expansion of bus routes that would give more residents in the region access to public transit, whereas increasing frequency would shorten passenger wait times by shortening headways on routes with more demand ( 4 ). Transit agencies often need to choose between these two goals since both are costly.
Many cities in the United States have implemented or started the process of implementing a network redesign, including Austin, Baltimore, Columbus, Dallas, Denver, Houston, Indianapolis, and Jacksonville ( 5 ). Several prior studies have explored different aspects of these network redesigns, such as objectives and motivations ( 1 , 5 ) and the impact of a network redesign on system ridership ( 6 – 9 ). However, few if any prior studies have focused on the preferences of local residents toward proposed redesigns, which can be beneficial during the planning process. In the light of this gap, the aim of this study is to evaluate preferences for a proposed bus network redesign using the city of Chattanooga, Tennessee as a case study.
The paper is organized as follows: first, a literature review is presented. Then, the objective is provided, followed by a description of the data and the methods. Next, the results and discussion are presented, followed by limitations and areas for future research. The final section discusses the conclusions.
Literature Review
This section discusses previous literature related to bus network redesigns. First, a summary of Transit Cooperative Research Program (TCRP) Synthesis 140 on bus network redesigns is provided, since this is one of the most comprehensive studies to date about network redesigns. Next, studies related to the coverage concept are provided; the coverage concept is the redesign of a bus network in which a larger service area is desired, often resulting in longer headways because of budget constraints. Next, the ridership concept is explored in the past literature; the ridership concept is focused on higher frequencies while often limiting the size of the service area. Finally, a few additional studies are introduced on related topics that pertain to service hours and rider perceptions.
TCRP Synthesis 140 was published in 2019 and focuses on bus network redesigns ( 5 ). TCRP Synthesis 140 surveyed 36 transit agencies in 22 states, which is a different survey population from this study (transit agencies in the TCRP Synthesis versus local residents in this study). The transit agency survey included questions on overarching goals, agency organization, the decision-making process, redesign components, funding, implementation, and post-launch performance. The most common goals of system redesigns were to: improve rider satisfaction, provide better service to transit-dependent people, simplify the system, and improve reliability. Other goals included reducing travel times and increasing coverage. Public involvement, including workshops and surveys, was also noted as a crucial part of the redesign process. Of those transit agencies that have completed the redesign process, 88% (14 of 16) stated that increasing ridership was very important, and 87% (13 of 15) stated that implementing high frequency service was very important. A follow-up TCRP report further explored the details of bus network redesign by conducting interviews with representatives from agencies that have redesigned their bus network or are currently doing that. TCRP report 221 provides several resources to transit agencies for planning and implementing bus network redesigns ( 10 ).
Another prior study was conducted to evaluate a network redesign that focused on the coverage concept. In Tallahassee, Florida the numbers of stops were reduced in certain areas of the bus system while providing new routes to previously underserved areas; this resulted in an overall reduction of ridership even though ridership increased in previously underserved areas ( 8 ).
Other prior studies considered cities that implemented or proposed network redesigns that focused on the ridership concept and emphasized the importance of frequent service. A prior study of strategies used to conduct redesigns in Columbus, Ohio and Kansas City, Missouri found that these redesigns were focused around high frequency and consistent routes ( 1 ). In another study, also in Columbus, Ohio, bus routes were simplified and designed to have headways less than 15 min; however, it was unclear if accessibility was improved with the design changes ( 6 ). Yet another study found that routes with increased levels of service increased ridership in Melbourne, Australia ( 9 ). In Houston, Texas, a recent redesign increased access to frequent service routes by 18%; however, this was done without expanding the size of the system ( 7 ).
In addition to coverage versus ridership, several prior studies have evaluated other important topics that may be part of transit network redesigns. Span of service was mentioned in at least two studies. Using case studies, one of these studies found that many transit agencies have increased their weekday service hours to improve service ( 5 ). A previously mentioned study of Columbus, Ohio found that accessibility decreased for weekdays while it increased for weekends as a result of the redesign because service hours were similar for each day of the week ( 6 ). Another study in Tallahassee, Florida found that perception of service had a much stronger effect on ridership than actual service changes. In one area of Tallahassee, the perceived service changes were negative and ridership levels decreased, even though the quality of service improved ( 11 ).
These studies considered different aspects about bus network redesigns; however, to the best of the authors’ knowledge, there have been few, if any, prior studies that have evaluated the preferences of local residents toward proposed bus network redesigns, which is important in the transit planning process. This study begins to fill this gap in the literature.
Research Questions
This study aims to evaluate the preferences of local residents for a proposed bus network redesign in the city of Chattanooga, Tennessee. This will be done by posing the following research questions:
Do local residents have different preferences for the two different bus network philosophies? Do people prefer a coverage focused network that provides access to more places with lower bus frequencies, or do they prefer a ridership focused network that provides higher bus frequencies but with access to fewer places?
Which groups of residents want additional transit service?
Which groups of residents are willing to pay for transit service improvements?
Background
This study uses the city of Chattanooga, Tennessee as a case study. The city of Chattanooga is a mid-sized city that had a population of 177,365 in 2018 ( 12 ). The Chattanooga Area Regional Transportation Authority (CARTA), the transit provider in Chattanooga, Tennessee, is currently in the process of redesigning its bus networkin an initiative known as the CARTA ReDesign. This process aims to comprehensively rethink the bus system to better serve Chattanooga based on public and stakeholder input. The CARTA ReDesign effort is the result of a seven-year process to determine how to better serve the community. Beginning in 2013, CARTA embarked on a multimodal transit center study, which included a limited system evaluation and identification of public needs associated with a centralized transfer facility. While this process was completed in 2016, it concluded that a more comprehensive system redesign should predicate the development of a multimodal transit center. In the fall of 2017, a full-day workshop was hosted for approximately 100 key community stakeholders, which led to the creation of a report and subsequent commitment to the CARTA ReDesign effort ( 13 ). However, the final round of public engagement and the final approval of the CARTA ReDesign plan was recently delayed by the COVID-19 pandemic ( 13 ).
Data and Method
This section discusses the data and methodology. The first part describes the data collection efforts and the survey content. The second part discusses the discrete choice modeling framework.
Data Collection and Survey Content
This study uses survey data collected by CARTA as part of the CARTA ReDesign process. The primary survey instrument was deployed between July 2019 and August 2019. Surveys were available both online and in print in both English and Spanish. No incentives were offered to survey respondents. CARTA initially used convenience sampling to collect survey responses, which is common in the public participation process ( 14 ). CARTA used several distribution methods such as social media advertisements, website advertisements, and public meetings to recruit participants. Paper surveys were made available at public meetings. However, as expected, many respondents and stakeholder participants at public sessions tended to be higher income and not representative of CARTA’s ridership demographic. To mitigate this potential bias in responses, CARTA collected additional responses using purposive sampling ( 14 ). CARTA specifically held public meetings and survey collection sites in neighborhoods with higher ridership including predominately minority and lower-income neighborhoods. CARTA also engaged its ridership base directly at bus stops and collected surveys in the primary downtown corridor. The survey dataset used in analysis was provided by CARTA to the lead author, and it did not include any personally identifiable information.
Survey questions were jointly developed with input from CARTA staff and the consulting team at Jarrett Walker Associates. The survey content was divided into two parts. The first part of the survey included questions about preferences for the proposed bus network redesign and the second part asked several socioeconomic and travel behavior questions. The content of the survey is discussed in greater detail in the following subsections.
Survey Part 1: Bus Network Redesign Scenarios
In the first part of the survey, four different system redesign scenarios were presented to respondents, and they were asked three questions about their preferences. The first two scenarios, known as the coverage scenario and the ridership scenario, would not require additional funding. The other two scenarios, known as the growth scenario and the vision scenario, both require additional funding for transit. These scenarios and questions are discussed below.
In the first question, users were shown the coverage scenario and the ridership scenario, and then they were asked which one they prefer. Both of these scenarios allocate the current amount of service offered by CARTA in different ways, and they do not require additional funding. The coverage scenario provides access to more places but with lower frequency service and longer passenger waiting times, and it is shown in the map in Figure 1. This scenario would reduce job access and frequent service (defined as service every 15 min or less) by 1% and 4%, respectively, compared with the current network structure. Alternatively, the ridership scenario would provide higher frequency service with shorter passenger waiting times; however, it limits the service area and focuses on high productivity corridors, as shown in the map in Figure 2. The ridership scenario would increase job access and frequent service by 16% and 13%, respectively.
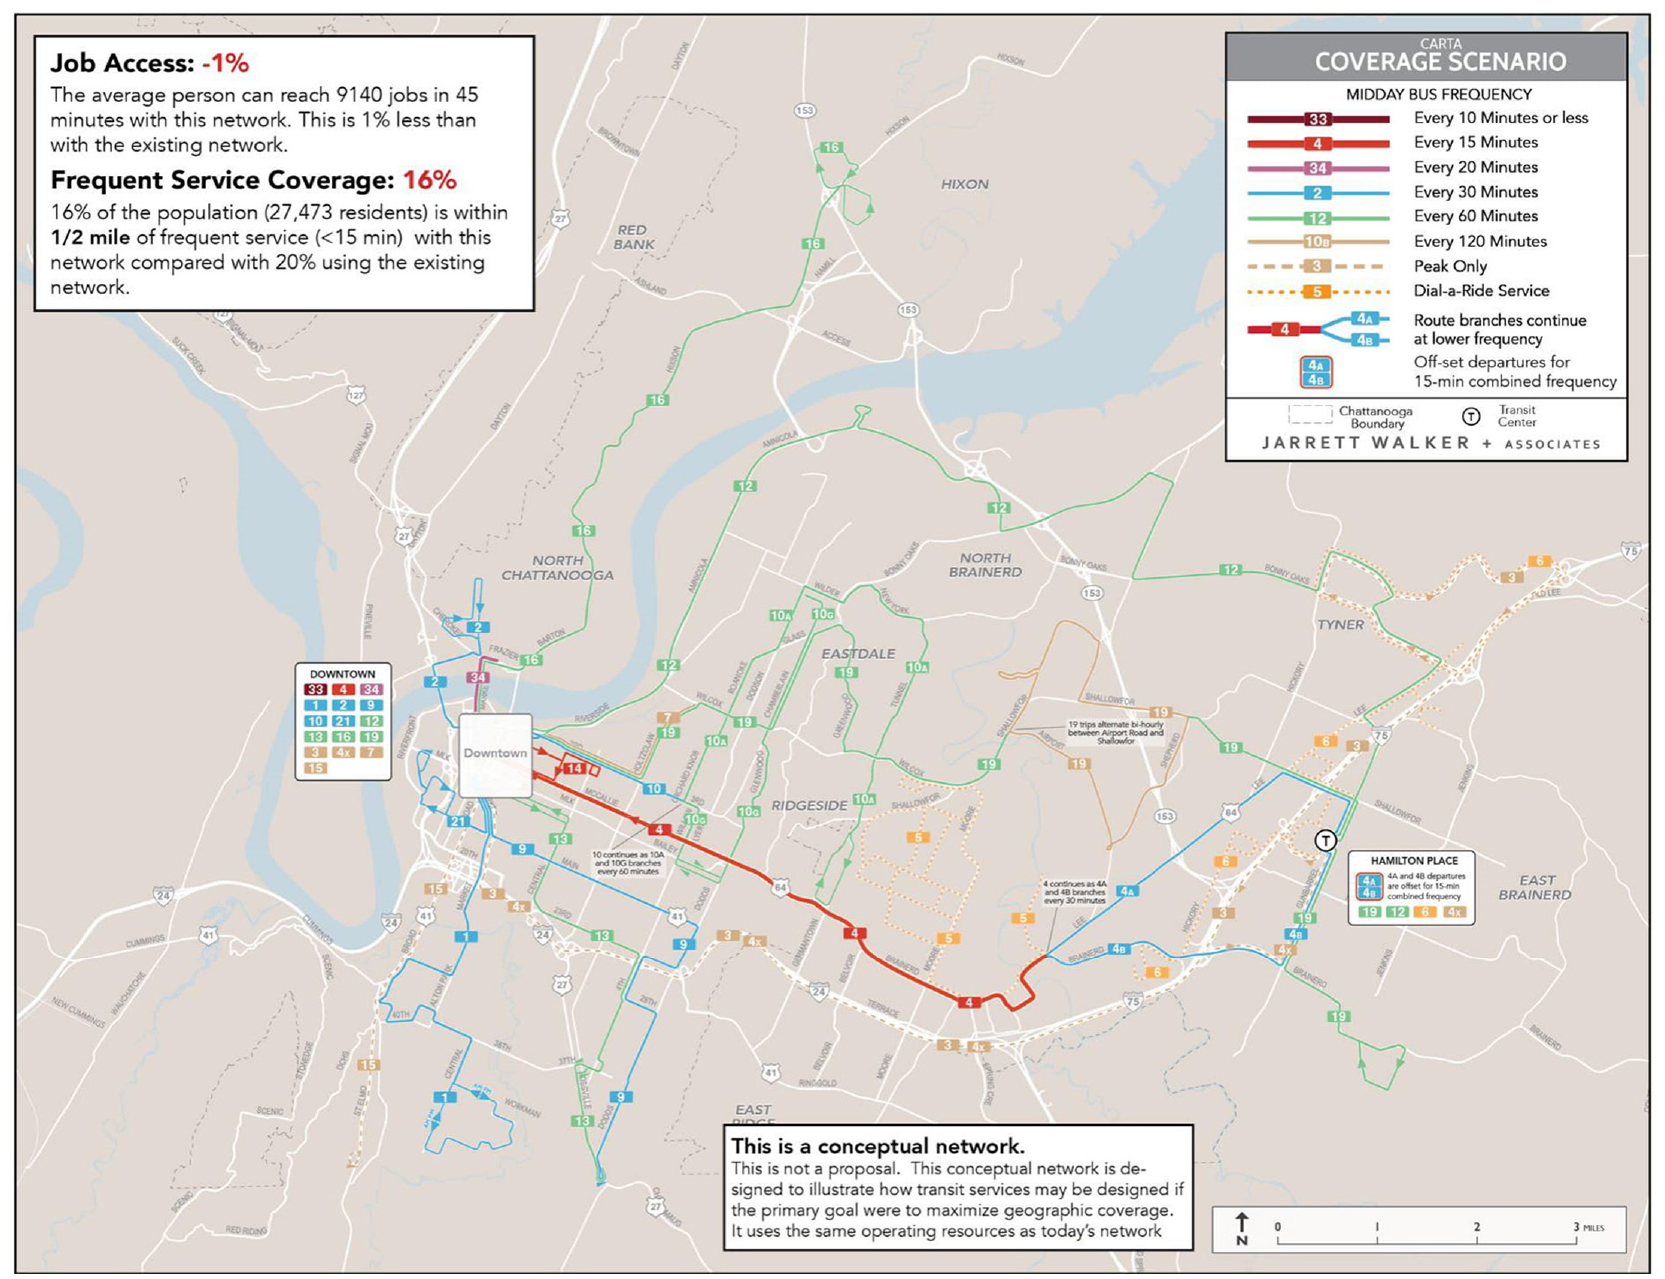
The coverage scenario as presented in Chattanooga Area Regional Transportation Authority’s (CARTA) survey ( 13 ).
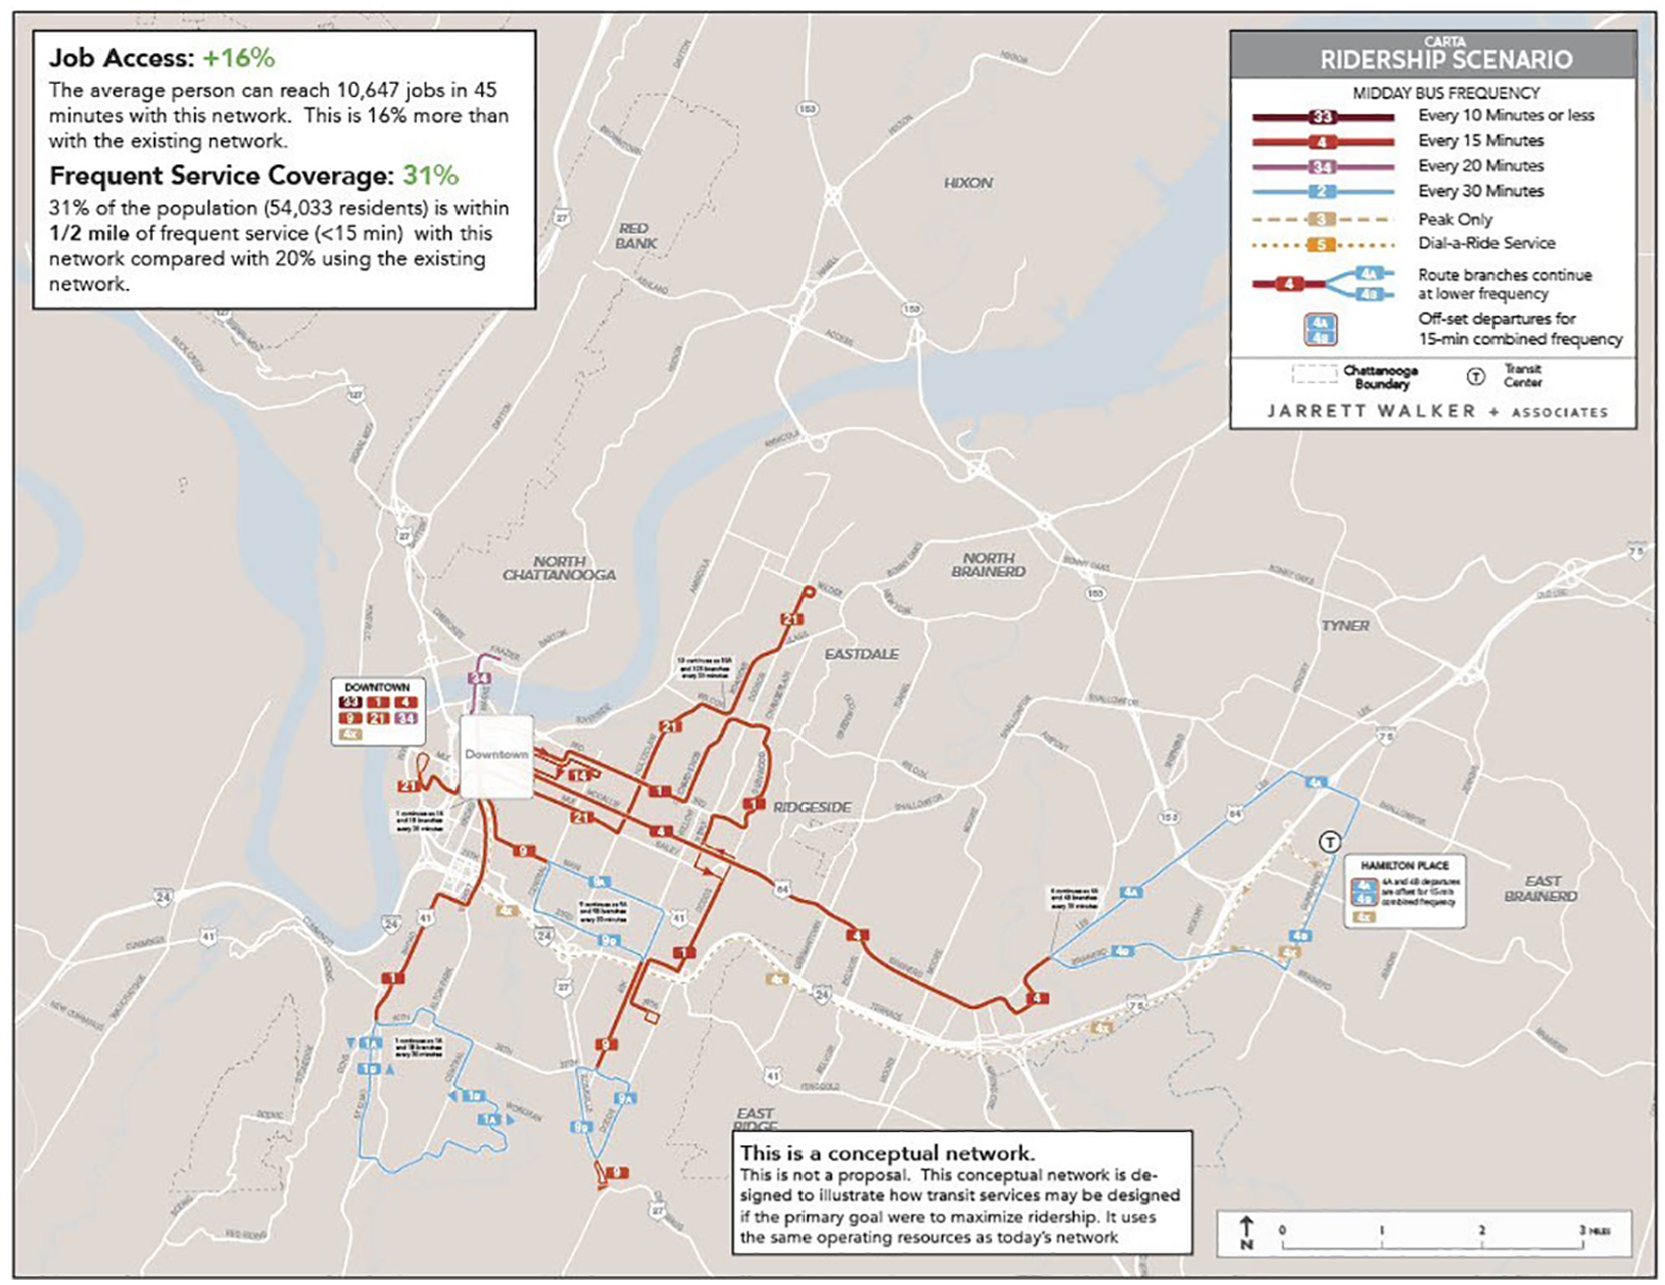
The ridership scenario as presented in Chattanooga Area Regional Transportation Authority’s (CARTA) survey ( 13 ).
In the next two questions, respondents were presented with the growth and vision scenarios shown in the maps in Figures 3 and 4. Both scenarios propose additional investment in the amount of transit service provided. The growth scenario proposes a 60% increase in transit service; this would result in an estimated 32% increase in job access via transit as well as an 8% increase in the number of people within 0.5 mi of frequent transit service. The vision scenario proposes a 130% increase in transit service as shown in Figure 4. The vision scenario would result in a 53% increase in job access via transit and a 15% increase in the number of people within 0.5 mi of frequent transit service.
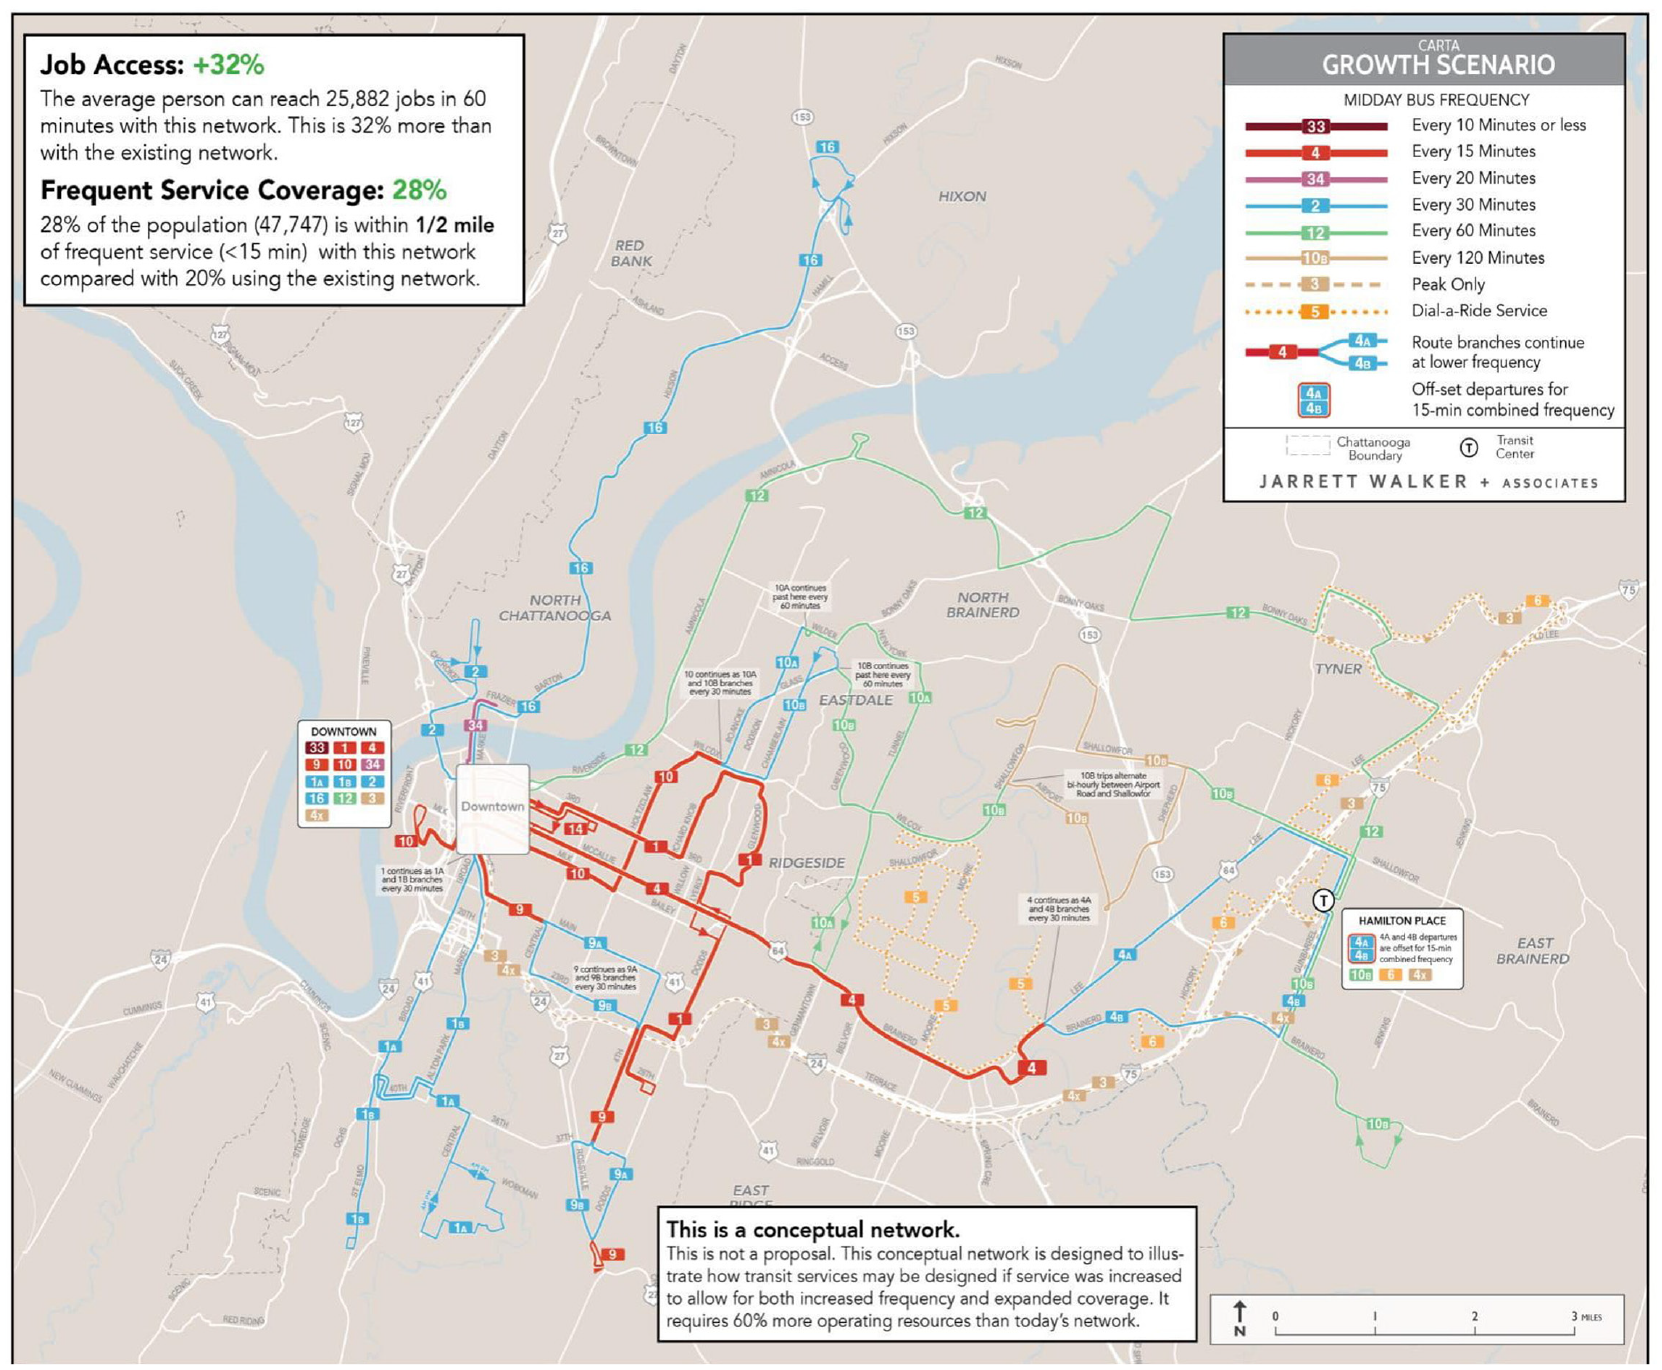
The growth scenario as presented in Chattanooga Area Regional Transportation Authority’s (CARTA) survey ( 13 ).
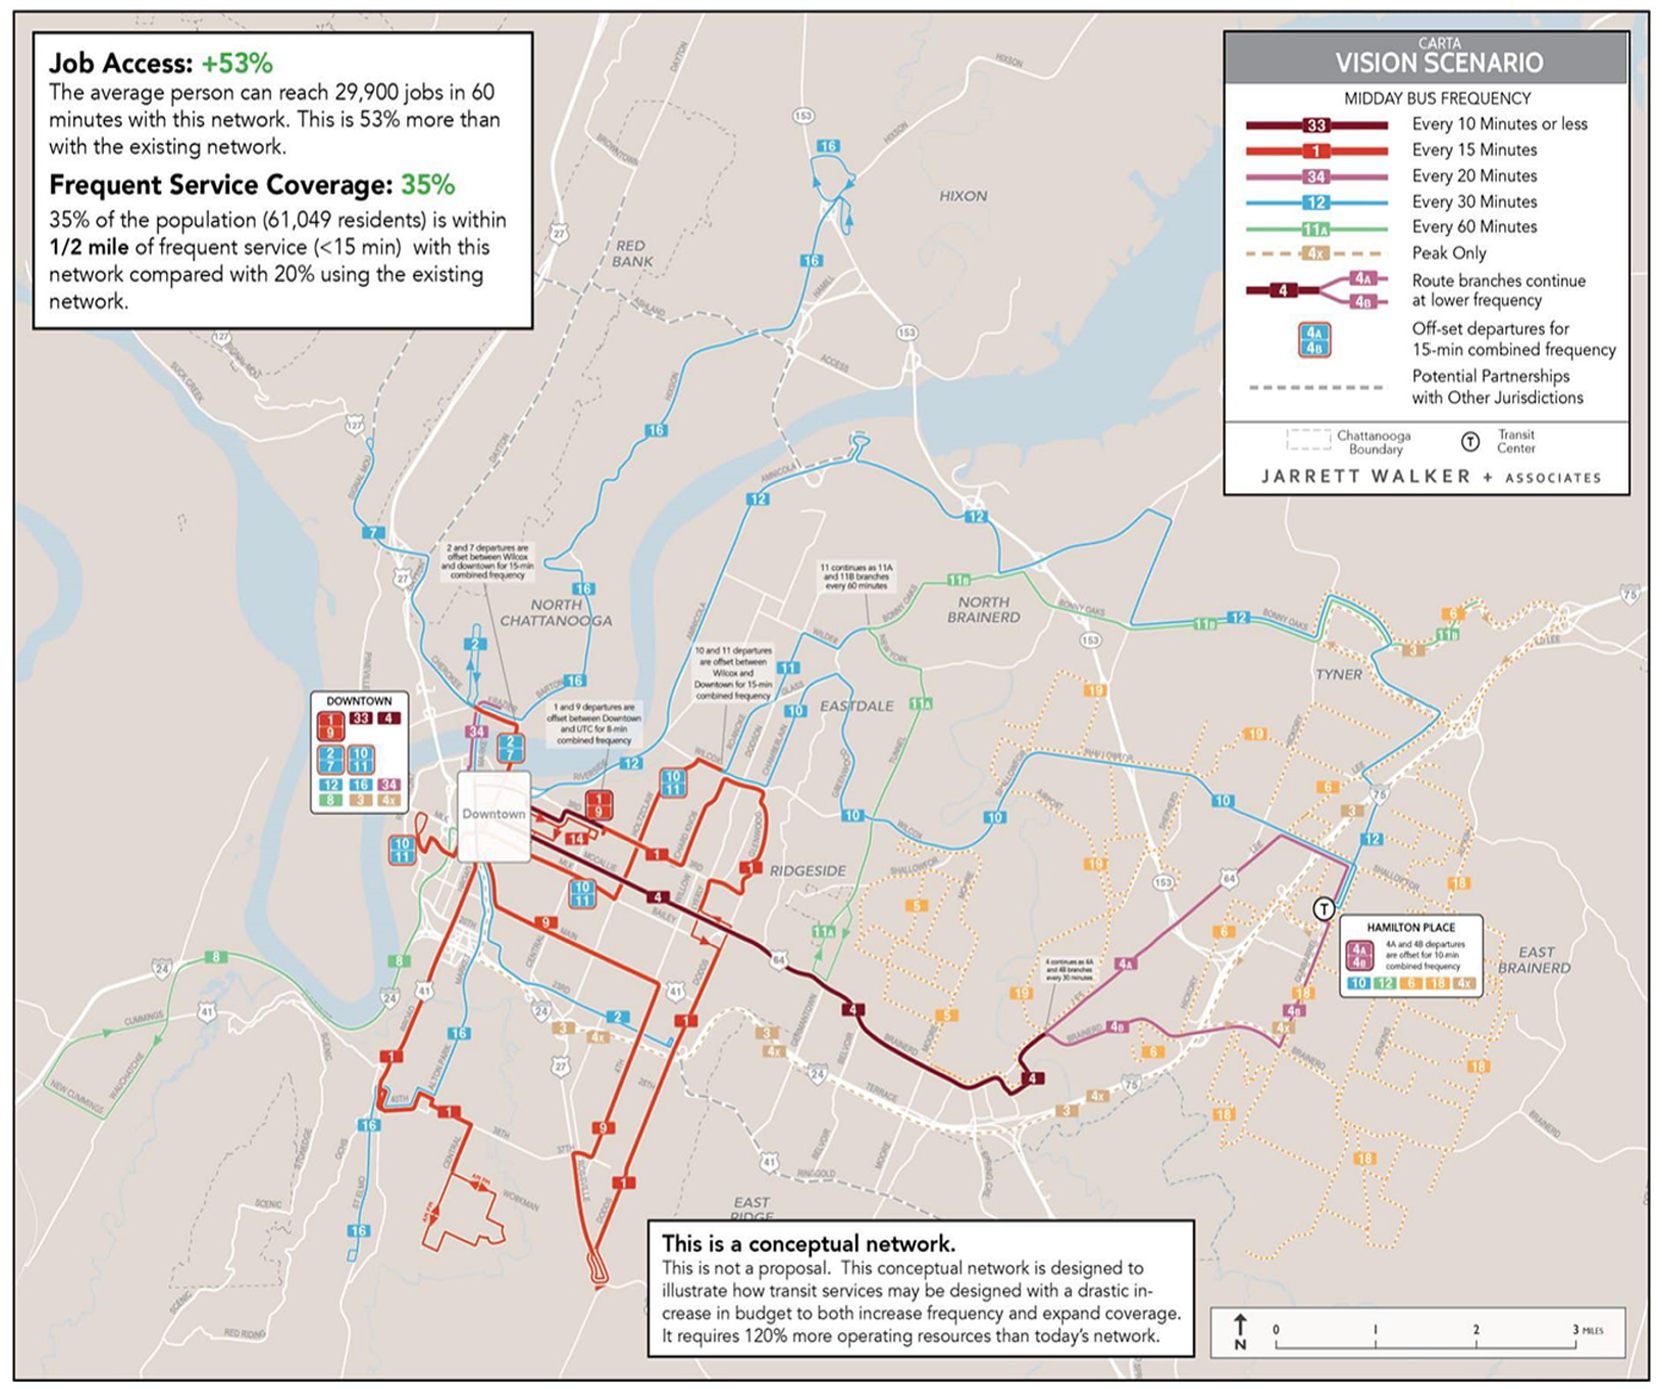
The vision scenario as presented in Chattanooga Area Regional Transportation Authority’s (CARTA) survey ( 13 ).
Next, respondents were asked two questions about the growth and the vision scenarios. The first question was: “Considering costs and benefits of these concept [sic], select an option below to tell us which one you prefer.” The survey respondents had the following options to select from:
I think the current transit service levels are fine (no increase in service or funding)
I want more transit service, but not as much as the Growth Concept (less than 60% increase)
I want the Growth Concept (about 60% more transit service)
I want more transit service than the Growth Concept, but less than the Vision Concept (60% to 130% increase)
I want the Vision Concept (about 130% more transit service)
I want more transit service than the Vision Concept (more than 130% increase)
The second question about the growth and the vision scenarios was about how much the respondents would be willing to pay per month to expand and improve Chattanooga’s transit network. The survey participants were asked: “How much on average per month would you be willing to pay to expand and improve Chattanooga’s transit network?” The following options were provided to survey participants to choose what they prefer:
None, I do not want to pay anything more to expand and improve transit in Chattanooga
$1 to $4 per month
$5 to $9 per month (enough for the Growth scenario)
$10 to $14 per month
$15 to $19 per month (enough for the Vision scenario)
$20 or more per month
Participants’ responses to these three questions are discussed in the results section.
Survey Part 2: Socioeconomic and Travel Behavior
The second part of the survey consisted of socioeconomic questions including gender, age, race, household size, number of household cars, and home zip code. The socioeconomic characteristics of the survey respondents were compared with the socioeconomic characteristics of Chattanooga residents, and the results are shown in Table 1. The socioeconomic characteristics of the city of Chattanooga residents were obtained from the 2018 five-year American Community Survey data from the United States Census Bureau ( 12 ). This comparison was performed to evaluate how representative the survey sample was compared with the residents of Chattanooga. As shown in Table 1, higher income levels and white residents are overrepresented in the survey compared with the general population in Chattanooga. One possible reason why high-income groups are overrepresented is that some survey respondents did not report their income. There were no significant differences between gender and car availability of the survey respondents and the general population.
Survey Respondents’ Socioeconomic Characteristics and Transit Usage
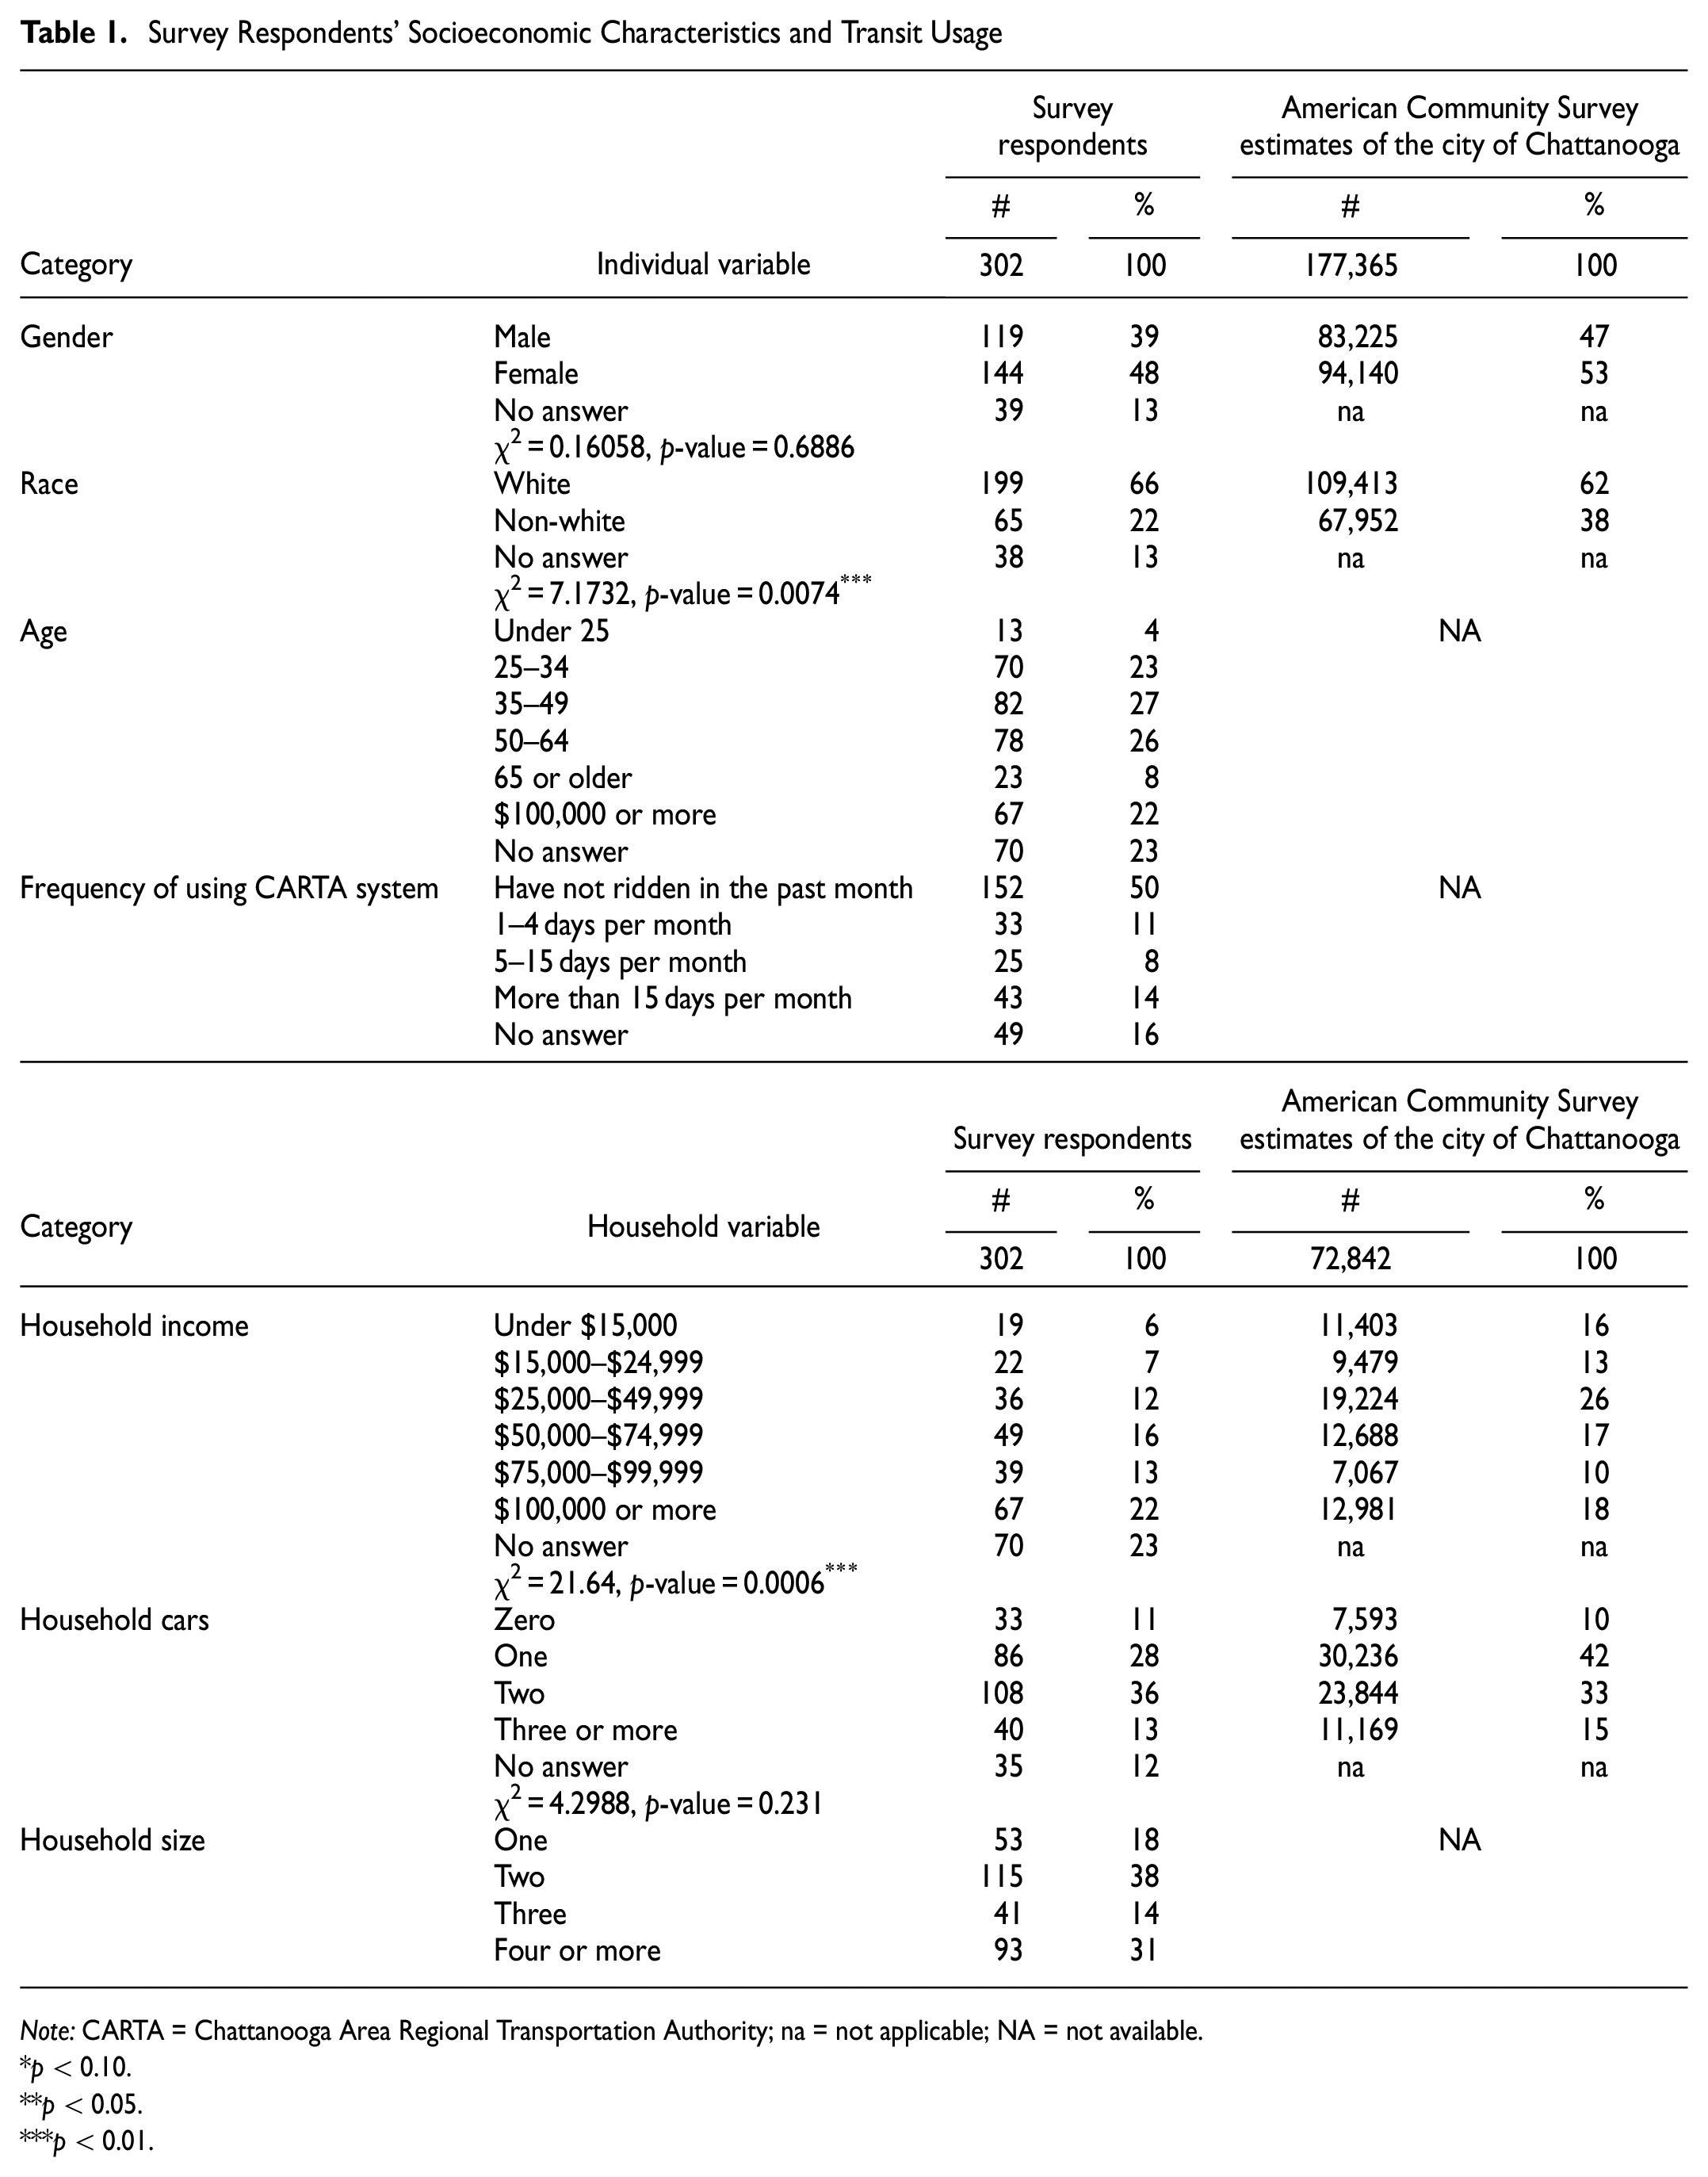
Note: CARTA = Chattanooga Area Regional Transportation Authority; na = not applicable; NA = not available.*p < 0.10.**p < 0.05.***p < 0.01.
Survey participants were also asked about their frequency of using the CARTA bus system. As shown in Table 1, about 33% of the survey respondents have ridden a CARTA bus at least once in the last month; however, 50% of the survey participants have not ridden in the past month. The rest of the participants did not answer this question. These percentages show that the survey has good representation of both bus riders and non-riders, which allows for comparison of the preferences between these two groups.
Finally, zip code was collected in the survey and used by the authors of this study to link respondents to various transportation measures, such as the number of nearby transit routes and the walk score. These measures can be used to evaluate how access to nearby transit services and walkability will affect preferences toward transit. The walk score was obtained from the Walk Score website ( 15 ) and the number of transit routes within 0.5 mi were obtained from the Center for Neighborhood Technology website ( 16 ).
Modeling Framework
This section discusses the discrete choice modeling approach used to explore the preferences of the residents of Chattanooga for a proposed bus network redesign. Three different logit models were estimated.
The first model was a binary logit model of respondents’ preferences between the coverage and the ridership scenarios. In this model, participants who responded, “I strongly prefer the coverage concept” or “I prefer the coverage concept” were considered as one group since both preferred the coverage scenario. Similarly, respondents who chose “I strongly prefer the ridership concept” or “I prefer the ridership concept” were considered as a second group since both preferred the ridership scenario. The coverage scenario was considered as the reference alternative in the choice model (set equal to zero). The binary logit model was estimated using Equation 1 where

Next, the preferred amount of transit service increase (collected in percentage form on the survey) and the willingness of respondents to pay (collected as a dollar amount per month) were converted to ordinal variables and used to estimate two additional logit models. These two models were estimated using ordered logit model as shown in Equation 2 ( 17 ).
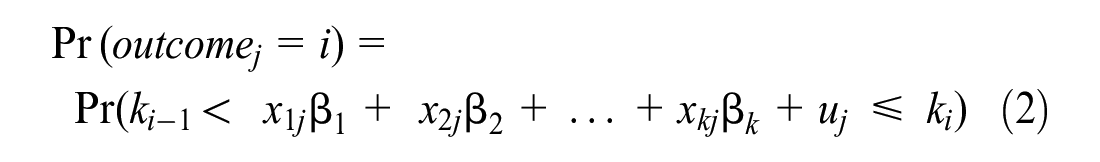
In this equation,
Results and Discussion
The results of this study are divided into two parts. The first part provides descriptive statistics of survey questions about preferences for the proposed bus network redesign and the second part presents the results of the logit analyses.
Descriptive Statistics
This section provides descriptive statistics from the survey and is divided into three parts. The first part discusses respondents’ preferences for the proposed ridership or coverage scenarios, as well as their preferences for potentially increasing transit service and their willingness to pay for the additional transit service. The second part of this section compares rider and non-rider preferences between the coverage and the ridership scenarios. The third part compares the amount of additional transit service respondents want compared with their willingness to pay for transit improvements.
Table 2 shows that 43% (129 of 302) of the participants stated that they prefer the coverage scenario (combined total of “strongly prefer” and “prefer”) while 57% (173 of 302) of the participants preferred the ridership scenario (combined total of “strongly prefer” and “prefer”). Table 2 also shows that only 7% of the survey respondents think the current amount of transit is adequate compared with about 86% desiring some increase in transit service. Furthermore, 47% of the respondents indicated that they want a transit service increase of 130% or more (combined total of “about 130%” and “more than 130%”). This high portion of respondents who want more service indicates that they are generally supportive of transit service expansion. Moreover, 80% of the respondents stated that they are willing to pay more each month to expand and improve transit service. This high percentage suggests that the majority of survey participants want more service, and they are willing to pay for transit improvements and expansion. Just 9% of the survey respondents stated that they are not willing to pay anything more to expand and improve transit in Chattanooga.
Survey Participants’ Responses to Questions about Network Redesign
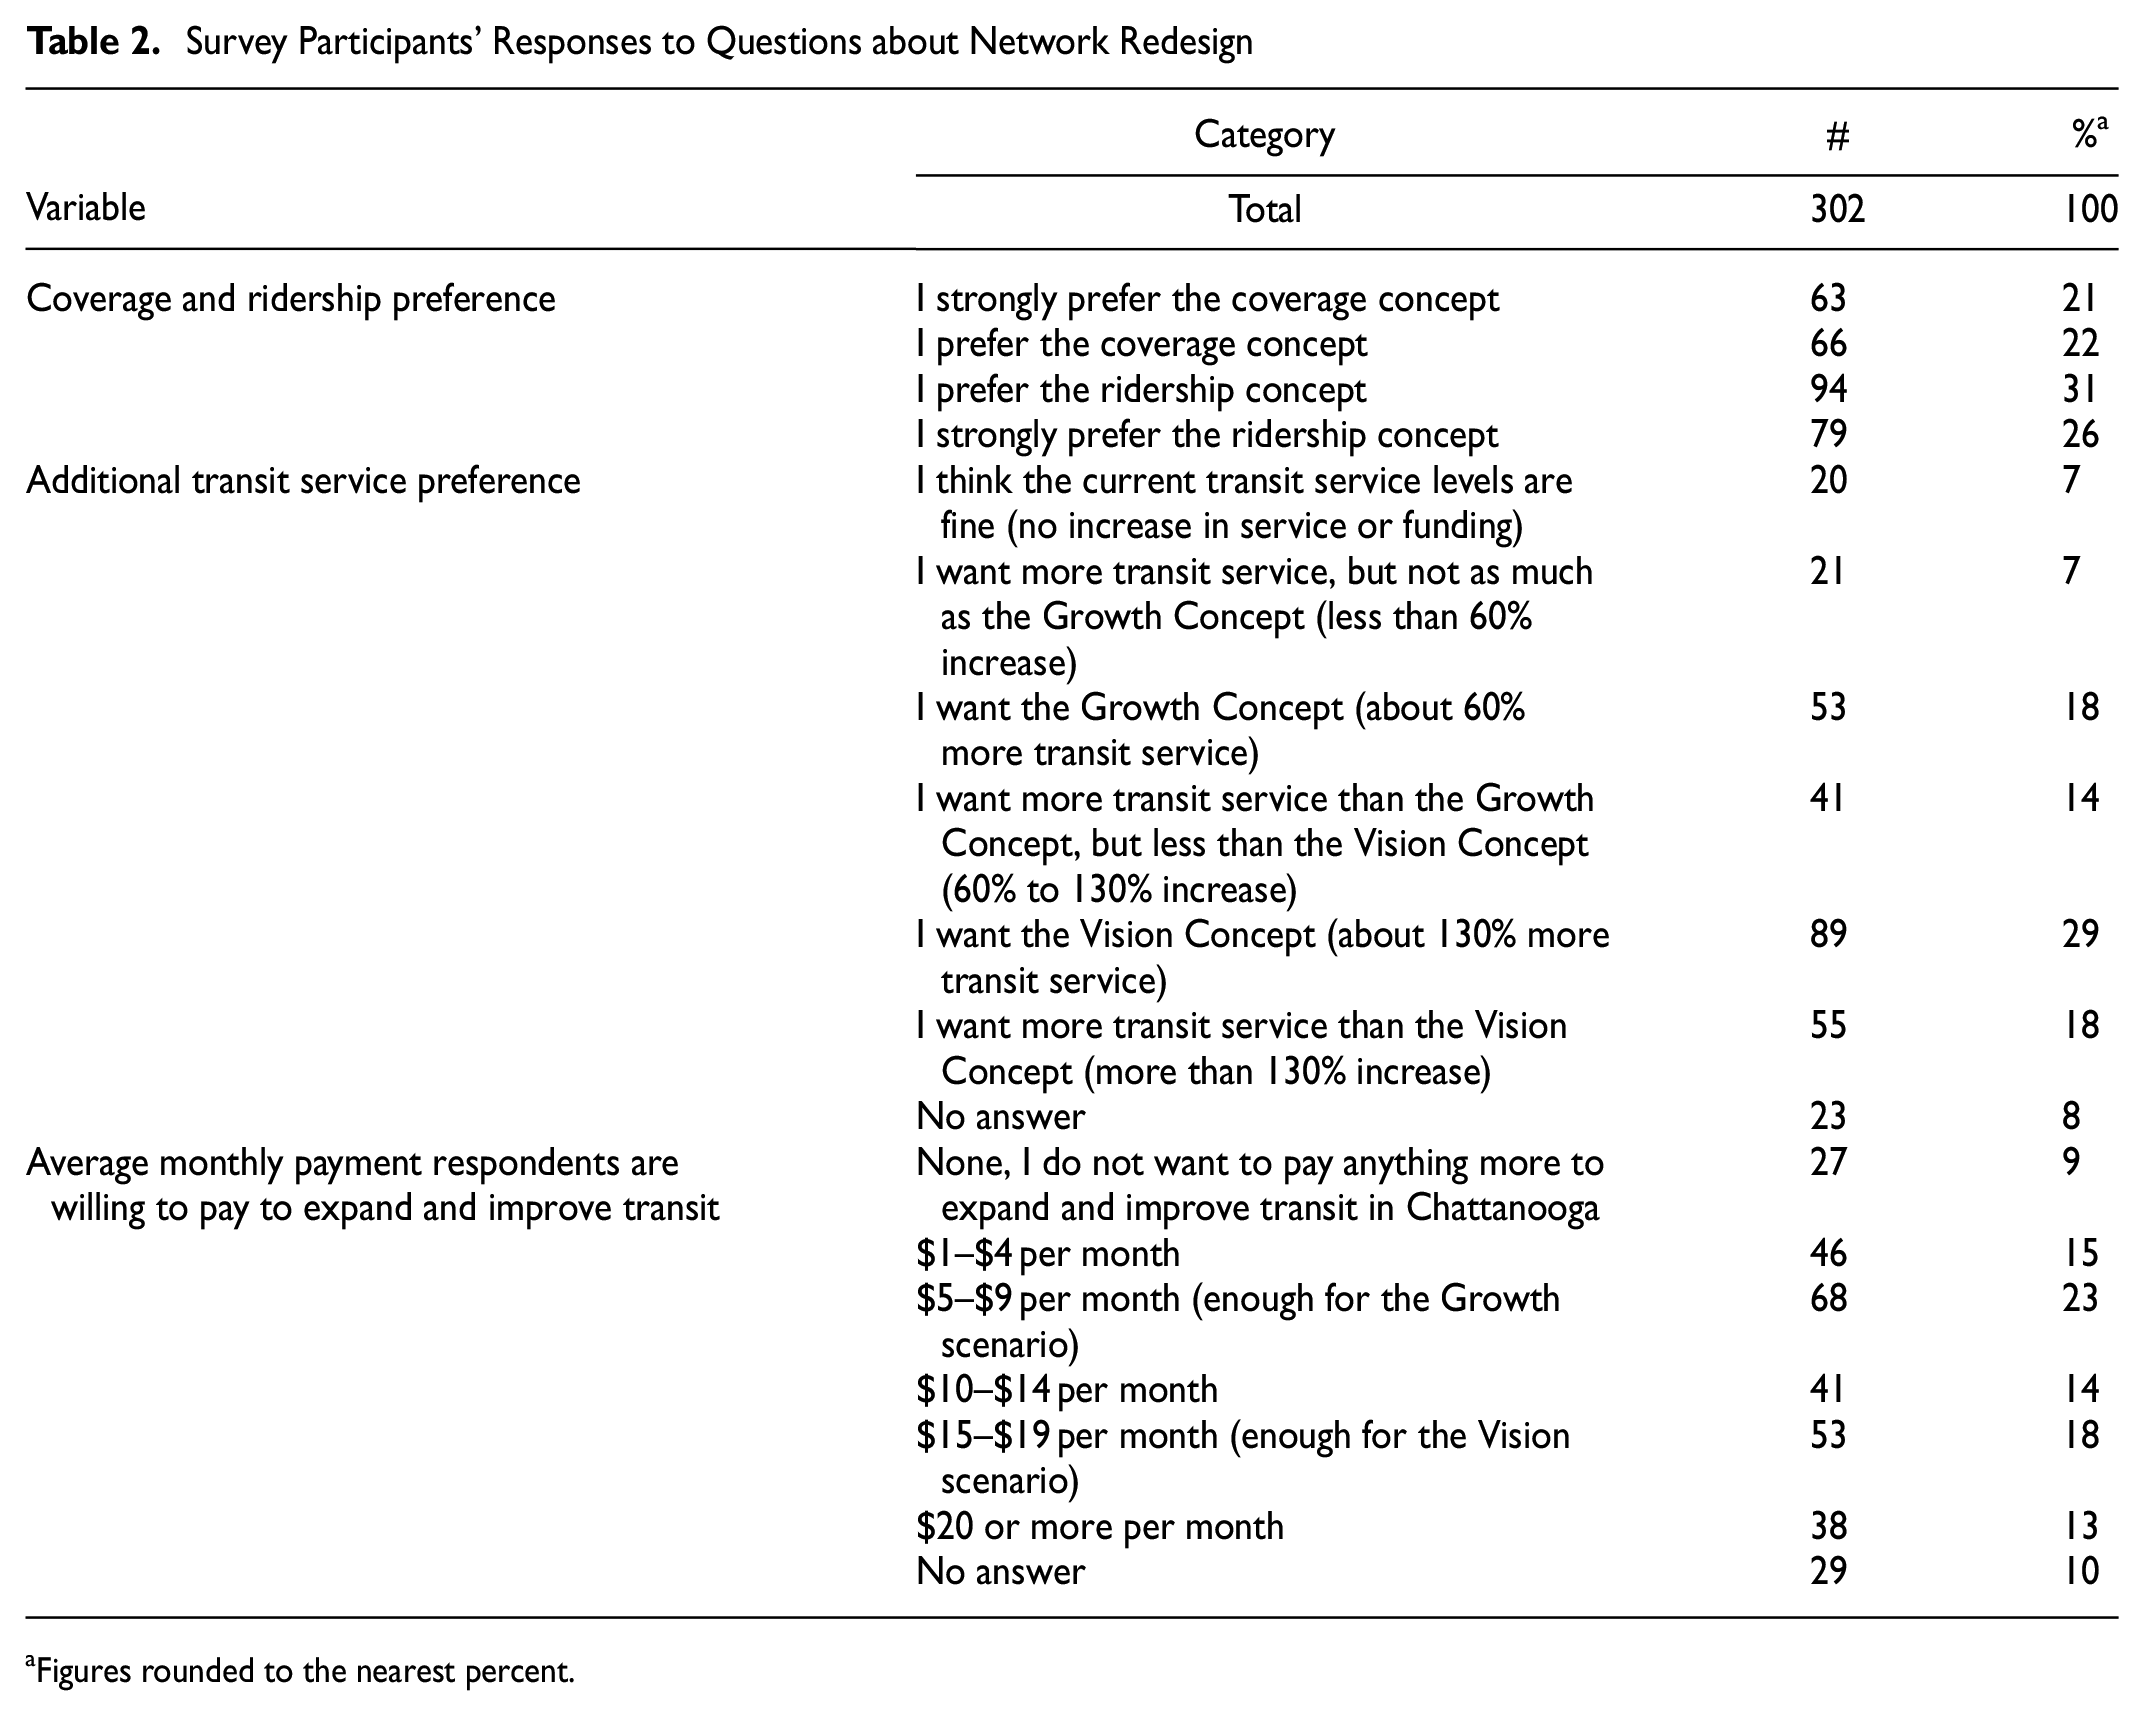
Figures rounded to the nearest percent.
Ridership versus Coverage Comparison between Riders and Non-Riders
The ridership and coverage preferences were then compared between riders and non-riders based on their frequency of riding CARTA buses, and the results are shown in Figure 5. Two-thirds of the participants who did not ride CARTA buses in the past month preferred the ridership scenario, whereas two-thirds of frequent riders who rode more than 15 days per month preferred the coverage scenario. The high percentage of frequent riders who preferred coverage was anticipated since these people are currently using the CARTA bus network that is designed to provide access to most of the city but with relatively low service frequency.
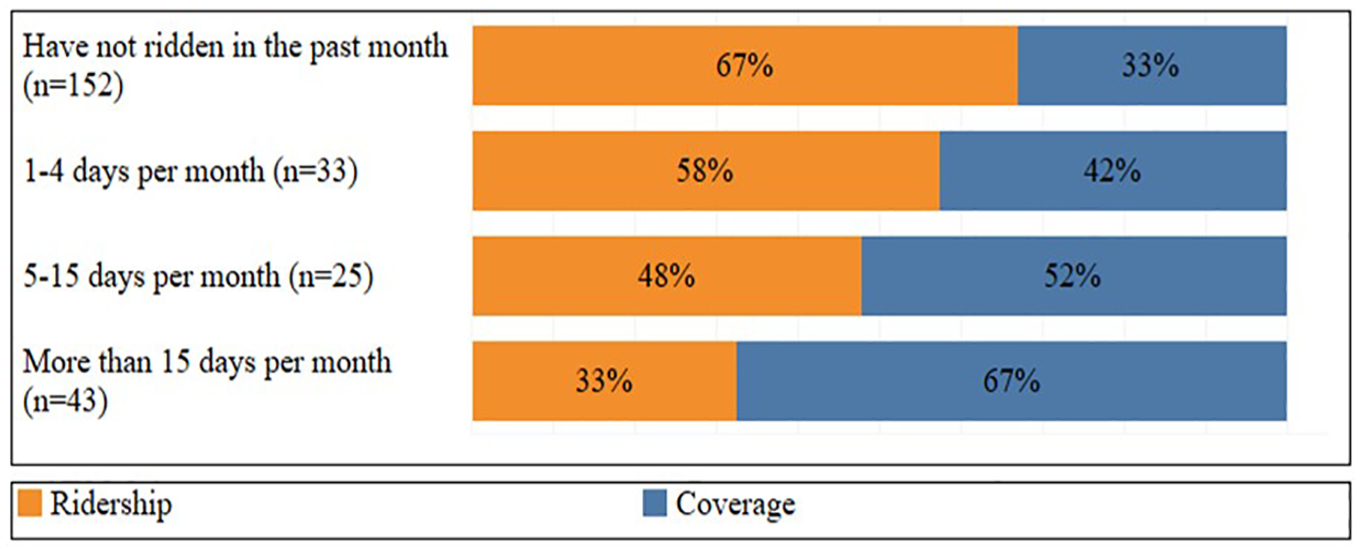
Comparison of rider and non-rider preferences.
Willingness to Pay Compared with Preferred Amount of Additional Service
As previously mentioned, the results of the descriptive statistics show that 47% of respondents want increases in transit service of 130% or more. However, only 31% of them are willing to pay for this amount of service. Therefore, this section compares the amount of additional transit service people want with their willingness to pay.
Figure 6 shows that 26% of non-white respondents prefer more transit service than they are willing to pay for compared with only 13% of white respondents. This difference was statistically significant based on a chi-square goodness of fit test (χ2 = 6.156, p-value = 0.013). Similarly, Figure 6 shows that 26% of frequent riders are willing to pay less than the amount of additional transit service they want, and this difference was statistically significant (χ2 = 6.637, p-value = 0.084). Figure 6 also shows that 26% of the respondents who have an annual household income less than $25,000 are not willing to pay for the amount of the additional service they want. Similarly, 18% and 26% of participants who earn $15,000–$24,999 and $25,000–$49,999, respectively, are not willing to pay for the amount of the additional service they want. However, these differences were not statistically significant (χ2 = 4.919, p-value = 0.426).
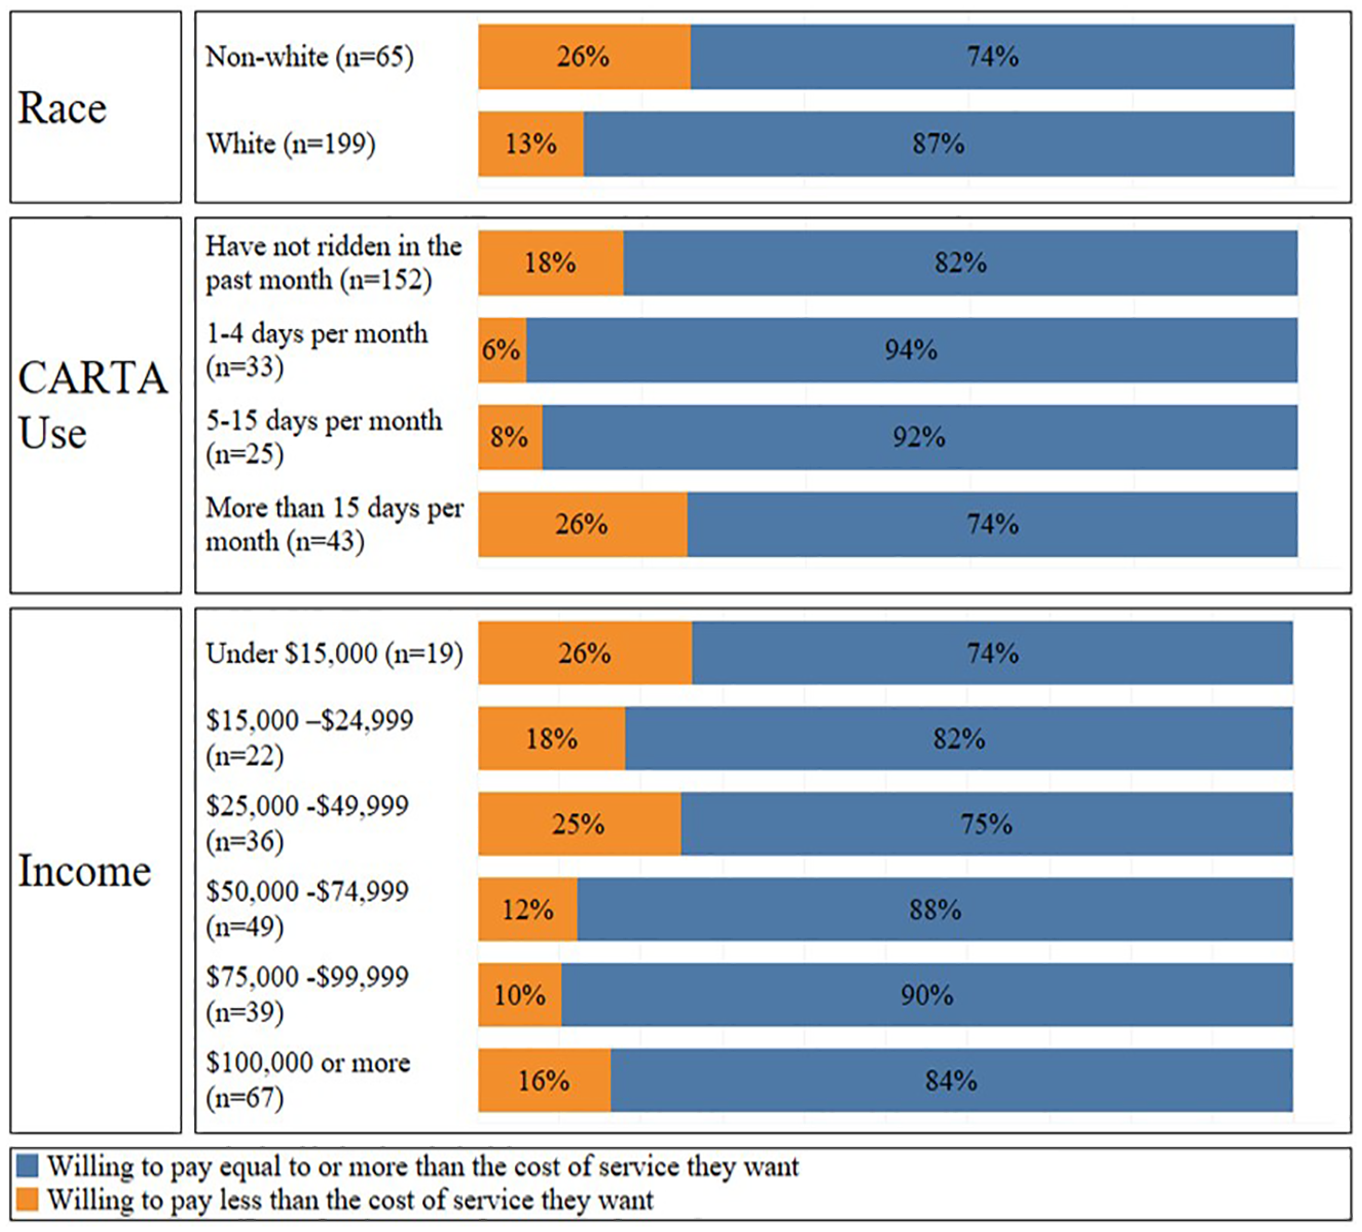
Comparison of willingness to pay and the preferred amount of additional transit service.
Overall, these findings indicate that most of the people who want additional service without additional costs to them are minorities and frequent transit riders; the implications of this are that planners and city officials may want to consider other potential revenue streams that do not add more financial burden to these groups.
Multivariate Analysis Results
This section presents the results of the multivariate analysis of preferences for a bus network redesign. First, the results of the binary logit model of ridership versus coverage are presented. Second, the results of the additional transit service ordered logit model are discussed, and this is followed by the willingness to pay for transit improvement ordered logit model results.
Ridership versus Coverage
This section presents the results of the binary logit model for ridership versus coverage, which is shown in Table 3. Model 1 in Table 3 is the full model, which considers gender, race, income, age, household size, household cars, frequency of using CARTA system, and Walk Score as explanatory variables for respondents’ preference between the coverage and ridership scenarios. Model 2 in Table 3 is the preferred model specification that has only the significant explanatory variables.
Ridership versus Coverage Binary Logit Model
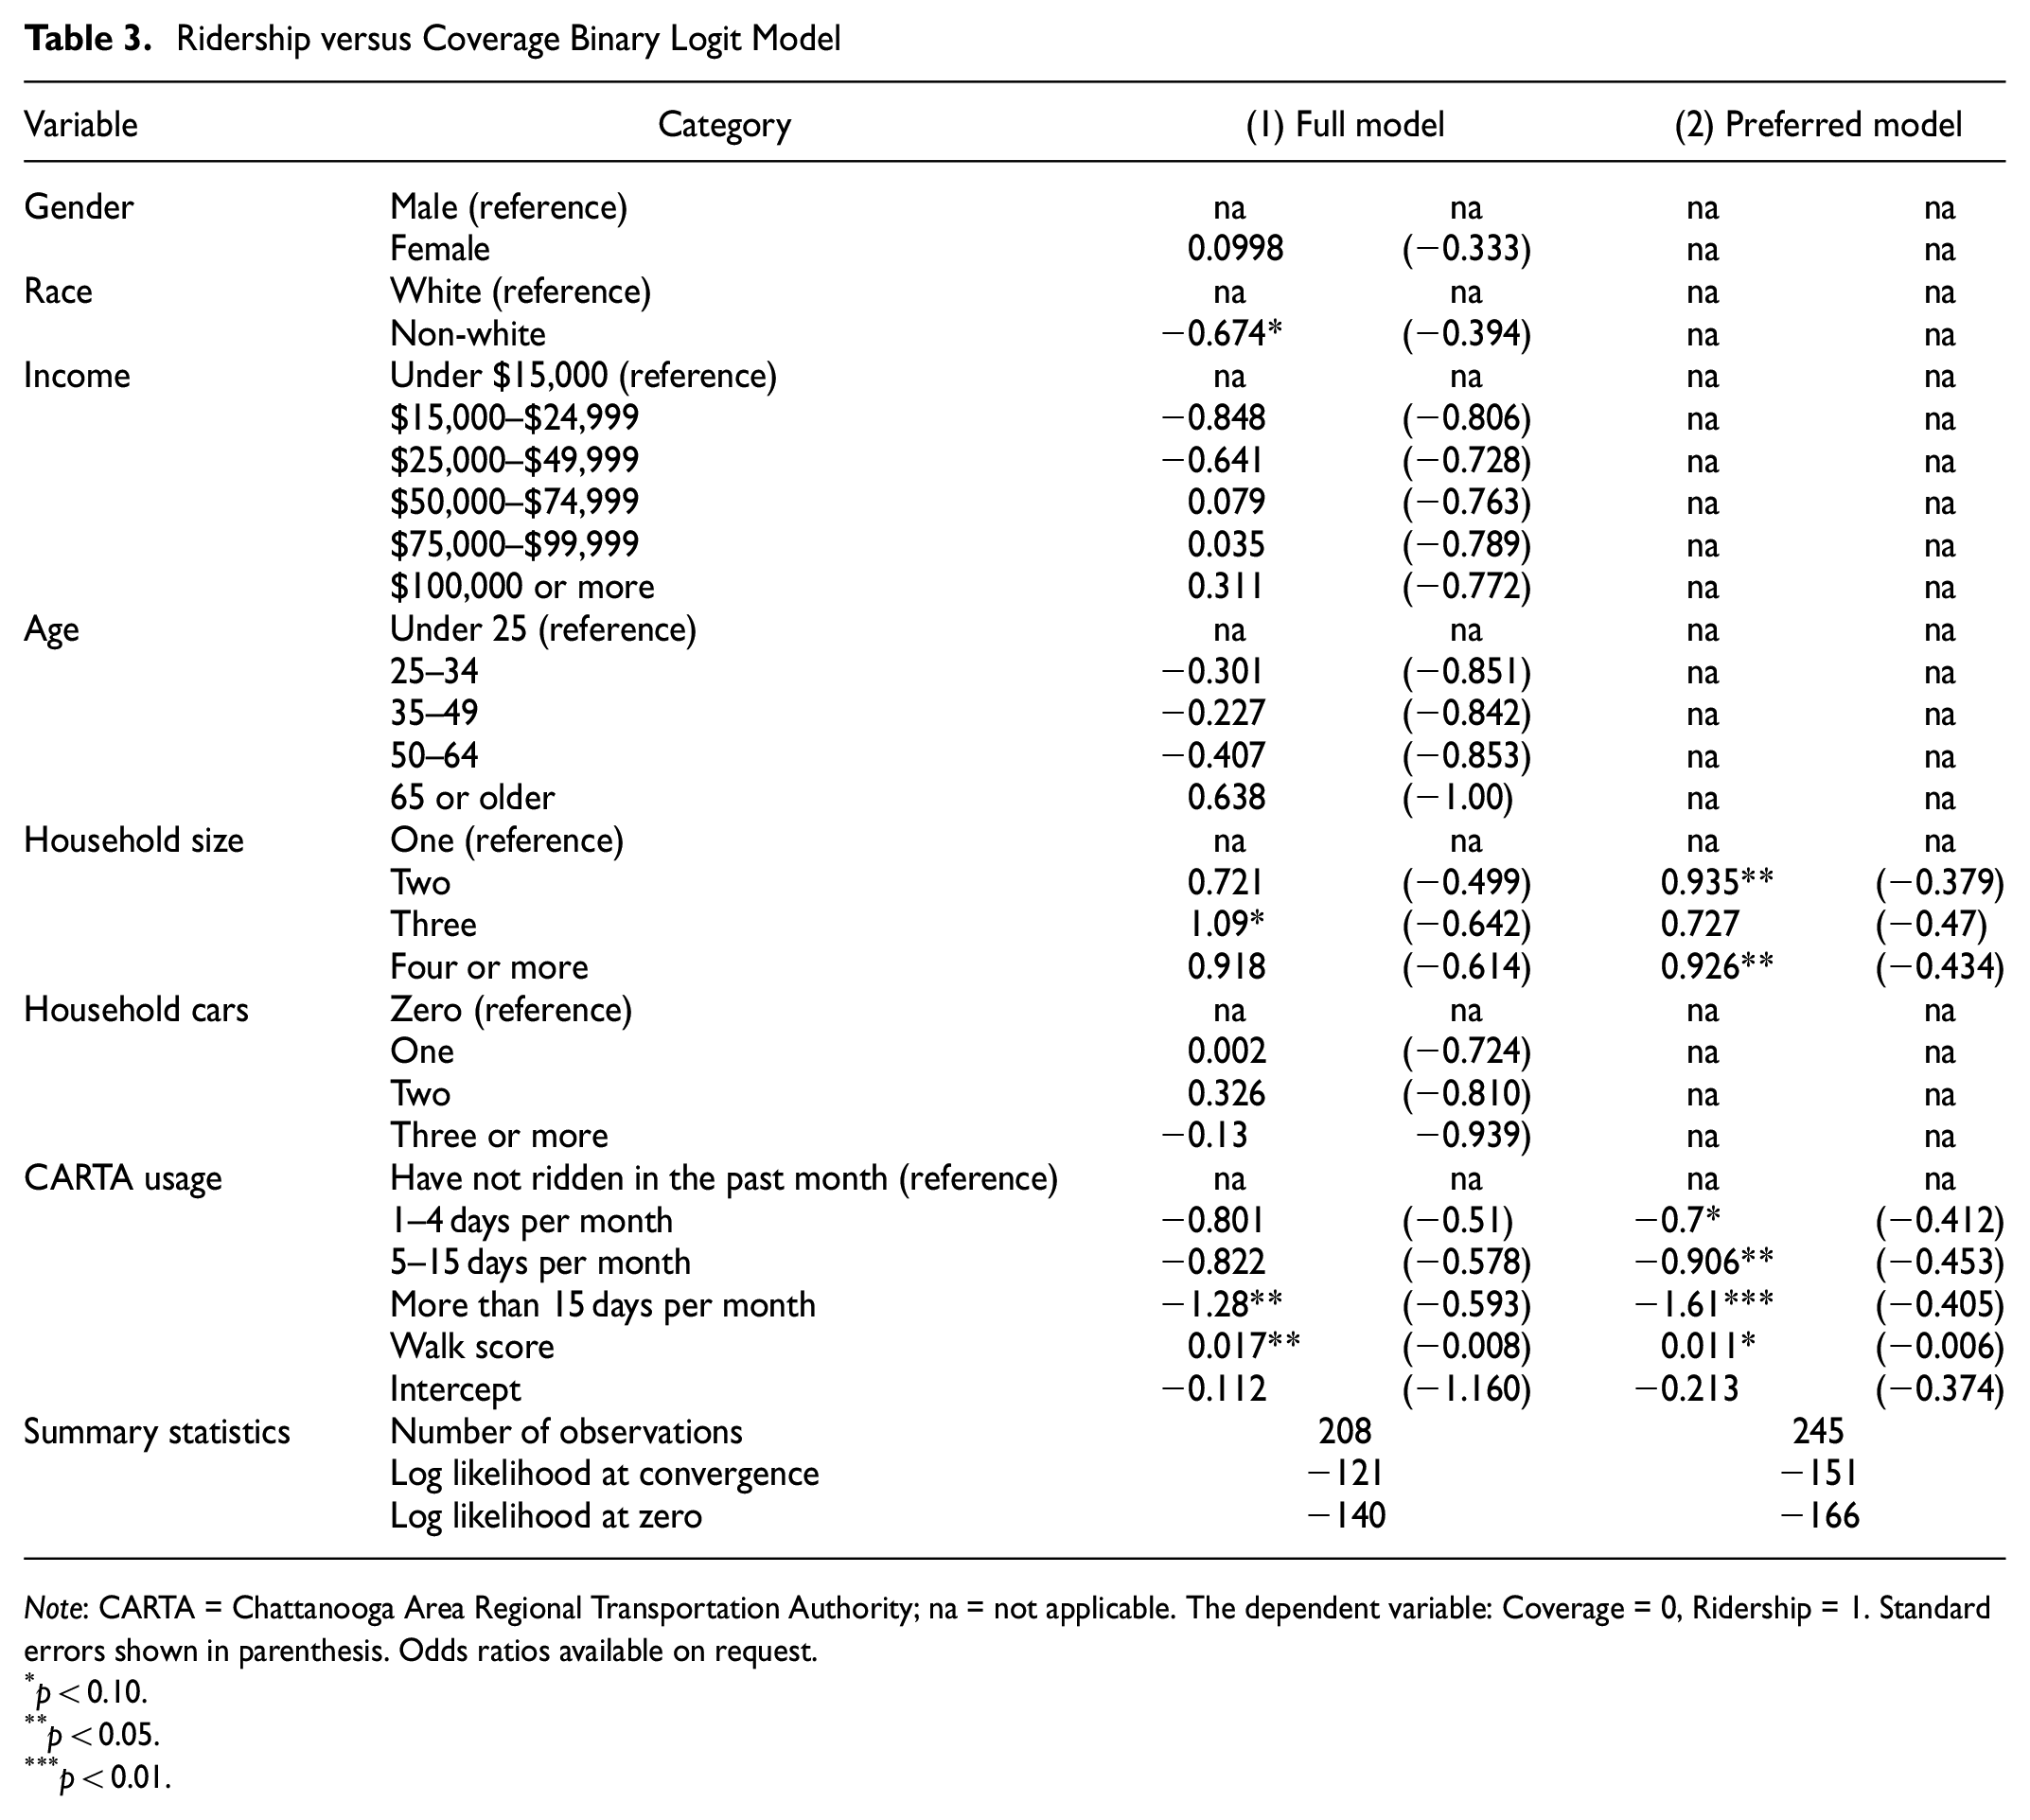
Note: CARTA = Chattanooga Area Regional Transportation Authority; na = not applicable. The dependent variable: Coverage = 0, Ridership = 1. Standard errors shown in parenthesis. Odds ratios available on request.
p < 0.10.
p < 0.05.
p < 0.01.
The preferred model shows that people living in larger households often prefer the ridership scenario compared with people living alone, as shown by the positive coefficients (0.935 and 0.926). One possible reason for this might be that larger households are likely to be traveling with children and therefore prefer shorter waiting times when using transit. Furthermore, this model shows that frequent CARTA riders who ride more than 15 days per month prefer the coverage scenario; this is indicated by the negative significant coefficient for the variable CARTA usage (−1.61). It was expected that frequent riders would prefer the coverage scenario since they presumably rely heavily on transit to provide them with access to places around the city. This finding aligns with the finding from the descriptive statistics (Figure 5) that two-thirds of frequent riders prefer the coverage scenario. Similarly, this model suggests that occasional riders prefer the coverage scenario, which is indicated by the negative significant coefficients (−0.7 and −0.906). This suggests that current users of the system do not want to lose access to places presently being served by transit.
The results of this model also indicate that people living in more walkable areas prefer the ridership scenario, as demonstrated by the positive coefficient of the walk score variable (0.011). This positive significant coefficient was expected since people living in more walkable areas may walk further to access transit service than people living in less walkable areas. It also worth noting that gender, income, number of household cars, and age were not statistically significant. The full model also showed that non-white respondents have a slight preference for the coverage scenario, as indicated by the negative coefficient (−0.674). Last, the sample size for these two models is less than the full sample size (302) since some of the participants did not answer all the survey questions.
Additional Transit Service Model Results
This section presents the results of the ordered logit models for the amount of additional transit service. The results of the models are shown in Table 4. Model 3 in Table 4 shows the full model that considers all of the explanatory variables, and the simpler, preferred model specification is shown as Model 4 in Table 4.
Additional Transit Service Ordered Logit Model
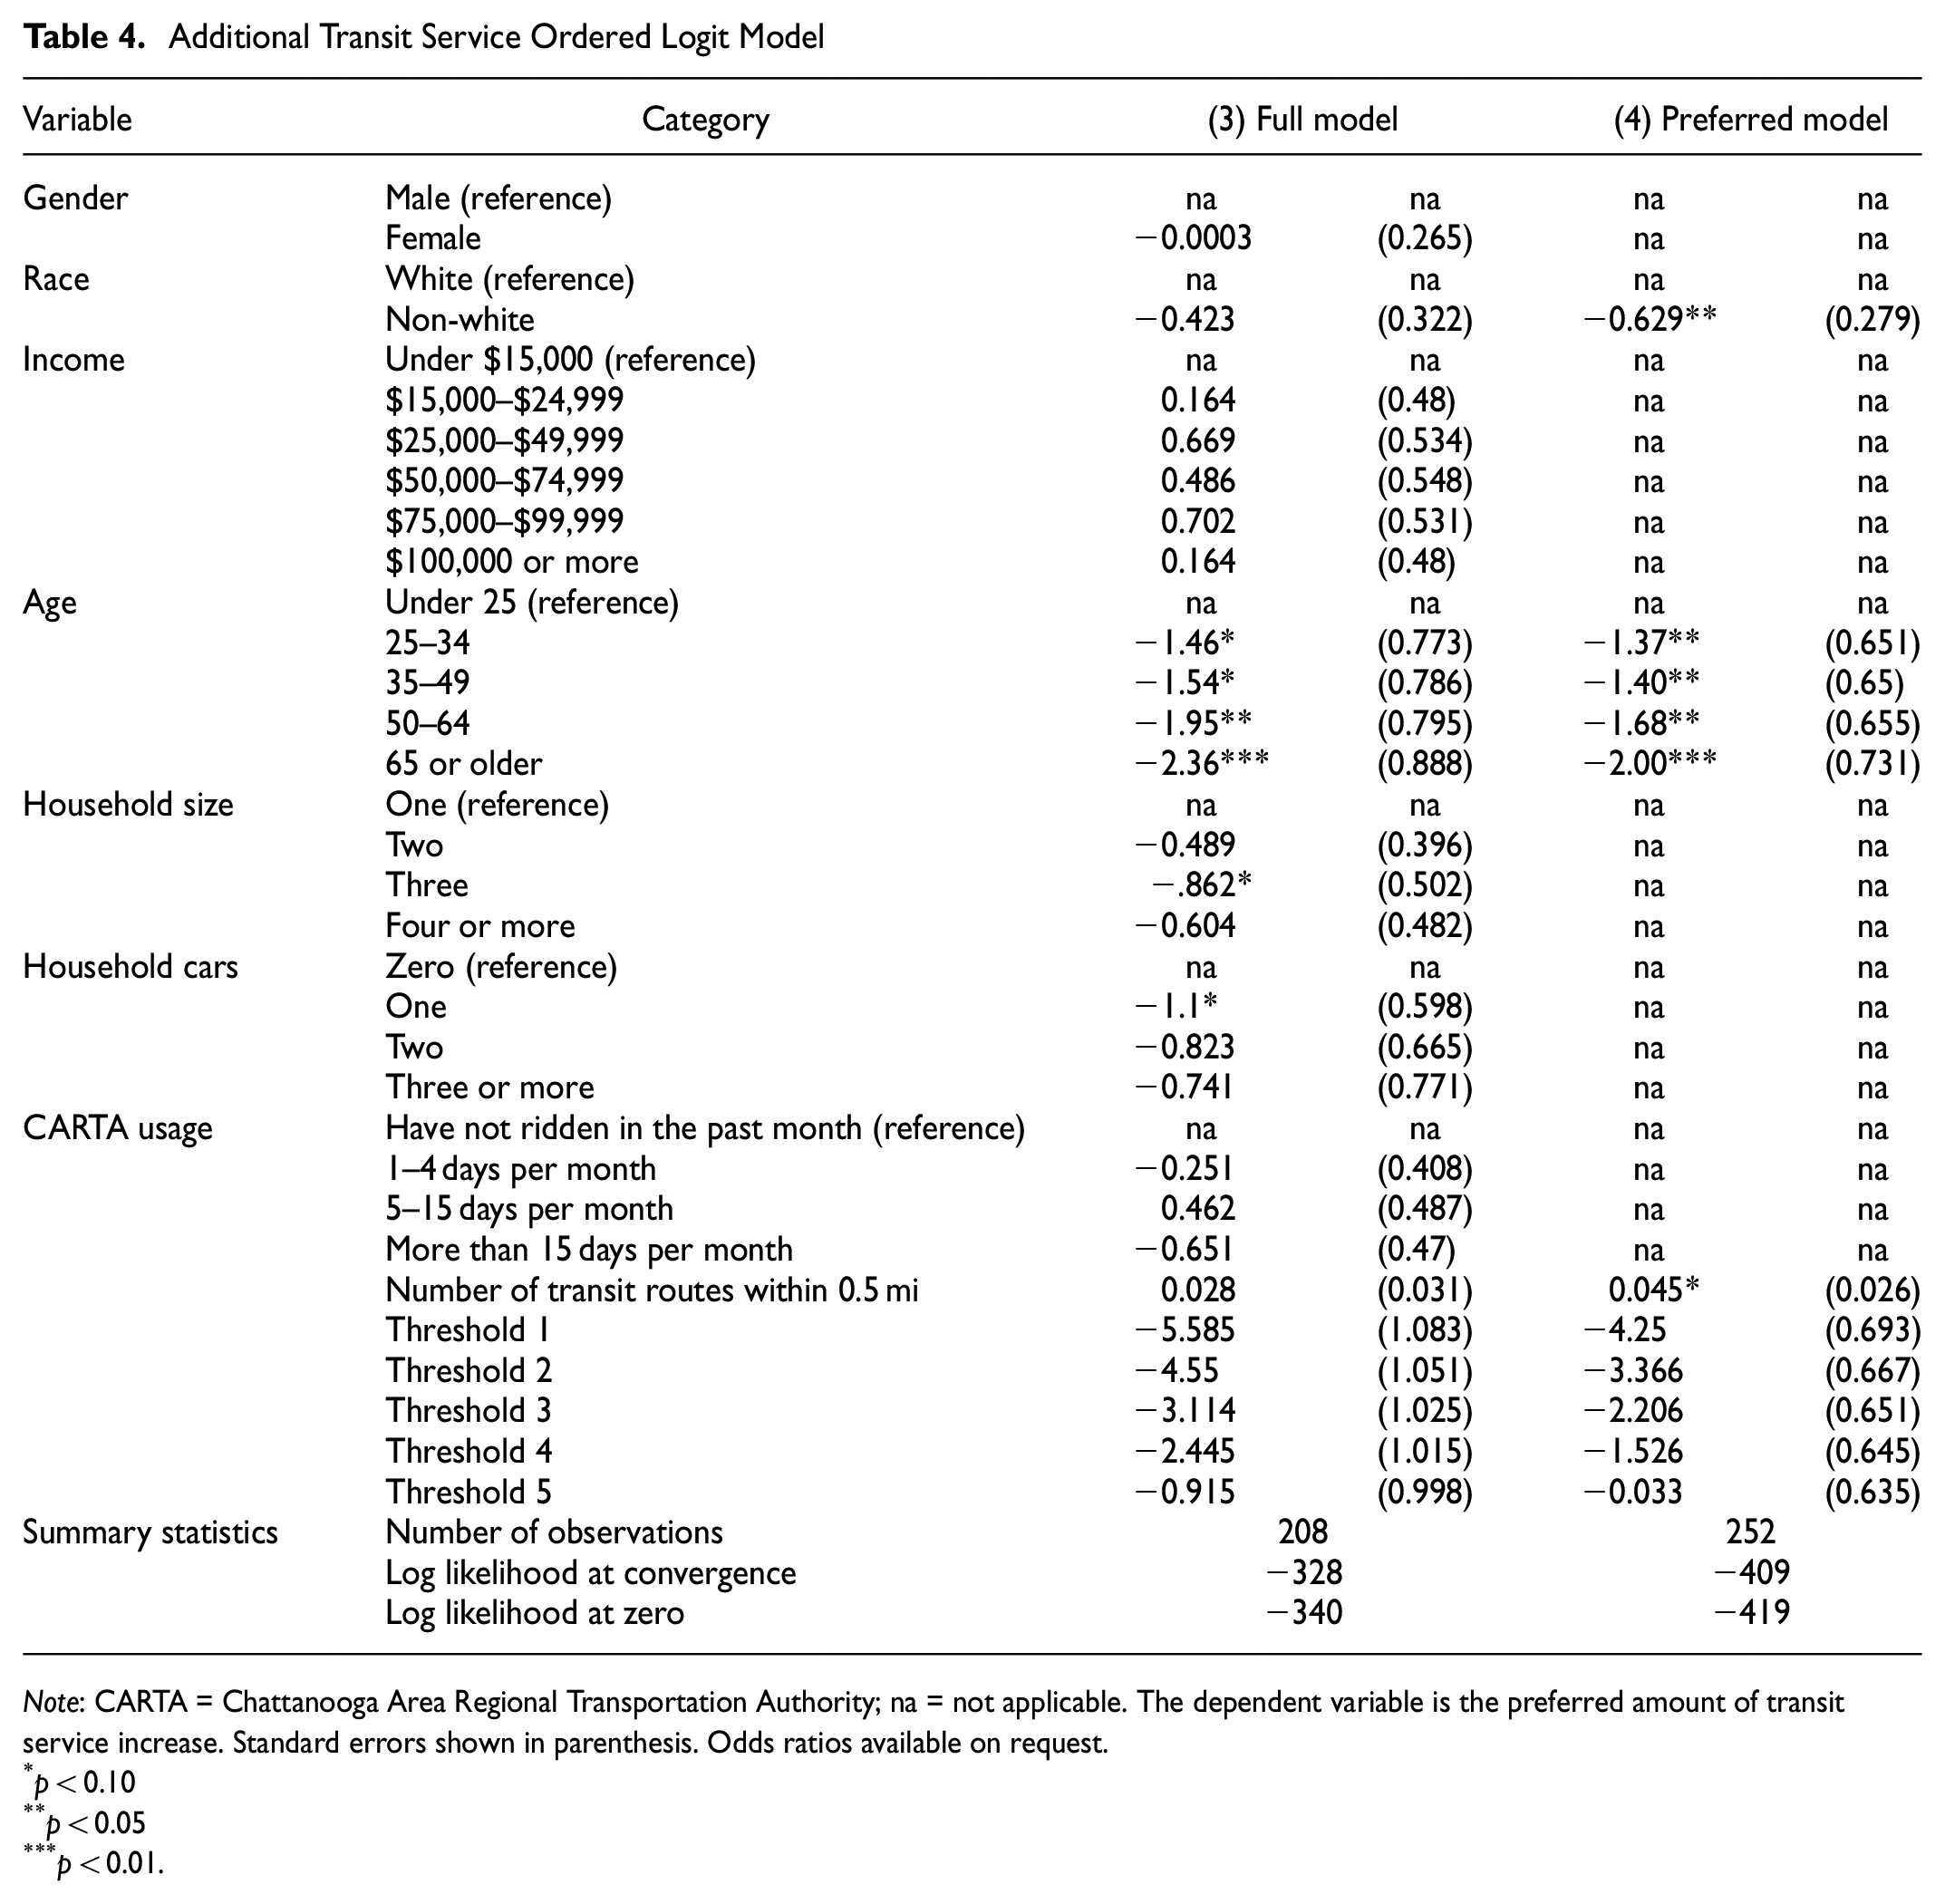
Note: CARTA = Chattanooga Area Regional Transportation Authority; na = not applicable. The dependent variable is the preferred amount of transit service increase. Standard errors shown in parenthesis. Odds ratios available on request.
p < 0.10
p < 0.05
p < 0.01.
The preferred model results suggest that non-white respondents do not want to change the current amount of transit service, as compared with white respondents (negative significant coefficient of −0.629). This model also shows that people who are under age 25 want more transit service compared with people who are older than 25; this is indicated by the significant coefficients of the age variable. This finding was expected since several previous nationwide studies have shown that younger people typically own fewer cars, drive less, and use transit more ( 18 – 20 ). Finally, the model results suggest that the number of transit routes within 0.5 mi is a significant predictor of the amount of additional transit service people prefer. The significant positive coefficient (0.045) indicates that each additional nearby transit route will increase the probability that people prefer additional transit service. This finding was also expected since people living in areas with more nearby transit routes are more likely to use transit and therefore may be more likely to prefer additional transit service. Gender, income, number of household cars, household size, and the frequency of using CARTA buses were not significant predictors of preferences for additional transit service. Last, the sample sizes for these two models were less than the full survey sample size (302) since some of the respondents did not answer all of the questions.
Willingness to Pay for Transit Improvement Model Results
This section presents the results of the ordered logit models for the willingness to pay to improve and expand transit service. The results of two ordered logit models are shown in Table 5. Model 5 in Table 5 shows the full model, and the simplified, preferred model specification is shown as Model 6 in Table 5.
Willingness to Pay for Transit Ordered Logit Model
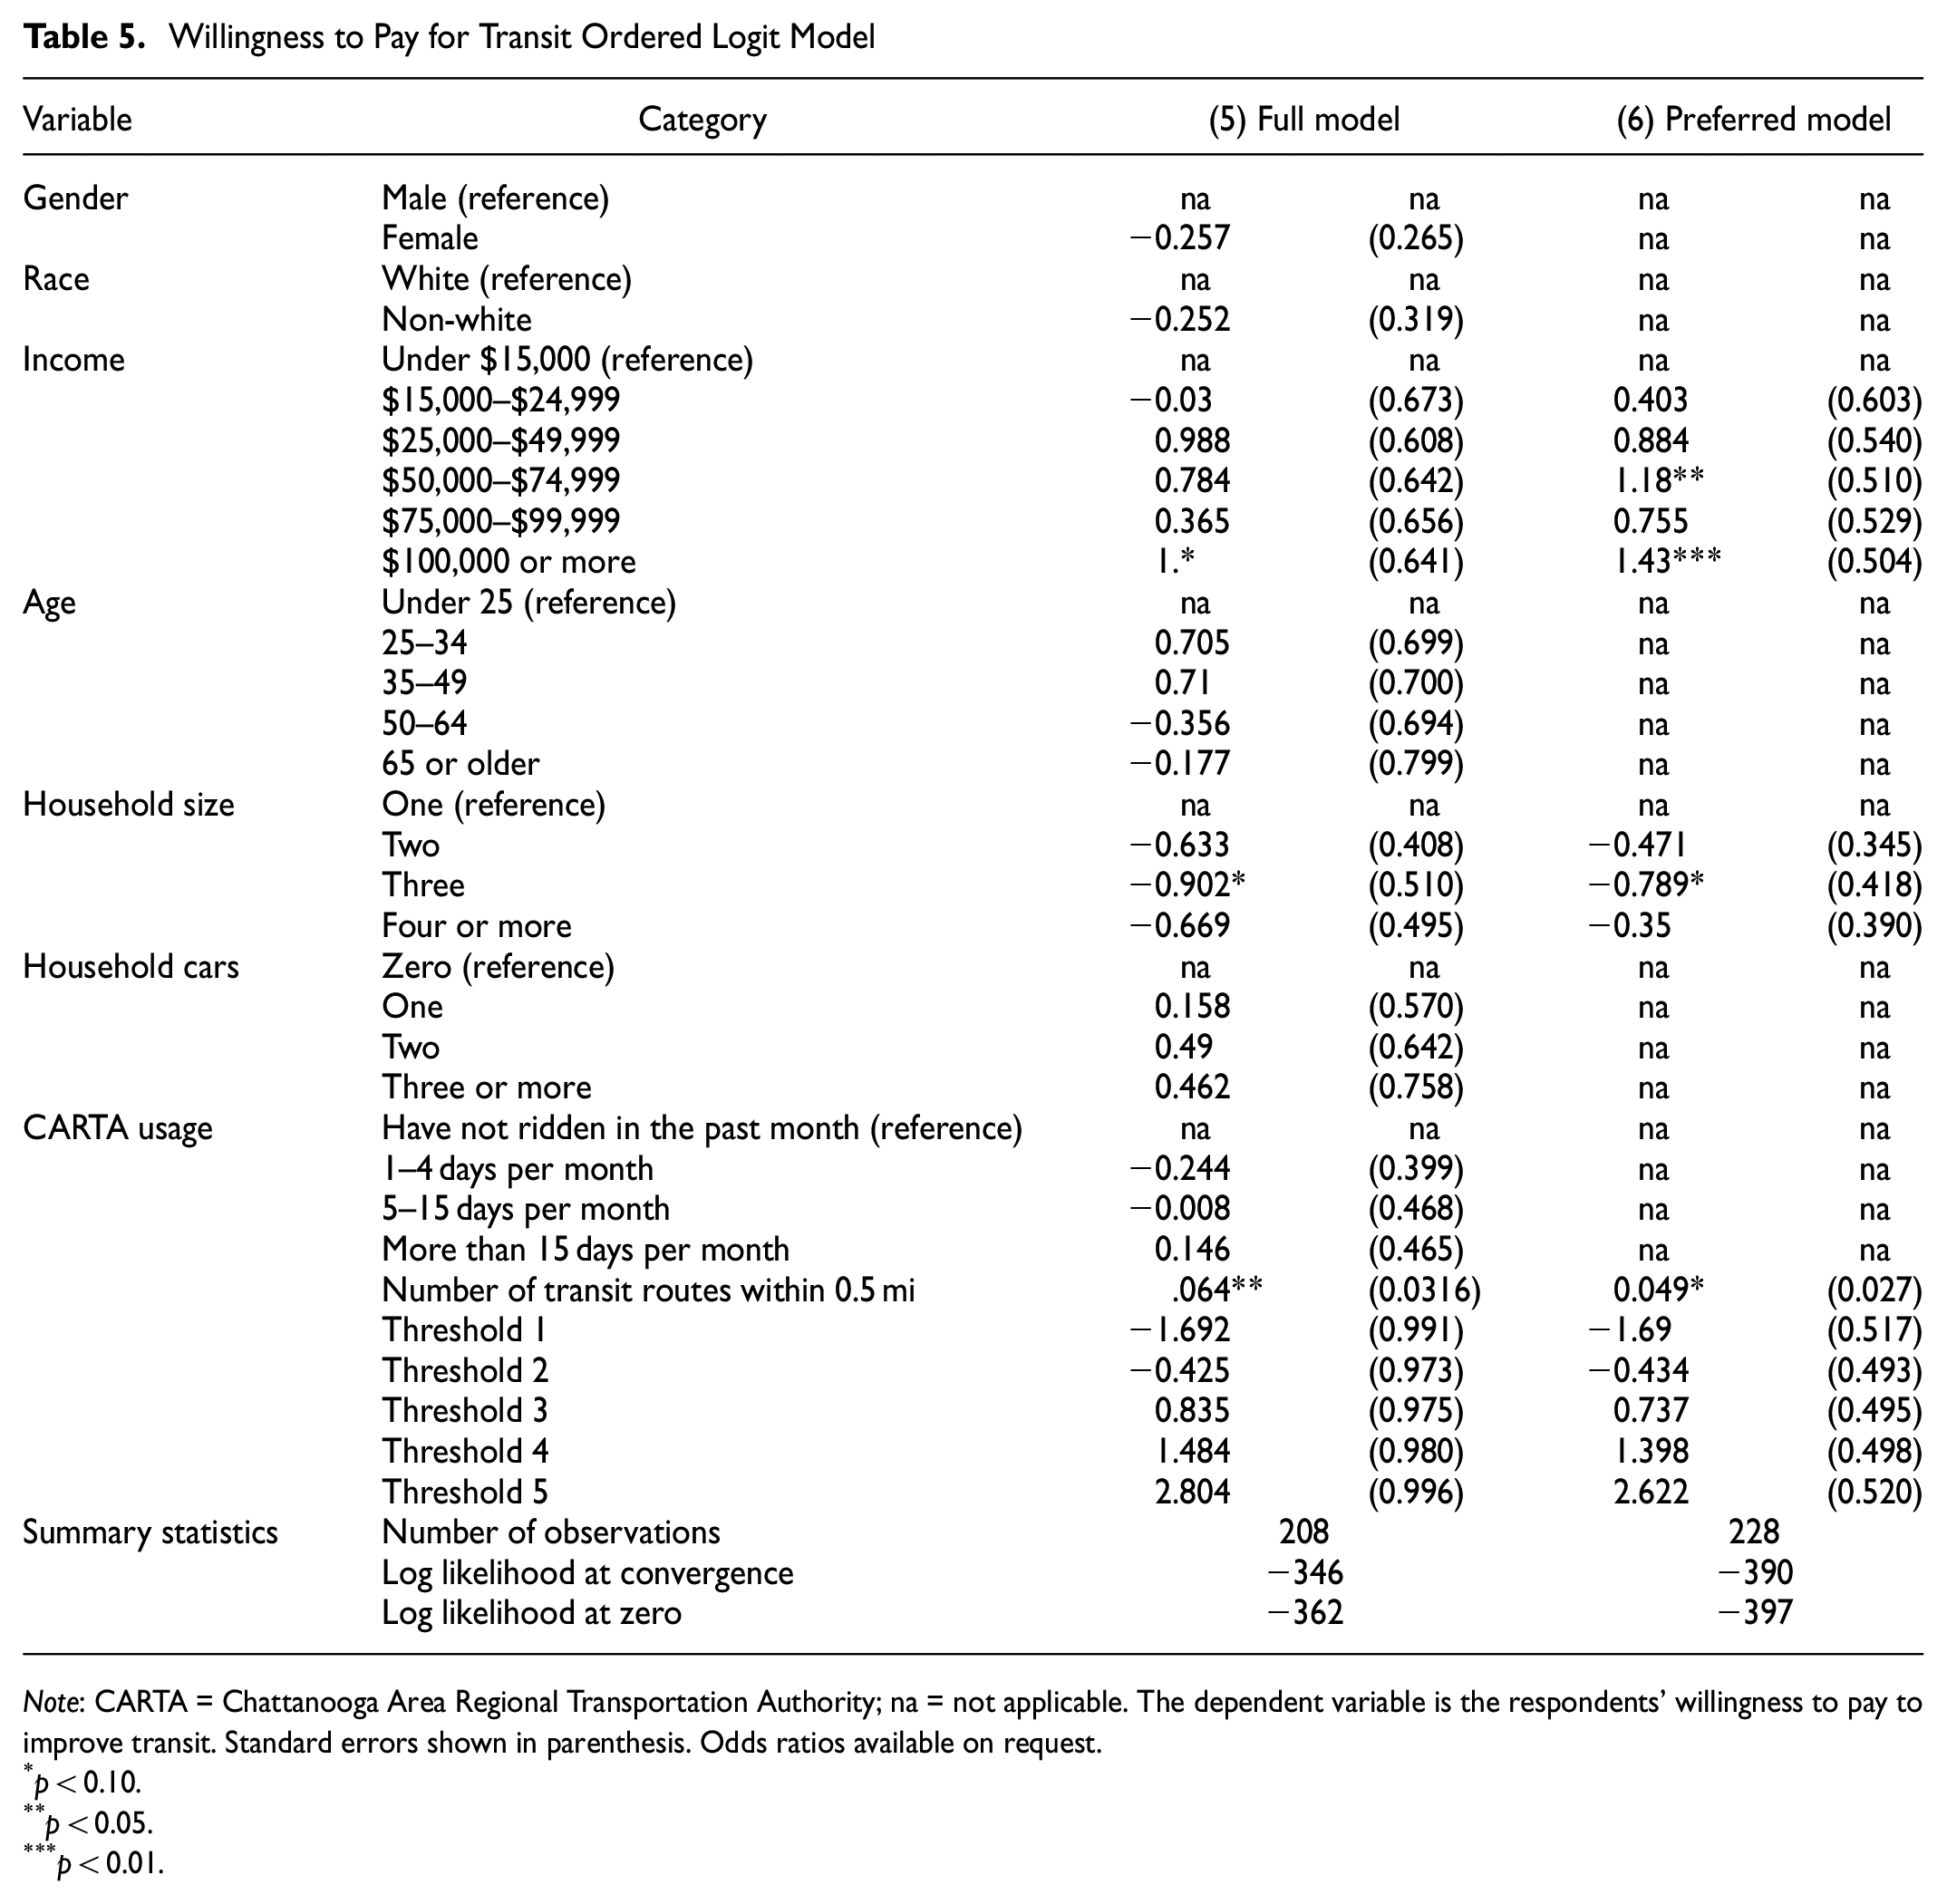
Note: CARTA = Chattanooga Area Regional Transportation Authority; na = not applicable. The dependent variable is the respondents’ willingness to pay to improve transit. Standard errors shown in parenthesis. Odds ratios available on request.
p < 0.10.
p < 0.05.
p < 0.01.
The preferred model specification shows that higher income respondents are willing to pay more for transit, as indicated by the positive coefficients of the income variables. This model also suggests that people living in households with three or more members are less likely to be willing to pay for transit improvements compared with people living alone; this is indicated by the negative significant coefficient (−0.789). One possible explanation for this might be that larger households are more likely to travel with children and therefore may be less likely to use transit. Since they may be using transit less, they may also be less interested in transit improvements. Finally, this model shows that the number of transit routes within 0.5 mi is also a significant predictor of the amount of additional transit service people prefer. The significant positive coefficient (0.049) indicates that each additional nearby transit route will increase the probability that people are willing to pay for transit improvements. Again, gender, race, age, number of household cars, and the frequency of using CARTA buses were not significant predictors of willingness to pay for transit improvements. Similar to the prior models, the sample size for these two models is less than full survey sample size (302) since some of the participants did not answer all of the survey questions.
Areas for Improvement and Future Research
This study evaluated the preferences of residents of Chattanooga, Tennessee toward different approaches to transit network redesigns. There are some noteworthy limitations of this analysis and some important areas for future research that emerged from this study. The first area for improvement is accounting for potential biases in the survey data collection methods that may have affected the results. It is well documented in the survey methods literature that survey data collection, like that used to collect the data for this study, could have biases such as self-selection bias, which occurs when some invited participants choose not to be part of the survey ( 14 ), or item nonresponse, which occurs when respondents do not answer all of the questions in a survey ( 21 ). Self-selection bias could lead to some groups being overrepresented in the survey, which is likely the case for this study in which there were relatively high numbers of white and high-income participants. Similarly, item nonresponse may have affected the answers to some survey questions, particularly demographics like ethnicity and income, and therefore, may provide a somewhat biased picture of the survey sample demographics.
A third area for improvement is related to using stated preferences survey data to estimate willingness to pay, which could be affected by a phenomenon known as hypothetical bias. Hypothetical bias might occur if individuals report potential behaviors that are different from what they would do in reality because of the hypothetical nature of the question ( 22 ). Future studies could use revealed preference survey data to validate the willingness to pay findings after the implementation of a bus network redesign. One last area for improvement on the survey instrument is related to the coverage scenario. In the survey, the coverage scenario performance was measured using the number of jobs reached within certain time; however, another performance metric that better reflects the extended coverage should be used in future analyses.
Another area for improvement is the geographic unit of analysis of walkability and transit access. This study evaluated walkability and transit access at the zip code level; future studies should consider a more refined geographic unit of analysis such as the census block or tract level.
There are also some important future research areas that have emerged from this study. One area for future research is how the COVID-19 pandemic might affect preferences for bus network redesigns. This study showed that regular CARTA users generally prefer higher levels of access with lower frequency service; however, the COVID-19 pandemic resulted in limitations on vehicle capacity that might increase passenger volumes, which could now be a potential health risk. Therefore, regular bus users’ preferences for high access and low frequency service might change in consequence of COVID-19. The findings of this study suggest that many of the people who want additional service are minorities and frequent transit riders. Therefore, an important area for future research is how transit agencies can fund transit improvements without placing additional financial burdens on these groups. Last, this study considered the city of Chattanooga as a case study for mid-sized cities; future studies should explore preferences for bus network redesigns in small and large cities.
Conclusions
This study explored the preferences of local residents toward a proposed bus network redesign using stated preference survey data collected in Chattanooga, Tennessee. The main findings of this study are discussed below and summarized in Figure 7. These results can help to inform other transit agencies as they think about potentially redesigning their bus networks.
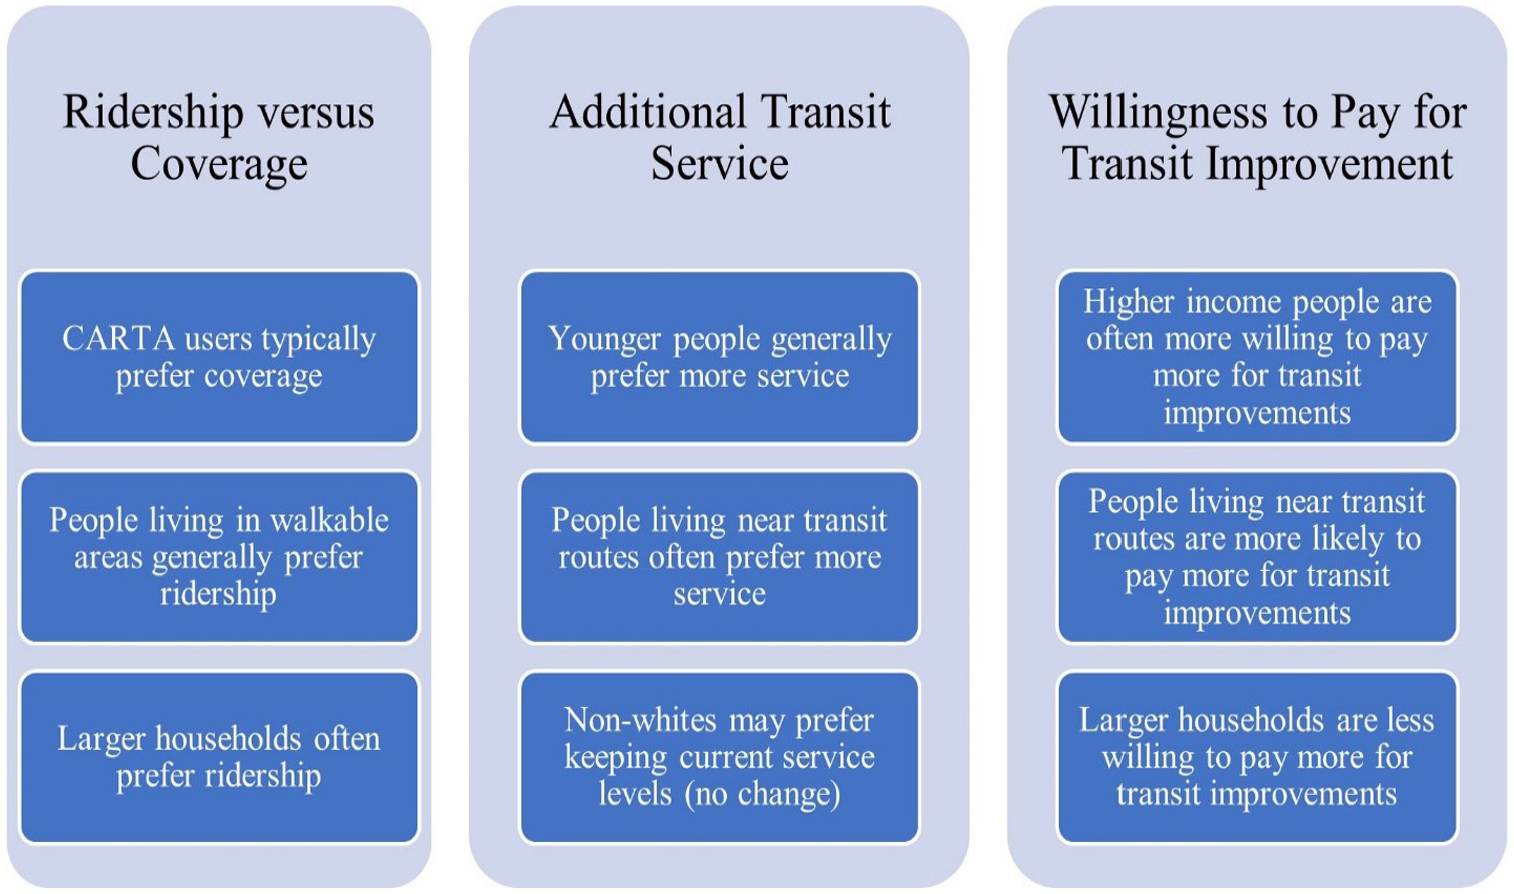
Summary of preferences for proposed transit network redesign characteristics.
The first key finding of this study is that survey respondents who are existing bus riders prefer the coverage scenario that provides access to more places but with lower frequency service and longer passenger waiting times. Non-riders usually prefer the ridership scenario with more frequent service. This suggests that although transit agencies might attract some new riders by offering more frequent service, they might lose their current ones. This finding aligns with a prior study of a redesign in Tallahassee in which overall bus ridership decreased; however, ridership increased in some previously underserved areas ( 7 ).
The second finding of this study is that younger people want additional transit service more than other age groups. This finding is important for transit agencies as they develop their long-term plans and policies. Agencies should consider that younger generations have different preferences for transit service. To address this, transit agencies could develop programs for younger residents to boost their ridership, such as fare discounts for youth.
A third key finding of this study pertains to funding for transit improvements. Residents with higher income levels and people living near transit routes are more likely to be willing to pay more for transit improvements. This finding suggests that access to transit increases the willingness to pay for transit, which could be important for agencies as they think about expanding their service.
Last, it should be noted that CARTA has not finished the redesign process because of COVID-19 restrictions. However, based on the input of the survey and guidance from CARTA’s board of directors, the final system plan will be based on the following three foundations:
Maintain the current coverage area (i.e., while routes might be adjusted, no neighborhoods currently served would be disenfranchised);
Focus slightly more on maximizing ridership by reducing frequencies in areas of low density/demand; and
Minimize redundancies in the system and reinvest in ridership-oriented service.
CARTA’s decision not to disenfranchise any currently served neighborhoods while increasing frequency in high demand areas is similar to a recent decision made by the Chatham Area Transit (CAT) board of directors in Savannah, Georgia. In late 2019, the CAT board of directors decided that they would not redesign the transit system in Savannah, Georgia to favor ridership over coverage ( 23 ). These decisions made by CARTA and CAT suggest that although transit agencies are concerned about recent ridership declines, they are committed to providing a minimum level of transit service for all residents in their cities, and they are not going to cut off neighborhoods for ridership gains. This is an important policy decision that, along with the results of this study, can help to inform other transit agencies that are considering or are in the process of redesigning their bus networks.
Footnotes
Acknowledgements
The authors would like to thank Jarrett Walker + Associates who conducted the CARTA system ReDesign. Jarrett Walker + Associates developed the different scenarios presented in the survey and designed the survey with CARTA staff.
Author Contributions
The authors confirm contribution to the paper as follows: study conception and design: A. Ziedan, C. Crossland, C. Brakewood, P. Pugliese; data collection: P. Pugliese; analysis and interpretation of results: A. Ziedan, C. Crossland, C. Brakewood, P. Pugliese, H. Ooi; draft manuscript preparation: A. Ziedan, C. Crossland, C. Brakewood, P. Pugliese. All authors reviewed the results and approved the final version of the manuscript.
Declaration of Conflicting Interests
The author(s) declared no potential conflicts of interest with respect to the research, authorship, and/or publication of this article.
Funding
The author(s) disclosed receipt of the following financial support for the research, authorship, and/or publication of this article: This study was supported in part by the Transit-Serving Communities Optimally, Responsively, and Efficiently (T-SCORE) Center. Grant Number: 69A3552047141 for a 2020 Tier 1 University Transportation Center.
Data Accessibility Statement
Data used in this study are available from the Chattanooga Area Regional Transportation Authority.