
Abstract
As part of a broader vision for emission-free city logistics, the city of Rotterdam plans to introduce a zero-emission zone in combination with urban consolidation centers (UCCs) on the outskirts of the city to generate a shift to zero-emission vehicles. For the design of this zero-emission zone, several research questions arise that require a systematic analysis of the impacts of the transition scenarios on freight demand patterns, the use and market shares of new (zero-emission) vehicles, and the impacts of truck flow and emissions. As a case study, we implemented heterogenous transition scenarios for each logistic segment into the Tactical Freight Simulator from the HARMONY project and analyzed the systemwide impacts. This model is multiagent, empirical, and shipment based and simulates long-term tactical choices (distribution channel choice, shipment size and vehicle type choice, sourcing) and short-term tactical choices (tour formation, delivery times). Results showed that the impact of UCCs is not trivial: we observed a small increase in vehicle kilometers traveled overall of +0.25%, which can be attributed to the rerouting of shipments through the UCCs. Calculations confirmed that emissions reduced dramatically, by 90%, inside the zero-emission zone. At the city scale this corresponds to a reduction of almost 10%, as most freight-related traffic is generated by the port and involves long-haul heavy goods vehicle transport that does not enter the city center. At a regional level, impact reduction was very small. More measures are needed if more ambitious reductions in emissions are to be achieved.
An important tool for local administrators is the introduction of low (or ultra-low) emission zones, with imposed access restrictions for commercial vehicles or emission-based access fees. Systems have been put in place in several European cities ( 1 , 2 ). However, recent evaluations show that the effectiveness of low emission zones (LEZs) is marginal ( 1 ).
With the current municipal coalition agreement, in line with the national coalition agreement, the mayor and executive board of Rotterdam have committed to achieving the goal of reducing CO2 emissions by 49% by 2030 ( 3 ). For city logistics, Rotterdam is working to achieve transition to a system that is as efficient as possible (reducing vehicle kilometers) and deploys zero-emission (ZE) vehicles. For this purpose, Rotterdam plans to introduce a zero-emission zone (ZEZ) ( 3 ). This ZEZ is part of a broader vision for emission-free city logistics that involves supporting measures such as consolidation hubs on the outskirts of the city and generating a shift to ZE vehicles. Part of this solution is the deployment of light electric cargo vehicles (LECVs) such as cargo bikes or small vehicles with an electric engine, or vehicles with no emissions, such as electric, hydrogen, hybrid or biofuel drivelines.
To support the decision-making process, it is relevant to be able to analyze different scenarios for the boundaries of the zone, supporting measures on the impacts and demand for new last-mile solutions. However, in spite of the importance of urban freight transportation, and its growing importance in the use of urban infrastructure, tools for strategic decision-making, with comprehensive scope and sufficient behavioral detail to be used for urban freight transportation policies, are missing because of a lack of empirical data and resources (4–6).
The HARMONY project (http://harmony-h2020.eu/) has the objective of developing a new generation of harmonized spatial and multimodal transport planning tools, which will comprehensively model the dynamics of the changing transport and mobility sectors and impacts of new technologies and services. Urban freight transport is one of the domains covered in the HARMONY project, and for this domain a Tactical Freight Simulator (TFS) is being developed. The simulator is based on an existing multiagent simulation system, MASS-GT ( 7 , 8 ). In HARMONY, this approach is being extended by improving the logistic decision models and implementing the use-cases addressed in the HARMONY project.
One of the use-cases in HARMONY is the introduction of ZEZs. In this paper we describe the application of TFS to this use case. In a previous analysis, an earlier version of the MASS-GT model was used to explore the impacts of a ZE case ( 8 ). However, that study had some shortcomings: the analyzed ZE scenario lacked stakeholder-specific transitions, and the modeling system did not provide emission calculations. In this paper we present a more advanced version of the model and implement heterogenous transition scenarios for each logistic segment.
We first discuss the background of ZEZs and strategic simulation tools. Next, we present TFS, developed in the HARMONY project. Following this, the ZE transition scenario is described. Finally, the simulation results are presented and discussed from the perspective of a multiagent simulation and urban freight transportation policies.
Background
Zero-Emission Zones in City Logistics
The last decade has seen the emergence of measures to reduce emissions in city logistics. An important tool for local administrators has been the introduction of low (or ultra-low) emission zones (LEZs) ( 1 , 2 ). These LEZs impose access restrictions for commercial vehicles or emission-based access fees. Systems have been put in place in Prague, Gothenburg, London, Rome, Ljubljana, and cities in the Netherlands and Germany. The dimensions of the measures vary: the stringency of measures, the size of the area, and the enforcement ( 1 ). Sometimes high-emission vehicles are completely banned or required to pay a fee to enter. In Ljubljana, vehicles exceeding 7.5 tons are not allowed within the inner ring road at peak times. Since 1999, Prague has had two zones with weight restrictions for heavy goods vehicles (HGVs). To improve air quality Gothenburg introduced a LEZ in 1997, which was then extended to cover a larger area in 2007. In London, access restrictions are in place for vehicles from different weight or emission classes in the London Lorry Control Scheme. However, findings from monitoring suggest that trucks use less direct routes, which can lead to an increase in HGV kilometers and environmental emissions (1). As of 2019, the Ultra-Low Emission Zone was introduced, within which only diesel trucks with minimum Euro standard VI are allowed. The reported impacts of LEZs vary according to the type of implementation ( 1 ). The environmental vehicle ban in around 60 German cities is reported to have reduced emissions by 0% to 15% ( 1 ). However, it is not possible to attribute this to the introduction of LEZs or the autonomous trend of HGVs moving toward cleaner Euro standards. Overall, it can be concluded that in most cases the impacts of LEZ have been found to be insignificant, except, possibly, for the LEZs in Germany.
Modeling studies that make ex ante evaluations of the impacts of such measures being introduced are scarce. Crainic et al. presented an early example of a modeling study analyzing the impacts of a total ban on heavy trucks in Rome, using a system of satellite transshipment centers ( 9 ). This approach was developed using scarce available data and was still very aggregate in zoning and representation of the freight transportation system (vehicle types, shipments, and agents).
In a selection of Dutch cities, a reduction in emissions of 5% was expected from banning diesel trucks that were below Euro IV standards from entering the zone (from 2007/2008). But measurements of emissions before (2008) and in the 2 years after implementation of LEZ policies (in 2010) in the Netherlands showed that the decrease in traffic-related air pollution concentrations was insignificant ( 10 ). In most zones, Euro IV standard HGVs are still allowed; this limits the total reduction of emissions that can be accomplished.
As part of the Dutch National Climate Agreement, the largest 30 to 40 Dutch municipalities must introduce a medium-sized ZEZ for city logistics by 2025. Rotterdam is preparing the introduction of such a zone. This is expected to contribute significantly to improving and maintaining the livability of the city. In their Roadmap Zero Emission City Logistics ( 3 ) a transition scenario has been sketched for each city logistic segment. Accessibility needs to be ensured; ZEZs can only be introduced in combination with supporting city logistic services to provide accessibility for all entrepreneurs in the ZEZ. However, the projected growth of the city will increase the need for efficiency in city logistics. The analysis of policy measures to achieve this increase is another promising field of application for simulation models of urban freight transport.
Since fully restricted ZEZs have not been implemented yet, and modeling studies are scarce, there are several research questions that need to be answered to predict and better understand the impacts of the introduction of ZEZs. Here, we studied the impact of transition scenarios on freight demand patterns, the use and market share of new (ZE) vehicles, and their impacts on truck flow and emissions. These research questions were analyzed using a descriptive multiagent simulation model for urban goods transport. An advantage of simulation models is the opportunity to analyze a combination of potentially supportive policies ( 11 ).
Disaggregate Model for Urban Freight Simulation
Disaggregate multiagent models have the potential to make better predictions of urban freight measure impacts than aggregate models, considering the heterogeneity of agents and services in city logistics.
However, disaggregate simulation models that adequately address stakeholder-specific implications of urban freight policies at system level are still scarce. The earliest published study ( 9 ) into network level impacts of area restrictions for HGVs calculated the impacts of a ban for the city of Rome, but used aggregate data and gave no details in relation to freight transport demand (e.g., vehicles, shipments, agents).
A new generation of multiagent tools for evaluation of network impacts, simulates the behavior of individual firms (12–14). Some models are shipment based ( 6 , 15–20). In a different line of literature, specific segments or concepts are simulated with dynamic agent-based models ( 18 , 21 , 22 ). These models study the behavioral dynamics between and within agents (negotiation, learning) and are conceptually more complex, but often have poor empirical implementation or a scope too limited to provide valid predictions for impacts at network level or for the whole city logistics domain.
To contribute to this new generation, we have developed a multiagent tool for freight transport demand, following an incremental path. The approach simulates individual logistic agent behavior and is shipment based. The design principles are described in research by de Bok and Tavasszy ( 7 ) and by de Bok et al. ( 8 ). One of the most important challenges in developing multiagent simulation models for urban freight transportation demand is the collection of disaggregate data ( 17 ). Data collection is time- and cost intensive, but innovations and new ways of data collection are providing efficient ways to access disaggregate freight transportation data.
Analytical Framework
The Tactical Freight Simulator
TFS from the HARMONY project is a multiagent simulation model of urban freight transport demand, based on MASS-GT ( 7 , 8 ), which is multiagent, empirical, and shipment based. We developed a multiagent approach to explicitly address all stakeholders and the heterogeneity of all agents. Second, we used an extensive dense data set on freight transport, to simulate representative freight transport patterns and calibrate the logistical choice models. Demand was simulated at the unit of shipments, as this is a more realistic approach for how most logistic decisions are taken.
A manifold number of actors influence the decisions made on freight transport markets ( 18 , 21 ). The stakeholders in the model are policy makers, firms as producers and consumers of goods, and logistic nodes (distribution centers [DCs], and multimodal terminals from which carriers operate). The flows of shipments start from the production firms and are delivered to the consumers. These flows can either be direct or via one or more logistics nodes (DCs or transshipment terminals [TTs]). Along these, different logistic choices are made, such as vehicle type, distribution channel, shipment size, tour formation, and time-of-day choices. Producers, and in the case of outsourced transport, logistics service providers (LSPs), define the size of shipments and the choice of distribution channels. Carriers and LSPs with own-account transport form the tours and choose the type of vehicle. Finally, consumers set the time-of-day delivery requirements. Conversely, the supply of transport is covered by carriers, LSPs, and shippers with own-account transport. Although local authorities provide the transport infrastructure, they are not represented directly in TFS, but their policies and behaviors constitute part of the “what if” scenarios tested by TFS.
The core of TFS consists of two levels of logistic decision-making: long-term tactical choices, simulated in the shipment synthesizer, and short-term tactical choices, simulated in the scheduling module. These two core modules simulate freight transport demand at shipment level. In parallel, two modules simulate parcel demand. See Figure 1 for an overview of the TFS structure. It is designed to operate as a single simulator for urban freight demand, but it can work together with other simulators in the HARMONY model suite. TFS makes a network assignment of the truck flows to derive network intensities and emissions ( 23 ). It receives inputs from the strategic simulator on regional freight demand and a synthetic firm population, and the results are used in an operational simulator, for a dynamic simulation of individual vehicles on a part of the network microscopic assignment of vehicle movements.
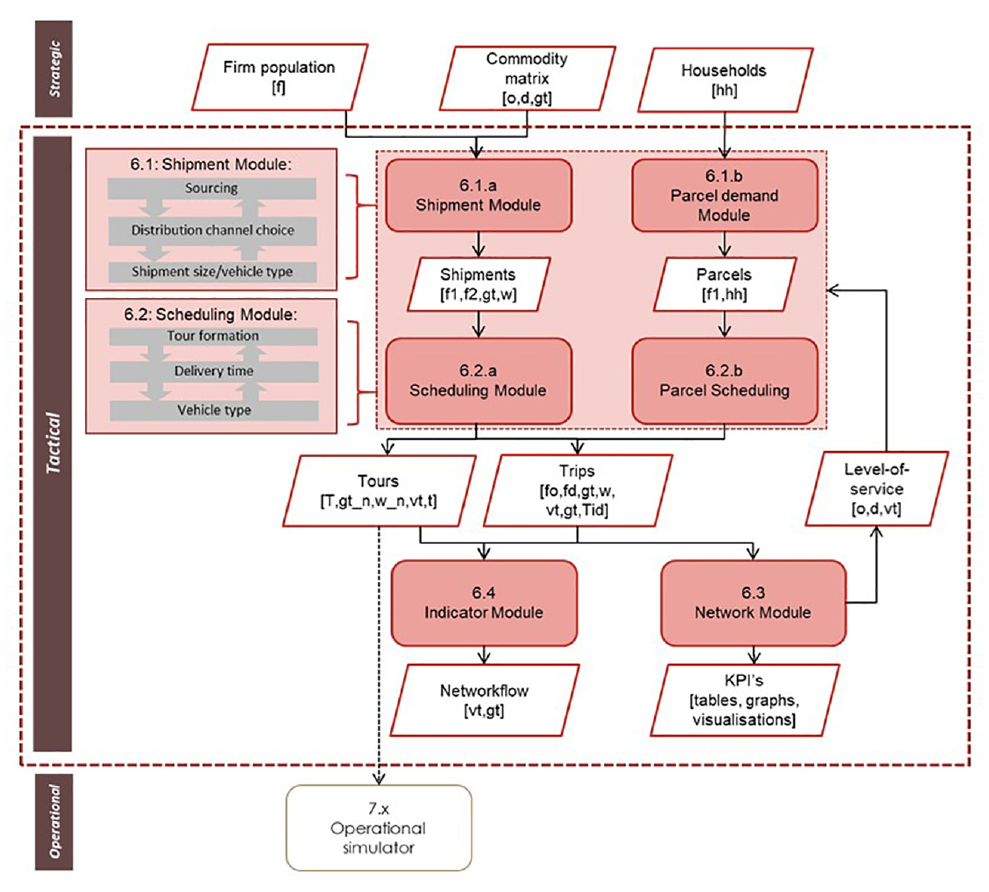
Technical structure of the Tactical Freight Simulator in HARMONY.
The shipment synthesizer simulates long-term tactical decisions. The module employs choice models to build, in a stepwise procedure, a set of shipments that are transported to, from, and within the study area. Several methods follow a bottom-up approach, calculating disaggregate freight demand at firm level ( 15 , 24 , 25 ); we followed a top-down approach from aggregate to disaggregate flows, such as used in the ADA-model ( 12 ), SimMobility Freight ( 6 , 26 ), or the freight demand model, FOCA ( 27 ). An advantage of using an external road freight commodity matrix as input, is the possibility to include scenarios with specific interregional impacts (e.g., modal shift, regional competitiveness). To predict shipments demand, TFS simulates the following logistic processes: sourcing, distribution channel choice, shipment size, and vehicle type. Choice of vehicle type and shipment size is simulated with a calibrated simultaneous choice model ( 28 ), based on economic order quantity theory. Distribution channel choice is simulated using observed market shares and the Monte Carlo simulation.
The scheduling module simulates the daily schedules for the delivery of all shipments that are transported to/from/within the study area. The module simulates tour formation and delivery times in a stepwise simulation . Tour formation is simulated with a shipment-based algorithm that consists of discrete-choice models calibrated on disaggregate data ( 29 ). Delivery times are simulated using observed delivery time distributions and the Monte Carlo simulation, similar to research by Sakai et al. ( 6 ).
TFS is also equipped with two auxiliary modules: the indicator module, used to calculate key performance indicators for transport and logistic efficiency; and the network module, which assigns freight traffic to the network and calculates emissions. Route choice information is first used to calculate generalized transport costs in the logistic choice models in TFS. In addition, truck assignment is used to perform a novel emissions calculation, considering the vehicle characteristics, the load of the vehicle, and the type of links along its path ( 23 ).
Study Area
TFS was first developed for the city of Rotterdam. It is, however, an open-source model created with the philosophy that it could easily be transferred to other metropolitan areas. The model version that was used in this study was upgraded to the study area of the province of South Holland (see Figure 2). This area is the most urbanized region in the Netherlands and has a population of 3.3 million, and 1.8 million jobs. One of the largest seaports in the world, the Port of Rotterdam is situated in this area. TFS simulates roughly 250,000 shipments and over 400,000 parcels on an average working day for this study area (within, inbound, and outbound).
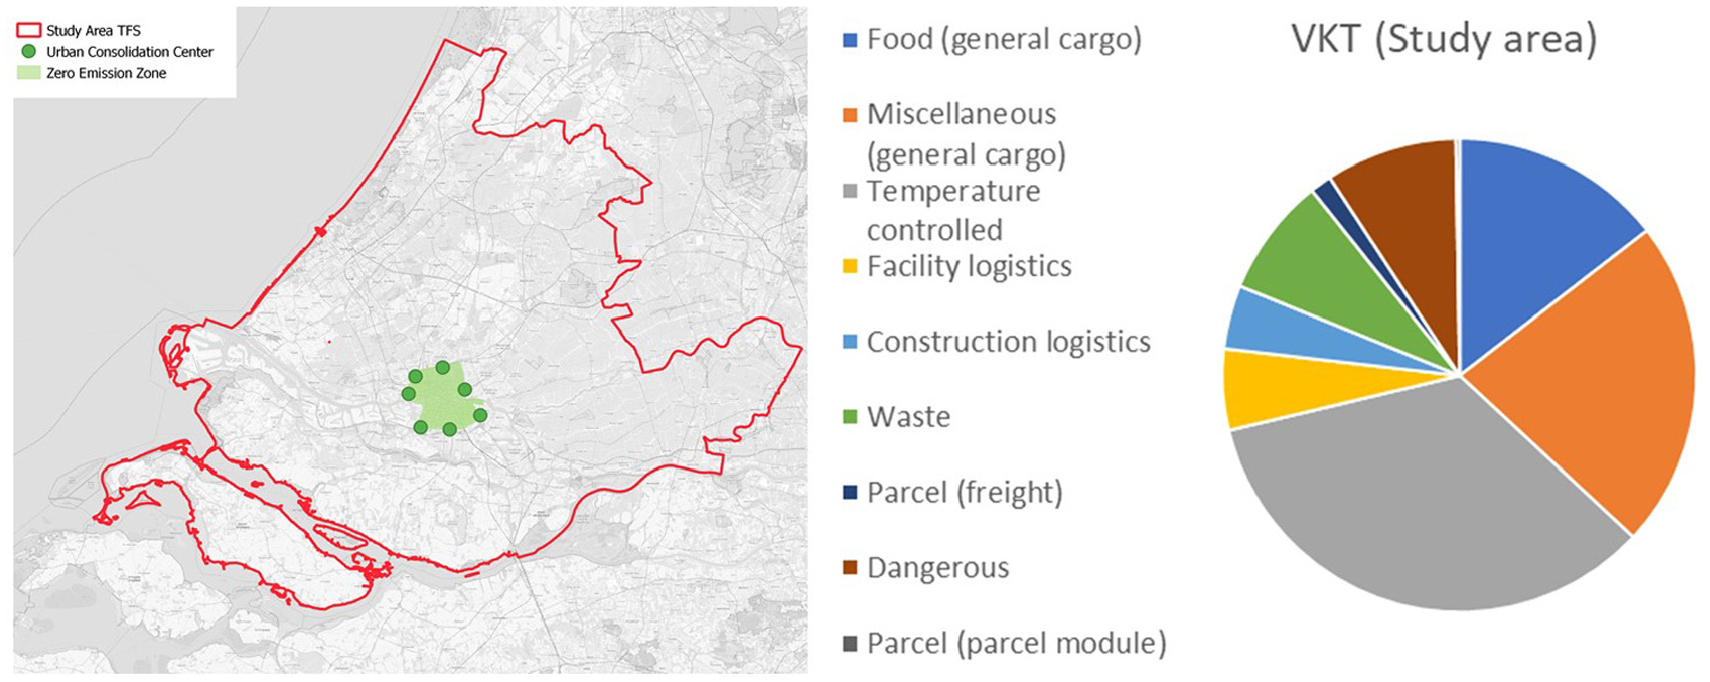
Study area (left) and share of vehicle kilometers by logistic segment (right).
It should be mentioned here that this is an initial version of TFS. The models described in this deliverable will be improved as the project evolves and is enriched by the planned data collection in the HARMONY project in the coming year.
Data Used
A multiagent simulation model such as TFS simulates freight trip patterns at the level of individual shipments and freight agents, which requires a large amount of disaggregate data for model development. This type of data is usually collected via truck trip diaries and carrier and shipper surveys; however, owing to the difficulties and high costs inherent in data collection, these data are scarce ( 17 ). Additional data sources include annual national statistics on commodity flows, transport statistics, and national account data.
For the development and calibration of the HARMONY shipment synthesizer we combined aggregate and disaggregate data from various sources. The primary data source applied in the shipment synthesizer was a large data set of truck travel diaries collected by the Netherlands Statistics Bureau (CBS). CBS applies an innovative XML-interface to automatically extract microdata from the transport management systems of transport companies. The trip diaries include information on vehicle type, route, commodity type, and the weight loading and unloading locations; however, they do not have data on the location of shippers and receivers of goods. The demand parameters for the parcel demand module were derived from publicly available statistics about the size of business-to-consumer and business-to-business parcel markets and the market share of LSPs ( 30 ).
The location of shippers and producers was synthesized using aggregate statistics from the Netherlands firm registration data (ABR) . The data on DCs and TTs were provided from two sources. The DC database was from Rijkswaterstaat (Directorate-General for Public Works and Water Management of the Netherlands) and contains over 1,600 registered DCs along with their six-digit address, size, and sectors. The TT database contains 54 TTs in the Netherlands. These data sets were used to enrich the CBS trip diaries with additional location information ( 31 ).
The regional commodity flow data were derived from the freight transport demand forecast of the Dutch strategic freight model “BasGoed” ( 32 ).
The different goods types were grouped into logistics segments that were expected to have similar transport profiles. In Connekt 2018 ( 33 ), logistic segments are defined “based on the characteristics of the firms in the supply chain and how the market is structured.” The rationale behind this classification was that firms belonging to the same logistics segment (ls) will have similar supply chains, and that transport between two segments cannot be combined. Eight logistics segments were defined:
(1) Fresh food (general cargo): All agricultural and animal products that do not need to be refrigerated.
(2) Miscellaneous (general cargo): The rest of the general cargo products.
(3) Temperature controlled: Goods that need to be transported in a temperature-controlled environment.
(4) Construction logistics: Materials transported from/to both large and small construction projects.
(5) Facility logistics: Transports related to maintenance of buildings.
(6) Waste logistics: Waste products of both business and residents.
(7) Parcel and express delivery.
(8) Dangerous logistics: Dangerous goods that require specialized handling.
In the Supplemental Material (Table A-1) we have assigned commodities (by NST/R code, a standard goods classification for transport statistics from Eurostat) to logistics segments. In the following section, descriptive statistics are provided for the share of each segment in vehicle kilometers in the study area.
Zero-Emission Scenario
The introduction of the ZEZ is part of the Green Deal Zero Emission City Logistics program that aims to reduce CO2 emissions and improve both air quality and accessibility in the city. Figure 2 shows the location of the ZEZ in the study area. A ZEZ implies restricted access to the city center, only allowing access to ZE vehicles, and consolidation of shipments in urban consolidation centers (UCCs) on the outskirts of the city. The use of UCCs effectively means adding a stage to existing supply chains ( 34 ). Each logistic segment has its own specific characteristics and will use different solutions. Parcel delivery services are likely to shift from vans to LECVs, whereas construction logistics are more likely to change the driveline of tractors from diesel to biofuel or hybrid drivelines. Marcucci and Danielis found evidence that some sectors are more likely to use the consolidation potential of UCCs: retail stores, for instance, are more receptive because they have lower delivery frequencies that are less time critical ( 34 ). Food shops and restaurants have higher delivery frequencies that are more time critical and, therefore, are less likely to accept an additional transportation leg in their supply chain.
The Roadmap Zero Emission City Logistics presents an expert-based description of likely shifts to ZE city logistics for each segment ( 3 ). These transition scenarios consist of two types of shifts (see Figure 3). The first is a shift from the conventional vehicle to vehicles with a ZE driveline, the second is a shift to a new ZE last-mile solution via UCCs. Distribution from these UCCs is undertaken using LECVs, such as cargo bikes or small vehicles with an electric engine, or electric vans.
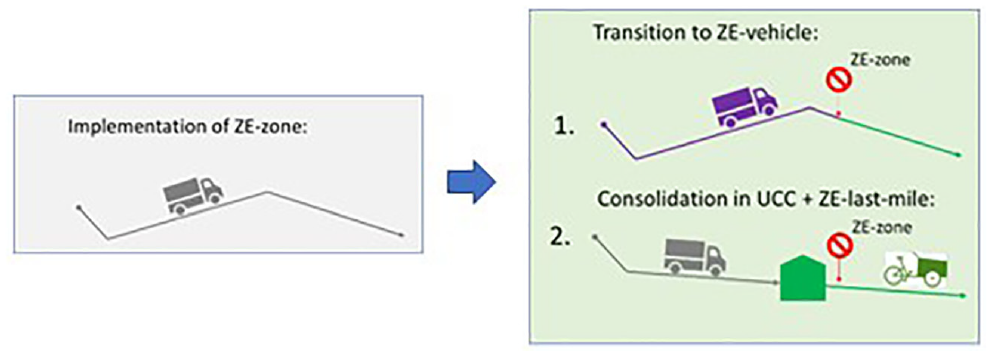
Implementation of transition scenarios.
In this case study we used the presented simulation model and made a scenario-based case study of the impacts of the transition scenarios presented in the Roadmap. This means that the expected transitions for each logistic stakeholder/segment were interpreted from the expert-based scenarios from the Roadmap. Strategic research questions for the implementation of the policy concern the dimensions of the ZEZ, the location of the consolidation hubs, and the impacts on freight demand patterns, vehicle use, and network impacts (emissions).
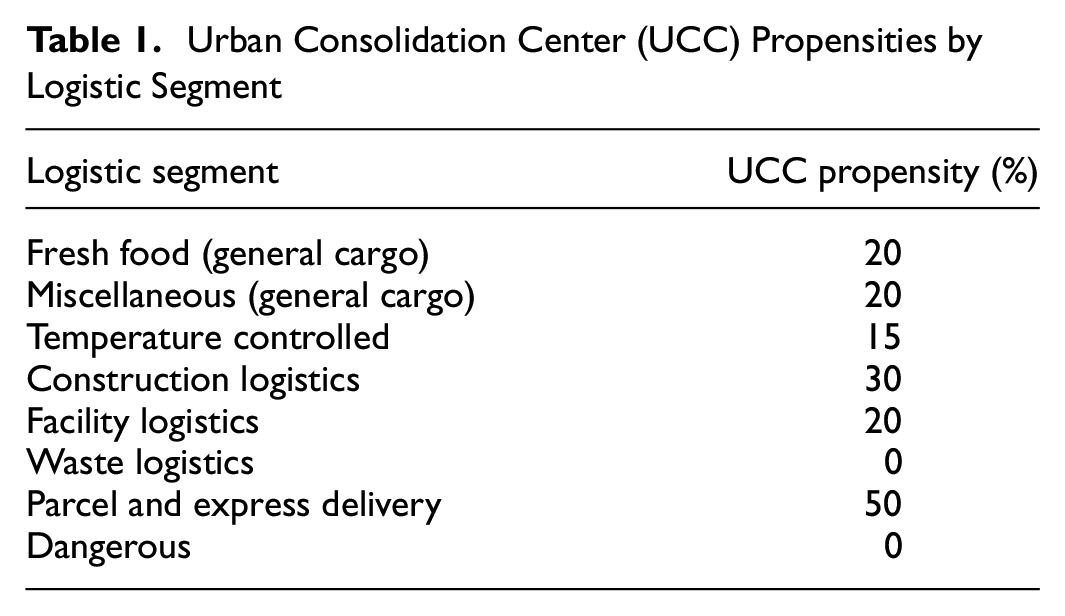
The most likely ZEZ boundary was just inside the highway ring around the city of Rotterdam. UCCs were planned at the edge of the ZEZ: seven possible UCC locations for last-mile deliveries were identified (see Figure 2). We reformulated the general definition of a UCC ( 35 ) to our specific case study as “a logistics facility that is situated in relatively close proximity to the ZEZ, from which consolidated deliveries are carried out within that area.” The UCC receives deliveries from a variety of suppliers. We also assumed that horizontal collaboration existed, and that shipments were assigned to the UCC based on proximity. The propensity to use a UCC as an alternative depends on the logistic segment ( 34 ). Table 1 presents the UCC propensity that was assumed in the transition scenario.
Urban Consolidation Center (UCC) Propensities by Logistic Segment
The second shift in the scenario involved transition from a conventional vehicle to a ZE vehicle. One of the solutions was the use of LECVs (cargo bikes or small vehicles with electric engines) or an electric van. These are effective solutions for many smaller volumes. However, as the carrying capacity is insufficient for larger shipments, many shipments would be carried by conventional vehicles but with alternative drivelines (e.g., electric, hybrid, or hydrogen). In this scenario we assumed that all transport that was not rerouted via a UCC but did (un)load in the ZEZ would make the switch to a hybrid driveline. Hybrid vehicles use an electric engine inside the ZE area, and switch to diesel powertrain outside the area: this way the vehicles still have a large operational range. Geofencing can be used to force the vehicles to use their electric engine inside the ZEZ. The most likely shift to silver bullet alternative vehicle or driveline depends on the logistic segment. Table 2 shows the assumed vehicle type shares for transport between the UCCs and ZEZ (and within the ZEZ) in the ZE scenario.
Zero-Emission Vehicle Type Shares per Logistics Segment
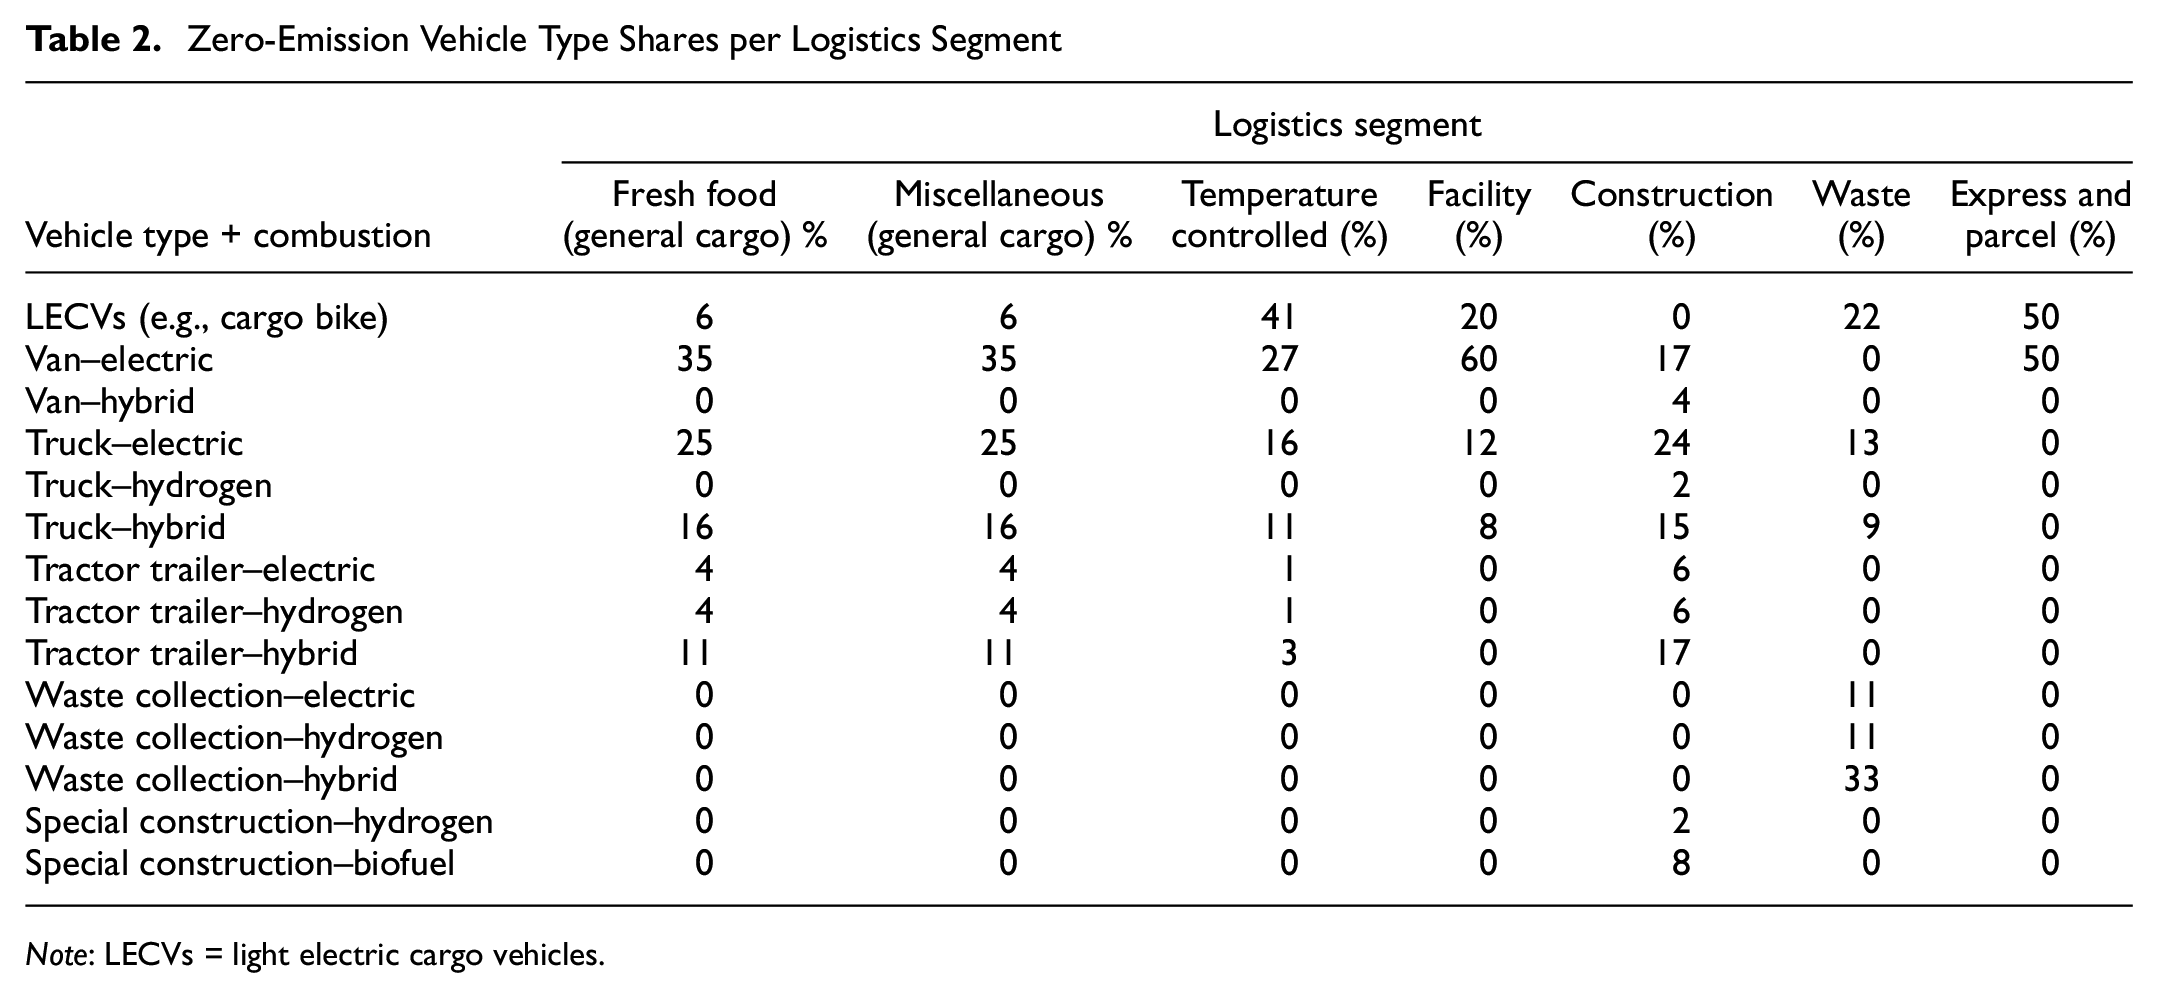
Note: LECVs = light electric cargo vehicles.
Results
The scenario was applied to the simulated shipments from the shipment synthesizer, the first module in TFS. Next, the scheduling module was run. The results were compared with a reference run of the situation before introduction of the ZEZ. In the reference scenario, 12,000 shipments and 61,000 parcels were transported per day to/from the area of the planned ZEZ. Figure 4 shows the simulated patterns of the delivered shipments. Part of the shipments from the external area (EXT) to the ZEZ was rerouted through the seven UCCs (in blue) and distributed/collected inside the ZEZ (in red). The other shipments were carried in the original tour, but using a ZE vehicle. This led to a small increase of 0.25% in the total vehicle kilometers traveled in the study area compared with the reference scenario. This was an unexpected but realistic finding, and can be explained by the extra leg that was added to the deliveries that were routed through the UCCs.
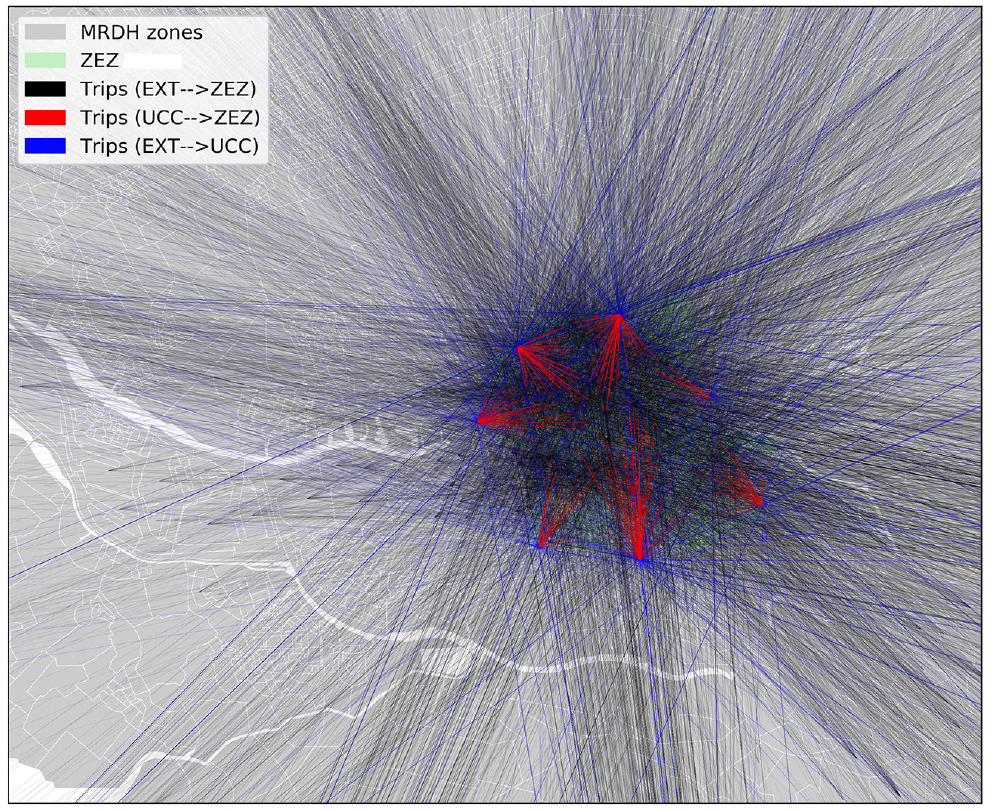
Impact of zero emission scenario on shipment patterns.
The transitions changed the composition of vehicle movements in the ZEZ. Figure 5 shows the evolution of the fleet kilometers by vehicle type before and after scenario application. New smaller vehicles such as e-scooters and electric cargo bikes make up for around 10% of the total vehicle kilometers because these types of vehicles were assumed as predominant vehicle types used for last-mile deliveries from UCCs. The results also showed that the composition of vehicles driving in the city center did not change dramatically. Of course, this was the result of the scenario assumptions: the Roadmap outlines how many shipments will be delivered using HGVs but with an alternative driveline type. This assumption is conditional on the availability of ZE- or hybrid vehicles. The outputs from these case studies could also be used to predict the number of vehicles required, to ascertain whether these numbers could be met by truck manufacturers. We assumed that carriers would use the available ZE- and hybrid HGVs in city logistics.
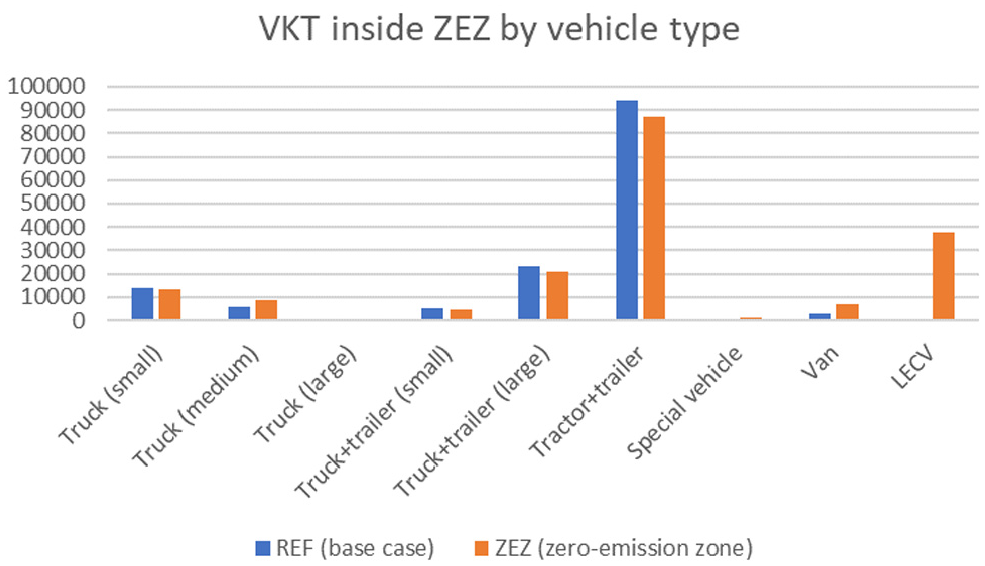
Vehicle kilometers by vehicle type before and after introduction of the zero-emission zone.
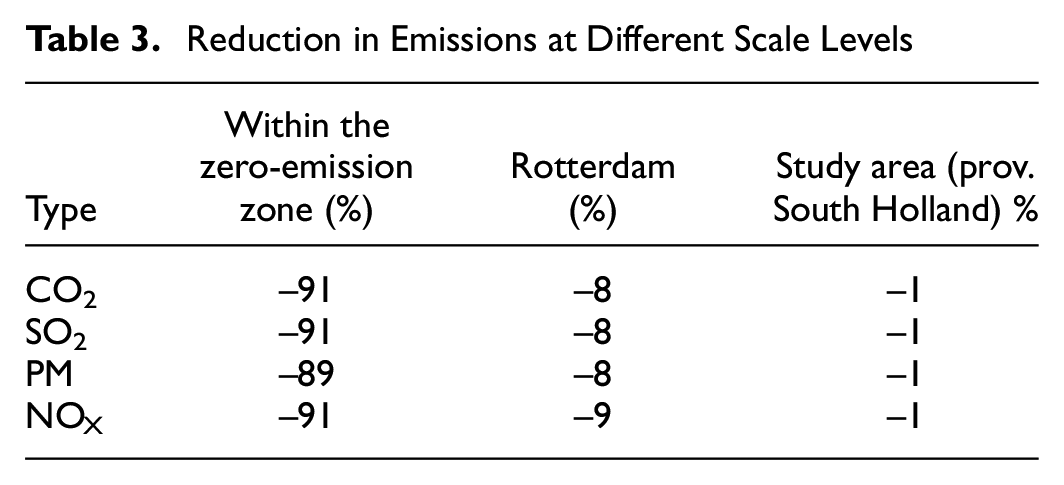
Emissions are calculated from the route of each freight trip: this means that the calculation can take into account not only the vehicle type and load, but the route as well (location, link type, congestion) ( 23 ). This is necessary for an accurate calculation of hybrid truck emissions that have ZE drivelines, based on their location. As expected, the implementation of the ZEZ led to a significant decrease in emissions within the ZEZ, as can be seen in Figure 6 and the totals presented in Table 3. All greenhouse gases (GHGs) had a 90% decrease inside the ZEZ and were reduced by almost 10% in the rest of the Rotterdam area. The results also showed that the reduction in impacts was very small at regional (or national) level. Most of the freight traffic in this study area was unaffected by the ZEZ. In the area of Rotterdam, most freight-related traffic is generated by the port and involves long-haul HGV transport that does not enter the city center: these transports remained unaffected. This case study showed that a ZEZ is not a silver bullet for reducing GHGs. Additional measures are required to reach more ambitious climate goals. Future case studies using the presented simulation model will address the effectiveness of a combination of measures, both at local and national scale.
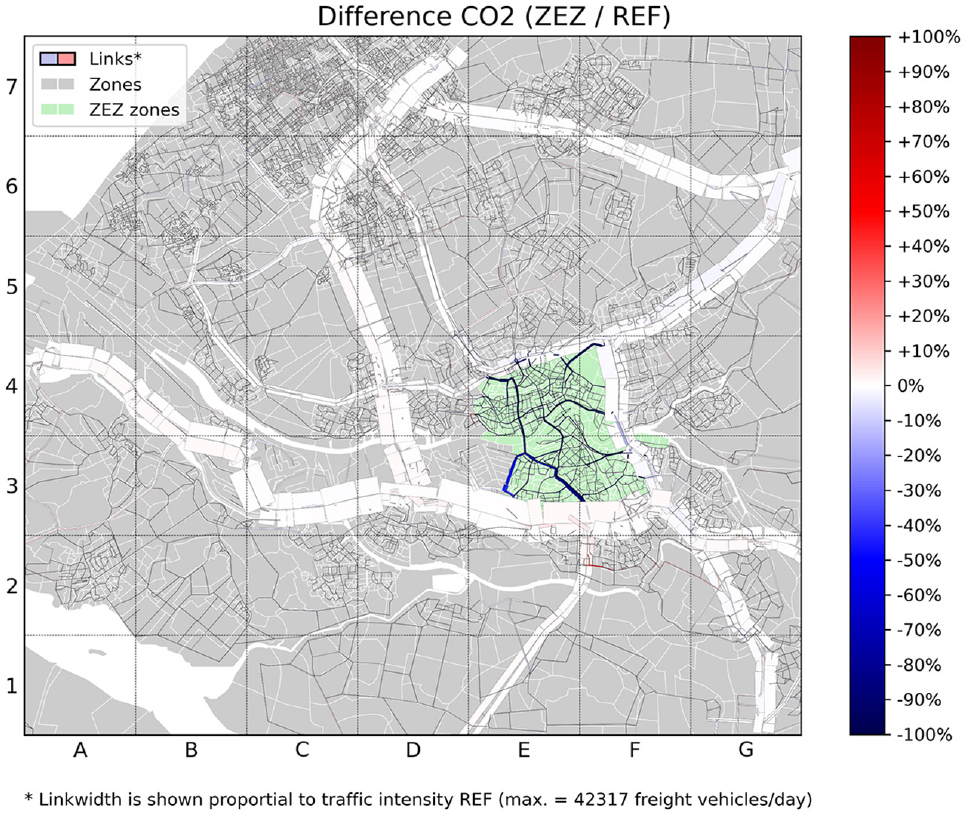
Change in emissions as a result of the zero-emission zone in Rotterdam.
Reduction in Emissions at Different Scale Levels
At this stage, the results of the application are largely affected by the scenario assumptions, however, the implementation still provides insights into the magnitude of the impact of the ZEZ in the study area.
Conclusions
This case study has shown that the impact of UCCs is not trivial: emissions within the ZEZ were reduced (because all transport used ZE vehicles) but we saw a small increase in vehicle kilometers traveled outside the ZEZ: +0.25%, which can be attributed to the rerouting of shipments through the UCCs. Calculations confirmed that emissions reduced dramatically, by 90%, inside the ZEZ. At the city scale this corresponds to a reduction of almost 10%, as most freight-related traffic is generated by the port and involves long-haul HGV transport that does not enter the city center. At a regional level, the reduction in impacts was very small. The city level impacts were significant and a good step toward the ambition of the current municipal coalition agreement to reduce CO2 emissions by 49% by 2030. However, to achieve this policy objective, more measures are needed, for instance measures to decarbonize long-haul freight transportation, which constitutes a large part of the emissions in the study area.
We also presented the effectiveness and potential of HARMONY’s TFS to address a complex ZE city logistics scenario, with UCCs and transitions in vehicle type. The level of detail in the multiagent model also permits assessment of different transition paths to ZE vehicles for each logistics segment, to better account for the heterogeneity in preferences of different actors. This provides a better empirical basis for informed decision-making on, for example, the planned size of a ZEZ, and in planning support for UCCs to ensure accessibility to all stakeholders.
The case study presented here shows the application of a scenario-driven approach. We underline that the results were, to a great extent, dependent on the scenario assumptions. Even though it was an expert-based scenario, the implementation in a microscopic freight simulator provided relevant insights into the magnitude of the impact of the ZEZ. These scenarios can and will be further developed by collecting the data and preferences of stakeholders in the study area. Surveys will be carried out to further analyze the transition paths to ZE vehicles per logistics segment, and the preferences of stakeholders in relation to the propensity to use UCCs and new last-mile solutions.
Supplemental Material
sj-docx-1-trr-10.1177_03611981211012694 – Supplemental material for Simulation of the Impacts of a Zero-Emission Zone on Freight Delivery Patterns in Rotterdam
Supplemental material, sj-docx-1-trr-10.1177_03611981211012694 for Simulation of the Impacts of a Zero-Emission Zone on Freight Delivery Patterns in Rotterdam by Michiel de Bok, Lóránt Tavasszy, Ioanna Kourounioti, Sebastiaan Thoen, Larissa Eggers, Victor Mayland Nielsen and Jos Streng in Transportation Research Record
Footnotes
Acknowledgements
The authors are grateful for the valuable feedback of four anonymous reviewers.
Author Contributions
The authors confirm contribution to the paper as follows: study conception and design: M. de Bok, L. Tavasszy, I. Kourounioti, S. Thoen, J. Streng; data collection: M. de Bok, I. Kourounioti, S. Thoen, L. Eggers; analysis and interpretation of results: M. de Bok, S. Thoen, L. Eggers, V. Nielsen; draft manuscript preparation: M. de Bok, I. Kourounioti. All authors reviewed the results and approved the final version of the manuscript.
Declaration of Conflicting Interests
The author(s) declared no potential conflicts of interest with respect to the research, authorship, and/or publication of this article.
Funding
The author(s) disclosed receipt of the following financial support for the research, authorship, and/or publication of this article: This project received funding from the European Union’s Horizon 2020 research and innovation program (grant agreement no. 815269).
Supplemental Material
Supplemental material for this article is available online.
Any interpretations or opinions expressed in this paper are those of the authors and do not necessarily reflect the view of the European Commission, Delft University of Technology, or the City of Rotterdam.
References
Supplementary Material
Please find the following supplemental material available below.
For Open Access articles published under a Creative Commons License, all supplemental material carries the same license as the article it is associated with.
For non-Open Access articles published, all supplemental material carries a non-exclusive license, and permission requests for re-use of supplemental material or any part of supplemental material shall be sent directly to the copyright owner as specified in the copyright notice associated with the article.