
Abstract
Planned service disruptions (PSDs) of light rail transit (LRT) improve service reliability, extend infrastructure’s life, and reduce the frequency and impact of unplanned service disruption caused by system failure. However, the literature on the impact of LRT PSDs on transit customers’ travel mode choice behavior is scarce relative to that on unplanned service disruptions. This study aimed to investigate transit customers’ mode choice behavior in response to short-term LRT PSD in the City of Calgary, AB, Canada. A stated preference survey was designed to gather respondents’ mode choices under a set of hypothetical scenarios. A mixed multinomial logit model was estimated using stated preference data. Findings of this study include: (i) stated LRT ridership dropped by about 35% during the examined short-term LRT service disruption; (ii) transit customers who hold a LRT payment pass (monthly, subsidized seniors, low income, and students) and are frequent weekend LRT users are more likely to stay with the LRT mode in case of short-term PSD; (iii) the value of time for transit users during short-term LRT PSD was found to be 11.76 $/h and 13.0 $/h for travel time (excluding wait time) and wait time during travel, respectively. A sensitivity analysis was conducted on key variables to predict choice probabilities of transit alternatives. Recommendations are made to improve Calgary Transit customers’ experience during short-term LRT PSDs.
Transit service disruption can occur for a variety of reasons in a transit network. The cause of disruption can range from a broken part on a transit vehicle to a failure of the entire transit system. Transit users suffer because of these disruptions. Problems with transit service disruption are common in large cities throughout the world and can have significant long-term consequences. Previous studies have shown that frequent transit disruptions, prolonged transit disruptions, or both, increase costs for transit agencies, reduce commuters’ trust in the service, and cause commuters to switch to other modes ( 1 ).
In mass transit systems, such as bus rapid transit (BRT), light rail transit (LRT), or subway/metro that run on dedicated infrastructure, service disruptions are generally of two types: planned and unplanned. Unplanned service disruptions happen suddenly as a result of natural disasters, accidents, track failure, and vehicle breakdown. Planned service disruptions (PSDs) can be introduced to perform scheduled maintenance or upgrade work. PSDs are an important part of regular maintenance that aims to avoid potential future system failure, which could result in severe frequent unplanned disruptions, longer unplanned disruptions, or both. Thus, PSDs help increase the service life of mass transit systems and result in more reliable and resilient service. PSDs require a transit system to be closed at one or multiple sections. Along the disrupted section(s) of transit network, a replacement service, most commonly bus bridging ( 2 ), is provided to connect the transit route. Transit users are notified few days in advance of PSDs, so that they can adjust their travel plans accordingly.
The duration of LRT PSDs can vary from hours and days to months and years depending on the nature of the maintenance or upgrade. This study focuses only on short-term LRT PSDs that last up to three days and are scheduled on weekends. Short-term PSDs may involve small maintenance tasks, for example signals, communication, and track and ballast replacement. PSDs are scheduled during non-revenue service hours (e.g., nighttime) to avoid any impacts on transit service. However, if there is an urgent need to schedule these PSDs during regular service hours, then such PSDs can be considered to be accommodated on weekends when ridership demand is significantly lower than on weekdays.
Because of the relatively short notice, some transit customers may experience inertia and make no change in their trip plans, enduring the additional delays associated with the short-term PSD. Conversely some travelers may alter their plans significantly, choosing an alternative mode, rescheduling the trip, or cancelling it altogether. In all cases, PSDs negatively affect passengers’ travel experiences and result in a decrease in customer satisfaction. There is a need for transit agencies to understand the short-term impacts of PSDs on transit customers’ behavioral choices. This understanding can be used to devise new replacement services that can improve customers’ travel experiences.
While passengers’ responses to unplanned disruptions of transit networks have been extensively studied, the literature on planned disruption, in particular those of short duration, remains relatively scarce ( 2 ). To the authors’ knowledge, no prior studies examine how transit customers’ experiences can be improved during short-term LRT PSDs. Improved understanding of customers’ behavior and attitude is crucial for improving the replacement services to account for passenger preferences during short-term PSDs.
The objective of this study is to investigate LRT users’ travel mode choice preferences during short-term LRT PSDs. A stated preference (SP) survey was designed to collect information on passengers’ behavioral mode choice responses under a set of hypothetical short-term LRT PSDs in the City of Calgary, AB, Canada. A mixed multinomial logit model was estimated using the collected data. Sensitivity analysis was conducted on key variables to predict partipants’ mode choice probabilities with respect to changes in transit fare, carshare fare, and wait time at transfer station for express shuttles. The findings of this study improve understanding of transit passenger’s choices under short-term PSDs and shed light on the factors that contribute to ensuring a customer-focused transit replacement service.
The rest of this paper is structured as follows. The next section summarizes the relevant literature. Next, the research methods, study scope, data collection and model formulation are described. The model results, sensitivity analysis and recommendation follow. Finally, conclusions and suggestions for future work are provided.
Literature Review
As noted above, there is little literature examining short-term PSDs. Conversely, there are a few studies looking at the impacts of long- and medium-term LRT PSDs on transit customers’ travel choice behavior. To the best of the authors’ knowledge, no previous study has examined the impacts of short-term LRT PSDs on transit customers and on their mode choice behavior
While transit agencies consider the costs associated with LRT replacement service (e.g., bus bridging) under LRT PSDs, they still do not pay enough attention to the impacts of these types of service disruptions on customers ( 2 ). Negative impacts of service disruptions on transit customers may include extra travel time and cost, in addition to inconveniences such as additional transfers, walking, wayfinding, rescheduling, and cancelling trip ( 4 ). Mode choices are influenced by the decision maker’s current and past positive or negative experiences with different travel modes ( 3 ). It is evident from previous research studies that frequent LRT disruptions, prolonged LRT disruptions, or both, have high costs for transit agencies. These costs can include reduced trust in the service and lost ridership from customers switching to alternative commuting modes ( 1 ).
Bernal et al. ( 4 ) studied the impacts of slow zones (slow speed subway/LRT service provided as a result of planned maintenance) on customers’ experiences and their travel choice behavior. They found that transit customers’ satisfaction declines because of presence of slow zones of longer duration and they may cause a temporary or permanent ridership drop. Also, based on automated fare collection data, they concluded that loyal transit customers are more likely to switch to other modes of commute as a result of prolonged delays of subway service than other transit users ( 5 ). Yang ( 6 ) studied the impact of a year-long transit PSD on ridership. Revealed preference and SP survey data were used for before, during, and after analysis of the disruption on Washington Metro caused by track maintenance work. Yang found that about 30% of customers chose alternative modes during disruptions and only about 10% returned to transit after the disruption was over. Anderson ( 7 ) conducted a study to evaluate impacts of a planned subway disruption on a parallel road network. The author developed a choice model using data from a strike by Los Angeles transit workers resulting in closures of the bus and metro services. Average delay on highways, caused by the subway service closure, increased by up to 47% because of transit customers who switched to alternative modes.
Downward et al. ( 8 ) examined transit customers’ route choice behavior through an SP survey in Auckland, New Zealand, during a network-wide transit routes modification exercise. They found that customers prefer direct routes over ones that involve transfers, unless the service is reliable and transfer wait time is short. Weis and Axhausen ( 9 ) conducted a combination panel and SP survey in Zurich, Switzerland, and found that inducing travel time changes in transit trip causes inconveniences to passengers which include adjusting their departure time, switching modes, canceling or rescheduling their trips, changing the order of their daily activities, or any combination of these. Srikukenthiran and Shalaby ( 10 ) developed a simulation model of the mass transit network of Greater Toronto Area, Canada, to analyze network-level impacts of transit disruptions on service. They tested the impacts of transit service disruption duration on passenger crowding levels at stations and found that mitigation solutions, for example, directing passengers to certain routes via announcement, are important to minimize impacts before the crowding levels become dangerously high. Barron et al. ( 11 ), studied investment models of 22 transit agencies related to mitigation strategies in response to disruptions of LRT and subways. They concluded that agencies that focus on reducing passenger delays during transit service disruptions are perceived as the more reliable and they gain higher customer satisfaction ratings.
Providing improved bus bridging services during service disruptions was the strategy suggested by many studies. Christoforou et al. ( 2 ) studied the impact of PSDs caused by railway line maintenance work, in Paris, France. This study presented a new methodology for evaluating bus bridging as a disruption mitigation strategy by estimating the generalized cost (travel times, comfort, and level of service) of the disruption to passengers. The results of the before-after scenario evaluation in the study suggested that an increase in the frequency of the bus bridging service and potential alternative transit routes significantly lowers the customer’s generalized cost in the whole transit network. Saxena et al. ( 12 ) compared impacts of delayed (e.g., slow zones) and disrupted (bus bridging) transit service. They found that transit customers are less likely to choose disrupted service compared with delayed LRT service during incident, and find a disrupted service to be three times more onerous than a delayed service. They also recommended providing an express shuttle bus service between large transit stations and a limited stops service between small transit stations.
The methods used in previous studies to capture the perceptions of affected customers were mainly based on travel behavior surveys ( 13 ) or observed data as reflected in automated fare collection ( 4 ). More recently, new methods have emerged using micro simulation tools augmented with transit customers’ behavior modules ( 10 ) and passive data collected from personal cell phone and WiFi technology ( 14 ). These emerging tools require significant calibration, large data, or both.
While the above literature provides insights into the impacts of transit disruption on passengers’ travel behavior, it does not capture the customers’ perceptions of short-term LRT PSDs and the impact of short-term PSDs on ridership. This paper takes steps in this direction.
Method
In this study, a comprehensive survey was designed to collect information about transit users’ experiences during PSDs. In the first section of the survey, questions were asked about participants’ travel experience during PSDs and their perception of advance notification practice provided by the local transit agency about upcoming LRT PSDs. The second part of the survey consists of the SP questionnaire, designed to understand LRT users’ travel mode choice and behavioral responses to short-term PSDs
Study Area
Data for this study were collected for the LRT system in Calgary. Calgary is the third largest municipality in Canada (after Toronto and Montreal) and the largest city in the province of Alberta. Calgary Transit is the transit service provider in Calgary. Calgary Transit’s rapid transit system consists of BRT (known as MAX) and LRT (CTrain) services. Two CTrain lines (the Red and Blue lines shown in Figure 1) are the backbone of Calgary’s transit system and carry over 300,000 customers daily.
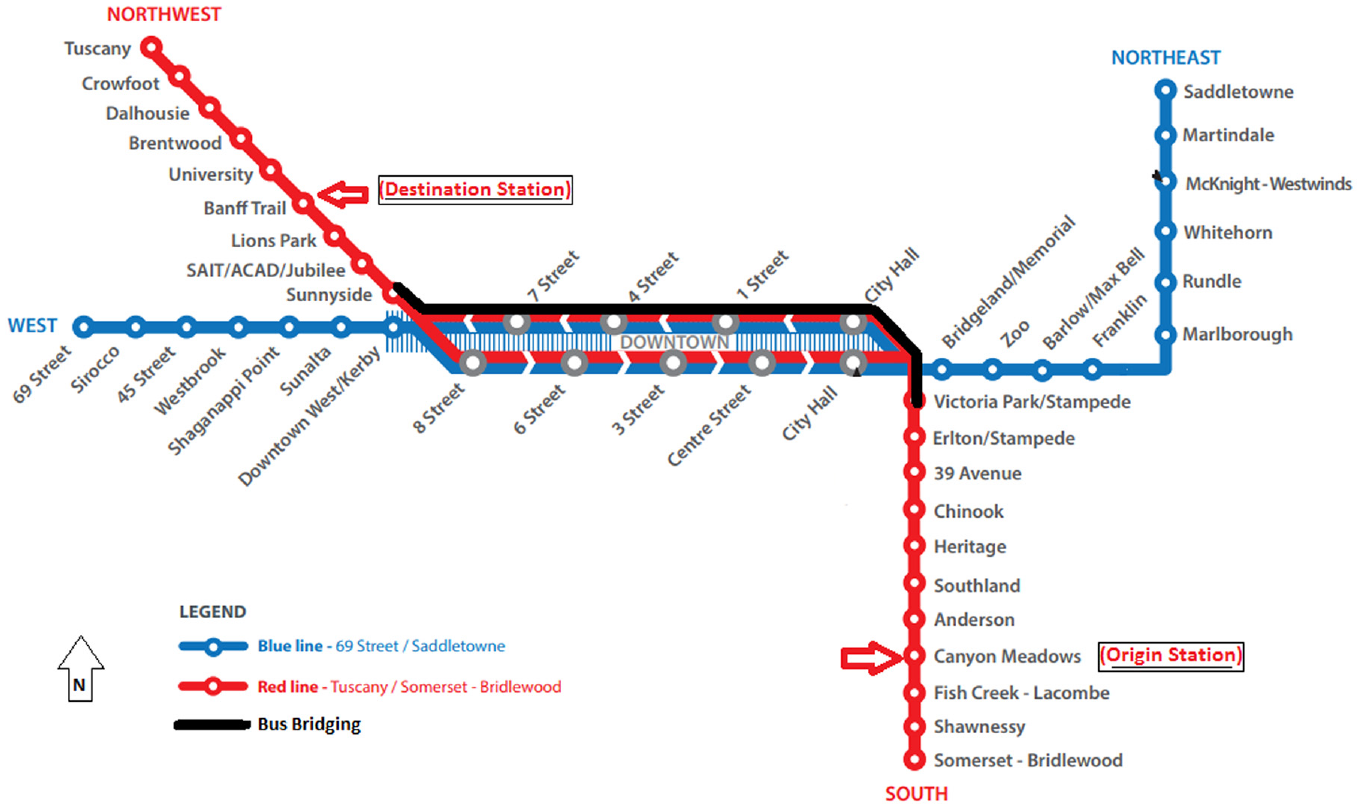
Light rail transit (LRT) route and disrupted section along the LRT line, provided as hypothetical scenario.
Calgary’s LRT is an old system; one or more of the sections of the LRT line are regularly subject to maintenance, upgrade, or life cycling of various infrastructure components. Calgary Transit tries to cause the minimum inconvenience possible to its customers; so, based on maintenance work requirement, sometimes these PSDs are scheduled during weekends or long weekends at the cost of causing inconvenience to fewer passengers than on weekdays. Information on these upcoming short-term LRT PSDs is provided in advance to transit customers by multiple means such as displaying notices at all LRT platforms, transit websites, social media, radio, and via emails to subscribed transit customers. The regular LRT service is suspended along these closed sections and a replacement service is usually provided to transport transit customers from one end of the disrupted LRT line to the other. Usually, this replacement service is bus bridging (a shuttle bus service stopping at the same stops as the LRT stations). During PSDs, LRT users traveling through the disrupted section transfer from LRT onto the shuttle bus service and then transfer back to the LRT to continue their travel.
Survey Design
In this SP survey, a hypothetical scenario was presented which consists of a general-purpose trip on a pleasant weekend in fall/summer, during a short-term PSD on the Calgary LRT between two stations about 4.5 km apart. In the scenario, a shuttle bus service is provided to bridge the gap of the disrupted section. Figure 1 shows the route provided in the hypothetical trip and the disrupted section along the LRT line in Calgary.
Each alternative included in the SP design was described with various attributes. Each attribute had different possible levels, as shown in Table 1. The cost of all modes was fixed except carsharing which adds costs if participants use it along the disrupted section of LRT. Two cost levels exist for the carsharing mode as the cost may vary with time of day and demand. In-vehicle and in-LRT travel time attributes were defined with two levels each to consider travel time unreliability caused by traffic congestion on roads and variability caused by station dwell time at different times of day. Wait time at transfer stations was defined by three levels for LRT alternatives and by two levels for transit bus alternative. As the same fixed transit route is presented to all the survey participants, a single level for number of transfers was used.
Alternatives, Attributes, and Levels Considered in the Stated Preference Survey
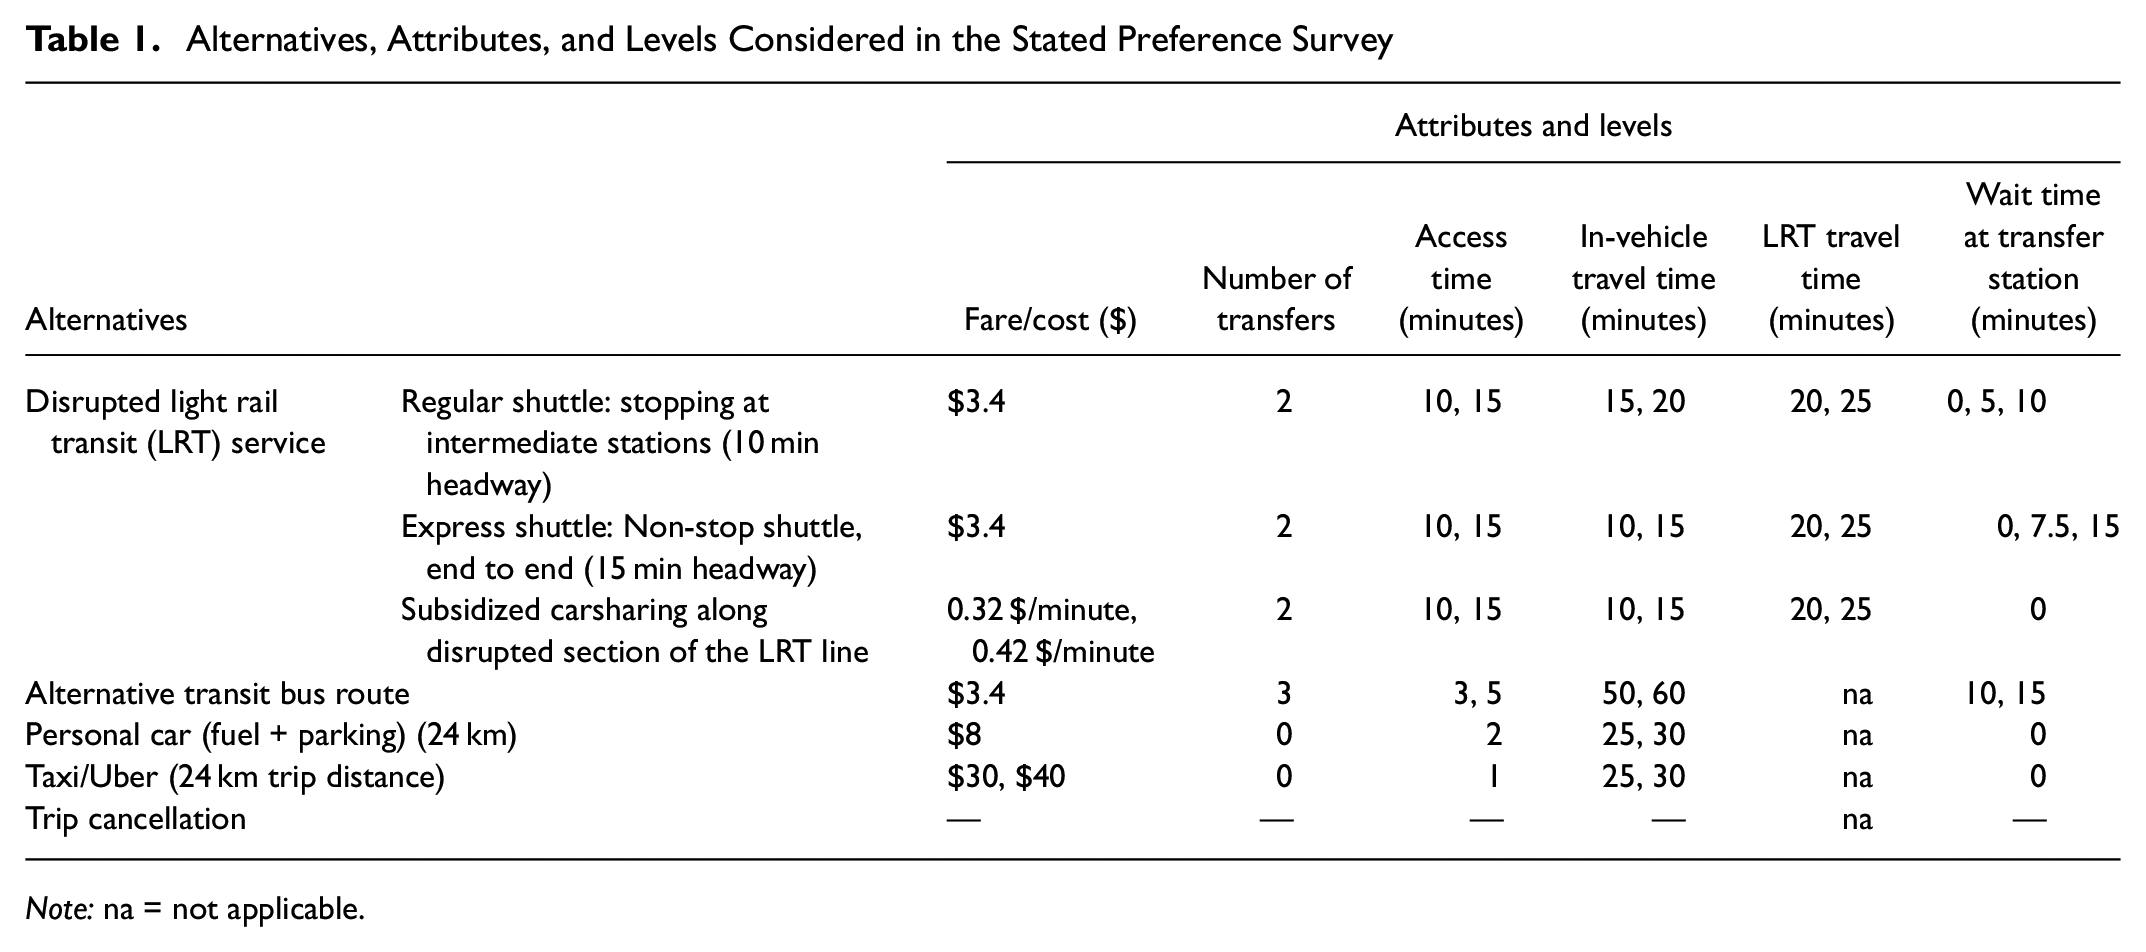
Note: na = not applicable.
Sample Description Statistics
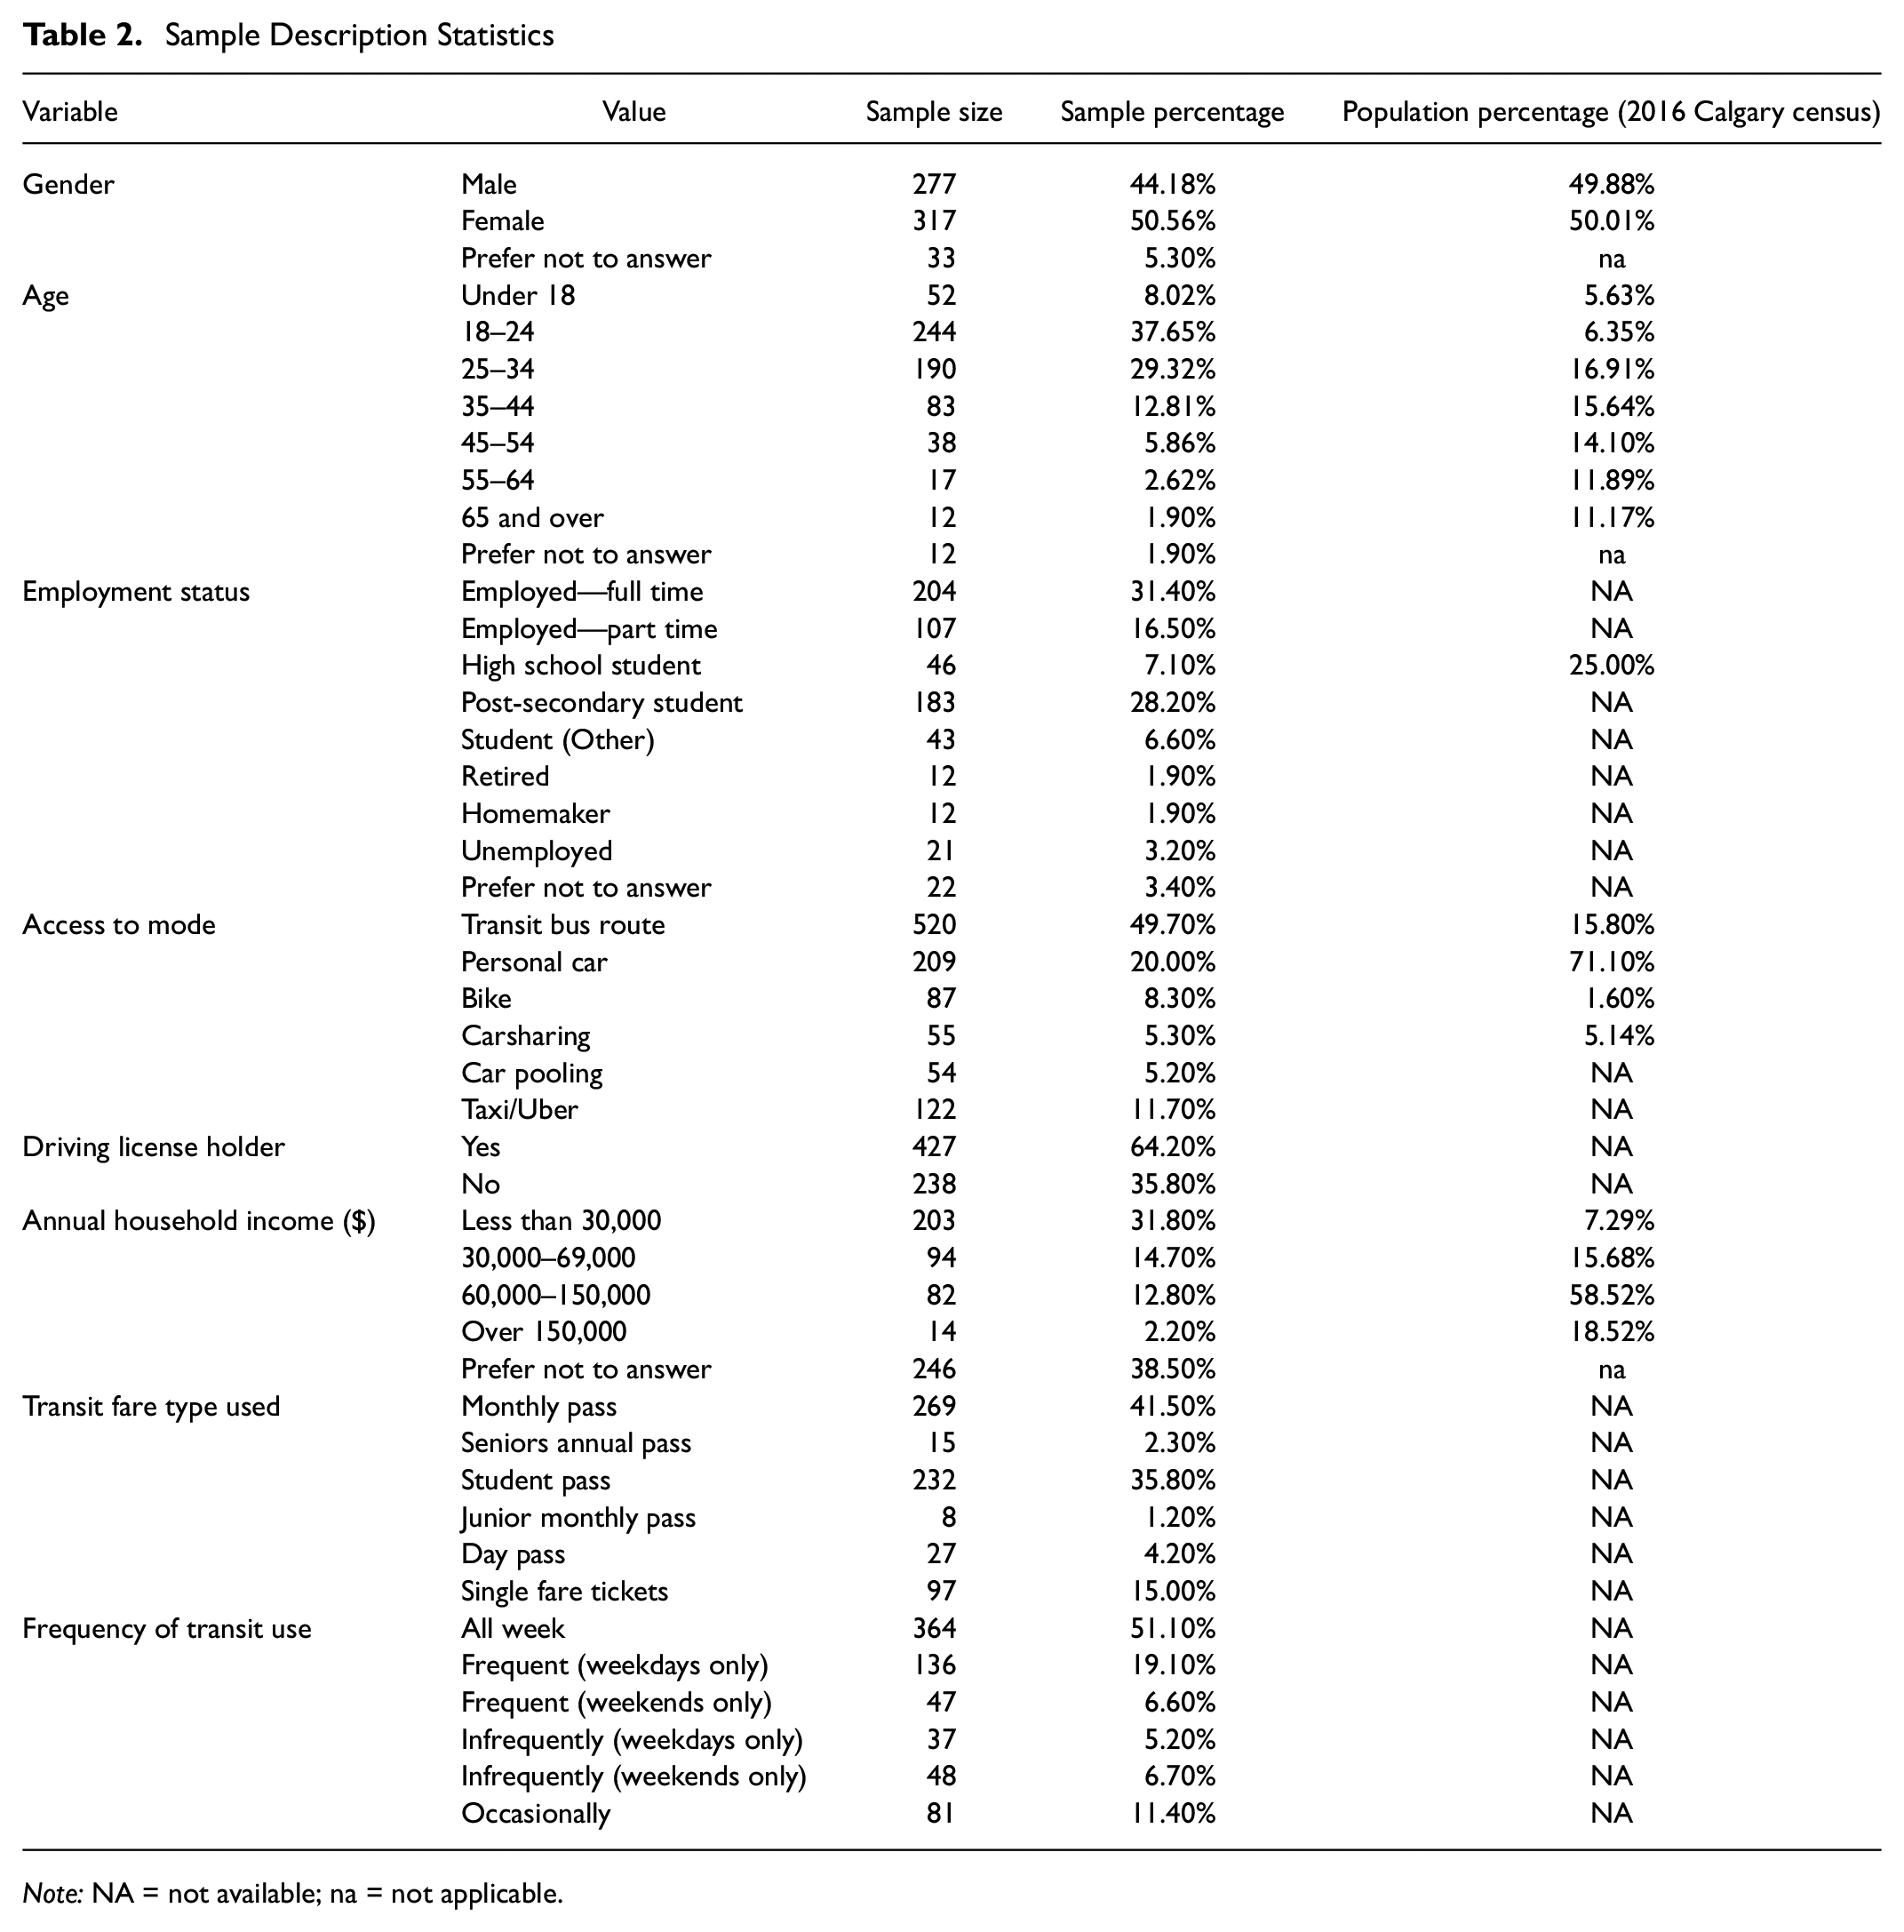
Note: NA = not available; na = not applicable.
Bayesian efficient design was used to generate choice situations with various combinations of the parameter levels, using Ngene software ( 15 ). Bayesian efficient design generates a range of potential values for parameter estimation and is used when no prior information on parameter values is available. For this study, a uniform distribution with assumed lower and upper bounds and an intuitive sign was used for the parameter priors. Walker et al. ( 16 ) found that without some confidence in the priors being used, standard efficient design may perform worse than random factorial design. As a result, they recommend utilizing a Bayesian efficient approach to survey design.
Three choice contexts were developed as the survey respondents may or may not possess a driver’s license, have access to a personal car, or both. Choice context-1 was presented to the participants who did not possess a valid driver’s license, so they could not use the personal driving and carsharing alternatives. Choice context-2 was presented to the participants who possessed a driver’s license but did not have access to personal vehicle for this trip, so they cannot use the personal vehicle alternative though they could still use the carshare option. Choice context-3 was developed for the participants who possessed a driver’s license and had access to a personal vehicle, so they had all the modal options available to them.
Twenty-four choice scenarios were generated for each choice context, which were then divided into four blocks of six choice scenarios each. The survey was designed using the Qualtrics online survey platform. Qualtrics was set up to pick randomly (with equal chance for each choice scenario) six choice scenarios out of 24, for participants based on their choice context. For every choice scenario, the survey respondents were asked about their confidence level of making that choice. Figure 2 shows an example of a choice scenario presented to participants in this survey.
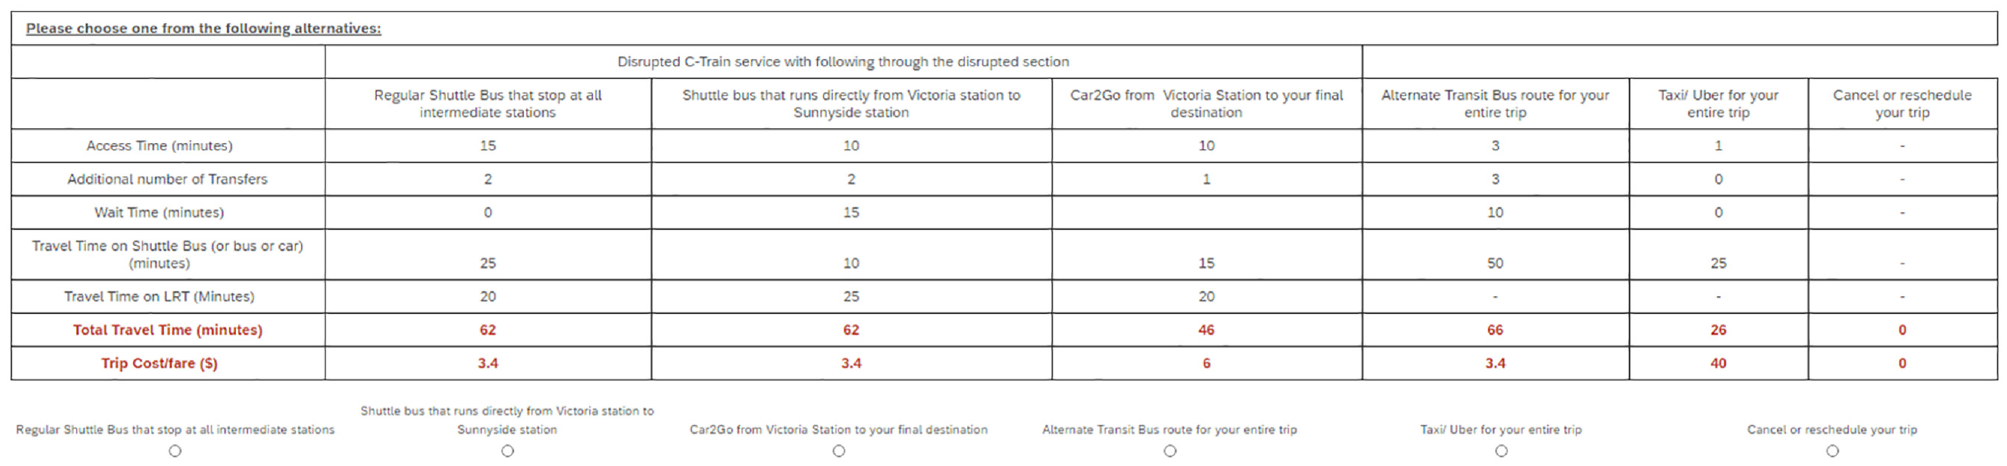
Example of a choice situation presented to participants in the stated preferences survey.
The survey also collected socioeconomic information and trip habits of participants including gender, age, occupation, employment status, driving license possession, car ownership, access to various modes, household income, LRT trip frequency, and possession of monthly/student/senior transit pass.
Data Collection and Descriptive Statistics
A convenience sampling method of data collection was used. Census data and household travel surveys data are not exclusive for weekday and weekend trips. However, the sample frame was not the general population of Calgary, but instead only individuals who have experienced this type of short-term PSD in the past. This suggests that, although the choice-based sample is not representative of the general populace, it is much harder to asertain the representativeness of the sample for the particular recruitment criteria used in this study.
The survey invitation cards, containing a weblink to the online questionnaire, were distributed to LRT users at the affected LRT stations during all short-term CTrain PSDs that occurred on weekends from September 7 to October 26, 2019. The survey invitation was also distributed electronically. Only the participants who had used the CTrain service during a short-term planned disruption in the past were recruited in this survey. Participants provided informed consent to participate in the study which was approved by the Research Ethics Board at the University of Calgary.
The participants in this survey comprised 926 individuals of age 15 years and above (the minimum age required for working in Alberta is 14 years). The majority (67%) of the participants were between 18 and 34 years. With regard to gender, 51% of participants stated they were female, 44% male, and the remainder preferred not to answer. Table 2 presents descriptive statistics of individual-related parameters. Out of 926 participants, 631 completed the SP portion of the survey.
With regard to market share, transit modes were the top three most chosen (76%). More than half of the respondents (63%) chose not to switch from the CTrain. Most of these chose express shuttle bus (30%), followed by regular shuttle bus (27%), and carsharing (6%) along the disrupted section of the CTrain line. About 13% of the respondents chose the alternative bus route. A large majority (85%) of the respondents were extremely (44%) or moderately (41%) confident in choosing their preferred alternative in the survey.
Choice Modeling
In discrete mode choice problems, decision makers presented with all feasible alternatives are assumed to choose the alternative that maximizes their individual utility. Utility is an indicator of value of an alternative to a decision maker. The utility function consists of an individual’s characteristics and attributes of feasible alternatives. Equation 1 shows the utility of alternative “j” to a decision maker “i.” It consists of an observed/systematic portion of the utility Vij, and an unobserved/error portion of the utility εij. For estimation of the discrete empirical model, the systematic portion is represented with coefficients β and variable X.

The random error term εij is assumed to follow a Gumbel distribution and leads to the formulation of the multinomial logit (MNL) choice model as shown in Equation 2. The probability of choosing mode “j” out of total number of available modes K is given as function of total systematic utility Vij of all available modes.

The MNL model assumes preference homogeneity, which is a simplifying assumption. In reality, different members of the population perceive modal attributes differently. One method for accounting for this heterogeneity is the random parameter mixed logit (RPML) formulation. In a RPML the

The MNL model was estimated using BIOGEME 1.8 ( 18 ) with observations from 631 participants. All alternative specific and potential explanatory variables were tested for significance at a 95% confidence interval. Table 3 shows the final empirical estimated model. As expected, travel time, wait time, and travel cost parameters have a negative influence on the utility of the mode choice. The wait time coefficient during travel was shown to be greater than the in-vehicle travel time. This aligns with previous studies which show that customers value their wait time (out of vehicle) more than their in-vehicle travel time ( 19 ). The estimated cost parameter is normally distributed (mean: −0.102, standard deviation: 0.0743).
Stated Preferences Mixed Multinomial Logit Estimated Model
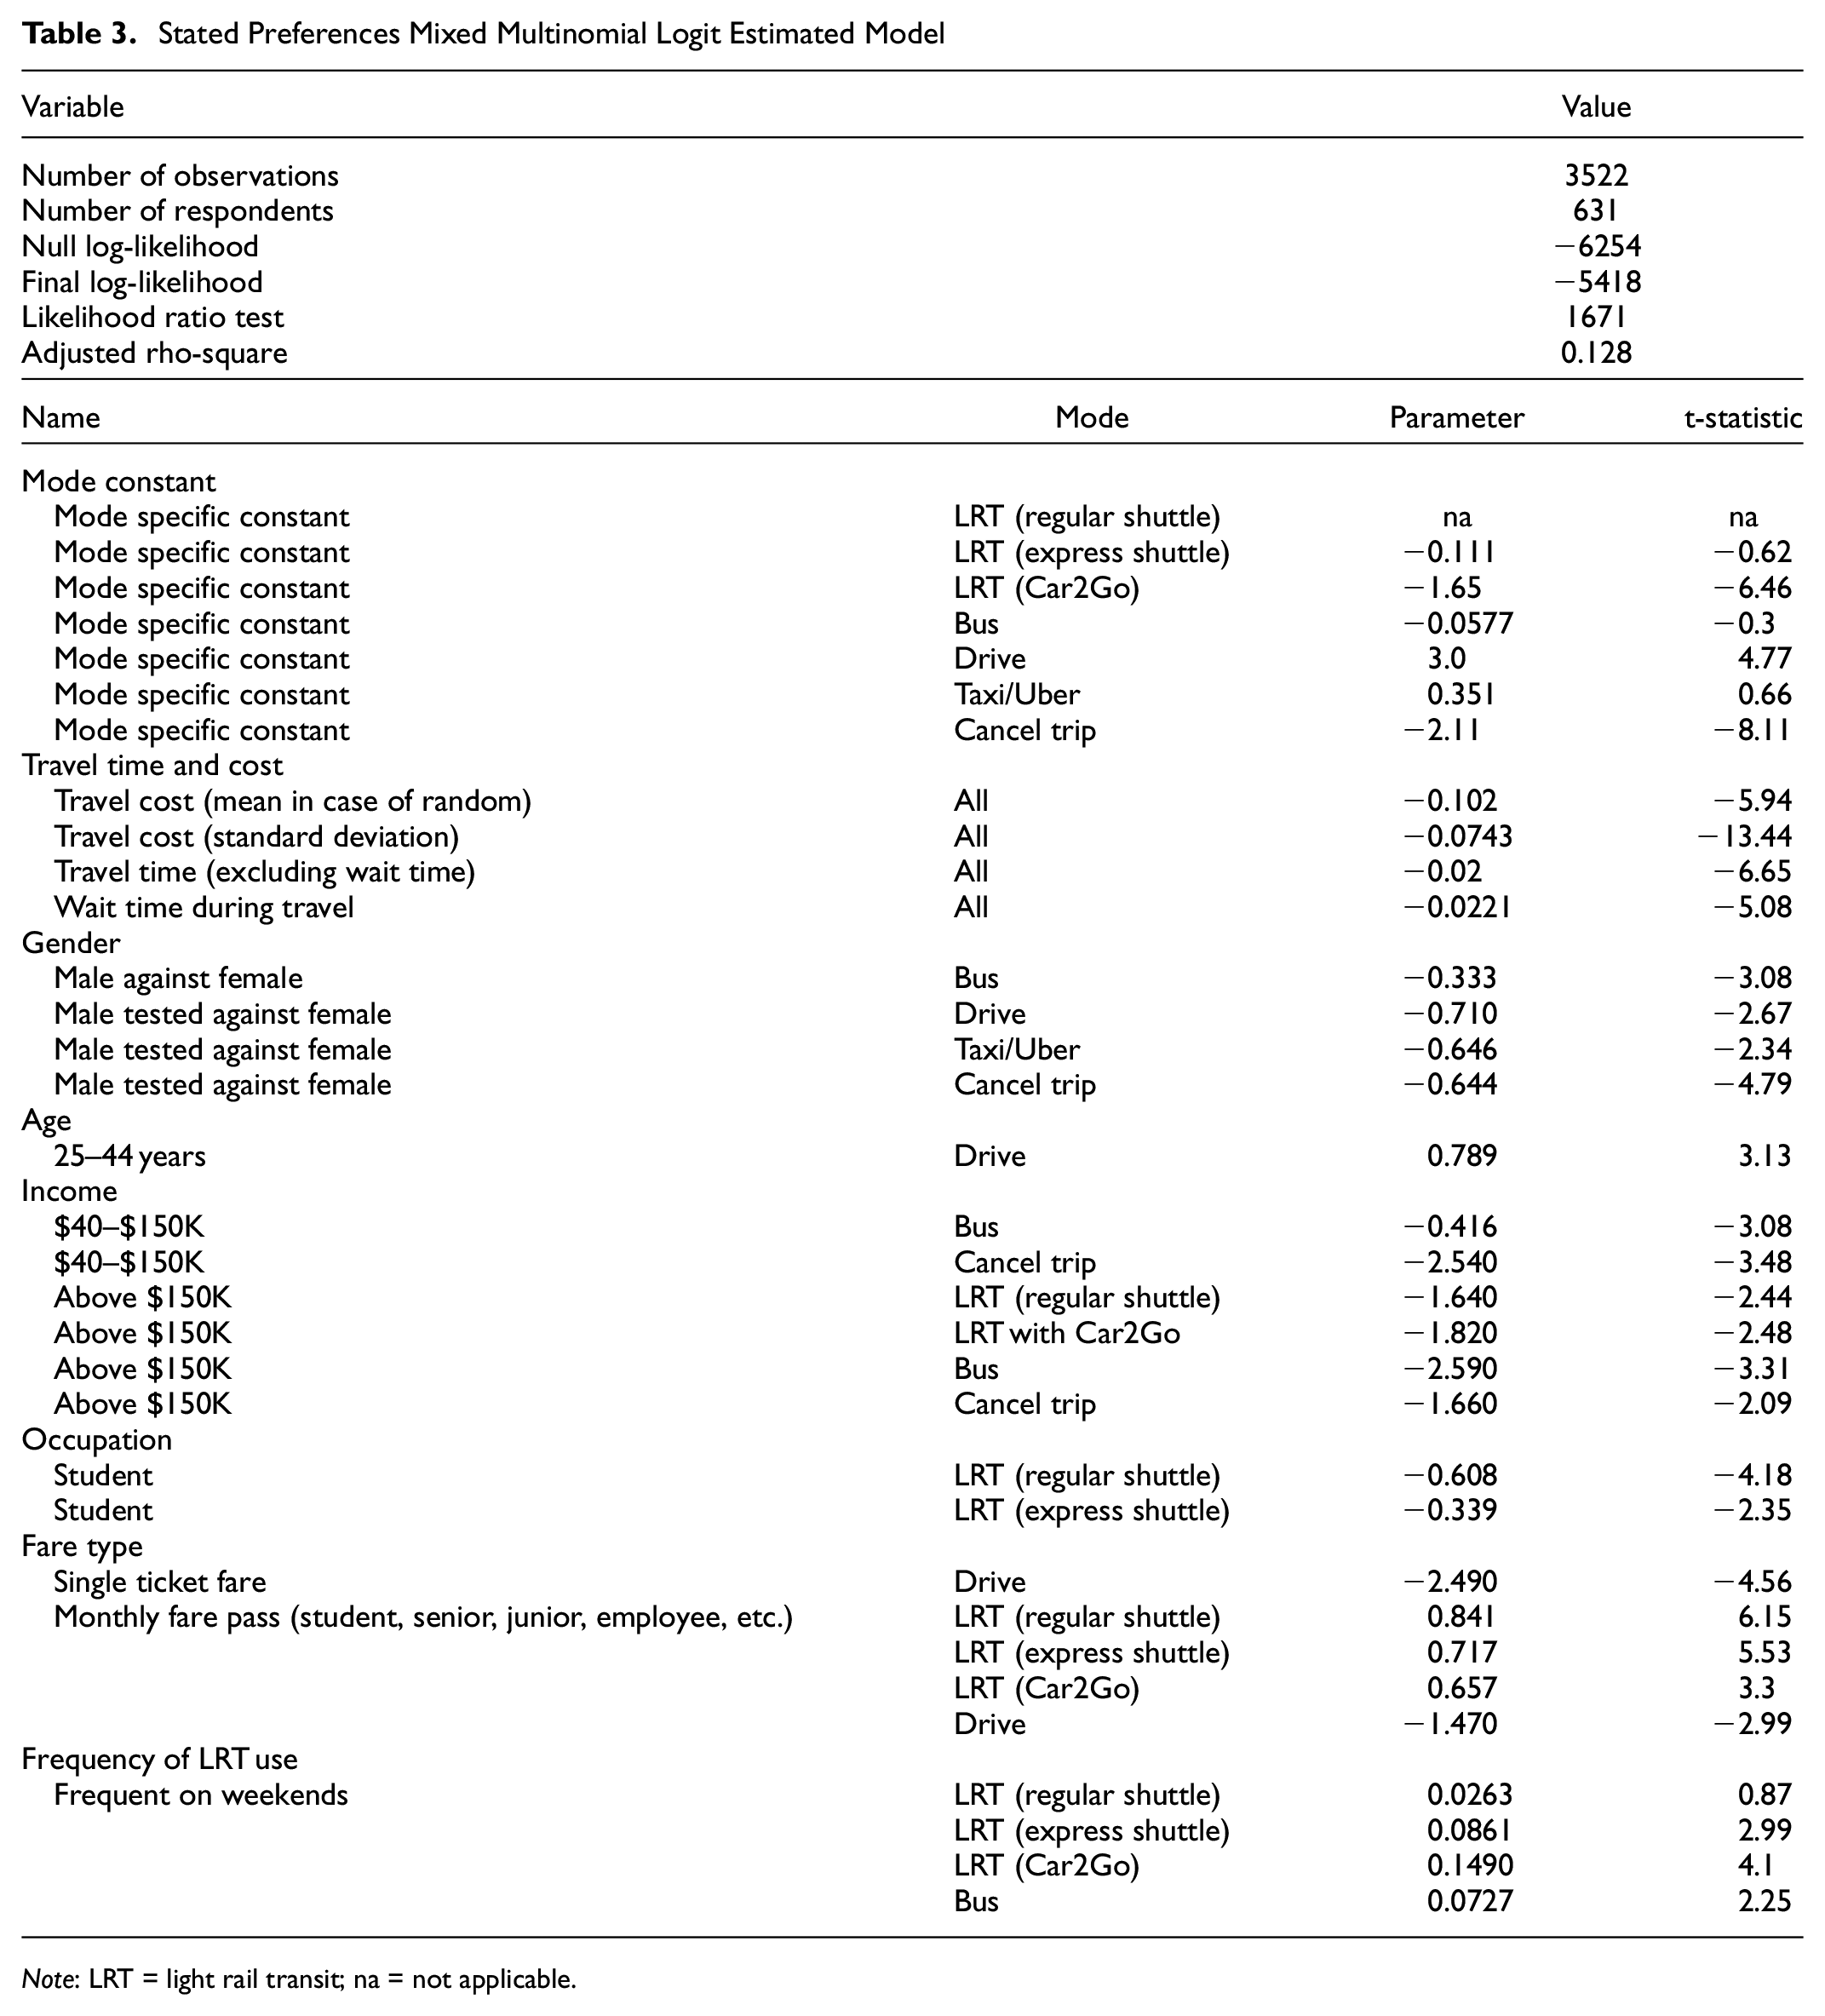
Note: LRT = light rail transit; na = not applicable.
Results
Choice Model Interpretation
The influence of parameters on customers’ mode choice behavior is discussed in this section. The estimated value of wait time and in-vehicle travel time (i.e., total trip travel time excluding wait time at transfer station/stops) was found to be $13.00/h and $11.76/h, respectively. This was determined by taking the ratio of in-vehicle wait time and the estimated average travel cost coefficient. This indicates that LRT users value their wait time 11% more than in-vehicle travel time during a short-term PSD. The value of time estimated in this study is lower than the average daily wage in Calgary ($30.13 in 2017). This is justified because travelers will often make non-work-related trips on weekends and thus attribute a lower value of time for such non-utilitarian trips. In addition, LRT customers are assumed to be aware of upcoming PSDs and accordingly expect a longer travel time than usual.
People of different genders exhibit different choice behaviors. Compared with female respondents, male respondents were found to be more inclined to experience inertia with respect to LRT alternatives during a short-term LRT PSD. This finding suggests that women are more likely to avoid longer than normal travel time, thereby canceling or rescheduling their trips during the short-term LRT PSDs. We attribute this outcome to women’s multiple commitments such as household duties, childcare, and taking care of the elderly, pressuring them to place more emphasis on decreasing delays.
In this choice model, participants of different age groups were tested separately for each alternative. The only significant effect was a positive impact on the utility of driving for young people (25–44 years) as compared with other age groups.
Both middle-income ($40,000–$150,000) and high-income (above $150,000) LRT users as compared with other categories were found to be less likely to take a bus or cancel their trip. Moreover, high-income users were found to be less likely to take transit altogether during short-term LRT PSD. These individuals are more likely to have other modal options available to them, whereas lower income individuals may feel priced-out of using the more expensive drive, carshare, or taxi modes.
Compared with other occupational classes, students who choose to take LRT were found to be more likely to take the express shuttle over the regular shuttle along the disrupted section of LRT line. This is possibly explained by students being more technology savvy and being able to pass the extra wait time associated with the express shuttle on their smartphones.
The LRT customers that hold a monthly, student, or senior transit fare pass were more likely to continue using the LRT during a short-term LRT PSD, compared with LRT users who use other types of fare payments. These individuals might be captive users or may be motivated to use transit service to maximize the value of their pass purchased, even when PSDs occur. It should be noted that much of the literature suggests that they may not choose to continue renewing their passes in the future if they experience significant inconvenience from PSDs.
An interesting finding of this study is that frequent LRT users (all week users, weekend users, or both) were more likely to keep using LRT service or take alternative transit bus routes during short-term LRT PSDs and are willing to experience extra travel time and transfers for their regular weekend trip. Again, the authors speculate that these people are captive users or possess monthly transit fare passes and have an incentive to use transit service. Conversely, some of these individuals may be strongly loyal to transit based on their underlying beliefs or attitudes and as such would select transit options even under sub-optimal conditions. Further investigation of these issues is warranted.
Sensitivity Analysis and Recommendations
Participants’ choice probabilities are evaluated with respect to transit fare, carshare cost, and wait time at transfer stations for express shuttle, separately. In all cases, the dependent variable is the probability of choosing from the given alternatives. Note that we have opted to employ this method as the introduction of preference heterogeneity via mixed logit relaxes the Independence from Irrelevant Alternatives (IIA) property of the standard logit structure. This means that conventional elasticity or marginal effect calculations no longer have a closed form equation and the model will exhibit non-proportional substitution patterns.
Figure 3 presents the relationship between the choice probability of the given alternatives and a decrease in transit fare, keeping all the other explanatory variables unchanged. The graph shows that probability of choosing all the transit options increases and that of driving and trip cancellation/reschedule decreases as the transit fare decreases. However, the probability of choosing taxi remains inelastic to the change in transit fare. If transit is made free during short-term LRT PSDs, the probability of choosing LRT would increase by about 3%, resulting in a total 4% increase in choice probability of transit-based modes (i.e., 1% increase in choice probability LRT with regular shuttle, express shuttle and carsharing, and transit bus, each). The increase in transit share is a result of the corresponding drop in trip cancellation (3%) and driving (1%) alternatives when transit is made free. A large caveat with this finding comes from many transit users paying for monthly passes. This decrease in transit cost will have no impact on them unless Calgary Transit has some means of tracking their use or providing a credit or discount on subsequent pass purchases. Conversely, there is also a significant opportunity to attract infrequent transit users to try the LRT service, who otherwise would not use transit during a PSD, if the service is made free on weekends. That said, some means of tracking monthly pass owners and providing them with a financial incentive to use transit is important to enable implementation of this loyalty policy.
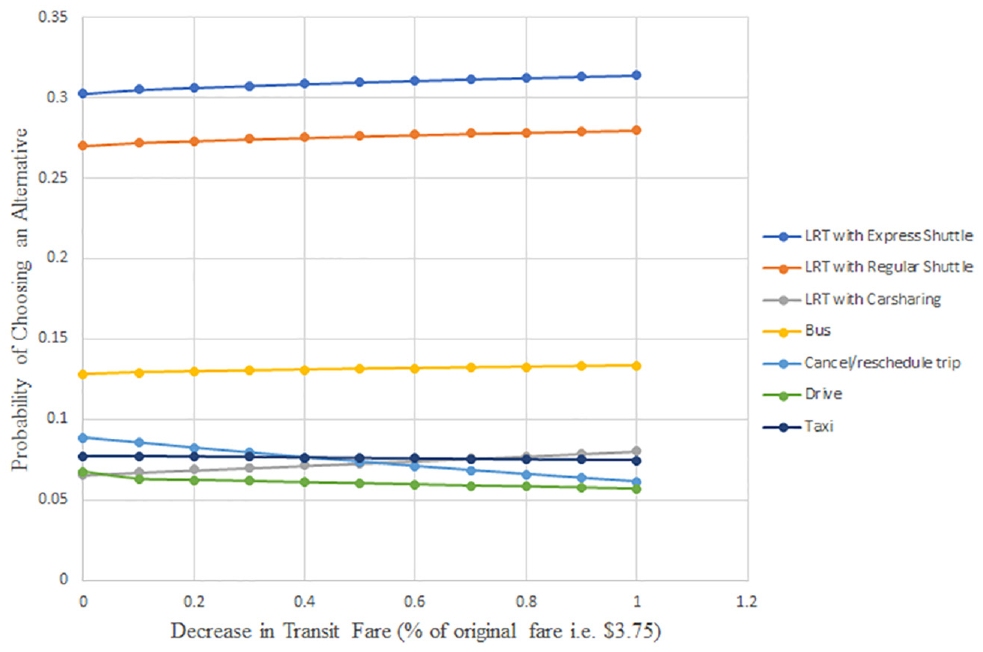
Sensitivity analysis on decrease in transit fare.
While providing higher level of service to the transit customers, subsidizing carsharing mode along the disrupted section of the LRT only does not seem to be a very attractive option for passengers from non-transit modes. Sensitivity analysis (Figure 4) of the model with respect to a decrease in fare of carsharing showed up to 4% increase in probability of choosing carsharing mode if the carshare mode is made free for LRT users that are affected by a short-term LRT PSD. The results show an increase in the probability of choosing LRT by 1%. The major reason for increased carshare choice probability is a result of the shift from express and regular shuttle bus mode to the carsharing mode. Choice probability of taxi was found to be insensitive with respect to change in carshare fare. Based on this analysis, transit agencies can consider subsidizing carsharing services as well as ride-hailing services (such as Uber) to transfer passengers on the disrupted section to improve level of transit service during planned and unplanned service disruptions. There is also a significant opportunity to use other new shared mobility options such as shared e-scooters or e-bikes. The new e-scooter mobility options had just been introduced to Calgary when this data was being collected. Subsidizing the cost to use these micro mobility technologies is in many ways analogous to subsidizing the carshare option. Furthermore, there has been significant speculation with regard to the efficacy of micro mobility as a solution to the transit first-mile last-mile problem ( 20 ). This could mean that providing these subsidies to users may encourage access to and/or egress from other transit use via e-scooter or e-bike in the future, thereby increasing overall ridership.
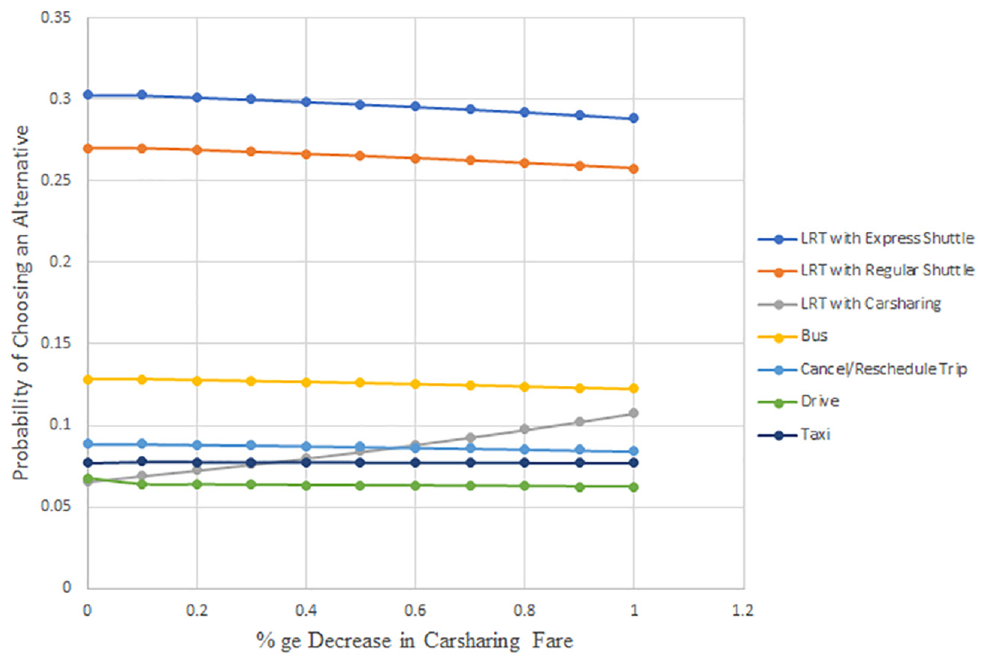
Sensitivity analysis on decrease in carsharing fare.
Wait time at the transfer station, which is related to the shuttle bus headway or frequency, is an important component of transit users’ perceived utility. Among the hypothetical LRT alternatives, the express shuttle provided shorter travel time but longer average wait time (i.e., lower bus frequency) than the regular shuttle. Figure 5 represents the sensitivity of the choice model with respect to change in waiting time for the express shuttle. Probability of choosing express shuttle increases as wait time decreases and would increase by about 4% for the examined choice context if transit customers do not have to wait for the shuttle. In other words, schedules must be coordinated such that an express shuttle bus must be waiting at the transfer station when a LRT arrives at the transfer station. This pulsing of services can be challenging to implement operationally for temporary bus bridging routes. Interestingly, the greatest substitution pattern predicted by the model was to the regular shuttle with other modes having much smaller increases in overall modal share. This suggests that, potentially, decreasing service headways on express vehicles is not actually a way of competitively increasing modal share. However, decreasing service headways on express vehicles can definitely improve level of service of bus bridging for customers.
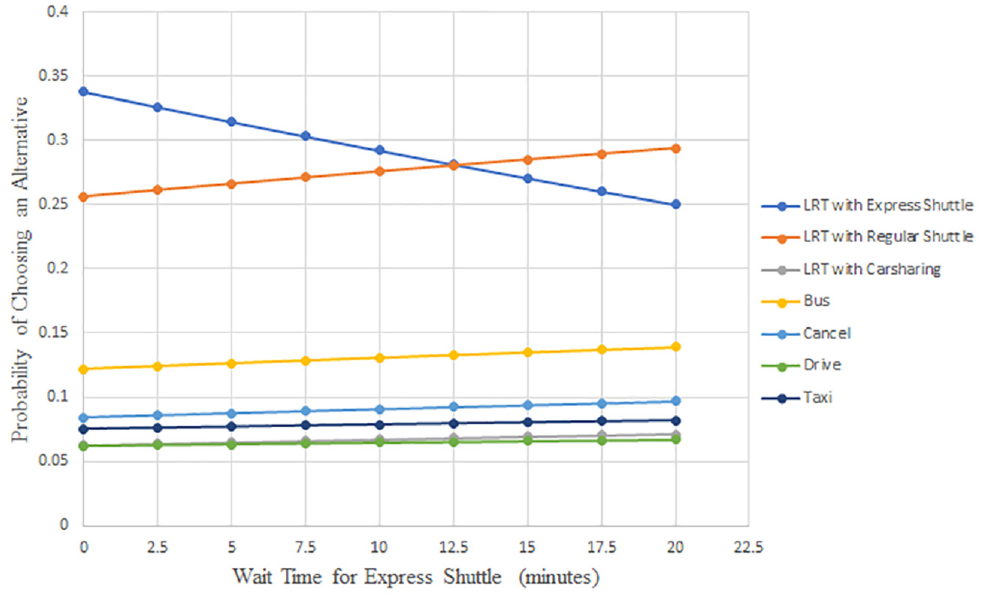
Sensitivity analysis on change in wait time of express shuttle.
Conclusions
This paper examined LRT users’ travel mode choice preferences in the event of short-term LRT PSDs. An SP survey was designed and distributed to collect information on passengers’ behavior on mode choice responses under a set of hypothetical LRT PSD scenarios in the City of Calgary, AB, Canada. A mixed MNL model was calibrated using the collected data to identify the factors contributing to the presented alternative mode choices. A sensitivity analysis was also conducted to examine the impact of variations in transit fare, carshare fare, and wait time at transfer station for express shuttle on the mode choice probabilities.
The findings of this study improve the understanding of transit passengers’ behavioral choices under short-term LRT PSDs. The results of the analysis show that, in the context of the LRT PSD choice situation investigated in this study, LRT ridership can be reduced by up to 35%. More specifically, respondents who stated that they would avoid the LRT during the hypothetical disruption are likely to consider alternative travel modes, for example, alternative transit bus route (17%), driving (6%), taxi/Uber (7%), or cancel/reschedule their trip (9%). Customers who use a transit payment pass (monthly, seniors, student, junior, employee, etc.) and are frequent weekend LRT users are more likely to stay with the LRT mode. If customers are provided with alternative modes (express shuttle bus and carsharing) in addition to a regular shuttle bus service, they would likely use those to shorten their travel time. LRT users who belong to the high-income category are less likely to take transit during a short-term LRT PSD. The value of time was found to be 11.76 $/h and 13.0 $/h for travel time and wait time during travel, respectively.
The outcomes from the sensitivity analysis provide valuable information to transport planners in proposing potential measures to alleviate the impact on travelers caused by service disruptions. The sensitivity analysis of important variables considered in this study showed that improving the level of shuttle bus service (bus bridging) would increase customers probability of choosing LRT. Travel time and wait time are found to be key components of bus bridging services. The level of service of bus bridging can be improved significantly by providing an express shuttle service that skips intermediate stations and offers shorter travel time (in addition to the regular shuttle service). This also reduces customers’ wait time at transfer stations by increasing frequency of the bus service and by improving the bus bridging schedule such that a bus should be available at the transfer station when each LRT train arrives. Other policies, like making the LRT free during the PSD and/or subsidizing carsharing, ride-hailing, or e-scooter service, can further improve the attractiveness of LRT during short-term PSDs. These initiatives would also help to promote these mobility options (carsharing, ride-hailing, and e-scooters).
This study is the first of its type conducted to examine LRT users’ mode choice behavior under short-term PSDs. Contributions of this study include the application of the SP survey method to gather LRT users’ responses and a mixed MNL model formulation related to mode choice preferences under short-term LRT PSDs.
For further research on short-term LRT PSDs, slow zones (i.e., delayed LRT service) can be considered. In addition, this study could be repeated by collecting more realistic data for mode choice analysis in a hypothetical scenario that can be pivoted around each respondent’s actual route. Automated passenger count and cell phone and WiFi data can also be used to complement the study by collecting real long-term ridership and mode choice data to examine the short-, medium-, and longer-term impact of transit PSDs.
Footnotes
Acknowledgements
The authors acknowledge Calgary Transit for their support in conducting the survey and sharing relevant data for this study. Also, thanks to Sam Pollock, a graduate student at the University of Calgary, for his help proofreading this paper.
Author Contributions
The authors confirm contribution to the paper as follows: study conception and design: Muhammad Asim, Adam Weiss; data collection: Muhammad Asim; analysis and interpretation of results: X. Author, Y. Author, Z. Author; draft manuscript preparation: Y. Author, Z. Author. All authors reviewed the results and approved the final version of the manuscript.
Declaration of Conflicting Interests
The author(s) declared no potential conflicts of interest with respect to the research, authorship, and/or publication of this article.
Funding
The author(s) disclosed receipt of the following financial support for the research, authorship, and/or publication of this article: This research was funded by the University of Calgary Eyes High postdoctoral VPR fund and the Urban Alliance Chair in Transportation Systems Optimization funds (RT756247).