
Abstract
Mobility, safety, and environmental sustainability are priorities in the geometric design of roundabouts. This paper presents a multi-objective optimization model that determines the geometric design elements of single-lane roundabouts using all three objectives. The user can specify weights for the objectives, or the model can determine the optimal weights. Mobility is defined in terms of roundabout delay and modeled using the United Kingdom empirical model. Safety is modeled in terms of collision frequency based on the methodology of the Highway Safety Manual. Environmental sustainability is represented by vehicle emissions (nitrogen oxides, hydrocarbons, carbon dioxide, and carbon monoxide) and is modeled using the vehicle-specific power methodology. The proposed model directly identifies the optimal geometric dimensions (decision variables) of the roundabout, including entry width, exit width, approach half-width, circulatory width, effective flare length, entry radius, entry angle, and inscribed circle diameter. The input data to the model include traffic data, site conditions, and limitations based on design guidelines. Application of the proposed model is illustrated using two actual roundabouts. The comparison results show that the proposed model provides substantial improvements in safety, mobility, and environmental sustainability compared with existing conditions. In addition, the model requires much less effort to apply compared with the traditional iterative method, and as such should be of interest to highway designers.
Roundabouts play a major role in improving traffic safety, mobility, and environmental sustainability, compared with other forms of at-grade intersections. They provide a significant improvement to traffic safety. Elvik ( 1 ) found that converting a conventional intersection to a roundabout reduced fatal collisions by 50% to 70%, and injury collisions by 30% to 50%. Another study by Retting et al. ( 2 ) found a significant reduction in vehicle collisions when converting stop-sign and traffic-signal intersections into modern roundabouts. The results revealed a 38% reduction for all collisions, a 76% reduction for injury collisions, and a 90% reduction for fatal collisions. In addition, roundabouts improve mobility by reducing the total delay compared with other controlled intersections. The mobility improvements led to environmental benefits and saving in fuel consumption as reported by the Federal Highway Administration ( 3 ).
In addition, roundabouts represent an effective traffic calming approach for intersection congestion, reducing delay and average queue length, as stated by Rao et al. ( 4 ). Congested intersections are the major sources of vehicle emission. According to the government of Canada, passenger cars are the major contributor to air pollution, as their emissions contribute nearly 21% of the nitrogen oxide (NOx), 51% of the volatile organic compound (VOC), and 4% of the fine particle matter (PM2.5) ( 5 ). Mandavilli et al. ( 6 ) examined the effect on vehicle emissions of converting all-way stop-control intersections into modern roundabouts. The researchers evaluated six intersections and indicated that roundabouts provided reductions of 42%, 59%, 48%, and 65% for carbon monoxide (CO), carbon dioxide (CO2), nitrogen oxide (NOX), and hydrocarbon (HC) emissions, respectively. In a study in Sweden, Várhelyi et al. ( 7 ) found that converting a signalized intersection into a roundabout reduced vehicle emission by 29% and 21% for CO and NOX, respectively, and fuel consumption by 28%. Clearly, road designers need to include vehicle emission, collisions, and delay as important objectives in roundabout design.
Roundabout geometric design generally involves an iterative method that starts by assuming basic geometric parameters’ initial values, then checks the performance of the roundabout using suitable software tools. Researchers have found that the optimization technique, used instead of the trial process, is an effective way to determine the optimal design parameters in geometric design. Easa and Mehmood ( 8 ) developed an optimization model for the geometric design of single-lane roundabouts based on maximizing speed consistency. In another study, Mehmood and Easa ( 9 ) extended the previous model by considering both speed consistency and mobility as multiple objectives. In addition, Easa and Mehmood (10, 11) developed an optimization model for establishing horizontal alignments based on maximizing speed consistency and minimizing collision frequency. Valuable information and guidance on the geometric design of roundabouts have been developed by Rodegerdts et al. ( 12 – 14 ).
This paper presents a new optimization model for the geometric design of single-lane roundabouts based on minimizing vehicle collisions, total delay, and vehicle emissions. The geometric features of roundabouts are linked to several design measurements such as speed, safety, and mobility which significantly affect the environmental impacts. The model considers various types of physical and operational constraints. Unlike the model by Easa and Mehmood ( 8 ), which represented safety in terms of speed consistency, the proposed model explicitly considers substantive safety in terms of collision frequency. In addition, the proposed model considers the environmental sustainability objective that has been previously considered in design. The main elements of the proposed methodology are shown in Figure 1. The input data include traffic data (annual average daily traffic, or AADT, and turning movements) and geometric data which can be determined from the design guides. The methodology involves modeling capacity, predicted operating speed, and speed profile. Then, measures of the three objectives (collisions, delay, and emissions) are formulated. Various physical and operational constraints are defined. The model is solved using Solver software which is available as an add-in to Microsoft Excel 2010 and later versions. The decision variables (output) of the model are entry width, exit width, approach half-width, circulated width, effective flare length, entry radius, entry angle, and inscribed circle diameter.
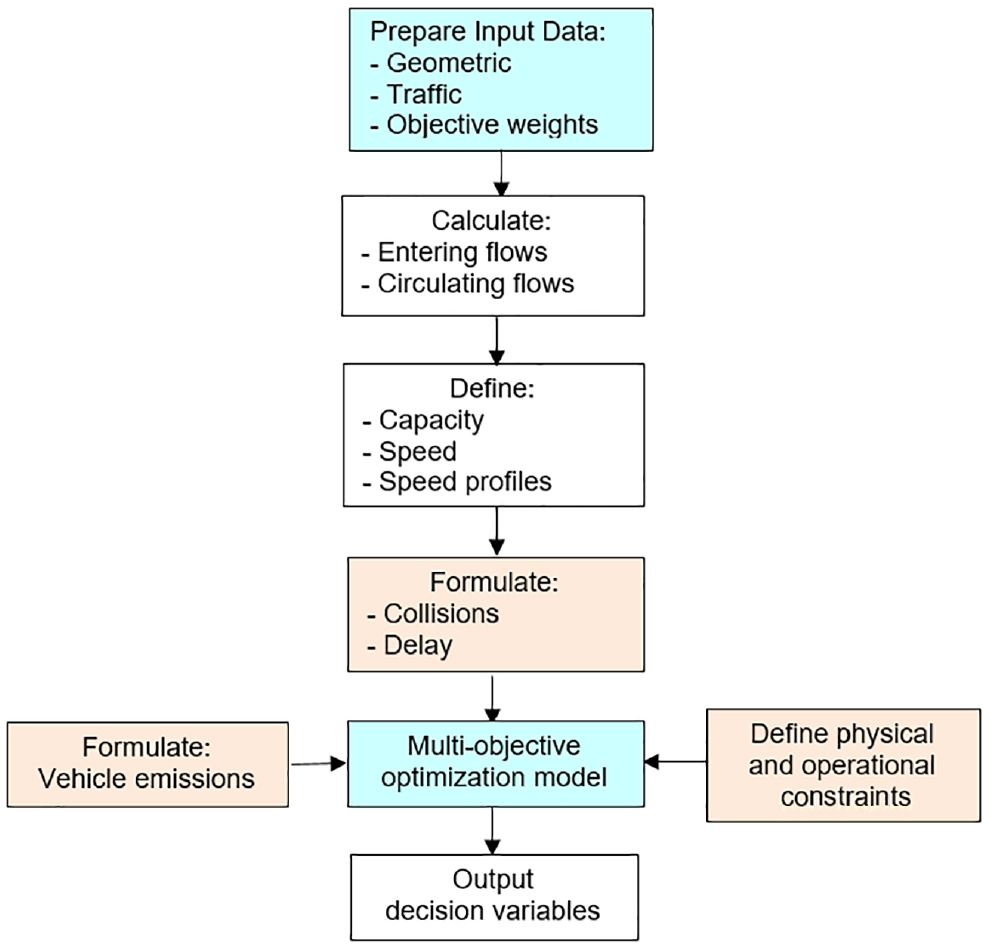
Logical steps of proposed methodology.
The next sections present details on roundabout data and modeling of basic elements (speed profiles and movement paths). The section following them presents the proposed methodology, including modeling of the safety, mobility, and sustainability objectives, multi-objective function, and constraints. Application of the model is then presented, followed by conclusions.
Roundabout Data
Geometric Data
Geometric data include ranges for the inscribed circle diameter, the entry width, the exit width, and the circulated width. The maximum values of the geometric parameters depend on site conditions and physical constraints such as available right of way, drainage, and utility constraints. The aerial photography of the proposed site provides the maximum ranges of the geometric diameters and should be verified through a site survey. The minimum ranges of the geometric parameters can be determined based on the design vehicle ( 13 ). The geometric constraints are given by


where
D = inscribed circle diameter (m),
E = entry width (m),
C = circulated width (m),
j = leg number (1, 2, 3, or 4).
The circulatory width should be more than the maximum entry width of all legs and should not exceed 20% more than the maximum entry width ( 13 ). The guidelines define the minimum values of some geometric parameters based on the design vehicle.
Traffic Data
Traffic flow data include the volume of vehicles entering the roundabout and traffic composition for each approach. Traffic flow data should be converted from vehicle to passenger car equivalents (pce) by considering the peak-hour factor and the heavy-vehicle factor as follows:


where
HVF j = heavy-vehicle factor for approach j,
PHF j = peak-hour factor for approach j,
Pt,j = percentage of trucks for approach j, and
The entering traffic for an approach is the sum of all movements at this approach. Thus,

where
j = approach number (1, 2, 3, or 4).
The conflicting or circulating traffic of the roundabout is the sum of all traffic that passes in front of this entering approach and is calculated as
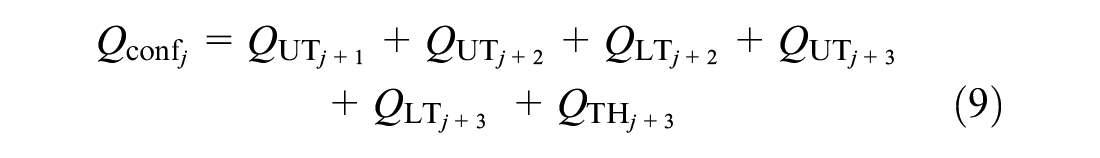
where
Modeling Basic Elements
Speed Profiles
Using extensive empirical measurements, Coelho et al. ( 15 ) identified three representative speed profiles for vehicles navigating a single-lane roundabout (Figure 2):
Profile 1: Unstopped vehicles that approach the roundabout, decelerate from the upstream approach speed to reach the roundabout operating speed, then accelerate to reach the downstream speed.
Profile 2: Vehicles that stop once by decelerate to a full stop at the yield line. The vehicles remain idle waiting for an acceptable gap in the conflicting traffic. When they accept a gap, they enter the roundabout, accelerating until they reach the operating speed of the roundabout. The vehicles travel a specific distance in the roundabout based on their movement, then accelerate to the downstream speed.
Profile 3: Vehicles that stop more than once on the approach because they line up in a queue. When the vehicles reach the yield line, they remain idle waiting to accept a gap. The vehicles travel a specific distance at the roundabout operating speed, then accelerate when exiting the roundabout.
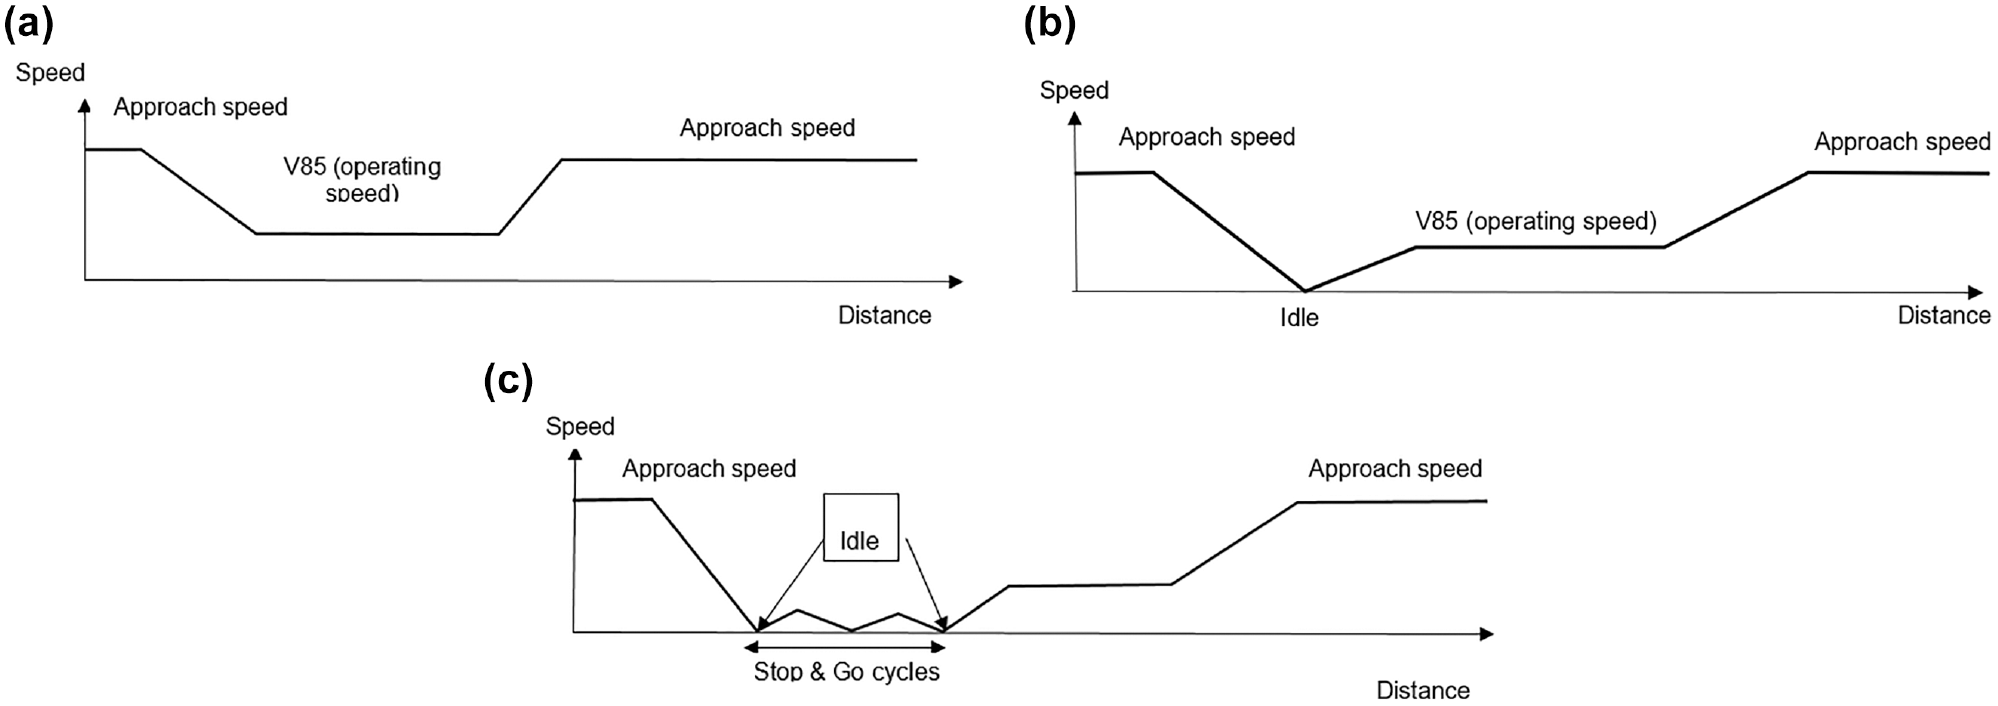
Typical speed profiles of single-lane roundabout: (a) profile 1—unstopped vehicles, (b) profile 2—one-stop vehicles, and (c) profile 3—more-than-one-stop vehicles.
The frequency of each speed profile is related to the congestion level. Regression models were developed based on the sum of the entering and conflicting traffic flows to express the number of vehicles for each trajectory. The percentages of vehicles that cross the roundabout without stopping, with one stop, and with more than one stop for approach j are given by


where
Nu, j = percentage of vehicles that do not stop for approach j (%),
N1, j = percentage of vehicles that stop once for approach j (%), and
Nm, j = percentage of vehicles that stop more than once for approach j (%).
The stop-and-go cycles experienced by vehicles were classified into short and long cycles based on the queue length. Their numbers are given by


where
SSG = number of short stop-and-go cycles,
LSG = number of long stop-and-go cycles, and
QL = queue length (vehicles [veh]).
Typical characteristics of the short and long cycles were identified. For a short (long) cycle, the typical maximum speed is 3.8 km/h (6.6 km/h), the typical distance is 5.2 m (15.1 m), and the typical idle time before each cycle is 4.5 s (5.2 s). The idle time at the yield line was theoretically modeled based on the probability of accepting a gap between the circulating traffic. The average headway of the circulating traffic is given by

where
AHW = average time headway (s), and
The probability of waiting for 0 gaps is given by

where
P = probability of waiting for 0 gaps, and
The expected number of gaps


Using a simple optimization model, the stop-and-go cycles of speed profile 3 were modeled using the data of Coelho et al. ( 15 ) and the kinematic equations that considered acceleration and deceleration as the same value. The acceleration and deceleration of SSG and LSG were found to be 0.327 m/s2 and 1.902 m/s2, respectively.
Movement Paths
The fastest path of vehicles in single-lane roundabouts with different inscribed circle diameters has been formulated by Easa and Mehmood ( 8 ). They found that the through movement vehicles enter and exit the roundabout at around a 60° angle, right-turn movement vehicles enter and exit at 30° and 60°, respectively, and left-turn movement vehicles enter and exit at around a 45° angle. The fastest vehicle path is 1.5 m from the concrete curb ( 13 ), as shown in Figure 3.
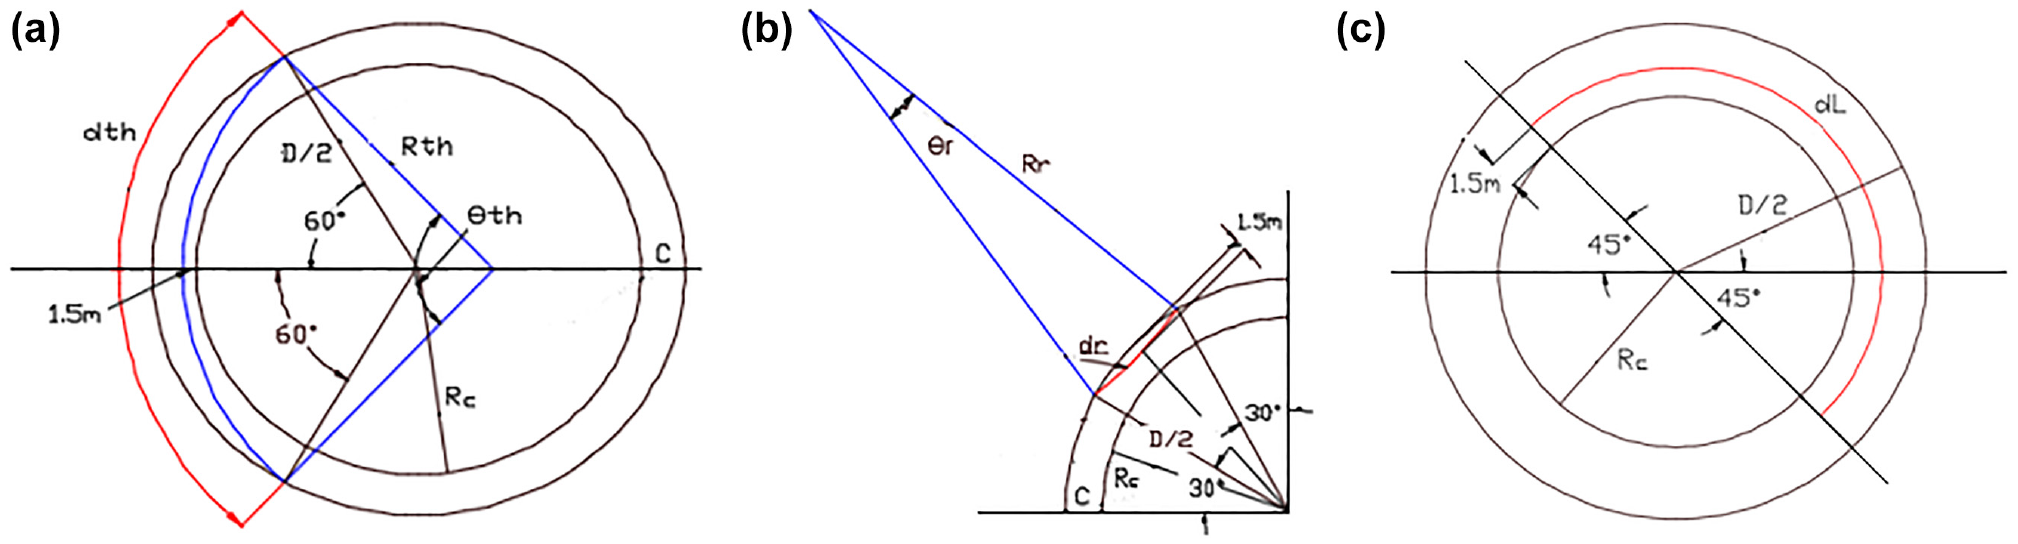
Modeling movement paths: (a) through path, (b) right-turn path, and (c) left-turn path.
For the through movement vehicle path, the distances

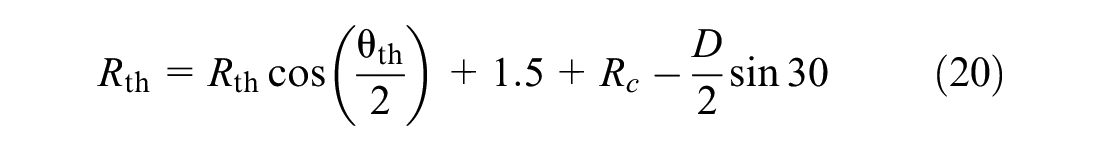
From Equations 19 and 20,

The radius of the through movement vehicle path can be determined by

The distance traveled by a vehicle navigating through the roundabout is given by

For the right-turn movement vehicle path, from the geometry of Figure 3b, the right-turn path radius and angle can be derived as:

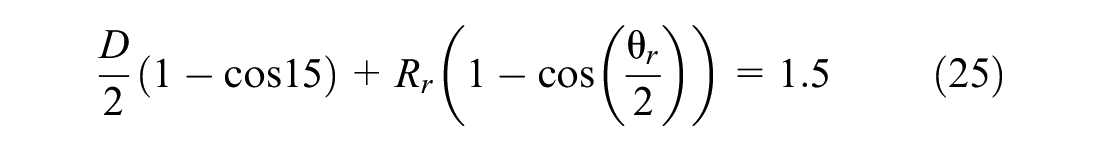
Using Equations 19 and 20

Therefore,
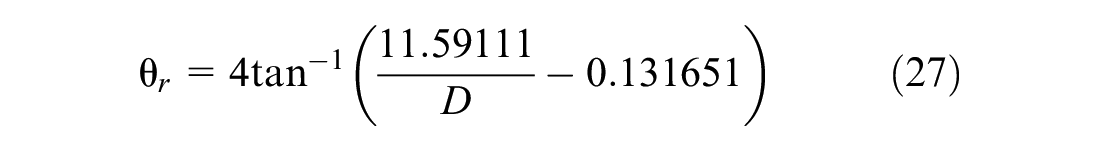
Then, the radius of the right-turn movement vehicle path is determined using Equation 27 as

The distance traveled in the roundabout by a vehicle making a right-turn is given by

For the left-turn movement vehicle path, from the geometry of Figure 3c, the left-turn path radius and distance can be derived as


where
D = inscribed circle diameter (m),
RL = left-turn path radius (m), and
dL = distance traveled in the roundabout by the left-turn vehicle (m).
The time spent in the roundabout for each movement is determined from the distance traveled in the roundabout and the operating speed.
Optimization Model
Safety Objective
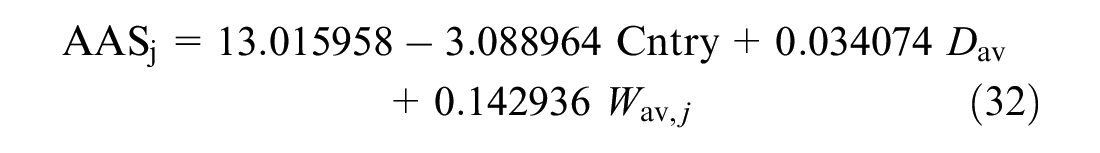
Formulation of the safety performance requires the operating speed. There is evidence that modern roundabouts provide a significant improvement in the safety performance of intersections. One of the main reasons behind the high safety performance of roundabouts is the reduction of conflict points. The number of vehicle–vehicle conflict points in a four-leg single-lane roundabout is reduced from 32 in the conventional intersection to as low as eight in the roundabout. Speed control is another major factor that affects safety. Therefore, in this study, the safety performance of roundabouts can be linked to the operating speed ( 13 ). Chen et al. ( 16 ) developed a predicted speed model expressed in terms of the roundabout geometric features using data from 139 U.S. and 34 Italian roundabout approaches. The model, which provided an excellent fit to the data, is given by
where
The approach predicted speed (AAS) is the average of the entry, circulatory, and exit speeds. The average speed is determined based on the geometric parameters of the roundabout, including inscribed circle diameter (D), central island diameter (2Rc), circulatory width (C), entry width (

where
Combining the observed crash frequency and the estimated average crash frequency obtained using Equation 33 improves the estimation reliability of the predicted crashes as stated in the Highway Safety Manual ( 17 ). Thus,


where
n = number of years.
Mobility Objective
Mobility is defined by the delay and level of service. The capacity models were categorized into two groups: one group depends on traffic flow and the other group depends on the geometric parameters of roundabouts. Johnson and Lin ( 18 ) discovered that the absence of geometric parameters in the HCM gap acceptance model leads to a wide range of data. This was confirmed using the empirical geometric model of the United Kingdom (UK) to test the same dataset used to develop the HCM6 model. The results revealed that the inclusion of the variation in the geometric features improved the accuracy of predicted capacity.
For roundabout capacity, the empirical UK capacity model was used in this study. The model expresses roundabout capacity as a function of six geometric parameters for each approach, as follows:


where
e = entry width (m),
v = approach half-width (m),
l' = effective flare length (m),
r = entry radius (m),
S = measure of the degree of the flaring, and
D = inscribed circle diameter (m).
Then, the roundabout approach delay, based on the HCM delay model, is given by
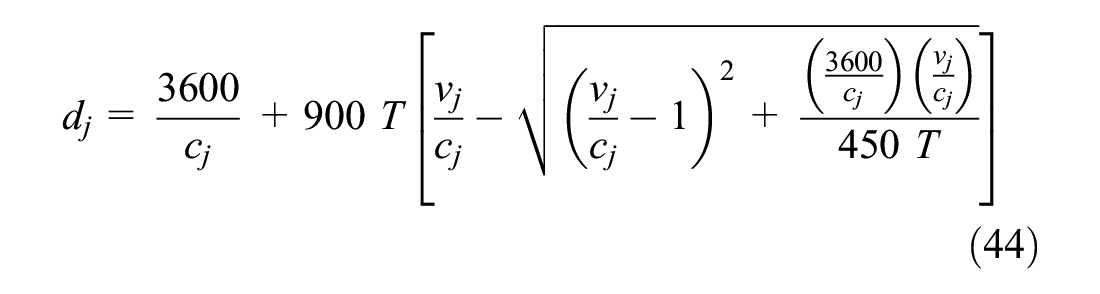
where
T = analysis time period (h) (equals 0.25 h for a 15 min period),
Sustainability Objective
Vehicle-Specific Power Model
Numerous researchers have used the vehicle-specific power (VSP) equation to measure vehicle emissions; see FHWA ( 3 ), Salamati et al. ( 19 ), Song et al. ( 20 ), and Zhai et al. ( 21 ). The VSP is the engine power needed to move a vehicle a unit mass. The original VSP equation was simplified by expressing it in terms of the instantaneous speed and acceleration of the vehicle, and the road longitudinal grade (in roundabouts, the road grade is considered horizontal). The simplified equation is given by

where
VSP = vehicle-specific power,
v = vehicle instantaneous speed or second by second speed (m/s), and
a = vehicle acceleration or deceleration (m/s 2 ).
The acceleration and deceleration values were 2.1 m/s 2 and 1.3 m/s 2 , respectively, as recommended by Rodegerdts et al. ( 13 ). The acceleration and deceleration are considered constant for simplicity and because of the unavailability of acceleration/deceleration models for roundabouts. See Bassani and Sacchi ( 22 ) on the operating speed, which is given by

where
v = 85th percentile speed (km/h),
C = width of the circulatory roadway (m),
E = width of the entry lane (m), and
Modeling Vehicle Emissions
The VSP equation was used to calculate vehicle emissions based on Equation 40. The movement trajectories are divided into three stages: (1) deceleration from the downstream approach speed to the roundabout operation speed, (2) crossing the roundabout at the operating speed for a distance that differs for each movement, and (3) acceleration from the roundabout operation speed to the upstream approach speed. The VSP is determined second by second using Equation 40 for each speed profile. According to the VSP value, the vehicle emissions of NOX, HC, CO2, and CO are determined from a look-up table (Table 1), which is based on Frey et al. ( 23 , 24 ). The corresponding values of each emission (g/s) for each VSP range are specified.
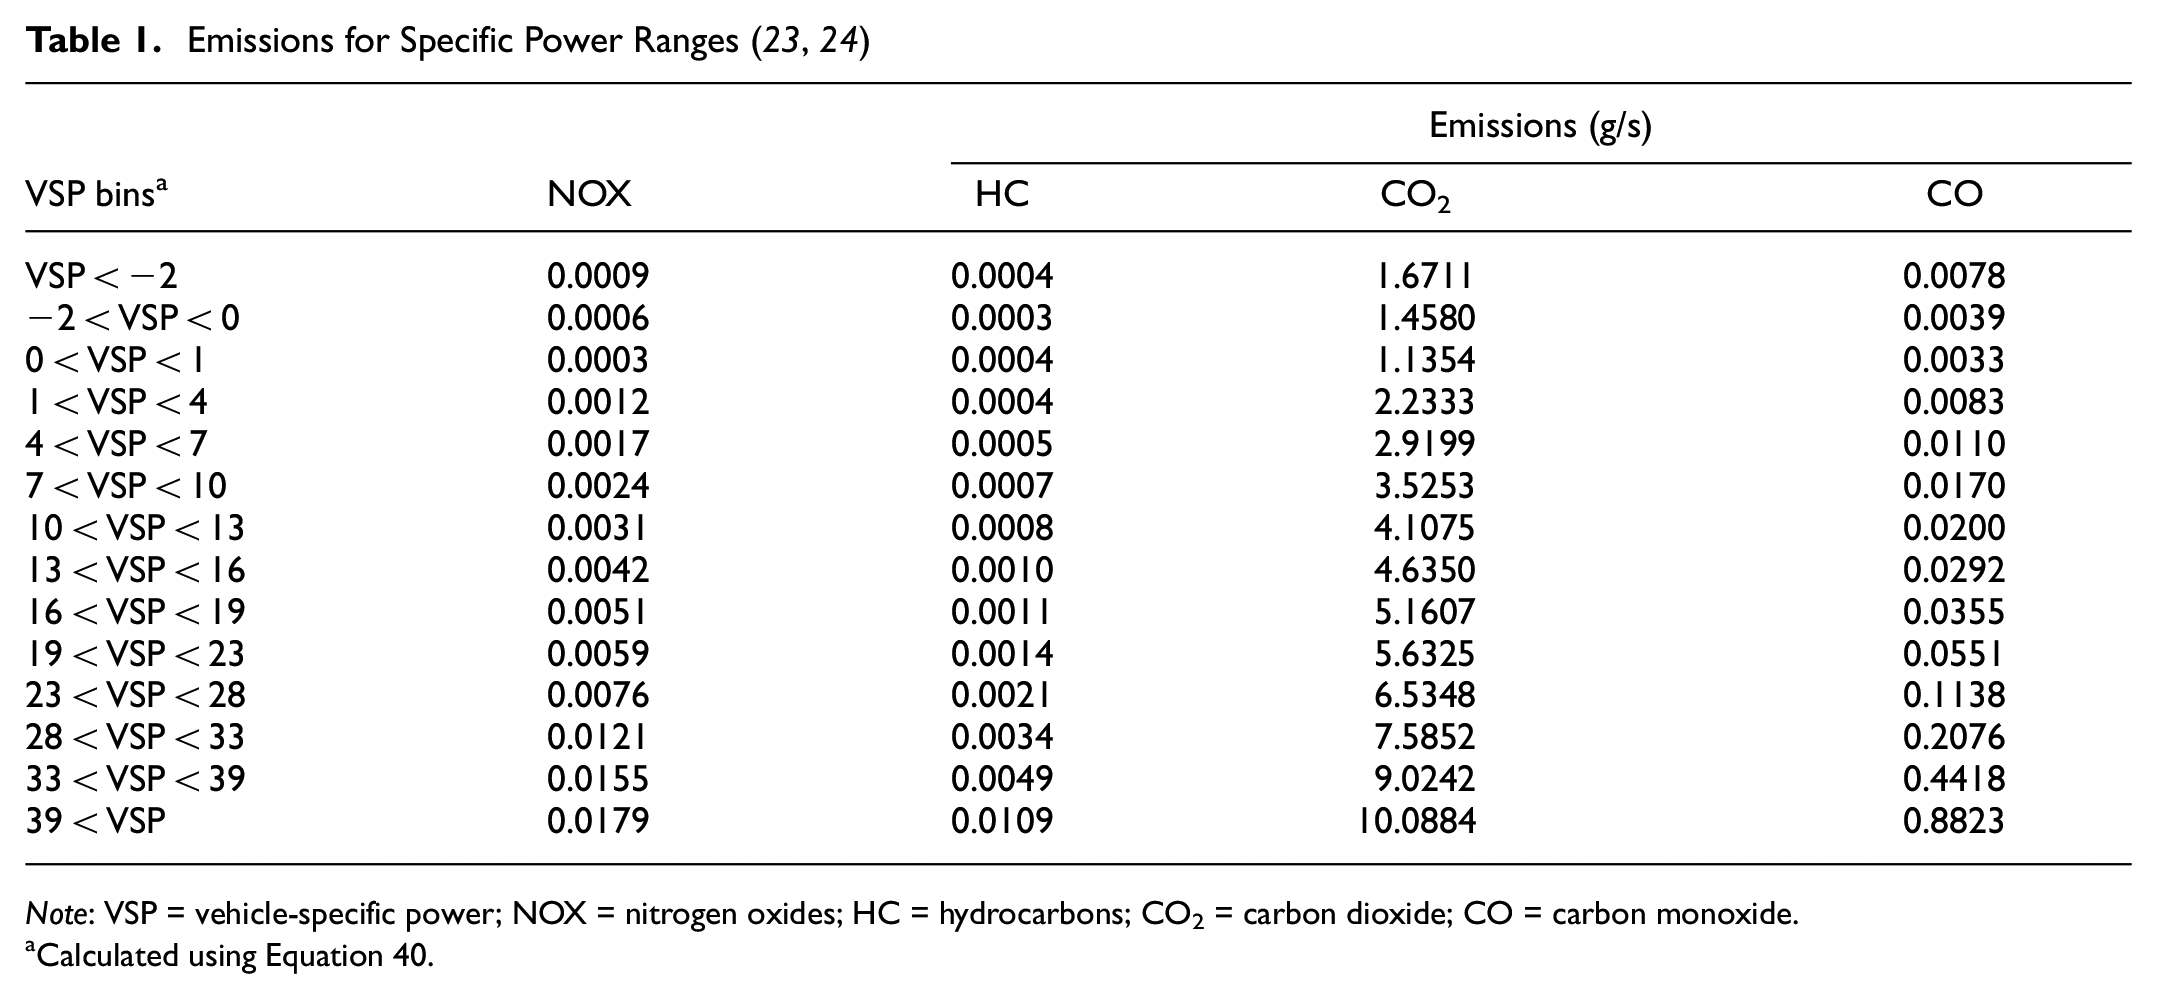
Note: VSP = vehicle-specific power; NOX = nitrogen oxides; HC = hydrocarbons; CO2 = carbon dioxide; CO = carbon monoxide.
Calculated using Equation 40.
The emission type of approach j (NOX j , HC j , CO2 j , and CO j ) is the sum of the emissions of the three speed profiles. The total emission of each speed profile is calculated based on the percentage of the entering vehicles that experience each speed profile and the emissions of each movement. Movement emissions are determined second by second from the first second that the vehicles enter the relevant zone until the last second they exit the relevant zone. The emission type of approach j is given by
where
Q THj, QRTj, QLTj = through, right-turn, and left-turn traffic volume for approach j, respectively,
k = profile number (1, 2, or 3),
j = approach number (1, 2, 3, or 4),
i = number of seconds from the first second the vehicle enters the roundabout to the
last second at the end of the influenced length when the vehicle exits,
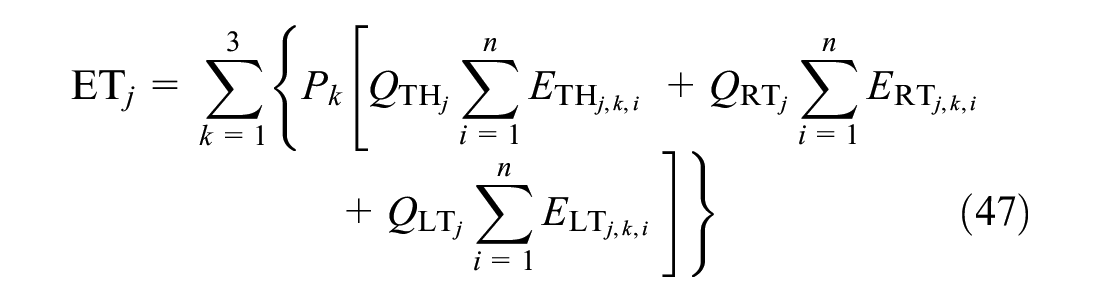
Then, the total emission for approach j is given by

where
Multi-Objective Function
The multi-objective function of the model maximizes safety, mobility, and environmental sustainability. Safety is represented by the total collision frequency (Equation 28), mobility is represented by the total delay (Equation 39), and environmental sustainability is represented by the total vehicle emission (Equation 48). Thus,
where
Z = value of multi-objective function,
Note that the sum of the weights is equal to 1. For the optimization of single objectives, Equation 49 can be applied directly by setting the weight of the objective to be optimized to 1 and the other weights to 0. For example, to optimize the total collision objective, set
where
Z = value of multi-objective function,
In applying Equation 50 for multi-objective optimization, the user can specify values of the weights (

Since most organizations require that safety should have the largest weight, this and other requirements can be added as a constraint. For example, the following constraint can be added:
variables along with the following unity constraint:

which ensures that the weight of safety will be larger than that of sustainability which in turn is larger than that of delay.
To summarize, in applying the optimization model, the user has three options: (1) using the model for single objectives by using Equation 49 and specifying a weight of 1 for the optimized objective and 0 for the other two objectives, (2) specifying the weights of the three objectives and using Equation 50, and (3) letting the model optimize the weights using Equations 50 to 52.
Model Solution
The optimization model consists of the objective function and the constraints related to the collision, delay, and emission objectives. The model can be solved using the Solver software which is available as an add-in to Excel 2010 and later versions ( 26 ). Excel Solver changes the decision variables according to the objective function subject to the constraints and modifies all cells that contain the decision variables using different algorithms. The generalized reduced gradient is one of the algorithms that was used in this study. The algorithm finds the global optimal solution by implementing a multi-start strategy, in which the starting points are randomly generated within the specified ranges of the decision variables. The clusters are formed from the points, and the process is run from the clusters and continues until the algorithm finally converges to a globally optimal solution.
Application
The proposed optimization model was applied to two existing single-lane roundabouts to evaluate its performance. The roundabouts were selected based on the design objectives that required improvement. One of the roundabouts is located at Fountain Street and Blair Road and the other roundabout is at Fischer Street and Hallman Street in Waterloo. The roundabouts had an extreme number of collisions over the past 5 years (from January 1, 2012 to December 31, 2016) as retrieved from the data provided by Holly Kents, Marcos Kroker, and Malcolm Lister at the Waterloo Regional Municipality. The number of reported total collisions at Fountain and Blair intersection was 51, which is above 10 collisions per year, and the total was 22 collisions at the other intersection.
Evaluating an existing roundabout involves the same stages as designing a new one. The sizing and space requirements should be assessed during the planning stage. The model is applied to maximize safety performance, mobility, and environmental sustainability. The model provides the optimal decision variables (D, C, v, l', r, and
Data Preparation
The first step in applying the model is preparing the traffic data for use. The data was collected at different peak-hour times during the day with different peak-hour factors and different truck percentages for each movement. The intersection traffic volumes in vph should be converted to pce considering the heavy-vehicle and the peak-hour factors for each movement using Equations 6 and 7.
A spreadsheet was used to prepare the traffic data and to calculate the roundabout traffic flows. For both roundabouts, the entering traffic is calculated for each approach which is the sum of the three movements (through, right turn, and left turn). The circulating traffic is calculated using Equation 9 for each approach. For example, for the Fountain–Blair roundabout, the data of the three movements at the west approach are given, respectively, as 261, 291, and 4 vph, the percentages of trucks are 6%, 4%, and 0%, and the peak-hour factors are 0.89, 0.87, and 0.5. For each movement, the HVF is calculated using Equation 7 as 0.943, 0.962, and 1 for through, right-turn, and left-turn movements, respectively. Then, the volumes are converted to passenger car equivalents using Equation 6 as 311, 348, and 8 pce/h for the three movements, respectively. The west approach entering traffic is the sum of 311, 348, and 8 giving 667 pce/h. The circulating traffic for the west approach is the sum of the left-turn traffic of the east approach (326), through traffic (12), and left-turn traffic (8) of the north approach giving 346 pce/h. The process is repeated for the other approaches.
The geometric data were retrieved from the aerial photographs of the roundabouts to define the maximum boundaries of the geometric parameters: the inscribed circle diameter, the entering width, the exiting width, and the circulating width. The aerial photograph was downloaded from the Geo-Scholar portal library. ArcGIS 10.4 software was used to measure the maximum ranges of geometric parameters that this specific location can accommodate. These measurements should be verified with a site survey to look at other physical constraints such as drainage, poles, and utilities. The minimum values of the geometric parameters were defined using the roundabout information guide ( 13 ) based on the design vehicle. In these examples, the design vehicle is WB50 (WB15), as the proposed sites were arterial roads in an urban area.
The guidelines provided the minimum geometric parameter values that could accommodate that type of vehicle. The minimum inscribed circle was 32 m and the minimum recommended entry width was 4.2 m. The circulatory width was in the range between the maximum entry width and 120% of the maximum entry width. The entry radius ranged from 15 m to 30 m. Other guidelines were: (a) the exit radius should be more than the entry radius and is recommended to be not less than 15 m to provide adequate operational performance and (b) the circulatory width should provide comfort for passenger cars and accommodate the design vehicle. Other data that were not needed in the optimization model (but should be considered in design) included the total length of the splitter island which should be a minimum of 15 m (and 30 m is preferred to provide adequate protection for pedestrians). The splitter island width should not be less than 1.8 m at the crosswalk to provide accommodation for pedestrians’ needs such as walking a bike, stroller users, and wheelchairs users.
Results of Optimizing Single Objectives
A comparison of the collisions, delay, and emissions corresponding to optimizing the mobility objective only (
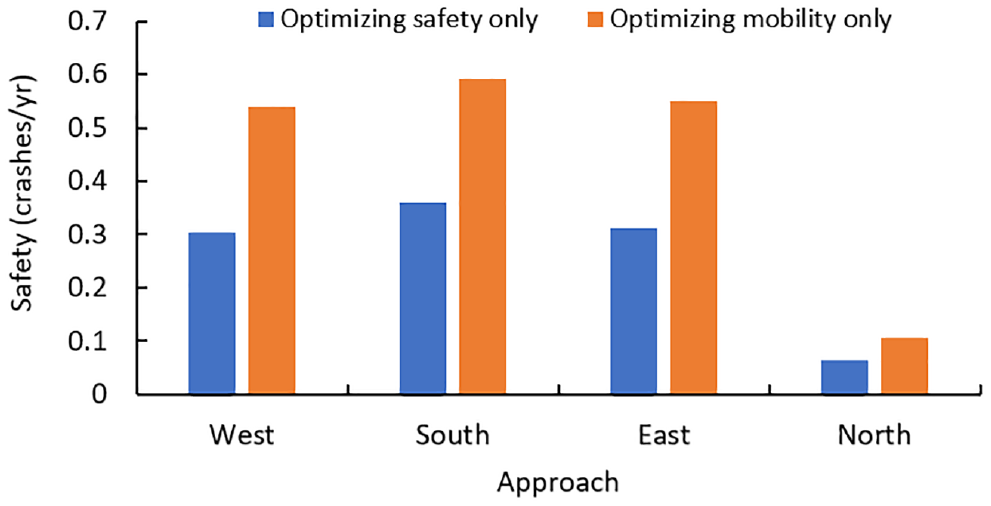
Comparison of collisions for single-objective optimization.
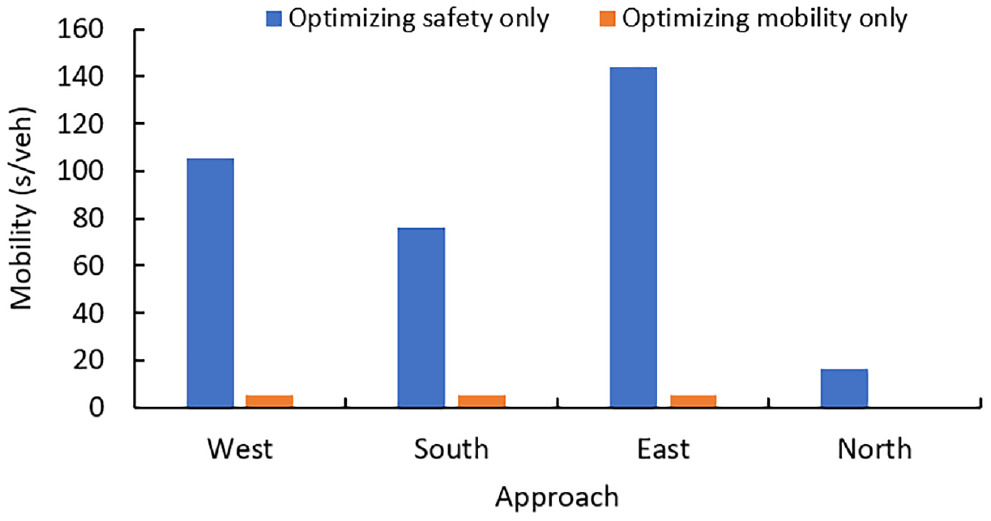
Comparison of delay for single-objective optimization.
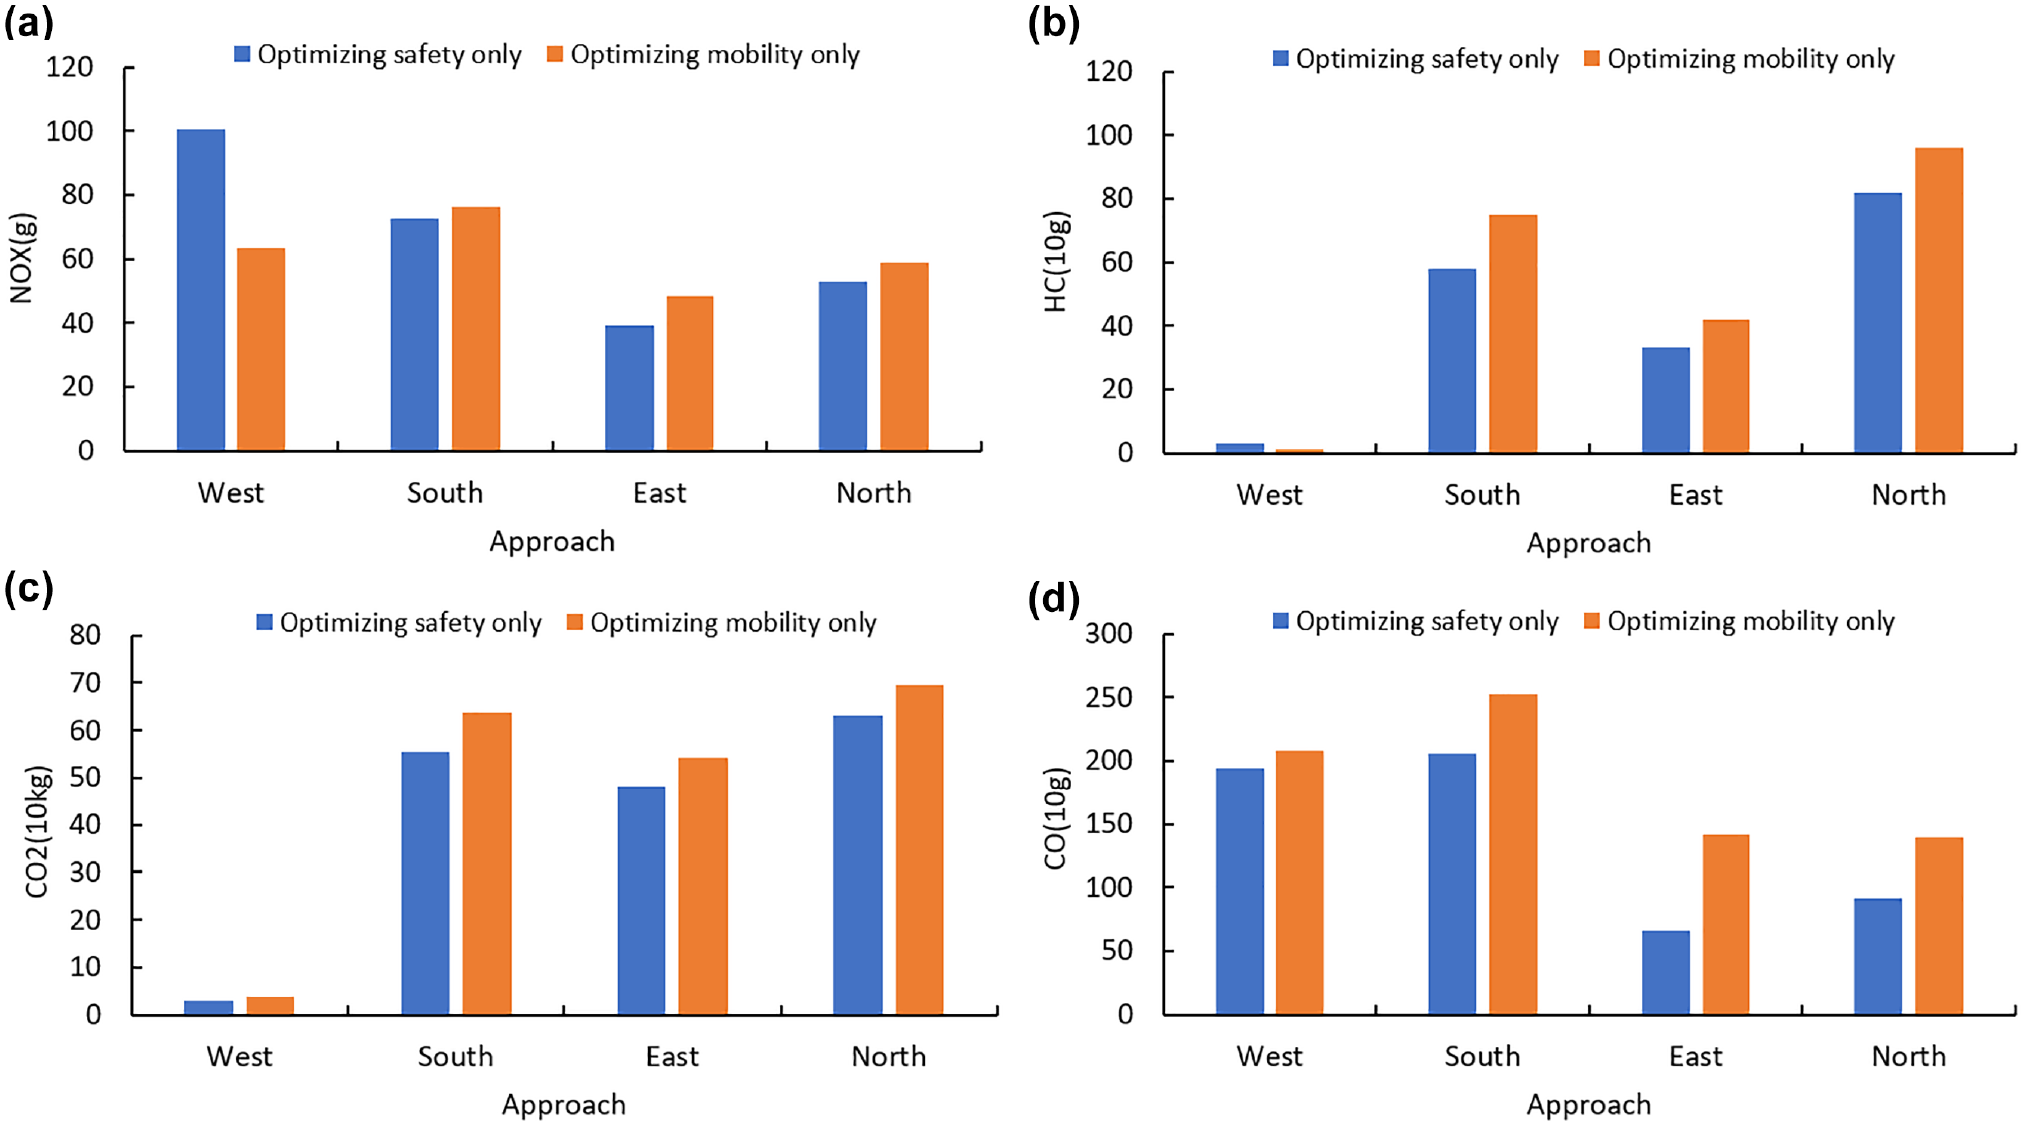
Comparison of emissions for single-objective optimization: (a) NOX, (b) HC, (c) CO2, and (d) CO.
As noted in Figure 4, the predicted collisions increased when considering mobility only since there is a trade-off between mobility and safety, and they were almost doubled in all approaches compared with optimizing safety only. For optimizing mobility only, the optimal inscribed circle diameter was selected as the defined maximum value. This decision confirms the reliability of the model. That is, to minimize the delay, the inscribed circle needs to be maximized to allow more entry and increase the capacity. The corresponding optimal geometric parameters were near the maximum values. This resulted in minimum delay and a high level of service (LOS), where all approaches had LOS A. As noted in Figure 5, the delay on the approaches ranges from 0.4 s to 5.2 s. Improving mobility only has a positive effect on environmental sustainability, as shown in Figure 6. The NOX, HC, and CO2 emissions decreased, while the CO emissions increased in most approaches. This also proves the effectiveness of the model since improving mobility should have a positive effect on vehicle emissions.
When only the safety objective was considered, the optimal geometric parameters were selected by the model as the minimum values. This finding supports the hypothesis reported in the literature. The minimum values created a substantial increase in the delay (exceeding 100 s), resulting in LOS F in most approaches, as shown in Figure 5. Vehicle emissions were consequently increased in most approaches, as shown in Figure 6. The preceding results revealed that there was a trade-off between safety and mobility and between safety and environmental impacts. The main goal for designers is to find a balance between the different design objectives. That balance can be achieved by considering weighted objectives as illustrated in the next section.
Results of Optimizing Multi-Objectives
To evaluate the effect of combining all three objectives on model performance, five cases were analyzed, as follows:
Case 1: The assigned weights are
Case 2: The assigned weights are
Case 3: The assigned weights are
Case 4: The weights are optimized.
Case 5: This case involved the application of the model to the existing roundabout geometry.
Cases 1 to 4 aimed to evaluate the sensitivity of the optimal geometries and objective values to the values of the weights. In Case 5, the geometric variables were just input without running the model, and the outputs were the corresponding objectives. This case would correspond to the trial method that was used to design the roundabouts. A comparison of the results of Cases 1 to 4 with Case 5 would reveal model performance with respect to existing conditions.
Fountain–Blair Roundabout
The optimal objective values of the Fountain–Blair Roundabout are shown in Table 2. As noted, the objective function values of Cases 1 to 4 are less than the objective function of the existing conditions, where the reductions reached a maximum of 15.2%. Also, Case 1, with a weight of 0.8 for safety, produced the lowest collision frequencies and performed better than all cases. When mobility was the focus of the model with a weight of 0.7, the delay improved by about 26% (from 22.1 s to 16.4 s). By applying a weight of 0.6 to the sustainability objective, the reduction reached 14.5% (from 127.1 to 108.7). The mobility objective seems to be more sensitive to the geometric parameters than safety and sustainability objectives. When the weight of the safety objective was decreased from 0.8 to 0.5 or 0.2, the change in collision frequency was not major nor that in vehicle emissions. When the weights are optimized (Case 4), the optimal weights were
Comparison of the Objective Values for Different Cases
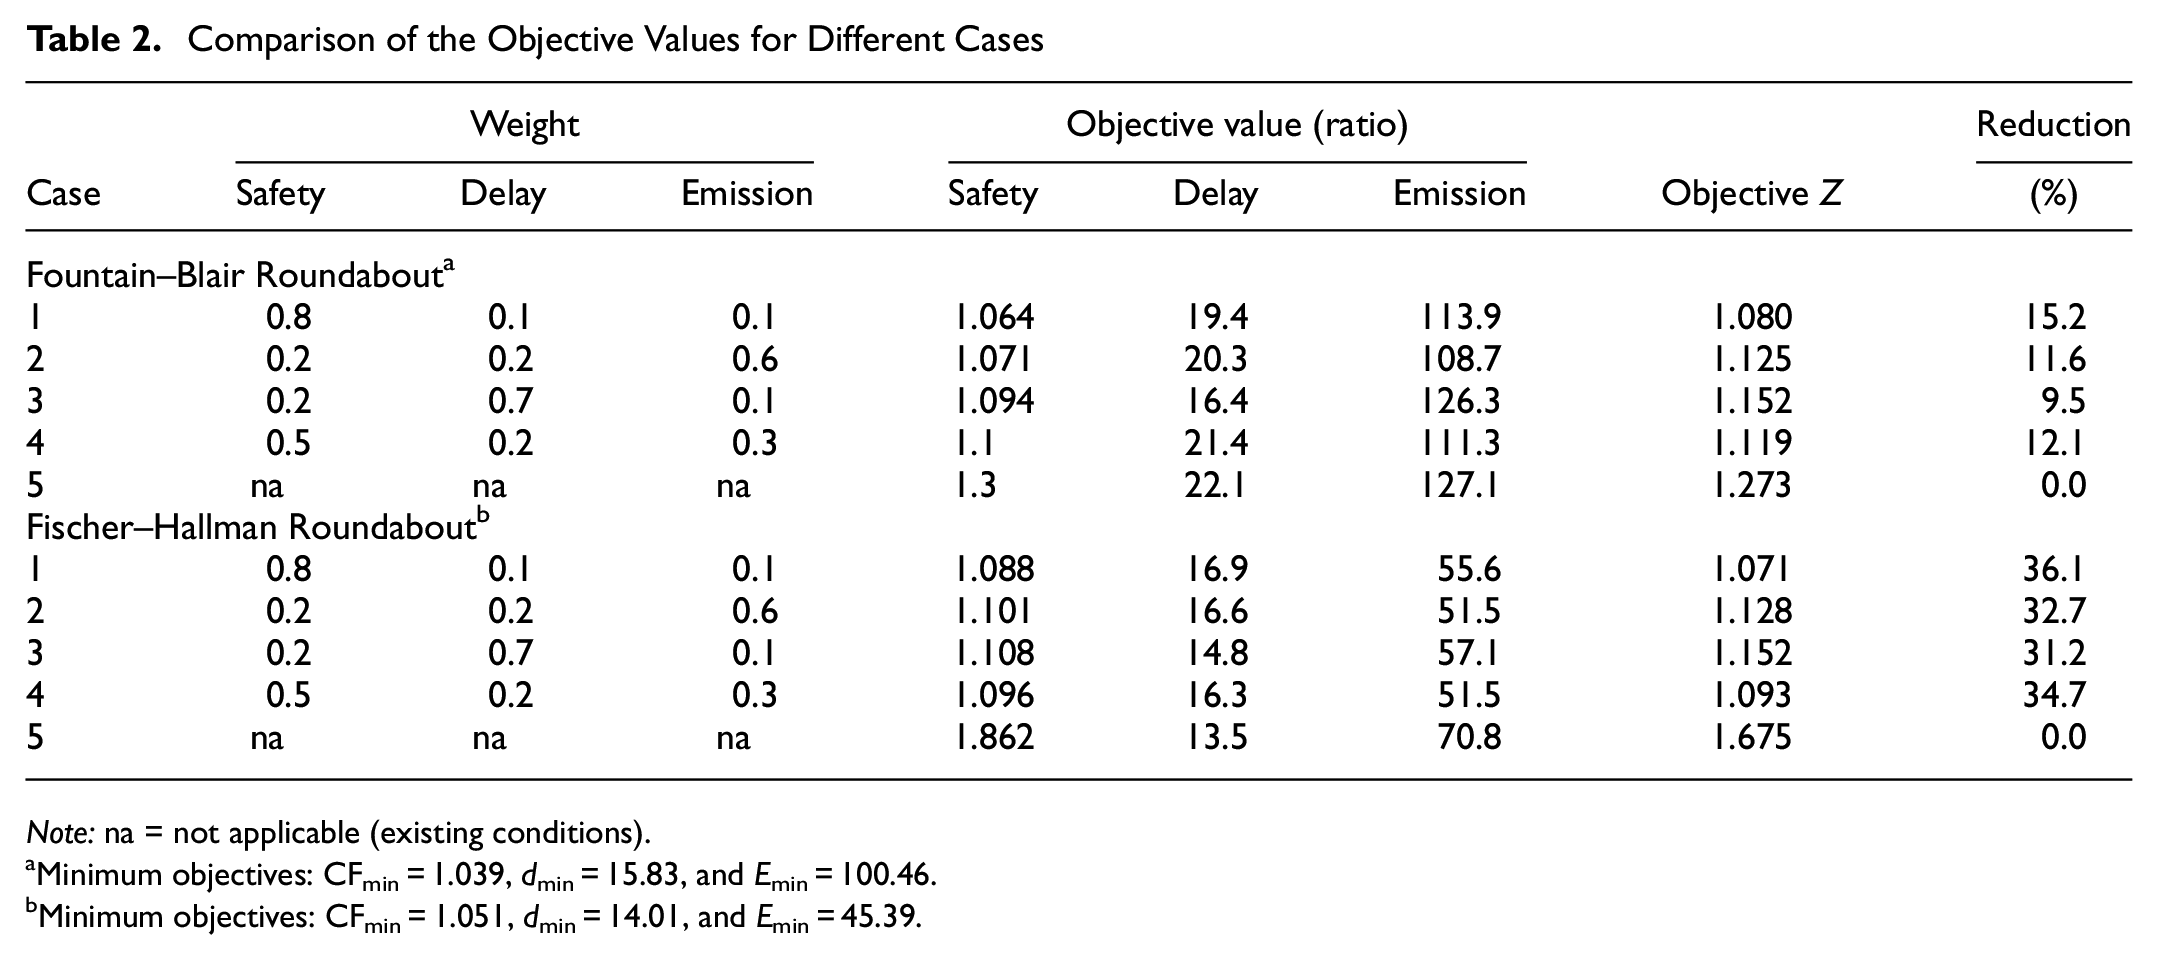
Note: na = not applicable (existing conditions).
Minimum objectives: CFmin = 1.039, dmin = 15.83, and Emin = 100.46.
Minimum objectives: CFmin = 1.051, dmin = 14.01, and Emin = 45.39.
Optimal Results for Case 4 (Optimized Weights)
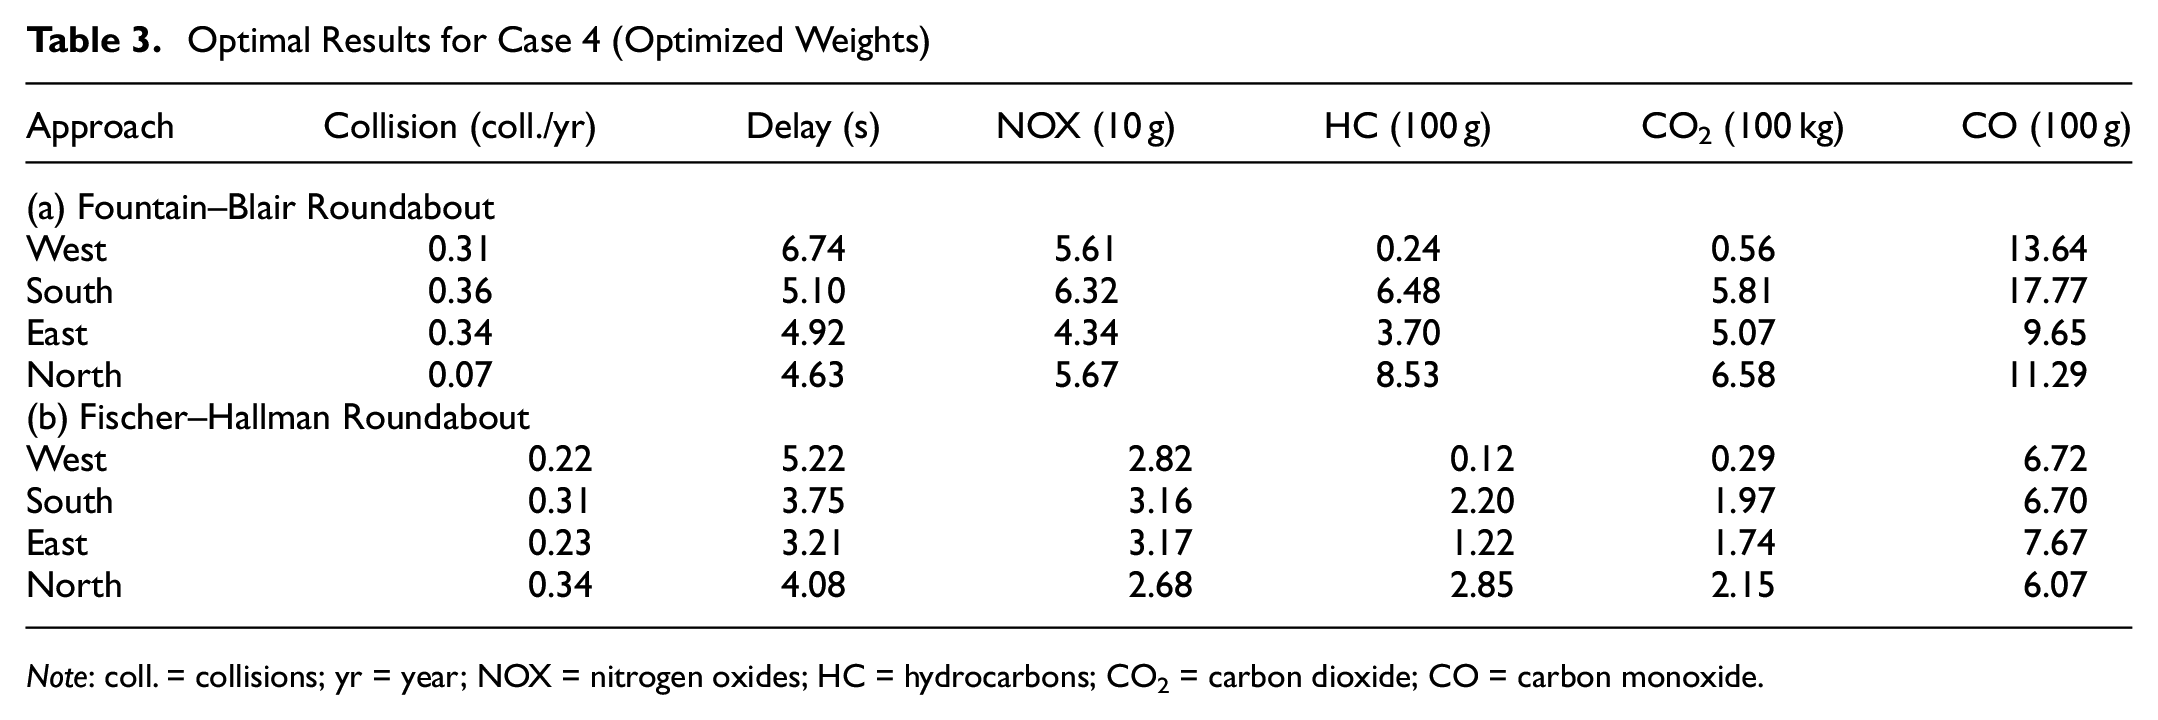
Note: coll. = collisions; yr = year; NOX = nitrogen oxides; HC = hydrocarbons; CO2 = carbon dioxide; CO = carbon monoxide.
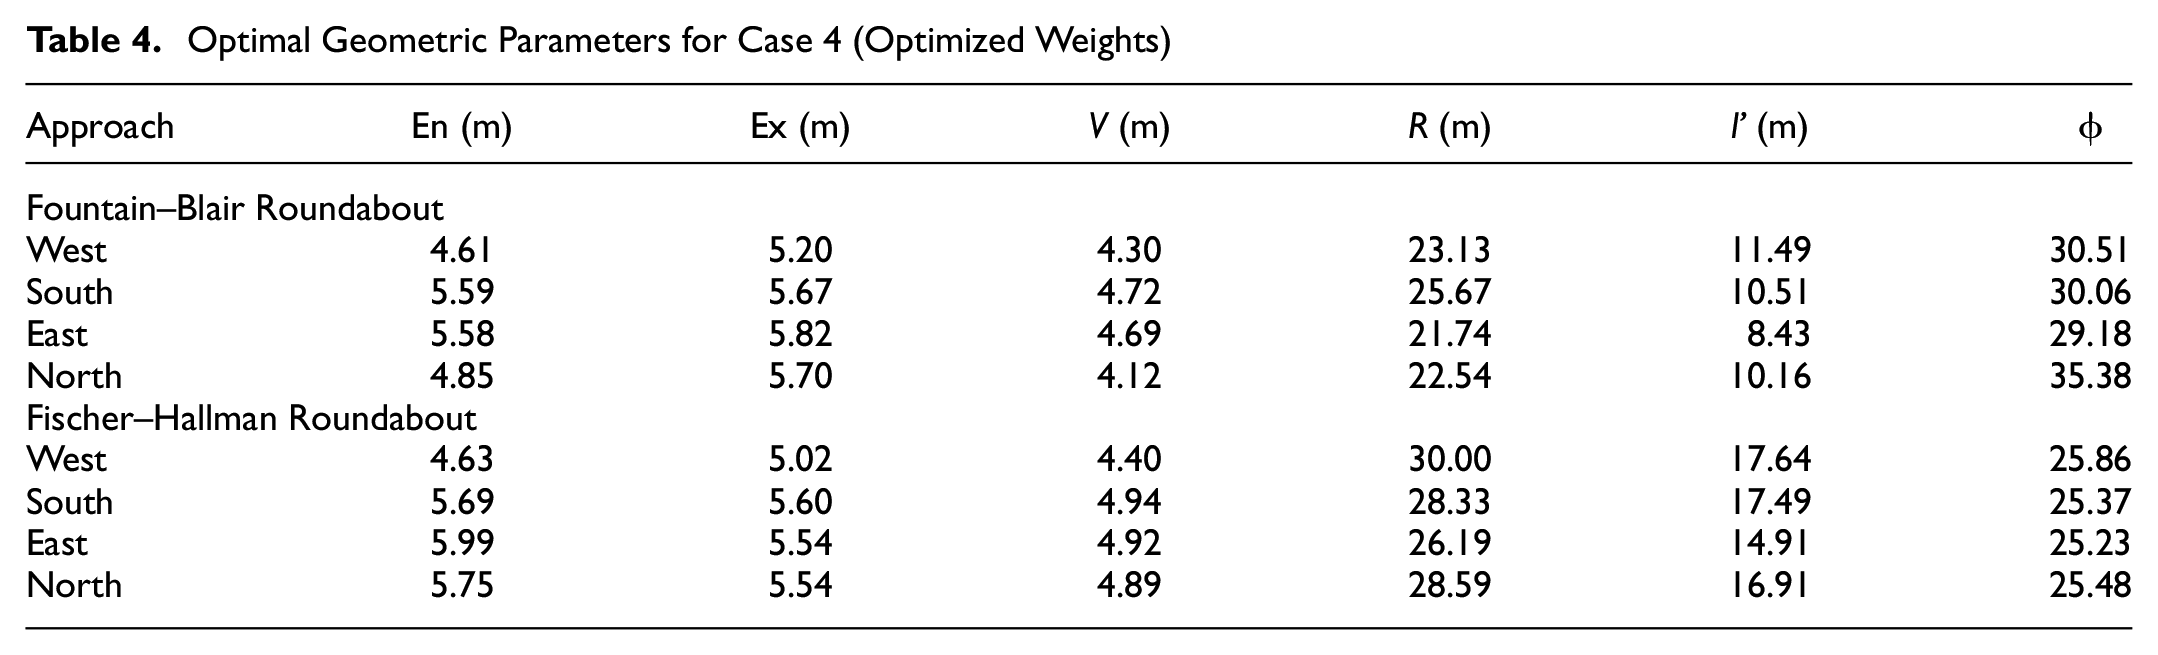
Optimal Geometric Parameters for Case 4 (Optimized Weights)
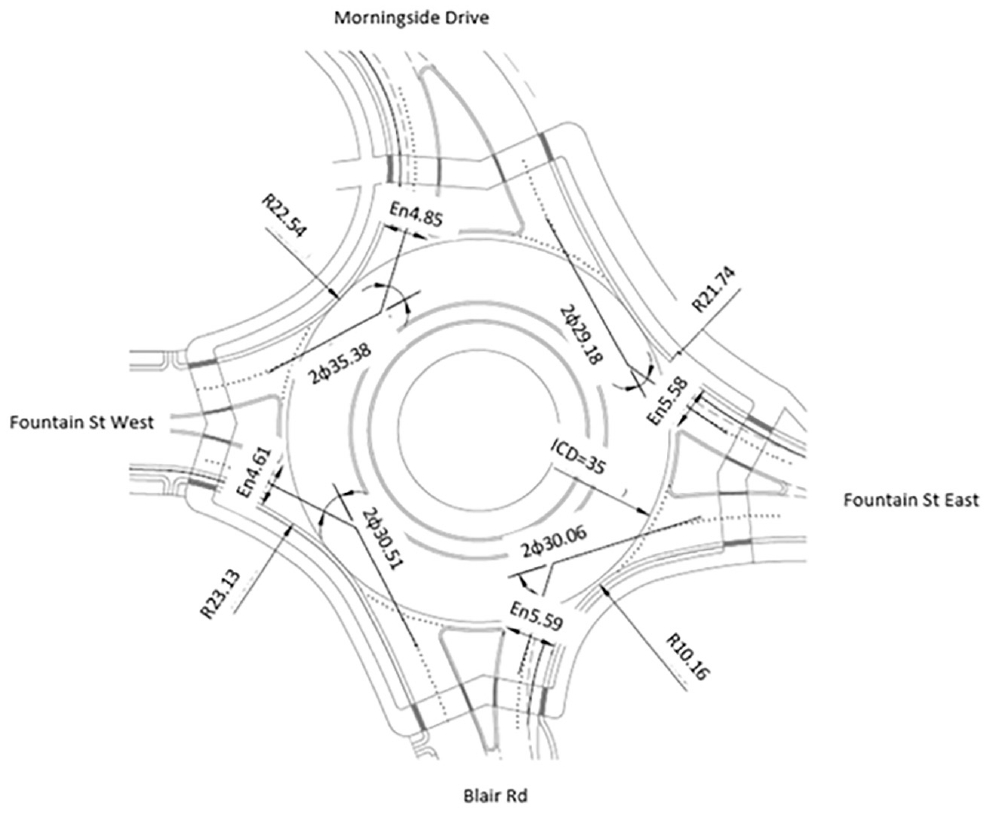
Optimized geometry of Fountain–Blair Roundabout (Case 4).
The comparison between the results of Case 4 (optimized weights) and Case 5 (existing geometry) is shown in Figure 8. As noted, Case 4 provided substantial reductions of 24% and 23% in the delay of the south and east approaches, respectively, while a larger delay in the west and north approaches are produced by the model. The model resulted in a significant improvement in environmental sustainability compared with the existing geometry for the west and south approaches and unnoticeable reduction in emissions for the north approach. The results showed that the reduction in total emissions was 22%, 20%, and 11% in the south, west, and north approaches, respectively. Safety was improved by reducing the collisions in all approaches by 25%, 24%, 20%, and 10% at west, south, east, and north, respectively.
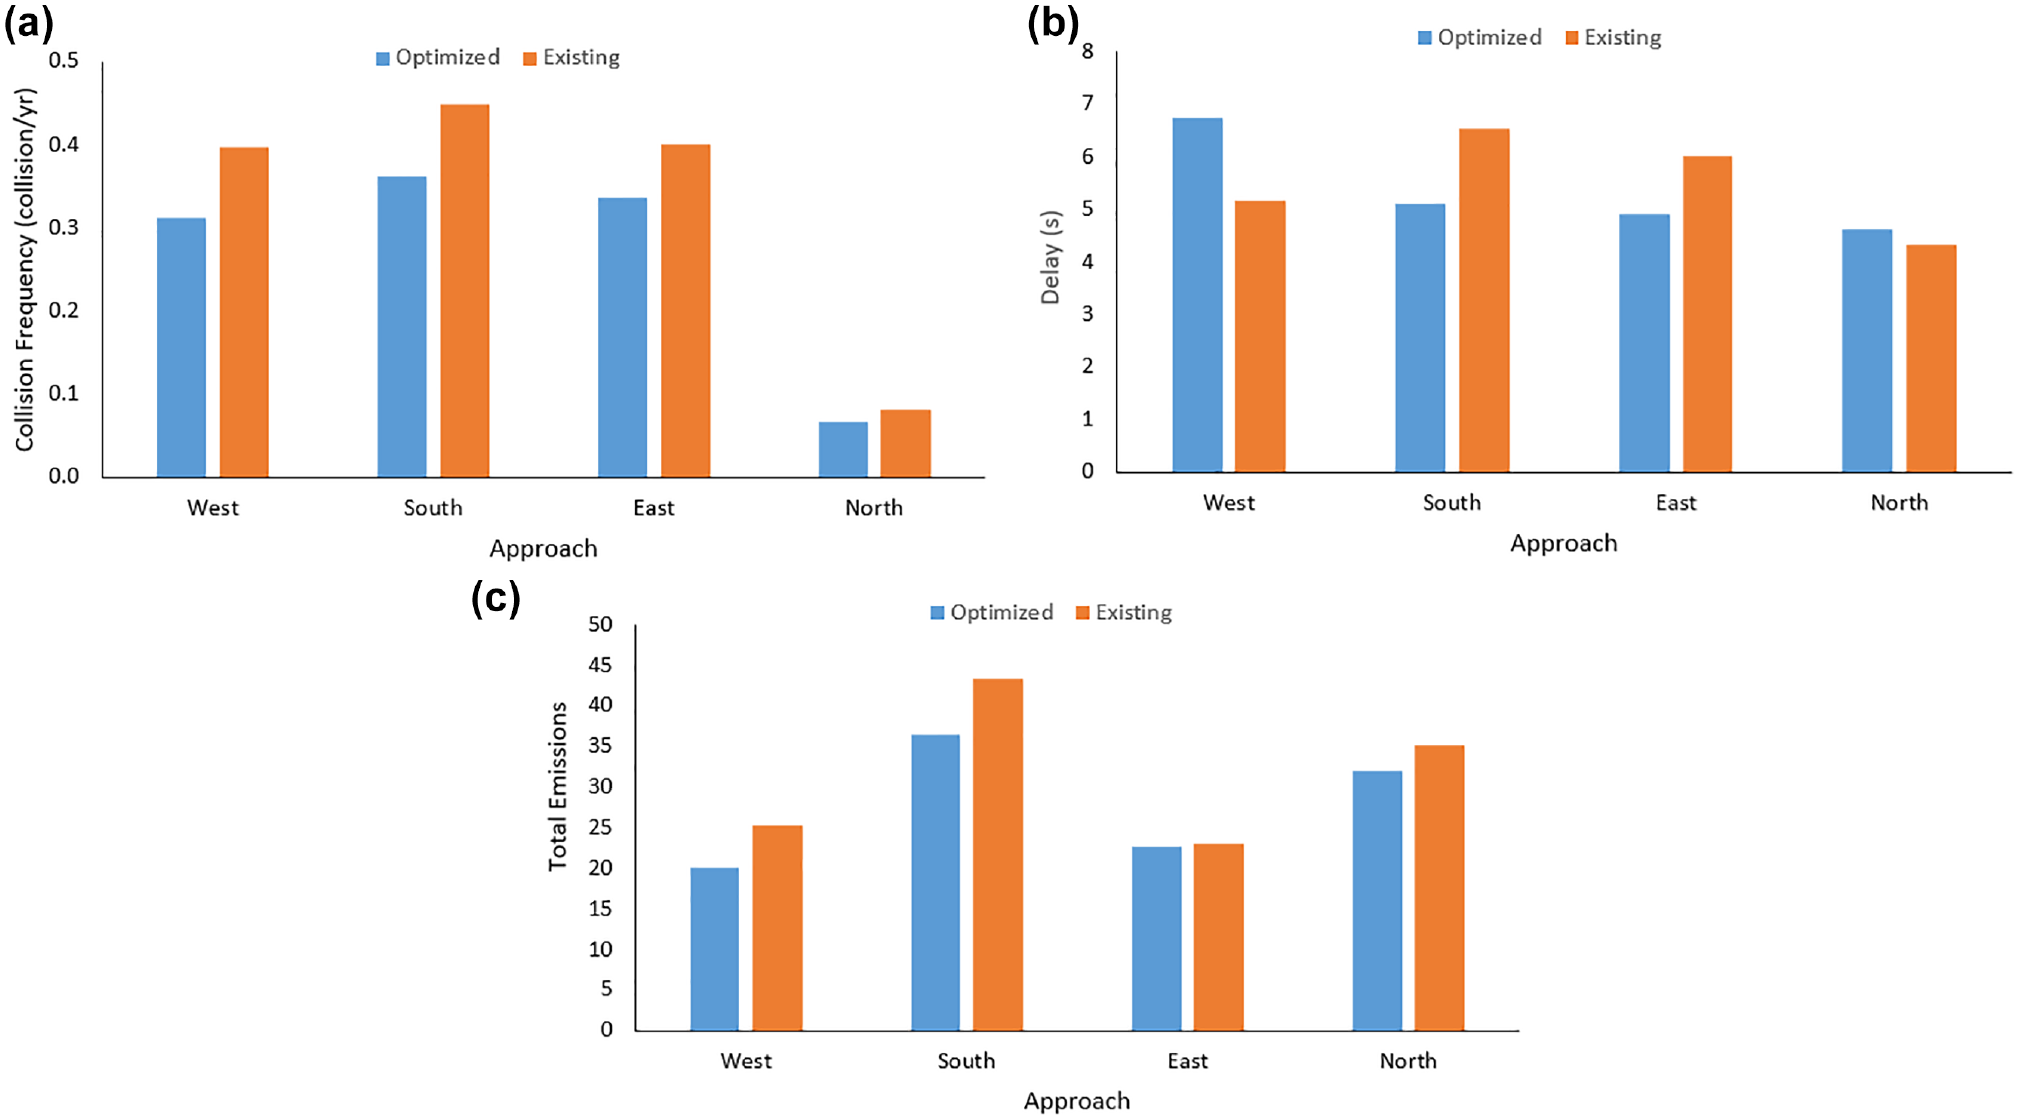
Comparison of objectives for optimized (Case 4) and existing conditions (Fountain–Blair Roundabout): (a) collision frequency, (b) delay, (c) total emissions.
Fischer–Hallman Roundabout
The optimization results for the Fischer–Hallman Roundabout showed similar trends to those of the Fountain–Blair Roundabout, in that the model improved all objectives for Cases 1 to 4 compared with existing conditions. The optimal objective values of the Fischer–Hallman Roundabout are shown in Table 2. As noted, the reductions in the objective function values of Cases 1 to 4 ranged from 31.2% to 36.1%. Also, the larger weights assigned to the safety, delay, and emissions in Cases 1 to 3 resulted in substantial reduction in the respective objective. When the weights were optimized (Case 4), the optimal weights were
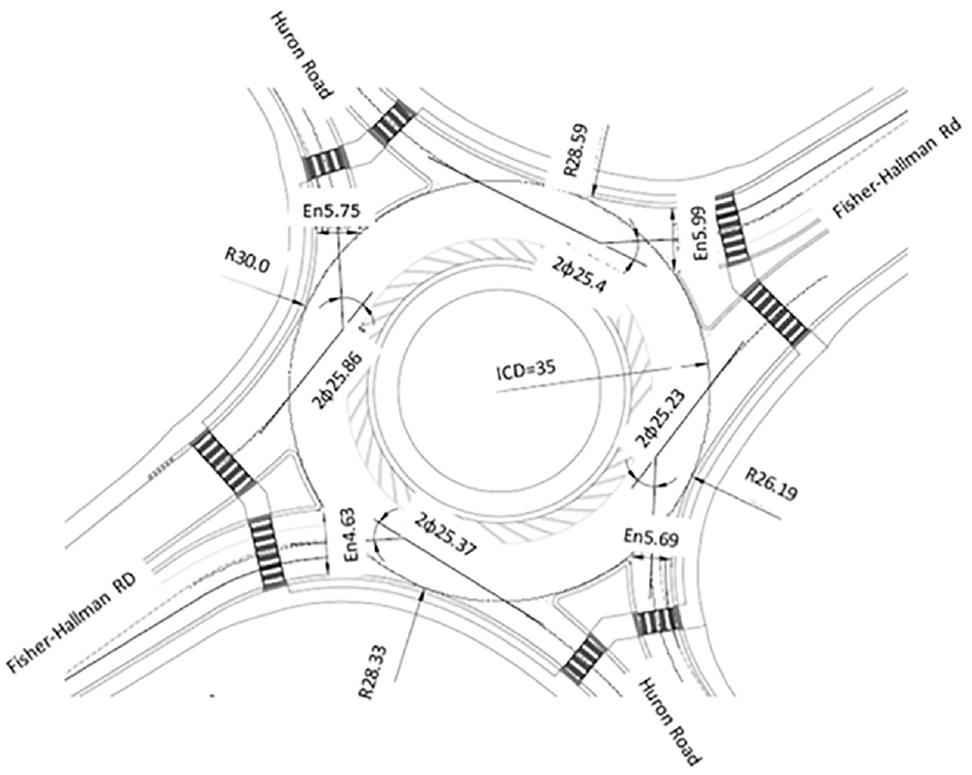
Optimized geometry of Fisher–Hallman roundabout (Case 4).
The comparison between the results of Case 4 (optimized weights) and Case 5 (existing geometry) is shown in Figure 10. As noted, the average crashes are reduced by 45%, 43%, 41%, and 40% in the north, west, east, and south approaches, respectively. The optimization model improved sustainability in all approaches. Mobility is improved by reducing the delay in the east approach, while larger delays in the west, south, and north approaches are produced by the model. The emissions are reduced by 36%, 35%, 28%, and 6% in the south, north, west, and east approaches, respectively.
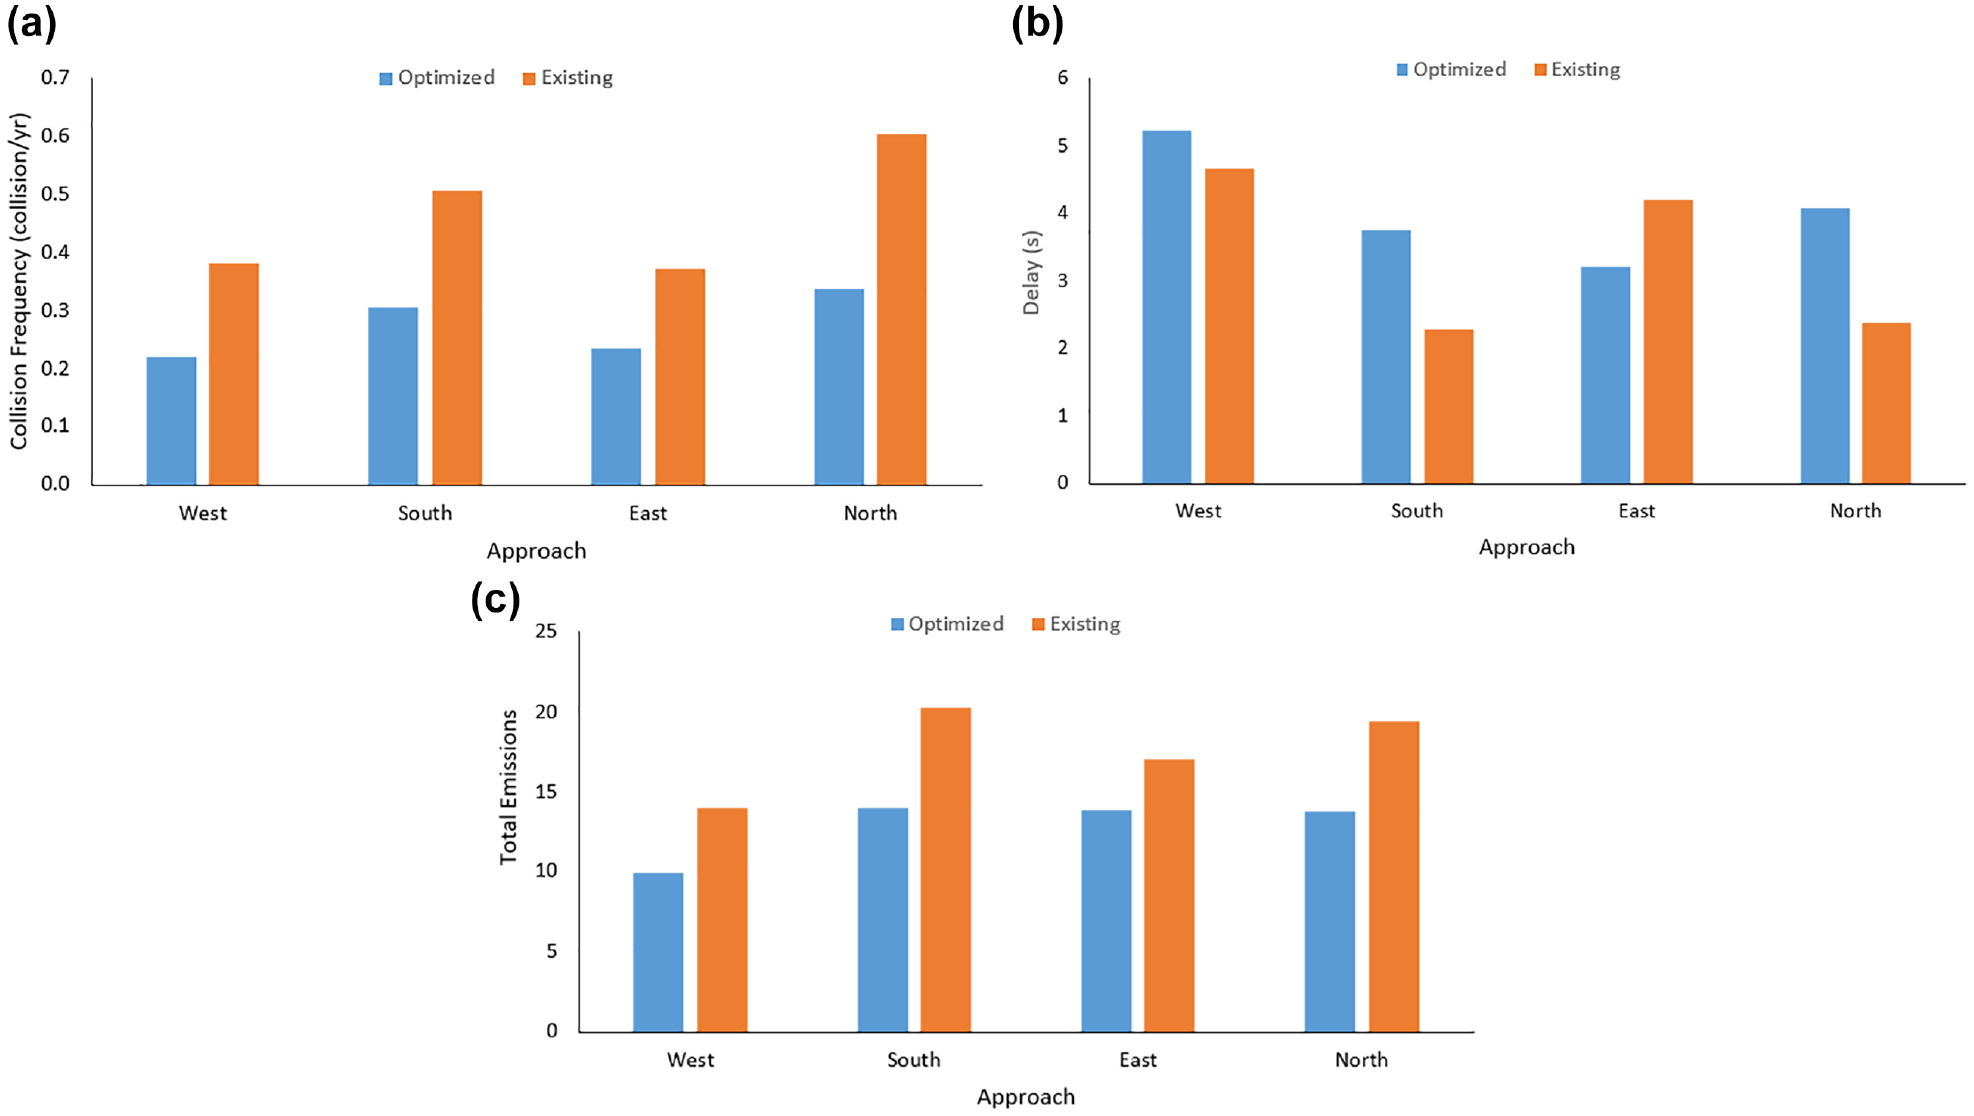
Comparison of objectives for optimized (Case 4) and existing conditions (Fischer–Hallman Roundabout): (a) collision frequency, (b) delay, (c) total emissions.
Concluding Remarks
This paper has presented a multi-objective optimization model for determining the optimal geometric dimensions of single-lane roundabouts. Three design objectives were modeled: safety, mobility, and environmental sustainability, which are minimized using collision rate, delay, and vehicle emissions, respectively. The model was applied to two existing roundabouts to evaluate potential improvements and the results revealed that the optimization model resulted in substantial improvements, compared with the traditional trial process. Based on this study, the following comments are offered:
Geometric design of roundabouts is the most complicated process in road design. The design of roundabouts involves trade-offs between delay, safety, and sustainability. The proposed model considers all three design objectives. The users need only prepare geometric and traffic data for the selected site and use the simple Excel spreadsheet developed in this study. All the defined constraints affect each other and are simultaneously considered when finding the optimal solution. In addition, the parameters are related to one another as changing one parameter affects the other parameters.
The modeling of vehicle emissions in the proposed model was challenging and was accurately accomplished after considering a few options. Based on the different vehicle trajectories and the different movements, nine speed profiles were modeled for each approach. The operating speed was modeled second by second through the influenced length of the roundabout which starts when the traveling vehicle decelerates from the upstream approach speed and ends when the vehicle reaches the downstream approach speed for each speed profile. Based on this process and the assumed acceleration/deceleration, the VSP was calculated. The vehicle emissions were determined based on the specific power values for each speed profile. The total emission is calculated by considering the percentage of vehicles that experience each profile and the number of vehicles in each movement.
The model can be applied by considering single or multiple objectives, depending on the purpose of the study, where each objective can be assigned a suitable weight, or the model can be used to optimize those weights. The scale issue of the three objectives was resolved by considering each measure as a proportion of the minimum value of the measure that could be achieved (when its weight is unity). The model includes an important constraint on the weights of the objectives, where the weight of the safety objective can be specified to be larger than that of other objectives, as is required by many transportation organizations.
The model was applied to two actual roundabouts and the results were evaluated using five different cases, involving different objective weights specified by the user and optimized by the model. The results showed that the objective function is somewhat sensitive to the weights. A small difference in the weights could produce a larger difference in results. In addition, the results showed that the model substantially improved the collisions, delay, and emissions for all approaches compared with the traditional trial process (existing conditions). For the two roundabouts, the improvement of the proposed model ranged from 45% to10% for collision frequency, 23% to 31% for delay, and 6% to 36% for vehicle emissions. The results revealed that the objective function was improved in all four cases compared with the existing geometry. The maximum improvement in the objective function in the Fountain–Blair Roundabout was 15.2% and that in the Fischer–Hallman Roundabout was 36.1%.
Future research can be conducted to extend the presented model in two areas. First, more design objectives could be incorporated into the model to suit specific site needs. Second, the model can be extended to address different types of roundabouts, including double-lane and turbo roundabouts.
Footnotes
Acknowledgements
The authors are grateful to four anonymous reviewers for their thorough and most helpful comments. The authors are thankful to Holly Kents, Marcos Kroker, and Malcolm Lister at Regional Municipality of Waterloo for the provided data of the selected intersection. The authors are also thankful to Daniel Jakubek and Noel, Ryerson librarian staff, for assisting in retrieving the aerial photographs.
Author Contributions
The authors confirm contribution to the paper as follows: study conception and design: Easa, Ahmed; data collection: Ahmed; analysis and interpretation of results: Easa, Ahmed; draft manuscript preparation: Easa, Ahmed. All authors reviewed the results and approved the final version of the manuscript.
Declaration of Conflicting Interests
The author(s) declared no potential conflicts of interest with respect to the research, authorship, and/or publication of this article.
Funding
The author(s) disclosed receipt of the following financial support for the research, authorship, and/or publication of this article: This project was financially supported by the Natural Sciences and Engineering Research Council of Canada (NSERC).