
Abstract
Following airline mergers and network reorganizations aimed at reducing operational costs, consolidated air services at large hub airports have encouraged air travelers to forego use of their smaller local airports to access large hub airports offering superior air services farther away. This study investigates airport leakage in areas of Wisconsin and Michigan served by small airports, where air travelers may leak to neighboring large hubs. Using a proximity-based service area definition, three airports experiencing leakage are identified, and a hierarchical logit airport choice model is applied that accounts for air service characteristics and access distance for travelers coming from these airports’ service areas. Results show that a similar mean number of flight legs at both the local and substitute (large hub) airports will encourage leakage at Dane County Regional and Gerald R. Ford International airports, indicating that adding direct flights alone will not be sufficient to combat leakage. Comparable access distances to local and substitute airports have opposite effects on the local markets of Gerald R. Ford International and Milwaukee Mitchell International airports—promoting leakage at the former but discouraging it at the latter. Furthermore, proportional increases in airfares at local airports lead to uneven losses of markets in investigated service areas. Overall, the study provides empirical evidence of long-distance airport leakage in parts of the U.S. Midwest, and how its implications can be used by small airports seeking to further understand and respond to travelers’ airport choices within their local markets.
Air travelers often forego their small local airports and drive long distances across regional and state (and national) boundaries to depart from large hub airports that offer superior air services, such as direct, more affordable, and frequent flights ( 1 – 3 ). With airline mergers and hub reorganizations that aim at lowering operational costs, the disparity in air services between small and large airports has grown, thereby putting large hub airports in a better position to attract passengers from far away ( 4 , 5 ). Air travelers’ choice of distant large airports over their small local airports is known as airport “leakage” ( 2 ), and has direct consequences for these small airports. Passenger losses can lead to service degradations that include increasing fares and reduced services, which further exacerbate local air market loss, eventually resulting in a vicious cycle of airport leakage ( 6 ). The local economy of regions served by small airports may also experience losses in potential revenue because of reductions in employment and tourism ( 6 ). For instance, it was estimated that Wisconsin’s economy could have gained over 233 million USD in revenue, 600 jobs, and dozens of new flights if travelers had chosen their local airport of Milwaukee Mitchell International Airport (MKE) instead of leaking to Chicago airports ( 7 ). On an international scale, transborder leakage to U.S. airports is believed to cost the Canadian economy 2.4 billion USD in output and 9,000 jobs annually ( 8 ).
Long-distance airport substitution has been investigated through studies that mainly account for air service characteristics at local and distant hub airports (also known as substitute airports) such as airfare, airport access cost, flight frequency, and availability of direct flights ( 1 , 2 , 9–16). In studies based on surveys, traveler-specific characteristics such as trip purpose, access to car, age, income, travel frequency, frequent flyer membership, and previous airport experience have been incorporated ( 2 , 10 ). Some studies have also accounted for airport service quality such as on-time performance and types of aircraft ( 17 , 18 ).
The purpose of this study is to use a large dataset of air ticket purchases toward better understanding interregional airport leakage and its drivers using a discrete choice model. Previous choice model-based studies have been limited by surveys mostly conducted at airports or via mail, which strongly restrict both the amount of data (despite their high quality) collected and diversity of itineraries on which passenger information is gathered. More importantly, the lack of coordinated funding among various planning institutions for collecting data on long-distance travel across neighboring regions has generally prevented an integrated megaregional study ( 19 ).
This study takes a step toward addressing the above challenges by using millions of air tickets purchased by travelers whose residential ZIP codes are known, and who departed from 27 airports in parts of the U.S. Midwest to hundreds of domestic destinations over the period from 2013 through 2018. This air ticket data is supplemented with other publicly available aviation data to build a model of long-distance airport leakage. A definition of “service area” is established in which each airport is assigned a local market consisting of a group of the ZIP codes closest to it. This definition of “service area” is a simple proximity-based configuration rather than an estimate of “airport catchment.” It is assumed that “leakage” takes place when a traveler from the service area of a small/medium airport departs out of a large hub airport serving a different service area. After determining the proportion of such travelers who abandoned their local airport, three small/medium-sized airports that lost at least a quarter of their local markets are identified and the drivers of leakage are examined using a hierarchical logit (HL) model.
Literature Review
Around the year 2000, before major airline mergers, it was estimated that air travelers would travel up to 75 mi to access airports that offered lower fares because of the presence of low cost carriers ( 15 , 16 ). Subsequent studies then showed that air travelers drove in excess of 250 mi to out-of-region large hubs ( 2 , 20 ). As the air travel industry underwent significant changes over the following years, leading to stark differences in air services among neighboring regions, it was estimated that up to 85.1% of air travelers facing connecting itineraries at their local small and medium airports leaked to large hubs up to 300 mi away ( 1 ).
The drivers of airport leakage have mainly been studied through discrete choice models and market share models. The majority of studies that employed choice models were conducted before the major airline mergers and were based on surveys of a few hundred air passengers at a single location over a short period of time ( 2 , 11 , 12 ). Despite the limitation in number of passengers and itinerary plans surveyed, such studies, in addition to accounting for air service characteristics (airfare, flight frequency, and availability of direct flights), often incorporate valuable information such as travel purpose, income, frequent flyer membership, and flying experience of travelers, which are important in explaining the propensity to “leak” ( 2 ). Market share models, on the other hand, use publicly available, aggregate data to investigate air passenger leakage ( 1 , 9 , 20 ). These studies have shown that leakage at smaller airports could potentially become irreversible without external intervention as long as competing large airports with superior air services keep attracting more passengers.
The problem of airport leakage is not one that merely concerns air travelers and small airports, but also the entire regions served by these small airports. Air services are known to stimulate regional economic development through tourism and employment opportunities ( 21 – 23 ). Airport sponsors such as cities and sub-state governmental authorities worldwide re-invest airport revenues in maintaining and expanding air services ( 4 , 24 ) and as such, loss of local market through airport leakage deprives regions of potential economic growth. Furthermore, prolonged leakage leads to depressed demand at local airports, leaving airlines little choice but to reduce air services and increase fares ( 6 )—paving the way for more leakage. To combat this detrimental effect, small airports have been using different marketing and incentivization strategies, such as waiving airport fees to persuade certain carriers into adding nonstop services, improving airport amenities, and carrying out extensive awareness campaigns ( 5 , 7 ).
With the availability of a substantially larger dataset reporting itineraries on millions of travelers originating from parts of the U.S. Midwest, this study builds on previously published long distance airport choice model studies. By incorporating variables such as airport access cost (in terms of distance), airfare, flight frequency, and number of flight legs, which are well-established drivers of leakage according to the literature thus far, HL models that provide further insight into these drivers are presented. The results offer small airports additional evidence of airport choice behavior in their intended markets and targeted knowledge to combat airport leakage.
Data
Study Area
The study focuses on the U.S. Midwest centered around Chicago, which includes parts of Illinois, Indiana, Iowa, Michigan, Minnesota, and Wisconsin. Chicago is a well-known multiairport system (MAS) consisting of O’Hare (ORD) and Chicago Midway (MDW) International Airports, attracting passengers from a large surrounding area, crossing state boundaries ( 25 , 26 ). The chosen area includes MKE which recently launched a market retention campaign called “Choose MKE” aimed at reducing leakage to Chicago and earned the airport (along with its rebranding efforts) international recognition at the Airports Council International—North America Marketing and Communications Conference in November 2019 ( 27 , 28 ). Among the study airports, MKE is also the only medium sized airport in the category of small/medium hubs that lost at least a quarter of its local market between 2013 and 2018 because of leakage, according to the ticket purchases data used in this study.
Table 1 gives a summary of the study airports explored initially, including the International Air Transportation Association’s (IATA) three letter codes and the Federal Aviation Administration’s (FAA) airport category ( 29 ).
Study Airports, with International Air Transportation Association (IATA) Codes and Federal Aviation Administration (FAA) Airport Categories
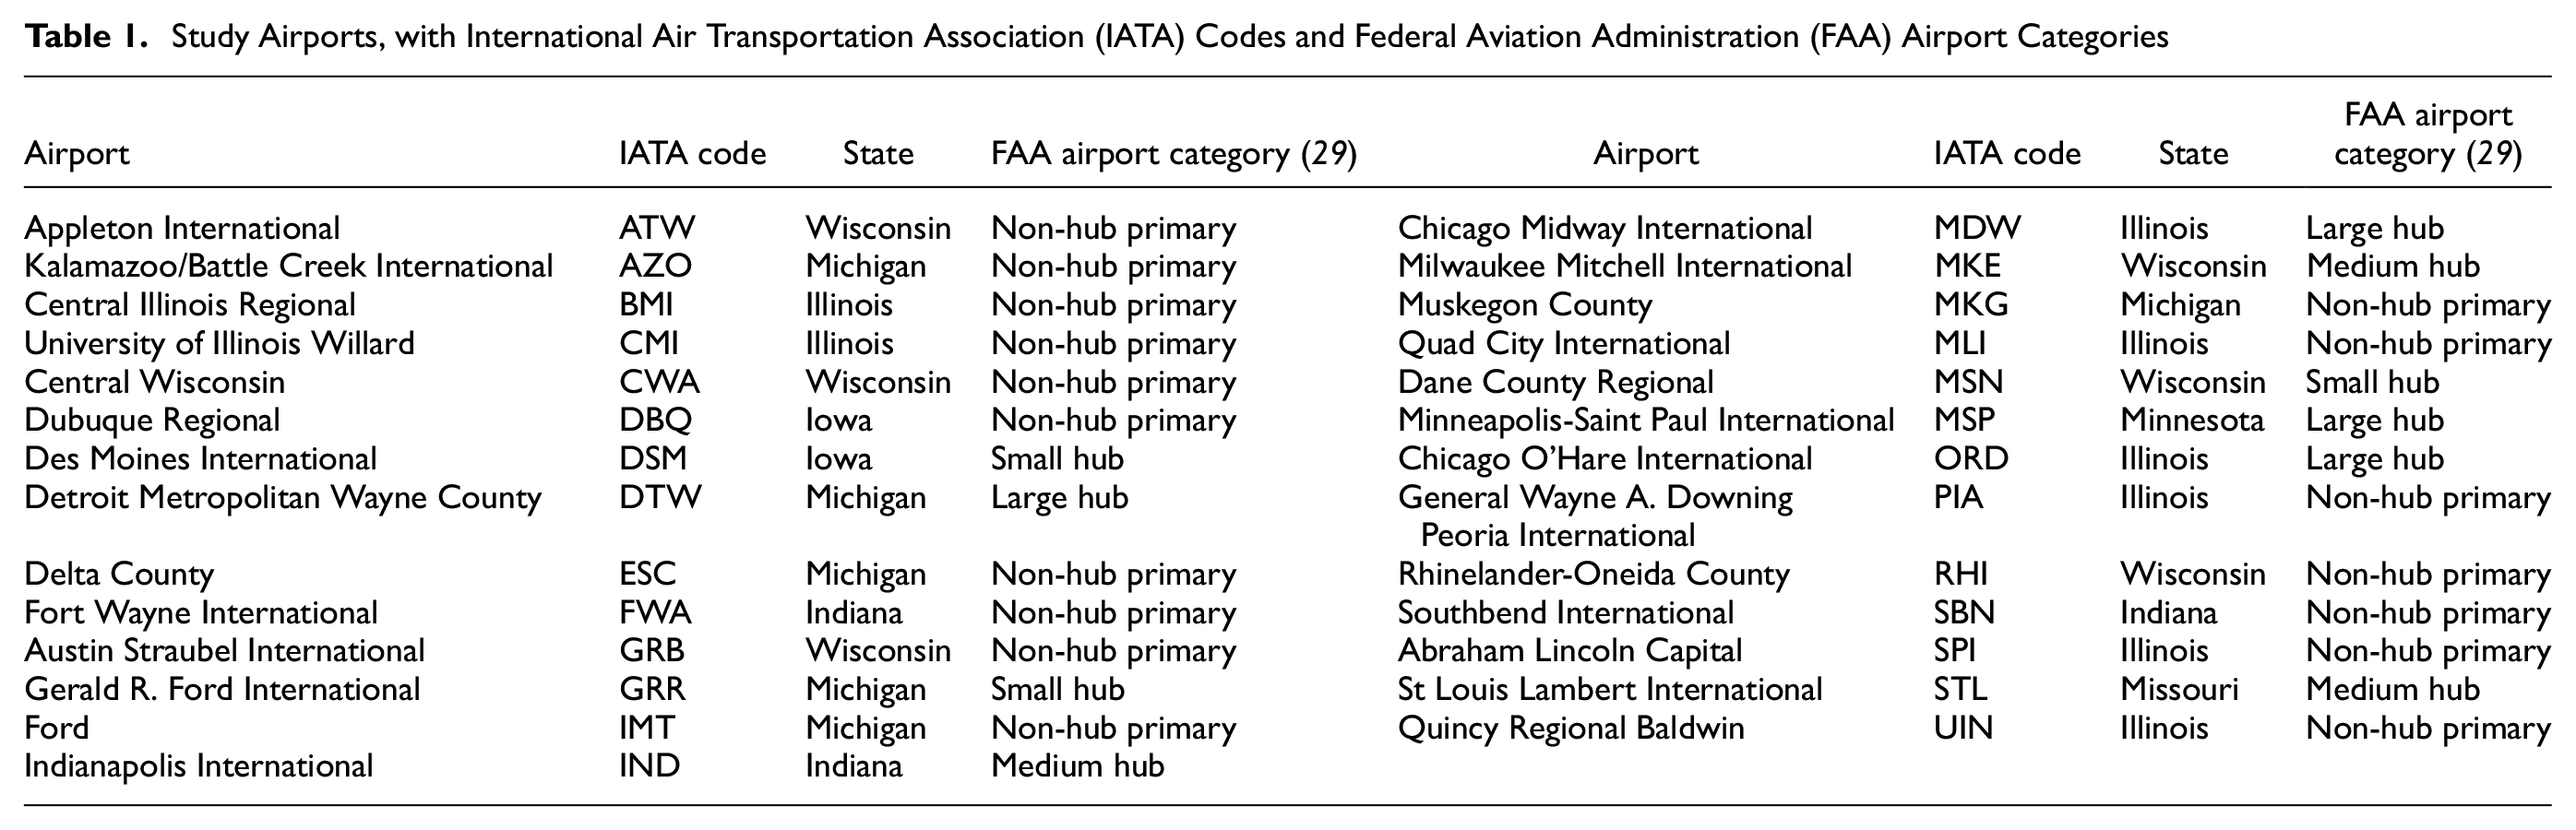
Quincy Regional Baldwin (UIN), although it was forecast to remain as a non-primary commercial service airport by the FAA in the National Plan for Integrated Airport Systems for 2019 to 2023 ( 30 ), qualified for non-hub primary according to its 2018 enplanement. A map of the study airports is given in Figure 1.
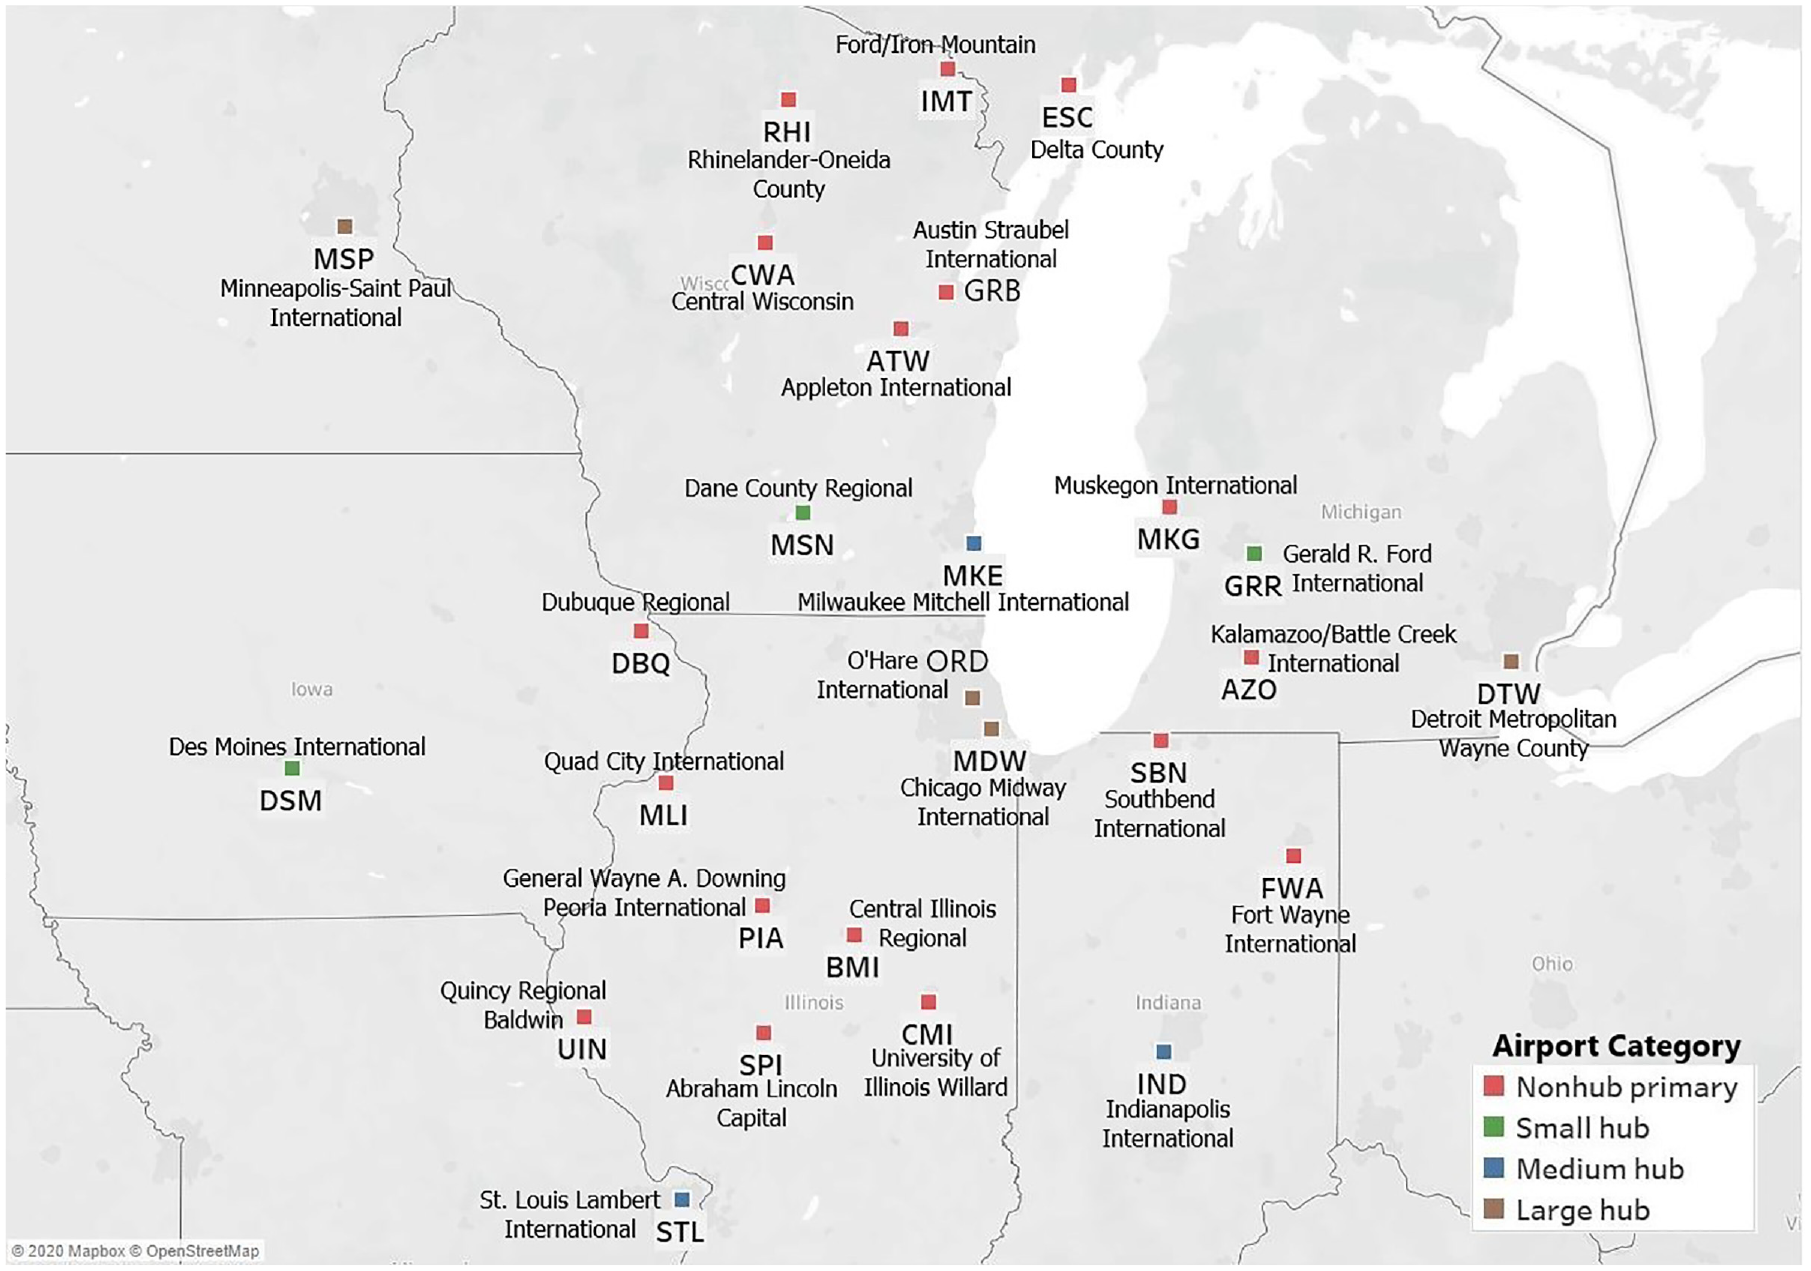
Study airports.
It is evident from Figure 1 that the MAS of Chicago is in an ideal central position to attract market from afar in all four directions.
Main Data: ARC Market Locator
Itineraries of air travelers departing from the 27 study airports for the period January 2013 through December 2018 are acquired from the Airlines Reporting Corporation’s (ARC’s) Market Locator dataset. The Market Locator data is a sample of air tickets purchased through travel agencies (both traditional brick-and-mortar and online) and contains complete information on: month and year of purchase; origin–destination (O-D); route; and ZIP code under which the credit card used to purchase the ticket(s) is registered. Because tickets purchased from travel agencies/third parties are far more likely to be for personal travel, it is assumed that most credit card ZIP codes would be travelers’ home addresses rather than those of companies. The dataset has some limitations, however. First, it is likely to contain a much higher proportion of leisure travelers over business travelers as business travelers are more inclined to purchase tickets directly from airlines rather than third-party agents. Second, itineraries on Southwest Airlines and several other low-cost carriers are not included. Annual number of travelers (on initial departure/excluding connections) reported in the Market Locator data ranges from 2% up to 3.8% of total annual enplanements for large hubs except MDW and DTW, and 3.7% up to 9.8% for the remaining airports.
Supplementary Data
To compute airport access distance and to establish the proximity-based service areas, primary and secondary road shapefiles for each of the six study states are downloaded from the U.S. Census Bureau, Department of Commerce ( 31 ). The geographic coordinates of the ZIP codes’ centroids integrated into the road networks are extracted from the publicly available data source “opendatasoft” ( 32 ), while those of airports are acquired from IATA’s airport database ( 33 ) and OpenFlights ( 34 ).
For air service variables such as airfare, flight frequency, available seat, market mile, and nonstop miles flown, the Airline Origin and Destination Survey (DB1B) ticket/market, and Air Carrier Statistics (Form 41 Traffic)—T-100 Domestic Segment (All Carriers) datasets are used on the bases of quarter and final destinations ( 35 , 36 ). Information in relation to annual enplanement is obtained from the U.S. Department of Transportation-FAA ( 37 ).
Data Cleaning, Filtering, and Processing
ARC Market Locator Dataset
To limit the scope of the model to domestic travel, first, itineraries with international final destinations are removed. Anomalous records whose origin does not match the first airport in the “routing” field, showing zero passengers, or both are also removed. After cleaning, 4,666,310 usable records that consist of travelers coming from over 4,600 ZIP codes in the six study states remain. In some cases, more than one traveler is recorded on the same itinerary. This practice of reporting multiple passengers that purchase the same itinerary plan on a single record is common among agencies (including the FAA) that report samples of total air tickets sold, allowing for dataset compression ( 38 ). Here, this data is “uncompressed” into individual itineraries to construct the disaggregate passenger level model.
The distance between every ZIP code and each of the study airports is then computed in ArcGIS, ArcMap 10.4.1, using the primary and secondary road shapefiles as well as geographic coordinates representing the centroids of ZIP codes and airports. All ZIP codes closest to a certain airport are then labeled as the “service area” of that particular airport, as shown in Figure 2. “Chicago Multi-Airport Region (CHI)” stands for the MAS of ORD and MDW that serves the metropolitan area of Chicago and its suburbs ( 39 ).
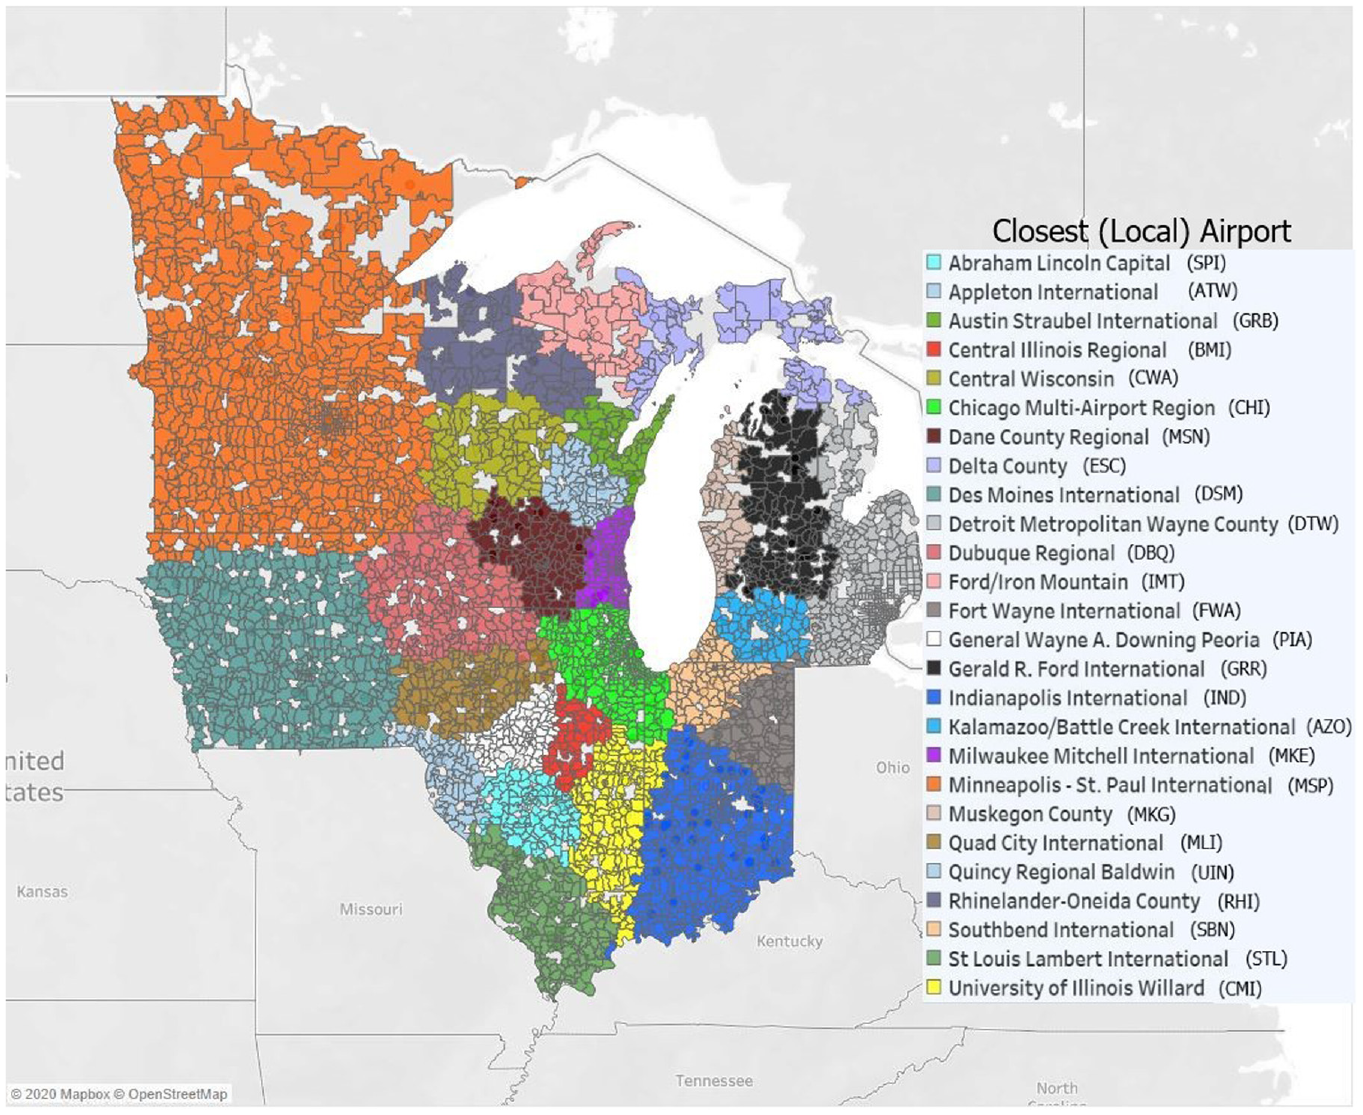
Service area of study airports.
The uncolored ZIP codes in Figure 2 have no itinerary record associated with them after data processing.
Throughout the study region, from 2013 to 2018, the data shows that 76% of air travelers traveled less than 80 mi to their chosen airport, 17% traveled between 80 and 200 mi, 5% traveled between 200 and 300 mi, and the remaining 2% traveled over 300 mi. The majority of passengers that traveled less than 80 mi consist of travelers originating from ZIP codes of the heavily populated Chicago MAS and who departed from either ORD or MDW; travelers from Minneapolis who chose MSP; and passengers from Detroit who accessed DTW. The mean extra distance traveled by leaking passengers is 79 mi, and the 75th percentile is 120 mi. On average, around 300 different U.S. domestic airports are represented as final destinations on the tickets per quarter.
Figure 3 presents the six-year airport choice distribution at 15 service areas. Service areas in which over 90% of market used local airport (IND, STL, DSM, and all four large hubs) are not included. Furthermore, service areas served by the five smallest non-hub primary airports of RHI, IMT, ESC, MKG, and UIN are excluded as these airports experienced market losses close to 100%.
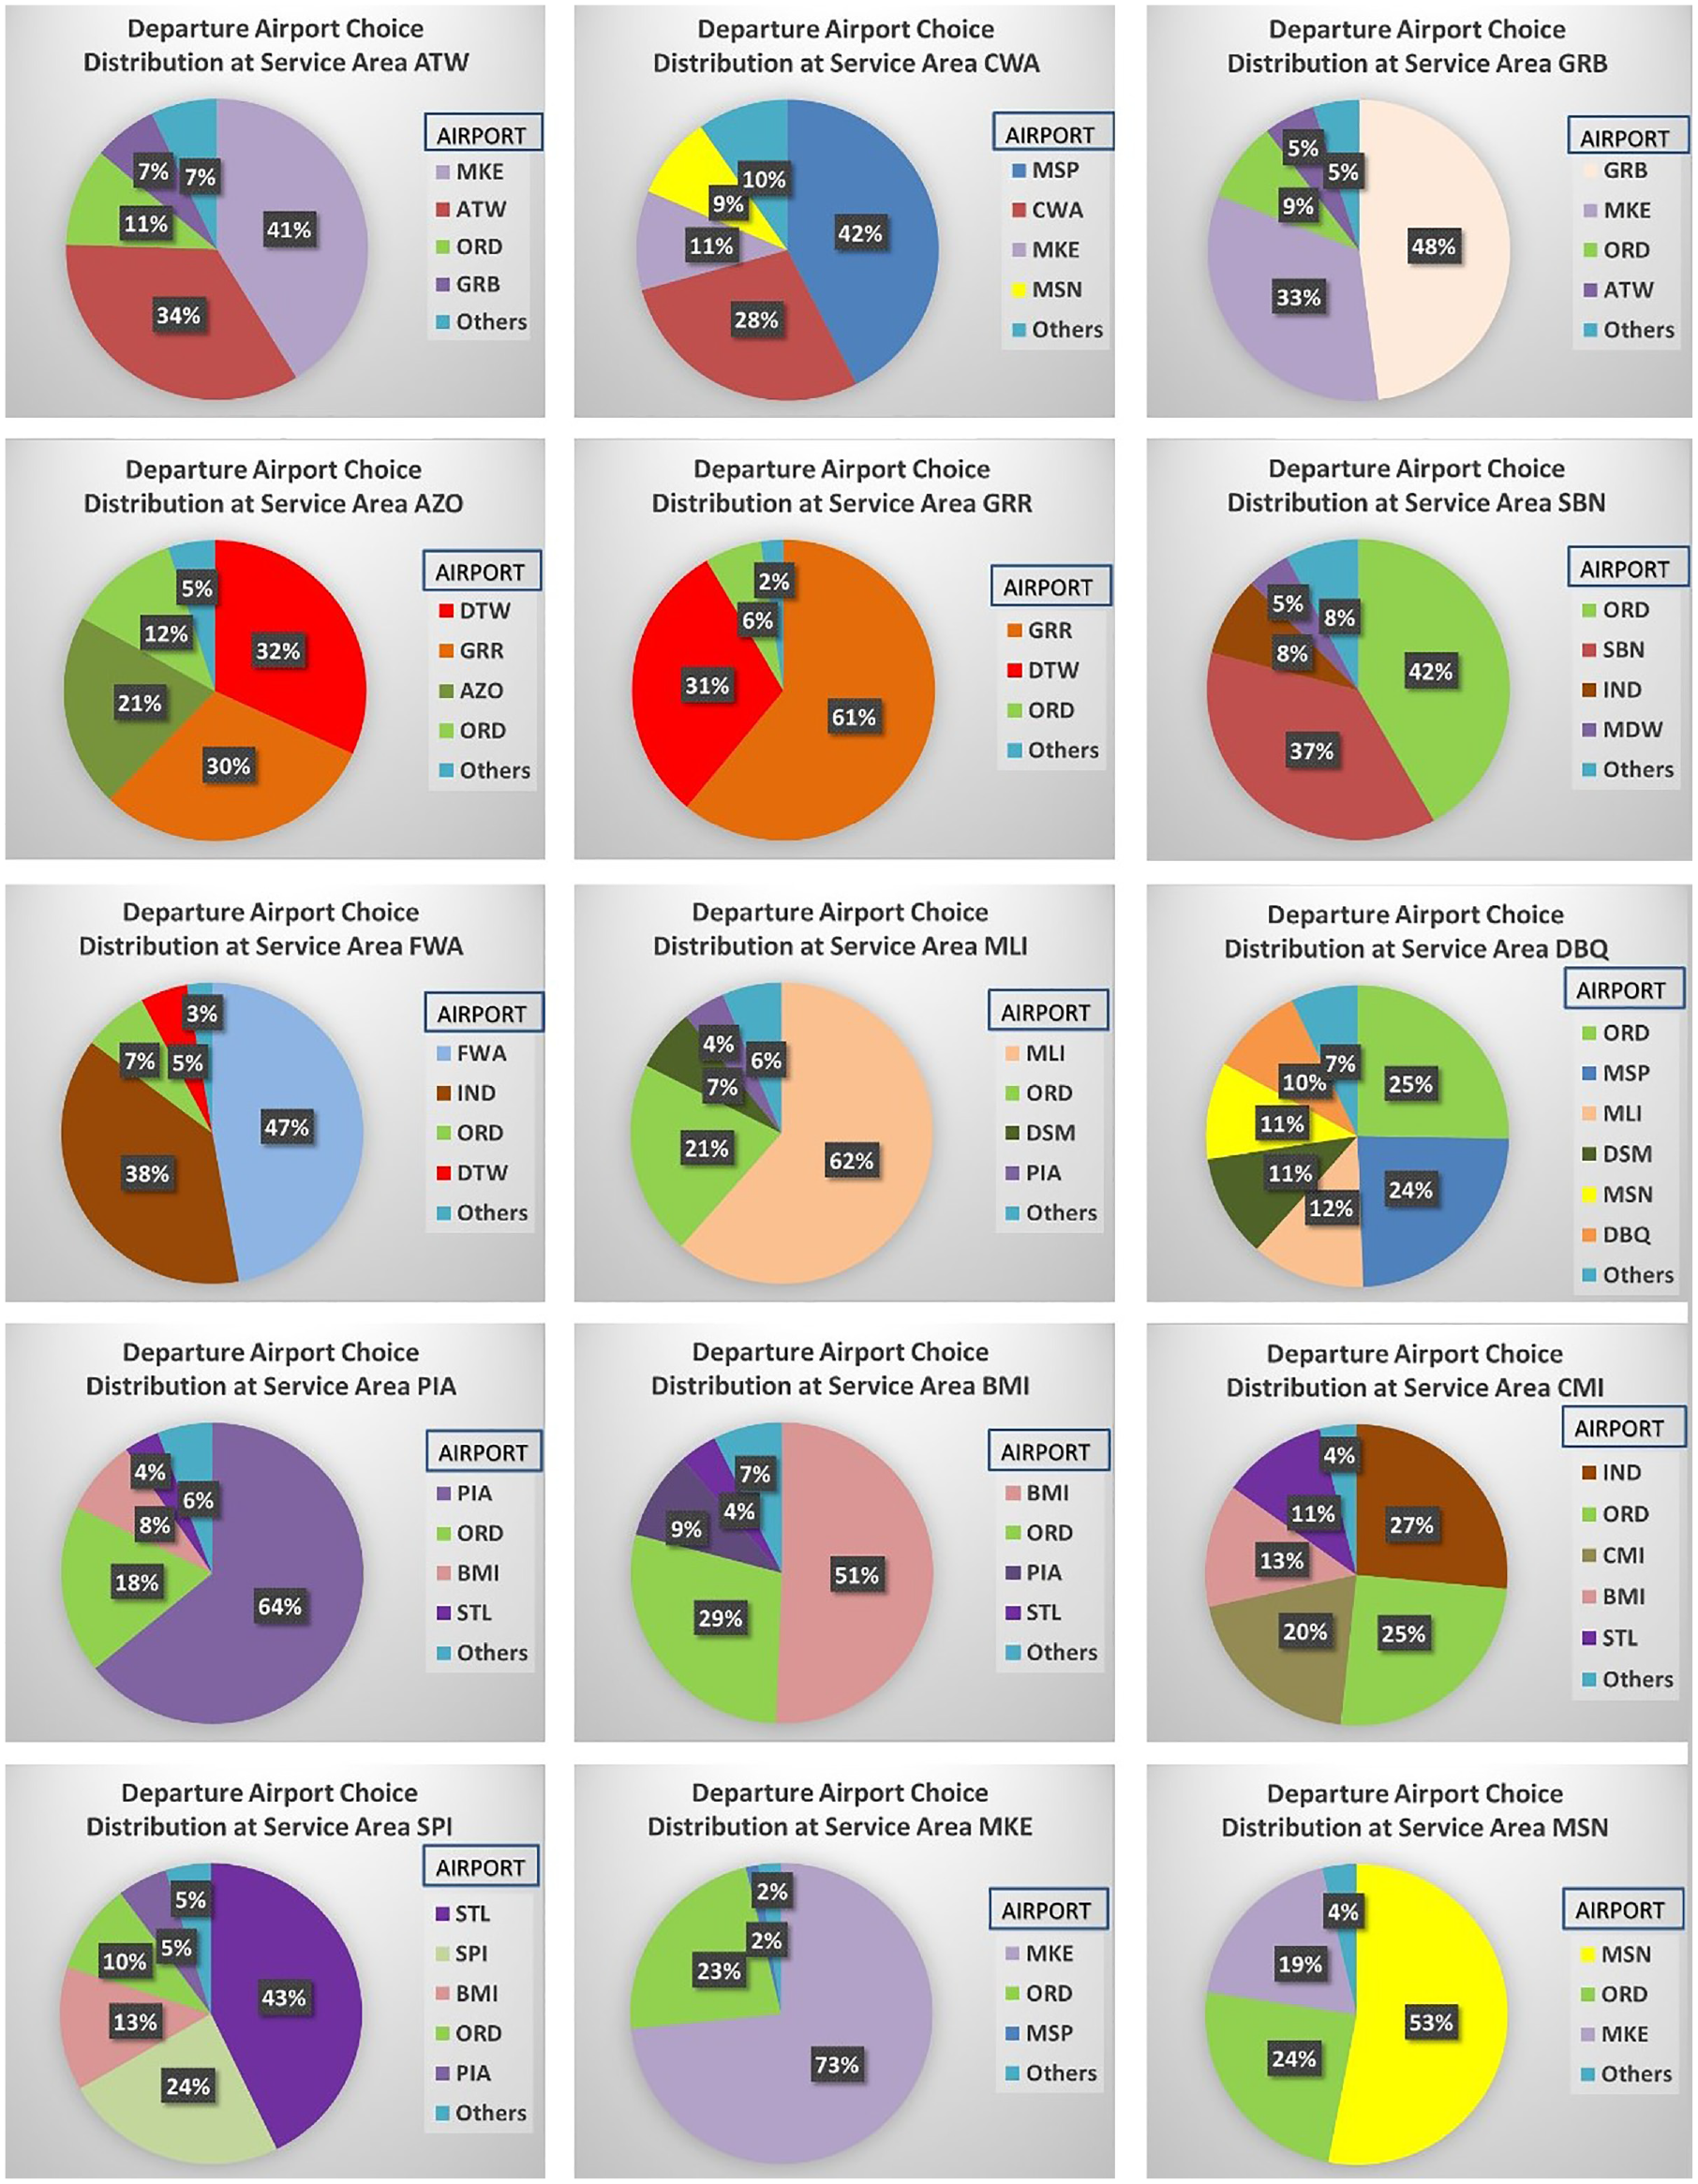
Airport choice distribution by service area.
From Figure 3, the strong attraction of ORD (bright green) is evident across this expansive study area. There is also at least one large hub that competes with the local airport in each service area.
MKE, GRR, and MSN are chosen as service areas to be modeled according to the criterion set at the beginning of the study (small/medium hub losing at least one-quarter of local market). MKE is heavily contested by ORD which is 73 mi away, and very slightly by MSP at 344 mi. MSN is contested by MKE and ORD which are 84 and 134 mi away, respectively, while GRR is contested by DTW and ORD at 147 and 200 mi.
Supplementary Data
The Market Locator data is supplemented with DB1B and T-100 records on the basis of “quarter” and “origin-final destination.” The DB1B ticket and market data are matched to extract air service variables such as airfare and market miles as well as nonstop miles flown.
Other variables, such as flight frequency, available seat, and enplaned passengers per quarter for all reported destinations, are extracted from the T-100 dataset, while number of flight legs is directly computed from the Market Locator data using route details provided.
Leakage
Figure 4 illustrates the proportion of leaked travelers at the three service areas chosen for modeling. The black continuous line cutting the ZIP codes in Wisconsin serves as the border between service areas MSN and MKE.
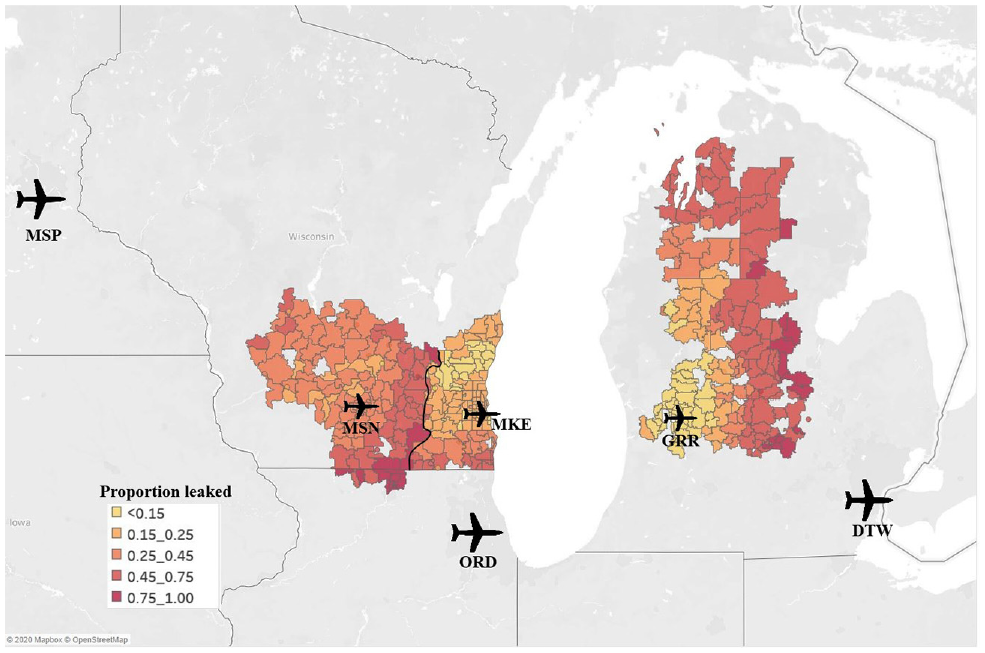
Leakage intensity in service areas of Gerald R. Ford International (GRR), Dane County Regional (MSN), and Milwaukee Mitchell International (MKE) airports.
From Figure 4 it can be seen that GRR successfully attracted market within its immediate vicinity better than both MSN and MKE, but throughout its service area, MKE outperformed both GRR and MSN by retaining more local market. The eastern half of GRR’s identified service area, toward DTW, appears to have experienced significant leakage to DTW. Travelers from that region must drive substantial distances to reach GRR and thus many drive a little farther to access DTW instead. Furthermore, travelers that originate from ZIP codes that are midway between DTW and GRR are likely to choose between these two airports based on flight services alone, without considering (the comparable) ground access times. For instance, travelers from Lansing, MI would drive approximately 1 h to GRR, and 1.3 h to DTW. These travelers are likely to tolerate an additional 0.3 h drive to access DTW’s more expansive air services, as confirmed by the intensity of leakage shown in Figure 4.
With regard to service area MSN, leakage was more intense at the border with MKE’s service area and Illinois, as travelers from those areas would drive nearly the same distances to MKE or ORD (instead of MSN). The same pattern is also observed in the service area of MKE, although at a lesser intensity—travelers on the border between service area MKE and Illinois leaked to ORD.
Approach
Modeling Market Leakage through Passengers’ Airport Choice
Discrete choice models have been used to model not only airport choice but also: airport and airline; airport and access mode; departure and arrival airports; airport, airline, and access choice; and departure airport, airline, flight, and access mode choices altogether ( 40 – 46 ).
In this study, HL models are used in which the decision to leak (or not to leak) is made first, followed by airport choice. Thus, it is assumed that a sequential decision process is practiced by travelers. The models also account for the correlation that exists between substitute airports.
Table 2 summarizes the candidate model variables that are initially explored and tested for multicollinearity.
Candidate Variables
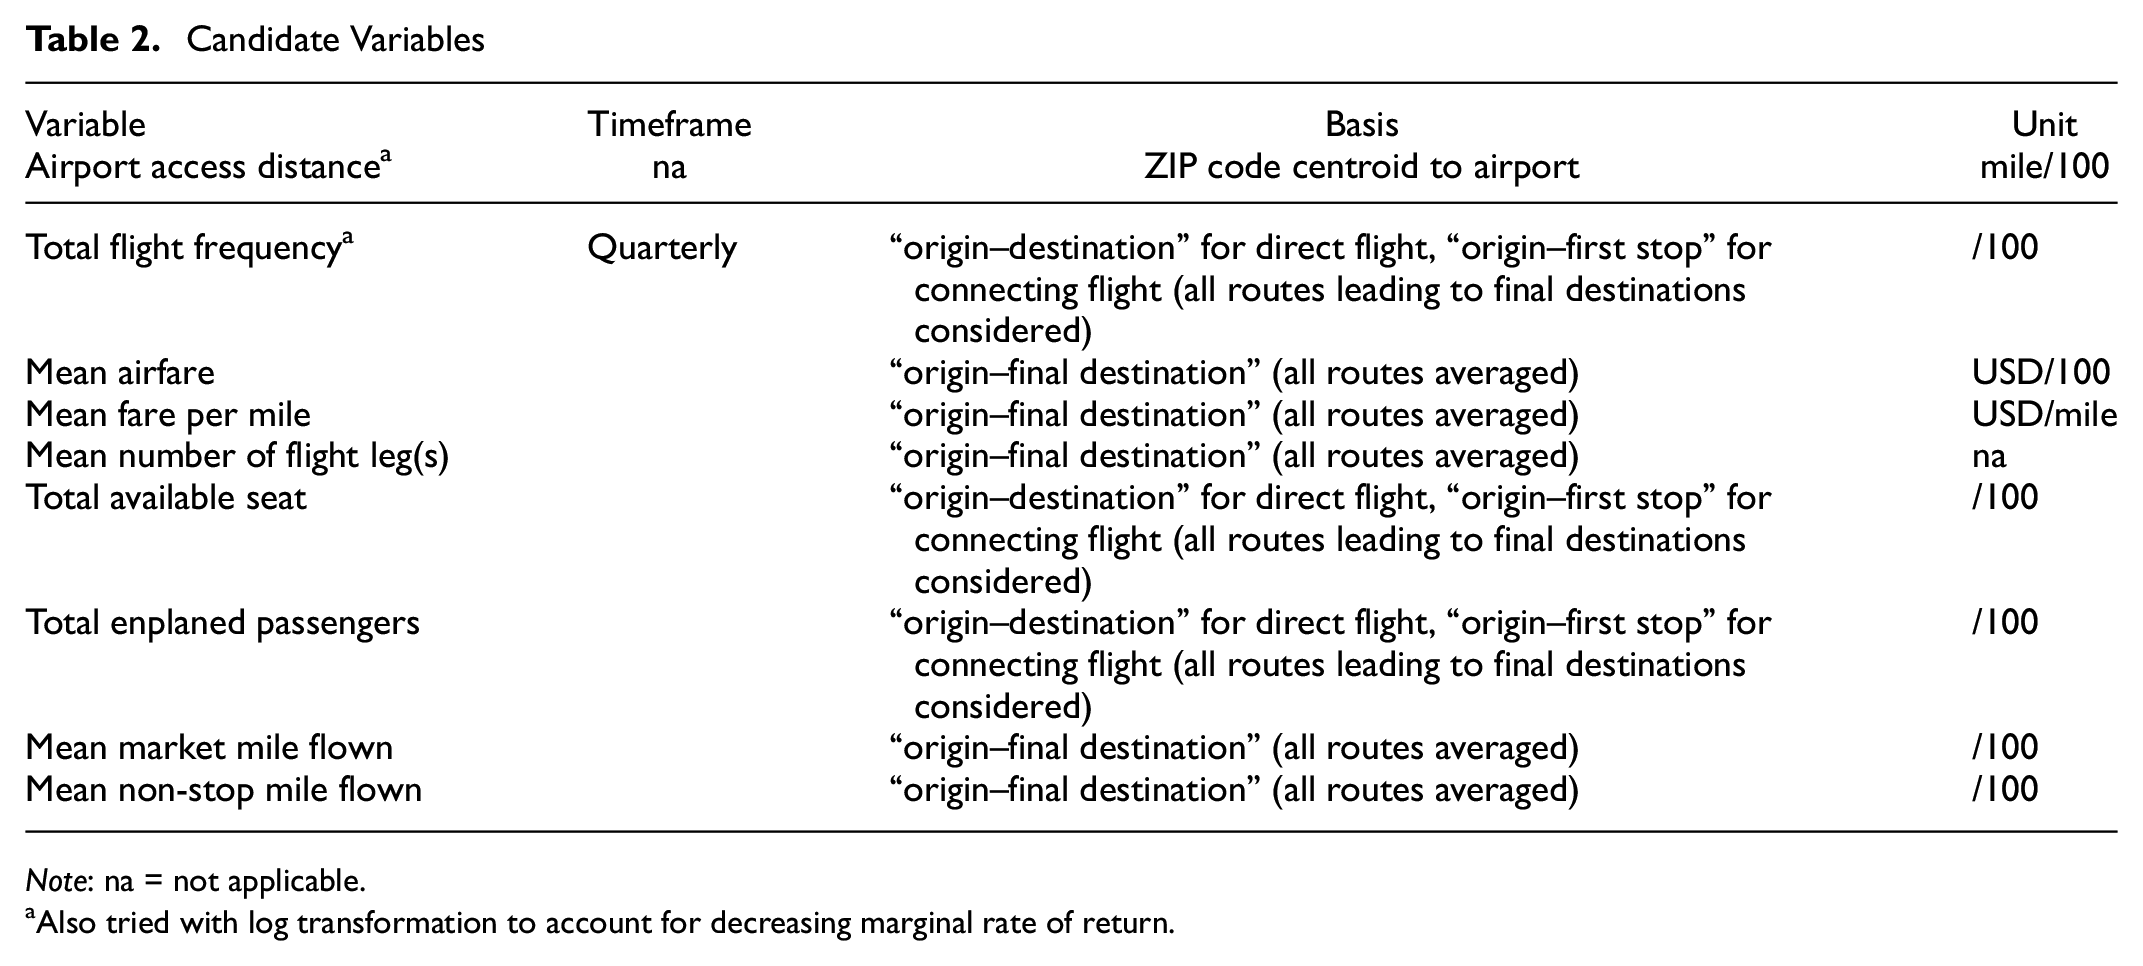
Note: na = not applicable. aAlso tried with log transformation to account for decreasing marginal rate of return.
Multicollinearity
In the presence of collinear explanatory variables, parameters calibrated by discrete choice models tend to be erroneous and poorly estimated ( 47 , 48 ). To prevent this, variance inflation factor (VIF) is used to test collinearity among candidate variables. VIF, which is expressed in Equation 1, quantifies by how much the standard error of a predictor/explanatory variable’s coefficient is inflated in the presence of collinearity in comparison with model fitted with no collinearity.

where
VIF can detect linear dependence among multiple variables even when pairwise correlations are small ( 49 ). A VIF exceeding five or at most 10 is an indication that there is strong collinearity. These upper limits have also been suggested in other studies ( 50 , 51 ). Thus, candidate variables shown in Table 2 are assessed and qualified based on this recommended maximum VIF.
HL Model Specification
A model is specified for airport choice decision at service areas GRR, MSN and MKE. The choice set per service area is decided based on three airports that collectively account for at least 95% of the local market. As such, service area GRR is served by the local airport GRR and substitutes DTW and ORD with a combined market share of 98%. Similarly, service area MSN is served by MSN, MKE, and ORD with a combined market share of 96%, and service area MKE is served by MKE, ORD, and MSP at 98%.
Figure 5 presents the proposed model structure and choice set for each service area. In specifying utility expressions, first the airfare’s coefficient is fixed across alternatives by assuming that travelers place the same value on money regardless of their choice. However, parameters associated with total flight frequency, distance to airport, and mean number of flight legs are allowed to vary across alternatives, analogous to how utilities of different travel modes are specified ( 52 ). This approach is realistic as travelers are likely to be aware of the quality of service provided at all airports and to place different weights on certain factors at local and substitute airports differently. For instance, the typical leisure traveler (there will be exceptional cases, especially among high income frequent holiday travelers [ 10 ]) is unlikely to leak to a substitute airport in search of a more suitable schedule alone, unless a direct flight or a lower fare is offered and thus is expected to value flight frequency at substitute airports less than that at local airports.
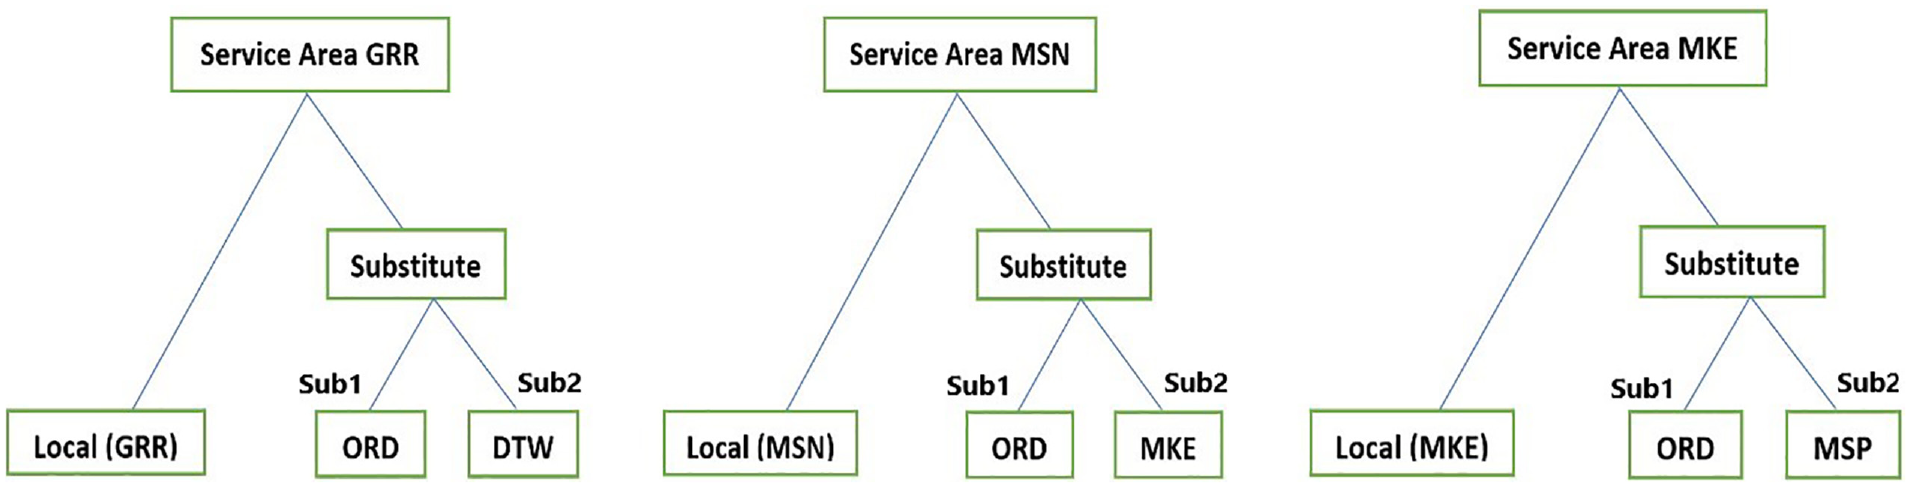
Hierarchical logit (HL) model structure for service areas of Gerald R. Ford International (GRR), Dane County Regional (MSN), and Milwaukee Mitchell International (MKE) airports.
The parameter associated with distance to airport also varies across alternatives because we expect travelers to be more sensitive to ground travel delays when making shorter trips, that is, while traveling to their local airport, in contrast to trips to distant substitute airports.
The coefficient associated with mean number of flight legs is also allowed to vary across alternatives as the data processing includes all kinds of routes and does not explicitly account for travelers who leak to catch direct flights instead of using a connecting itinerary that starts at their local airport.
The model specification is given in Equations 2 to 4.


where
Error terms are included to account for unexplained variations that could result from traveler-specific factors such as socioeconomic characteristics which are not available in the model.
Results
Table 3 summarizes the parameters estimated for the model specified.
Model Estimates for Service Areas of Gerald R. Ford International (GRR), Dane County Regional (MSN), and Milwaukee Mitchell International (MKE)
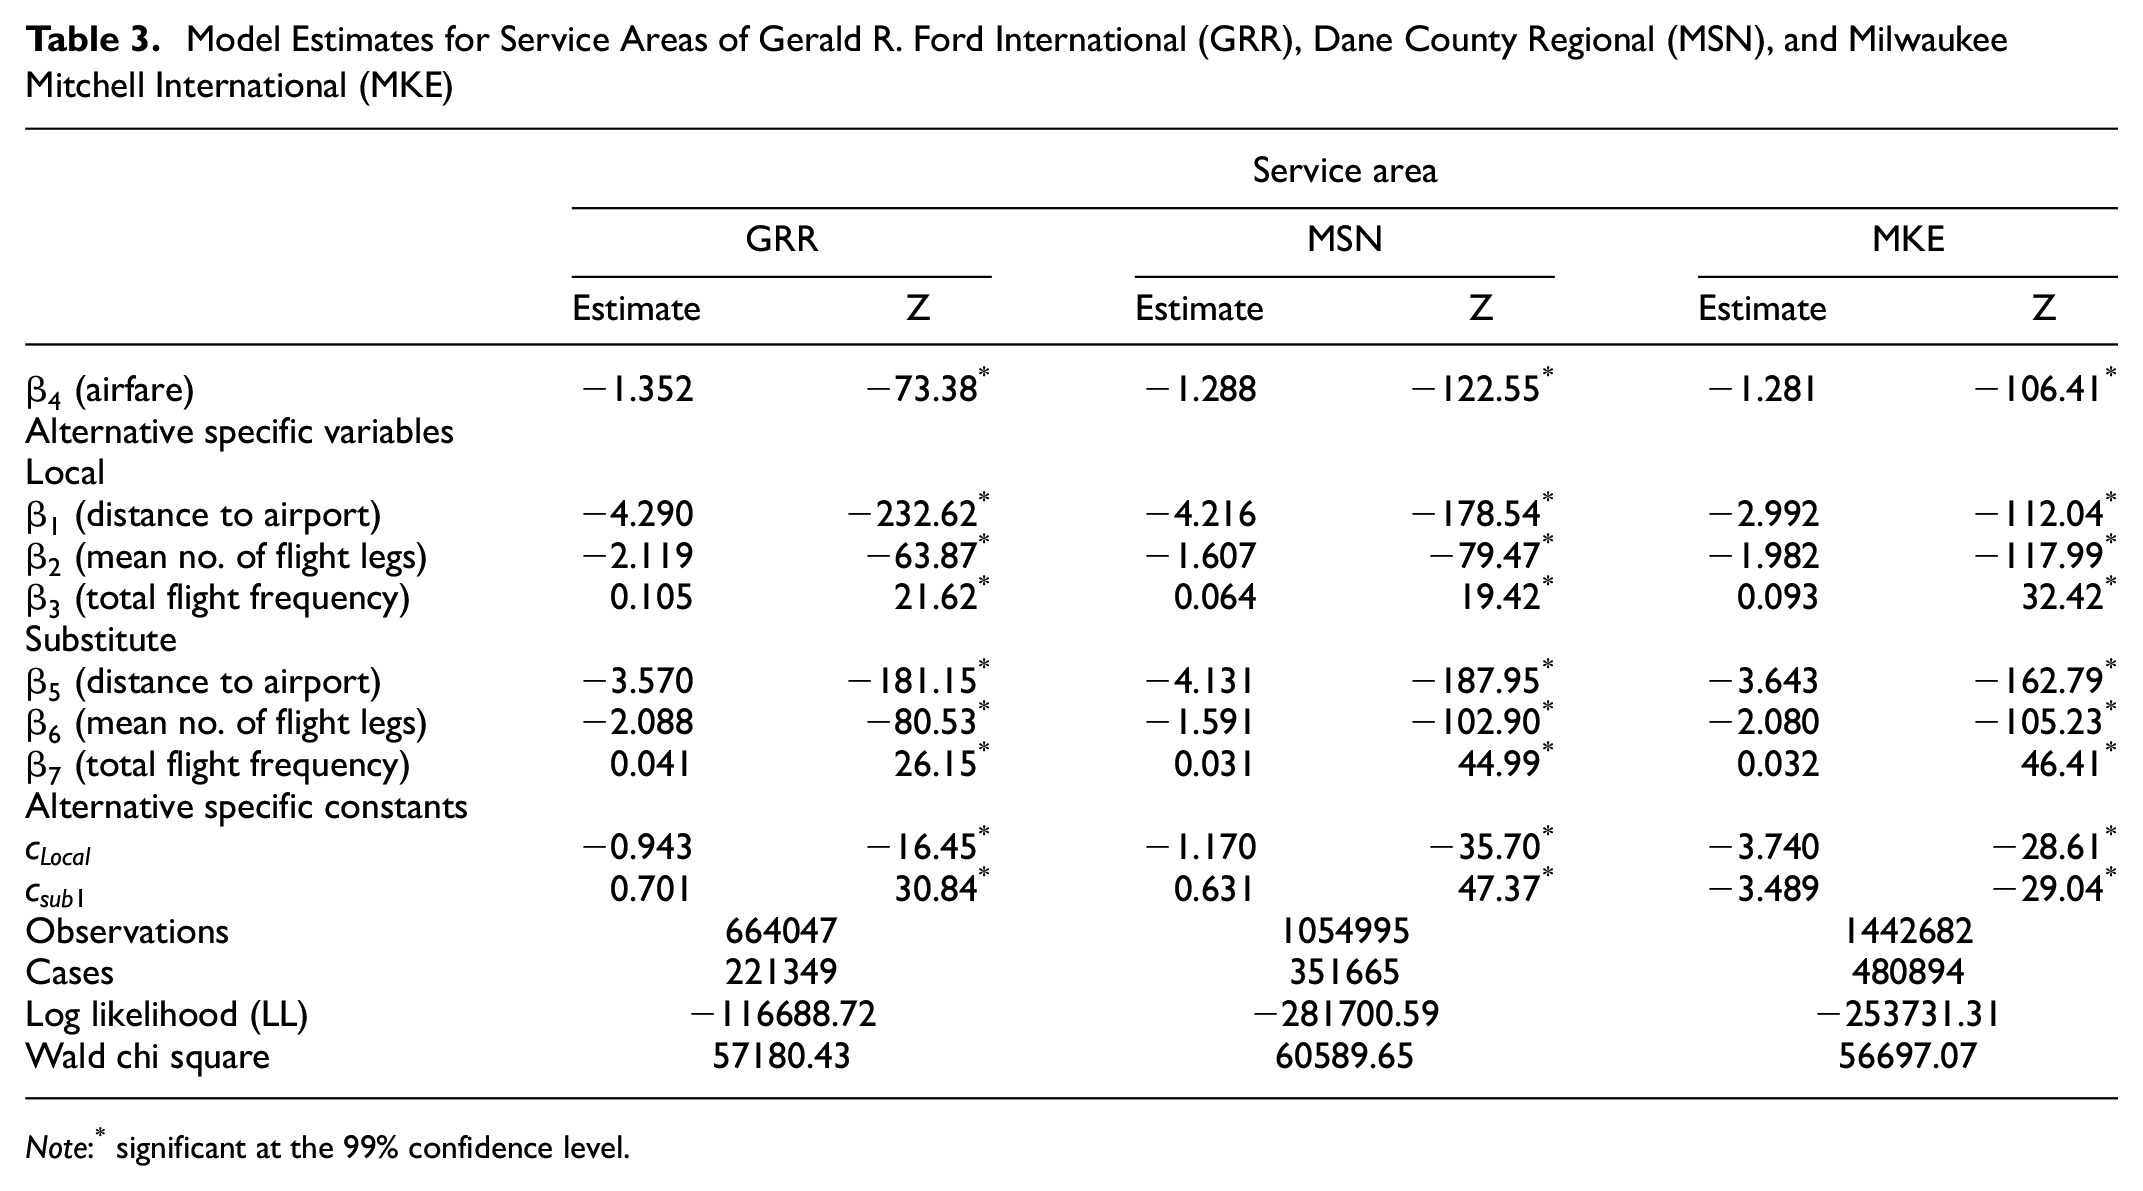
Note:* significant at the 99% confidence level.
The coefficient of flight frequency for substitute airports is less than half of that for local airports at all service areas, suggesting that all else held equal, flight frequencies at substitute airports cause leakage only if they are more than double the flight frequencies provided by local airports. This is mainly because the Market Locator dataset predominantly consists of leisure travelers who are expected to care more about airfare and airport access time, as opposed to business travelers who would be more concerned about timing (flight frequency) ( 10 ).
With regard to airport access, the coefficients on the distance to local and substitute airport (4.216 and −4.131 respectively) are comparable at service area MSN, such that when distances to both airports are equal, travelers have no strong preference for one airport over another except those which are captured by the remaining air service variables. For service area GRR, the coefficient values indicate that when distances (and all else) are equal, there is a preference for the substitute airport (DTW). This result reflects the leakage intensity at service area GRR shown in Figure 4, where we observe that more travelers from ZIP codes equidistant to GRR and DTW leaked to DTW. For service area MKE, distance to airport coefficient for the local airport (MKE) is smaller in magnitude than that for substitute airports, indicating that comparable access distances to local and substitute airports discourage leakage. This may have been induced by the inclusion of MSP which is quite distant from MKE at 344 mi away and chosen only by 2% of the local market. To investigate how the model parameters would change, MSP was removed from the list of substitute airports for service area MKE (including the 2% travelers that chose MSP) and a new model estimated with 96% of the total travelers that chose between MKE and the only remaining substitute—ORD. Although the coefficients change in magnitude, the changes are not significant, nor do they lead to different conclusions. This result also reflects the observations from Figure 4, where a smaller proportion of travelers from service area MKE bordering with Illinois appear to have chosen ORD over MKE compared with parts of service areas MSN and GRR which are equidistant to local and substitute airports.
With regard to mean number of flight legs, the coefficient at local is lower than that at substitutes at service areas GRR and MSN (−2.119 versus −2.088 for service area GRR and −1.607 versus −1.591 for service area MSN)—a comparable number of flight legs at both the local and substitute airports results in greater utility (more preference) for the substitute airport. All other variables (airfare, access distance, and flight frequency) accounted for, if the same number of flight legs is offered to a certain destination at both the small local and large substitute airports, we normally expect more travelers to derive higher utility from (and thus prefer) their local airport. Nevertheless, model results confirm the opposite, possibly indicating that air travelers generally have low opinions of these small airports. On the other hand, at service area MKE, the parameter estimated for mean number of flight legs at substitute is larger in magnitude than its counterpart at local, which shows that travelers from service area MKE derive higher utility from their local medium hub of MKE than ORD if the same number of flight legs is provided to a certain destination from both airports. This is particularly convincing since MKE, in comparison to GRR and MSN, is a well-serviced medium hub and travelers would generally have to find direct flights at ORD that are not offered at MKE to leak. These opposing findings show that effective market retention strategies should not be homogenously applied to different airports, as also noted in a previous study ( 53 ). For instance, adding direct flights at MSN/GRR to destinations directly served by large substitute airports will be more effective only if awareness creation campaigns are carried out to reduce the favoritism toward distant large hubs. On the other hand, only introducing direct flights might be enough to combat leakage at the medium hub of MKE.
The effect of airfare is best presented through a sensitivity analysis that captures market share changes induced by increments in airfare at local airports. Keeping all other variables unaltered, the effects of increasing fares at local airports by up to 40%, in increments of 10%, are examined. A 10% increase in airfare at the local airport leads to a dramatic market loss of 20.4% at service area GRR, but results in only 5.8% and 2.8% losses at service areas MSN and MKE, respectively. These results show that a small increase in airfare at local airports can have very different impacts on the respective local markets. Greater increases in local airport airfare at service area GRR (i.e., beyond 10%), however, do not lead to further substantial market loss, as evident from the 28% market loss that results from a 40% increase in airfare. On the other hand, market losses at service areas MSN and MKE reach up to 39.1% and 28.5%, respectively, as airfares at the local airports increase by 40%.
Overall, model results show that the same number of flight legs at both the local and substitute airports promotes leakage at service areas MSN and GRR while discouraging it at service area MKE. Comparable distances to both local and substitute airports lead to more travelers bypassing their local airport in service area GRR, but choosing their local airport in service area MKE. Furthermore, a small increase in airfare at the local airport leads to substantial market loss only at service area GRR, although greater increases eventually drive away considerable local markets from the two remaining service areas. Additionally, findings show that flight frequencies at substitute airports encourage leakage only when they are considerably higher (at least three times as many) than the frequencies at local airports.
While this study provides valuable insight into service variables affecting long distance airport choice, and its findings can be used as inputs by small airports toward retaining more market in parts of the U.S. Midwest, a more analytical definition of “airport catchment” is required instead of the simple proximity based “service area” configuration to better capture destination-based choice behavior. Furthermore, variables related to socioeconomic characteristics of travelers need to be incorporated in future modeling works.
Conclusion
This study assesses long distance airport substitution and leakage in areas served by three small/medium airports in the U.S. Midwest where air travelers have the option to drive out of region to large hub airports, using a dataset of air ticket itineraries that include presumed residential ZIP codes of these travelers. A proximity based “service area” configuration is used, in which groups of ZIP codes closest to a certain airport are assigned as the local market of that airport. It is assumed that leakage occurs when travelers abandon their original service area and choose a substitute airport (generally a large hub) different from their local one. Itinerary records are supplemented with other publicly available air service information, and airport choices for travelers originating from service areas served by GRR, MSN and MKE are modeled using a hierarchical logit model.
Application of the model confirms that comparable access distances to both the local and substitute airports at service area GRR encourages leakage, but discourages it at service area MKE. With regard to number of flight legs, more travelers from service areas GRR and MSN leak even when the numbers of flight legs at both the local and substitute airports are similar, possibly because of passengers’ low opinions of these small local airports. However, at service area MKE, similar numbers of flight legs at both the local and substitute airports results in less leakage, showing that adding direct services at MKE may be effective in combating leakage to Chicago. A sensitivity analysis of market share with respect to airfare indicates that service area GRR is at risk of losing substantial market if airfare is increased by 10% at the local airport of GRR. Higher increases in fares at local airports are required for the same substantial local market loss at service areas MSN and MKE. Finally, model results show that flight frequency, unless its ratio at substitute to local exceeds three, does not appear to play a measurable role in leakage, mainly because the Market Locator dataset predominantly consists of leisure travelers who are expected to place less value on flight schedules than on airfare and airport access time. Overall, this study provides the link between airport leakage and various air service variables based on a large and recent dataset, and its findings can be used as inputs by small airports and their sponsors toward understanding air travelers’ airport choices to reduce leakage.
This paper documents the first exploration of this dataset toward understanding long-distance airport leakage, and there is much work ahead. To replace the “service area” definition, more research is needed—particularly empirically-based approaches that control for destination airports—to define geographic airport catchments. Second, other model specifications and explanatory variables will be explored. Third, models will be constructed to include the entire megaregion and others to understand general interregional airport leakage experiences throughout the U.S.A.
Footnotes
Author Contributions
The authors confirm contribution to the paper as follows: study conception and design: K. W. Yirgu, A. M. Kim; data collection: K. W. Yirgu, A. M. Kim, and M. S. Ryerson; analysis and interpretation of results: K. W. Yirgu, A. M. Kim; draft manuscript preparation: K. W. Yirgu, A. M. Kim, and M. S. Ryerson. All authors reviewed the results and approved the final version of the manuscript.
Declaration of Conflicting Interests
The author(s) declared no potential conflicts of interest with respect to the research, authorship, and/or publication of this article.
Funding
The author(s) disclosed receipt of the following financial support for the research, authorship, and/or publication of this article: This work was supported in part by Canada's Natural Science and Engineering Research Council Discovery Grants program.