
Abstract
There has been globally continuous growth in passenger car sizes and types over the past few decades. To assess the development of vehicular specifications in this context and to evaluate changes in powertrain technologies depending on surrounding frame conditions, such as charging stations and vehicle taxation policy, we need a detailed understanding of the vehicle fleet composition. This paper aims therefore to introduce a novel mathematical approach to segment passenger vehicles based on dimensions features using a means fuzzy clustering algorithm, Fuzzy C-means (FCM), and a non-fuzzy clustering algorithm, K-means (KM). We analyze the performance of the proposed algorithms and compare them with Swiss expert segmentation. Experiments on the real data sets demonstrate that the FCM classifier has better correlation with the expert segmentation than KM. Furthermore, the outputs from FCM with five clusters show that the proposed algorithm has a superior performance for accurate vehicle categorization because of its capacity to recognize and consolidate dimension attributes from the unsupervised data set. Its performance in categorizing vehicles was promising with an average accuracy rate of 79% and an average positive predictive value of 75%.
Vehicle composition as well as the technical and dimensional characteristics of the new vehicles vary considerably over time. In many countries, vehicle detection and classification methods have been developed and used to maintain traffic-monitoring and operational systems. In this setting, vehicle classification must be balanced against available declared characteristics. The quality of the extracted features in representing the characteristics of vehicles directly affects classification accuracy ( 1 , 2 ).
Aspects of vehicle fleet composition such as vehicle segments (increasing share of sports utility vehicles [SUVs]), vehicle dimensions (increased size in vehicle segments), and other design parameters like power, fuel, and powertrain technologies change significantly over time. Because of new carbon dioxide legislation (EU fleet average emission target of 95 g CO2/km), further changes in all of these parameters are expected ( 3 ).
To date, numerous image-based vehicle classification methods have been available and are being widely used by departments of transportation. However, these techniques lack the ability to accurately produce classification because of the occlusion, shadow, illumination, and clear definition of the measured characteristics ( 4 – 9 ). This complexity will be even more for vehicles that have different classes with similar dimensions or have visually similar appearances but not similar dimensions, such as the Audi A4 versus the Audi A6. Therefore, such vehicles require further computational and analytical complexity (Figure 1).

Samples of passenger car dimensions: (a) Audi A6; and (b) Audi A4.
Furthermore, the review of related literature ( 10 – 13 ) shows that the growth of passenger car models over time poses an additional challenge to accurate vehicle categorization based on dimensions. In fact, the most popular names of car models have remained intact since they were developed. This makes it difficult to follow the development of the sizes during vehicle categorization (Table 1).
Sample of Passenger Car Growth
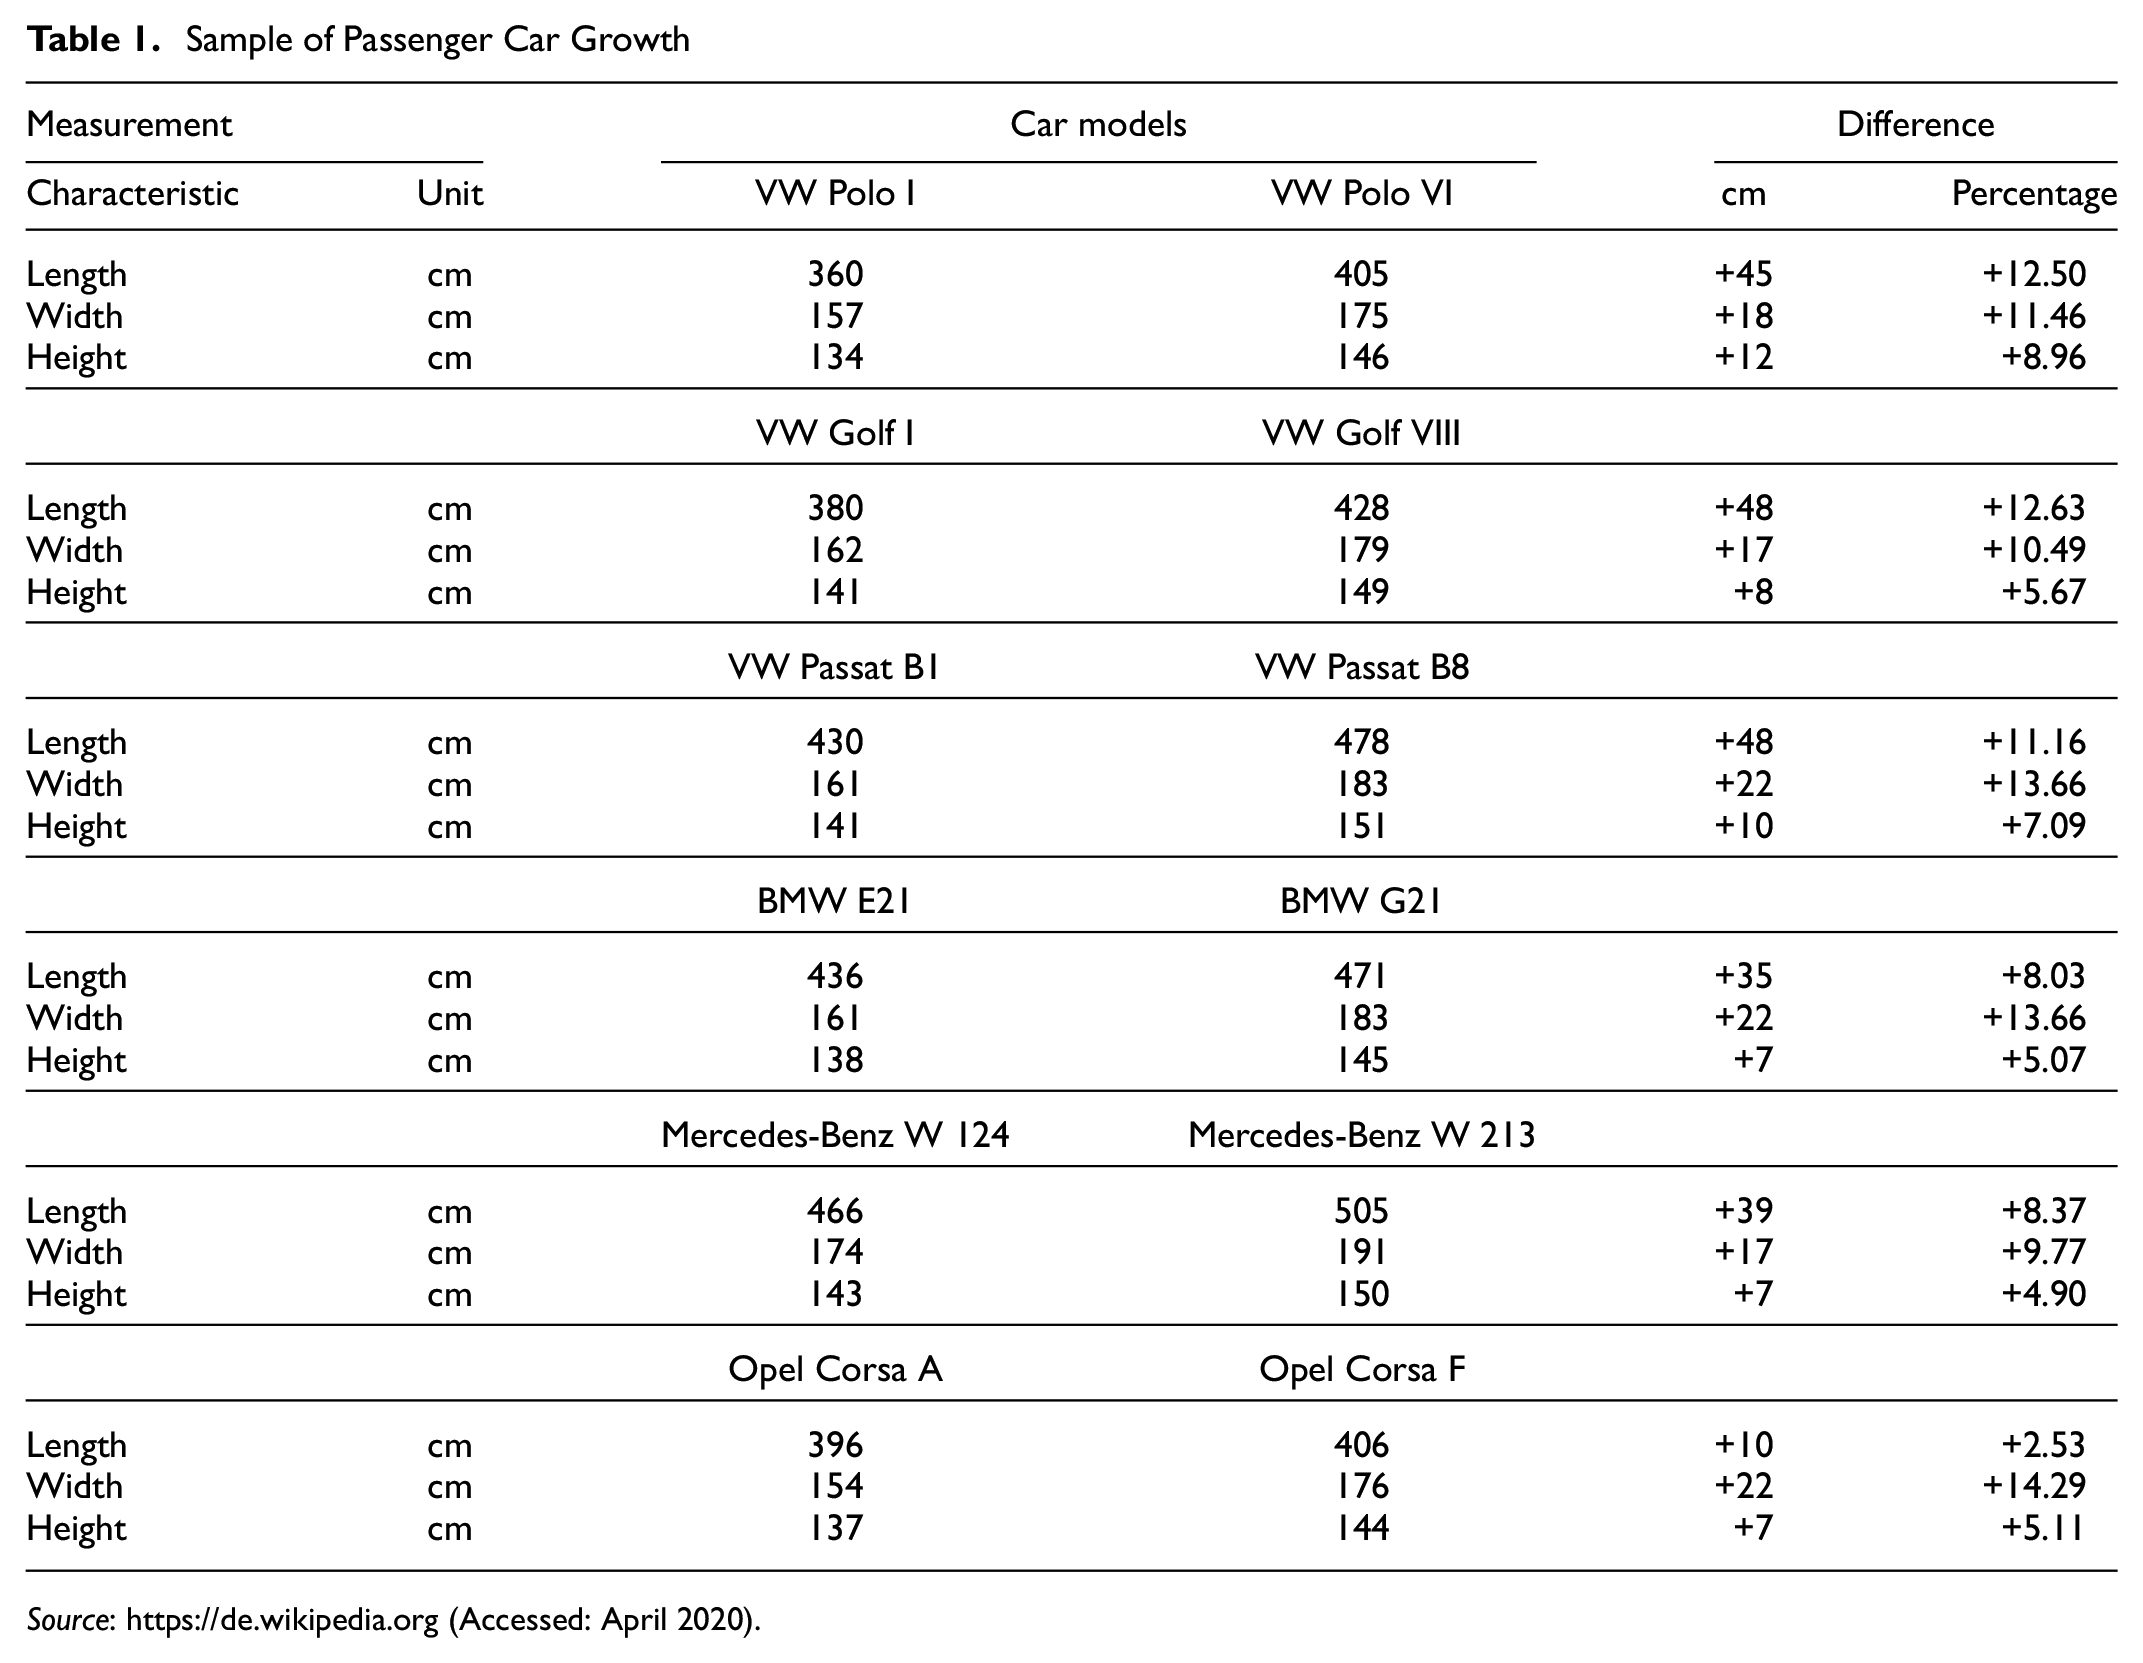
Source: https://de.wikipedia.org (Accessed: April 2020).
However, the impact of vehicle size will eventually need to be addressed, as an increase in dimensions for almost all passenger cars can lead to increasing fuel consumption, which results in higher carbon dioxide emissions (Table 2), ( 10 , 14 , 15 ).
Sample of Carbon Dioxide Emissions in Correspondence to Passenger Car Size
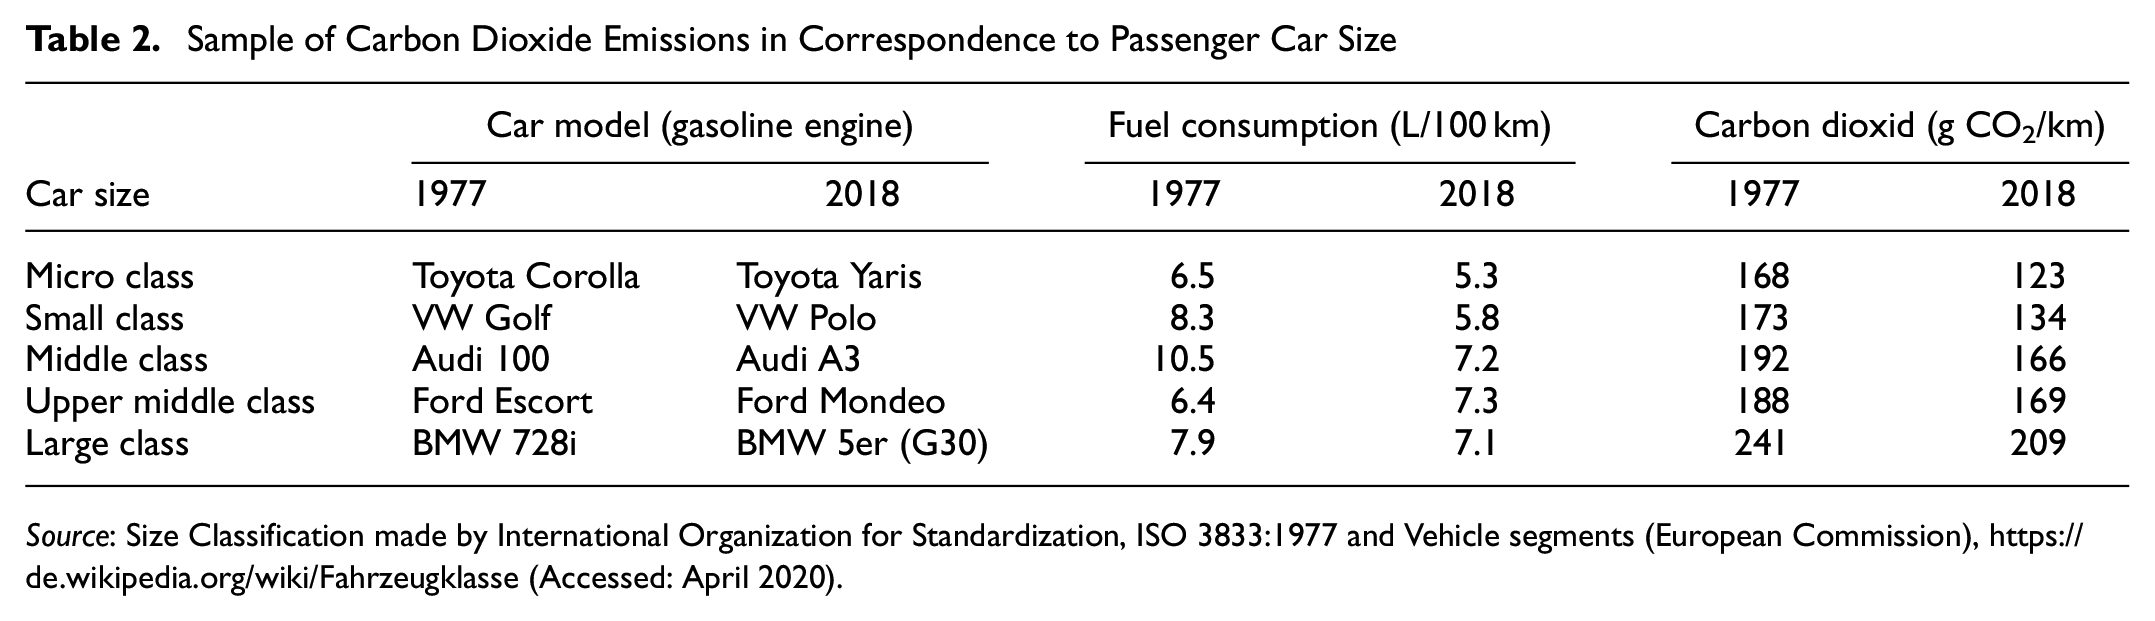
Source: Size Classification made by International Organization for Standardization, ISO 3833:1977 and Vehicle segments (European Commission), https://de.wikipedia.org/wiki/Fahrzeugklasse (Accessed: April 2020).
Carbon dioxide emissions from passenger cars in Switzerland have fallen continuously since 2003 for both gasoline and diesel vehicles; they then rose slightly for the first time in 2017 and increased significantly in 2018. Passenger cars newly registered in 2018 have average carbon dioxide emissions of 137.8 g/km, which is about 6% over European and Swiss targets of 130 g CO2/km set in 2012 and enforced until the end of 2019 ( 15 – 17 ). Therefore, accurate inter-class classifications are required to investigate the vehicle fleet composition to achieve a detailed understanding in real world applications. This issue inspires us to construct robust vehicle classifications to assist in the implementation of effective and efficient traffic measurement and management.
In this paper, we propose the first scientific approach to elicit the potential of using dimension features by adapting correlation to the expert segmentation to investigate high levels of vehicle fleet classification in Switzerland. The hypothesis of this study is that the proposed clustering allows comparison between different fleets using a mathematical approach. The contribution of this paper mainly lies in the vehicle classification based on the comparative analysis of two clustering algorithms, non-fuzzy k-means (KM) and fuzzy C-means (FCM), with a Swiss expert segmentation data set ( 18 ). To evaluate the performance of these algorithms we use a fleet data set including all newly registered passenger cars in Switzerland in 2018 and categorize it by means of exterior and interior dimensions including length, height, and width.
The results show that the FCM algorithm has an advantage over KM. Moreover, a five-clusters solution gives a more accurate intra-class classification of the vehicles. All the experiments demonstrate that our proposed method is feasible and effective in categorizing vehicles based on their dimensions. The next section briefly reviews previous research on vehicle classification. The following sections present concise details of data sets, the two algorithms, and the results. The last section presents the major findings and recommendations for further research.
Literature Review
Numerous machine learning techniques including supervised (classification) and unsupervised (clustering) methods have been applied to the classification of vehicles ( 2 , 19–31). However, only a limited number of studies have used geometric measurements such as width, length, height, volume, angle size, and area for classification purposes ( 24 – 31 ). Among those using clustering techniques, Javadi et al. ( 24 ) classify vehicles into “private car,”“light trailer,”“lorry or bus,” and “heavy trailer,” using dimension and speed features that are fed into a FCM classifier. Their method reaches an accuracy of 96.5% on a data set with 400 vehicle images taken on a major highway. Yao et al. ( 25 ) proposed a vision-based method for axle-based vehicle classification using FCM clustering to identify and segment vehicle axle pixels of an image, resulting in a detection rate of 62.8%. Saraçoğlu and Nemati ( 26 ) proposed an FCM clustering algorithm based on the dimensions of every vehicle for image segmentation and the Support Vector Machine classification method to classify vehicles as “small vehicle,”“big vehicle,” and “others.” Moreover, other works have used supervised classification methods for the dimension-based classification of vehicles. For example, Zhang et al. ( 27 ) developed a length-based vehicle detection and classification system for truck data collection. They reported 97% accuracy for truck classification. Arunkumar et al. ( 28 ) designed a novel approach to classify vehicles into their brands using geometrical features and appearance-based attributes. Based on this, they are able classify the vehicles into different classes of models that belong to the same brand using a neural network classifier. Moussa ( 29 ) used geometric-based and appearance-based features in a supervised learning model (support vector network) for multi-class (small, medium, and large size) and intra-class (pickup, sport utility vehicle, and van) vehicle classification. Jiang et al. ( 30 ) combined several feature extraction methods with a support vector machine classifier to group the vehicles in six categories (large bus, car, motorcycle, minibus, truck, and van) and achieved a classification accuracy of 97.4%. Lastly, Cheung et al. ( 31 ) proposed a vehicle classification method based on magnetic sensors to classify vehicles into six types (passenger vehicle, SUV, van, bus, mini-trucks, truck). The algorithm achieved 60% accuracy without using vehicle length and 80% to 90% if length was used as a feature. All these works show that machine learning techniques can be successfully applied to classify vehicles based on their dimensions. However, most of them focused on grouping or classifying vehicles in classes that differ greatly in dimension and shape (e.g., trucks, buses, passenger cars, mopeds), while separating the more alike sub-classes within these categories (e.g., the passenger car sub-classes) may pose a greater challenge.
This study mainly focuses on partition-based clustering algorithms, which have the ability to explore underlying structures of clusters based on appropriate objective functions ( 32 – 34 ). Specifically, we implement and compare the two most commonly used partition-based clustering algorithms, namely KM and FCM. The FCM algorithm is capable of overcoming some of the problems faced with noise sensitivity defects and non-linear data clustering ( 35 – 37 ). Researchers have carried out multiple comparisons of these two methods. Velmurugun and Santhanam ( 32 ) have compared the clustering performance and effectiveness of KM and FCM clustering algorithms using different shapes of arbitrarily distributed data points and found mutual exclusion clusters. Joyti and Kumar ( 38 ) reported the performance between partition-based clustering algorithms based on time complexity. Gosh and Dubey ( 39 ) computed the performance and clustering accuracy of KM and FCM algorithms based on the efficiency of the clustering output and the computational time.
Methods
Clustering is an unsupervised data analysis technique with more flexibility in identifying groups of data, and that is generally more demanding than supervised approaches ( 40 – 43 ). Through clustering, we group a collection of similar objects into each defined cluster characteristic while we attribute dissimilar objects to other clusters. The partitioning, hierarchical, data density based, grid based and soft computing methods are some of the most frequently used clustering approaches in the literature ( 44 – 48 ). Each of these methods has specific clustering algorithms. Despite such diversity, partition-based clustering has been widely used by researchers. Therefore, in this study we focus on the partition approaches, specifically the KM and FCM clustering algorithms, and implement them using three different data sets containing the newly registered passenger cars, vehicle technical specification from the type approvals, and vehicle expert segmentation data set in Switzerland.
Non-Fuzzy Clustering Algorithm
K-means (KM) or hard C-means clustering is one of the most commonly used exclusive non-fuzzy clustering algorithms. This technique classifies data into crisp clusters, where each data point is assigned to exactly one cluster at any one time ( 49 ). The summation of degree of belongingness of a specific data point in a specific cluster is equal to 1 and is equal to 0 for all the remaining clusters. This method classifies the N data points into c (1 < c < N) clusters. The objective of the KM algorithm is to minimize an objective function (J) known as the squared error function and is given in Equation 1 as follows:

where ci represents the number of data points in the ith cluster and D is Euclidean distance function.
The KM algorithm comprises the following steps:
(1) Let X={x1, x2, x3, …,xn} be data set and, V={v1, v2, v3, …, vn} be the set of centroids.
(2) Fix the desired number of clusters (c) and place cluster centroids.
(3) Update the cluster centroid by:

(4) Determining each data point to the cluster based on the minimum distance to the cluster centroids according to the Euclidean distance function.

where
x represents the set of data points,
v i is vectors of center in ith cluster, and
‖xij-vi‖ 2 is Euclidean distance function calculated between xij and v i .
(5) Recalculate the distance between each data point and newly obtained cluster centers.
(6) Repeat from step 3 until achieving convergence, that is, until the same points are assigned to each cluster in consecutive rounds.
Fuzzy C-Mean Clustering
Fuzzy C-means (FCM) as an overlapping clustering algorithm is one of the most popular fuzzy clustering methods ( 50 ). This technique is a soft clustering algorithm. By this, we mean that each data point has a probability of belonging to each cluster with partial membership values ranging from 0 to 1. The FCM algorithm is an iterative optimization that minimizes the objective function (J) defined as follows:
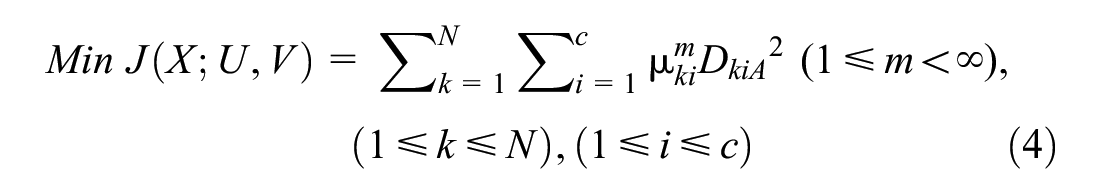


where
m is a weighting exponent that determines the degree of fuzziness;
A is a positive and symmetric (n × n) weight matrix, and
U is a fuzzy partition matrix of the data set X into c clusters.
The description of the FCM algorithm performs in the following steps:
(1) Choose an initial membership matrix U0, c, m, and A randomly.
(2) Determine prototype vectors (v) of centroids by:

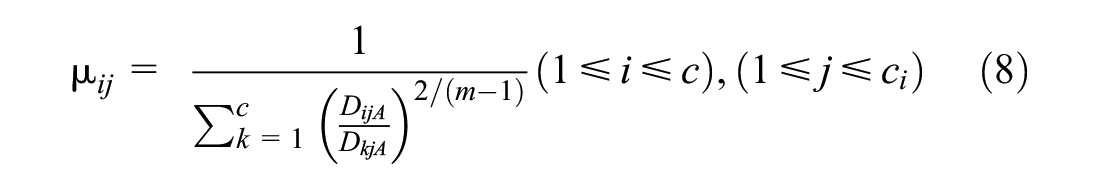
(3) Calculate membership (µ) values by:
(4) Obtain the Euclidean distances (D) by:
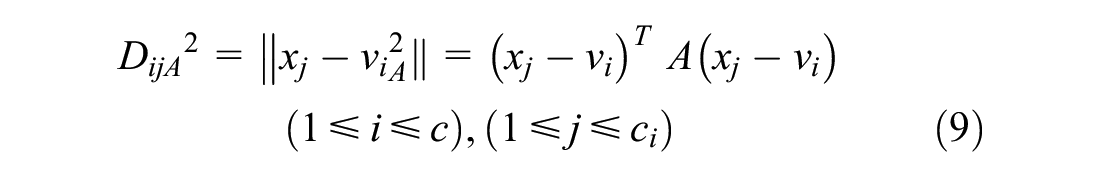
where
(5) Compare and update U(t+1) with U(t) by using Equation 8, where t is the iteration number. If ‖U(t+1)− U(t)‖ < ε, where ε is the termination criterion between [0, 1], then stop, else repeat from step 2.
The Data Set
We obtained the traffic data sets Annually New Vehicle Registered, Vehicle Technical Specification, and the expert segmentation from the Swiss Motor Vehicle Information System ( 51 ), Technical Type Approval Information from Federal Office ( 15 ), and Vehicles Expert Partner ( 18 ) respectively.
The Swiss passenger car fleet data set contains 6,544,628 cars with type approval numbers, geometrical and mass properties, ownership details, technical information, and date of registration for the periods 1884–2019. Vehicle Technical Specification contains manufacturing technical information such as engine specifications, power, fuel consumption, emissions, and exterior and interior dimensions. The data-mining framework consists of three major components: filtering raw data, the final vehicles filter, and clustering attributes ( 52 ).
As a first step, we filter the data to extract the passenger cars, because non-passenger cars defined as small pickup trucks, standard pickup trucks, vans, and special purpose vehicles (SPVs) do not meet the definitions of typical passenger cars. Each passenger car has a set of geometrical, technical, and ecological features. However, we cannot simply regard all the passenger cars in the fleet. Considering the goal of this paper to identify appropriately the true segmentation, and to prevent noise interference, we extract the 275,601 vehicles registered in 2018 consisting of the complete features of the vehicles.
Then we identify vehicles with a unique brand, model, and manufacture code. In addition, we extract sports cars and multi-purpose vehicles (MPVs) from the data set, which we classify separately from typical passenger cars. We separate the remaining passenger cars based on the expert segmentation ( 18 ). We then revisit the Ingenbleek and Lemaire ( 53 ) sports cars formula and Richard Stepler’s ( 54 ) new generation of the Mini-Vans, which present high linear correlations between cubic capacity (cm 3 ), power (Kw), weight (kg), number of seats, and dimensions. By using principal component analysis (PCA) we try to find an optimal coordinate system. According to the observations, expert segmentation of sports cars and MPVs is fairly successful ( 55 ).
The 367 remaining unique samples are clustered into six classes according to the expert segmentation: micro class containing 18 samples, small class containing 51 samples, middle class containing 110 samples, upper middle class containing 84 samples, large class containing 60 samples, and luxury class containing 44 samples ( 18 ).
Finally, to determine the most efficient vehicle classification method we perform cluster analysis on vehicle dimensions based on KM and FCM clustering algorithms.
Results
The implementation of KM and FCM is done on the first registered passenger cars in Switzerland in 2018 in MATLAB version R2018a. As one of the essential input arguments of FCM the maximum number of iterations was set to 100, the convergence value was ε = 0.00001, and the weighting exponent was set to (m = 2).
The data set contains 367 unique samples classified into six different classes by experts. Each sample is characterized by equally weighted exterior and interior dimensions features as an attribute and all the samples are numbered 1 to 367. The samples from 1 to 18 are classified as micro class, those from 19 to 69 are classified as small class, those from 70 to 179 are classified as middle class, those from 180 to 263 are classified as upper middle class, those from 264 to 323 are classified as large class, and those from 324 to 367 are classified as luxury class.
The optimal number of clusters is determined by Elbow plot and silhouette analysis (Figure 2). However, to compare the the computational efficiency and accuracy of the results of the clustering algorithms with the expert segmentation, we also implemented the parallel classifiers with six clusters. If the assume the cluster value is lower than the optimal value, the algorithm will produce a result that does not capture the important aspects or the essence of the underlying data.
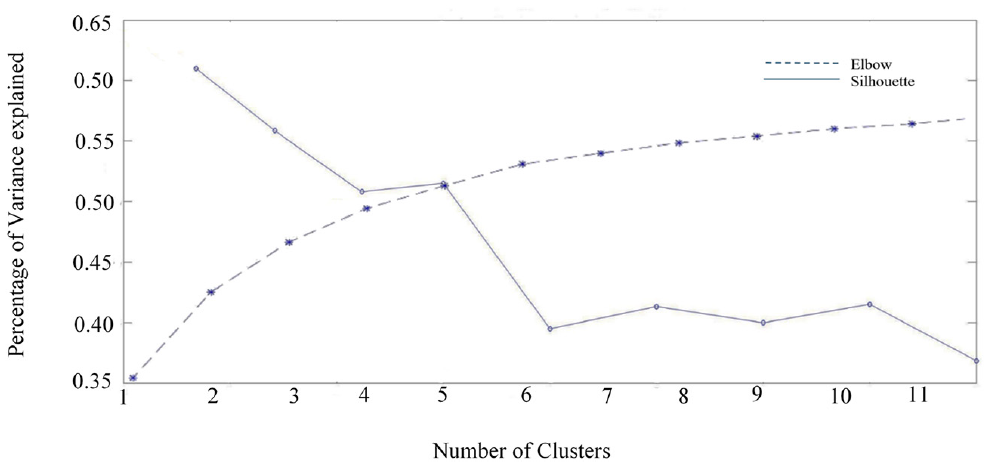
Elbow method versus silhouette analysis plot for finding optimal number of clusters.
Primary analysis of the expert segmentation data set demonstrates that the height of the vehicles has an insignificant correlation with its class and does not provide more accurate categorization, particularly for big data analysis ( 56 ). Therefore, we characterize each vehicle by its exterior width and length (Figure 3).
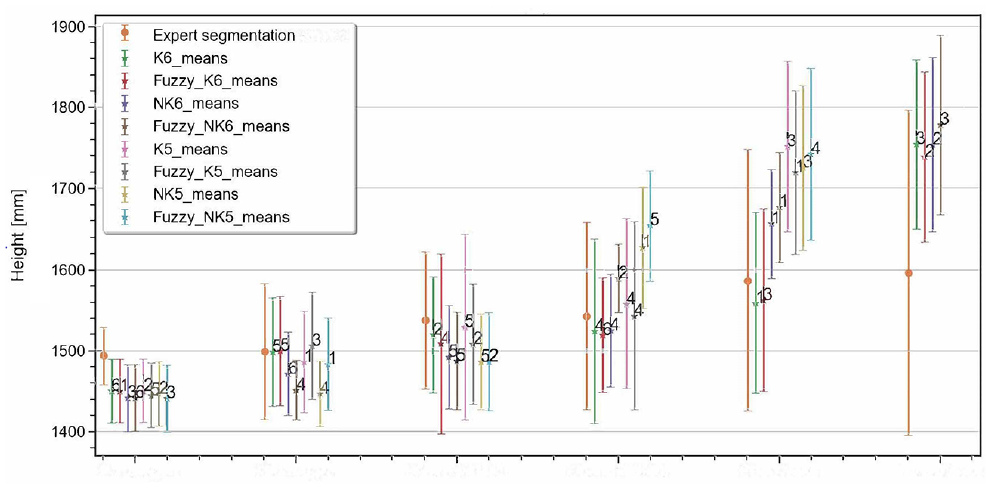
Comparison of height mean and standard deviation scores of expert segmentation and proposed clustering methods.
KM generates six clusters: micro class containing one sample, small class containing 27 samples, middle class containing 51 samples, upper middle class containing 102 samples, large class containing 96 samples, and luxury class containing 90 samples. FCM generates six clusters corresponding to micro class containing 24 samples, small class containing 54 samples, middle class containing 97 samples, upper middle class containing 87 samples, large class containing 79 samples, and luxury class containing 26 samples. The proportion of vehicles classified differently than in the expert segmentation is 31% of the total sample for FCM and 76% for KM. (Figure 4, a and b ).

Illustration of the K-means and Fuzzy C-means clustering results with five and six clusters. Each plot shows the partition obtained after specific iterations of the algorithms. The color of the points represents their assigned clusters. Rectangle markers indicate the categorization of the samples in the expert segmentation: (a) K-means (c = 6); (b) Fuzzy C-means (c = 6); (c) K-means (c = 5); and (d) Fuzzy C-means (c = 5).
The KM method generates five clusters: micro class containing 28 samples, small class containing 52 samples, middle class containing 104 samples, upper middle class containing 94 samples, large and luxury class containing 89 samples. FCM generates five clusters: micro class containing 25 samples, small class containing 54 samples, middle class containing 104 samples, upper middle class containing 95 samples, large and luxury class containing 89 samples. The percentage of vehicles classified differently than in the expert segmentation is 25% of the total sample in both FCM and KM (Figure 4, c and d ).
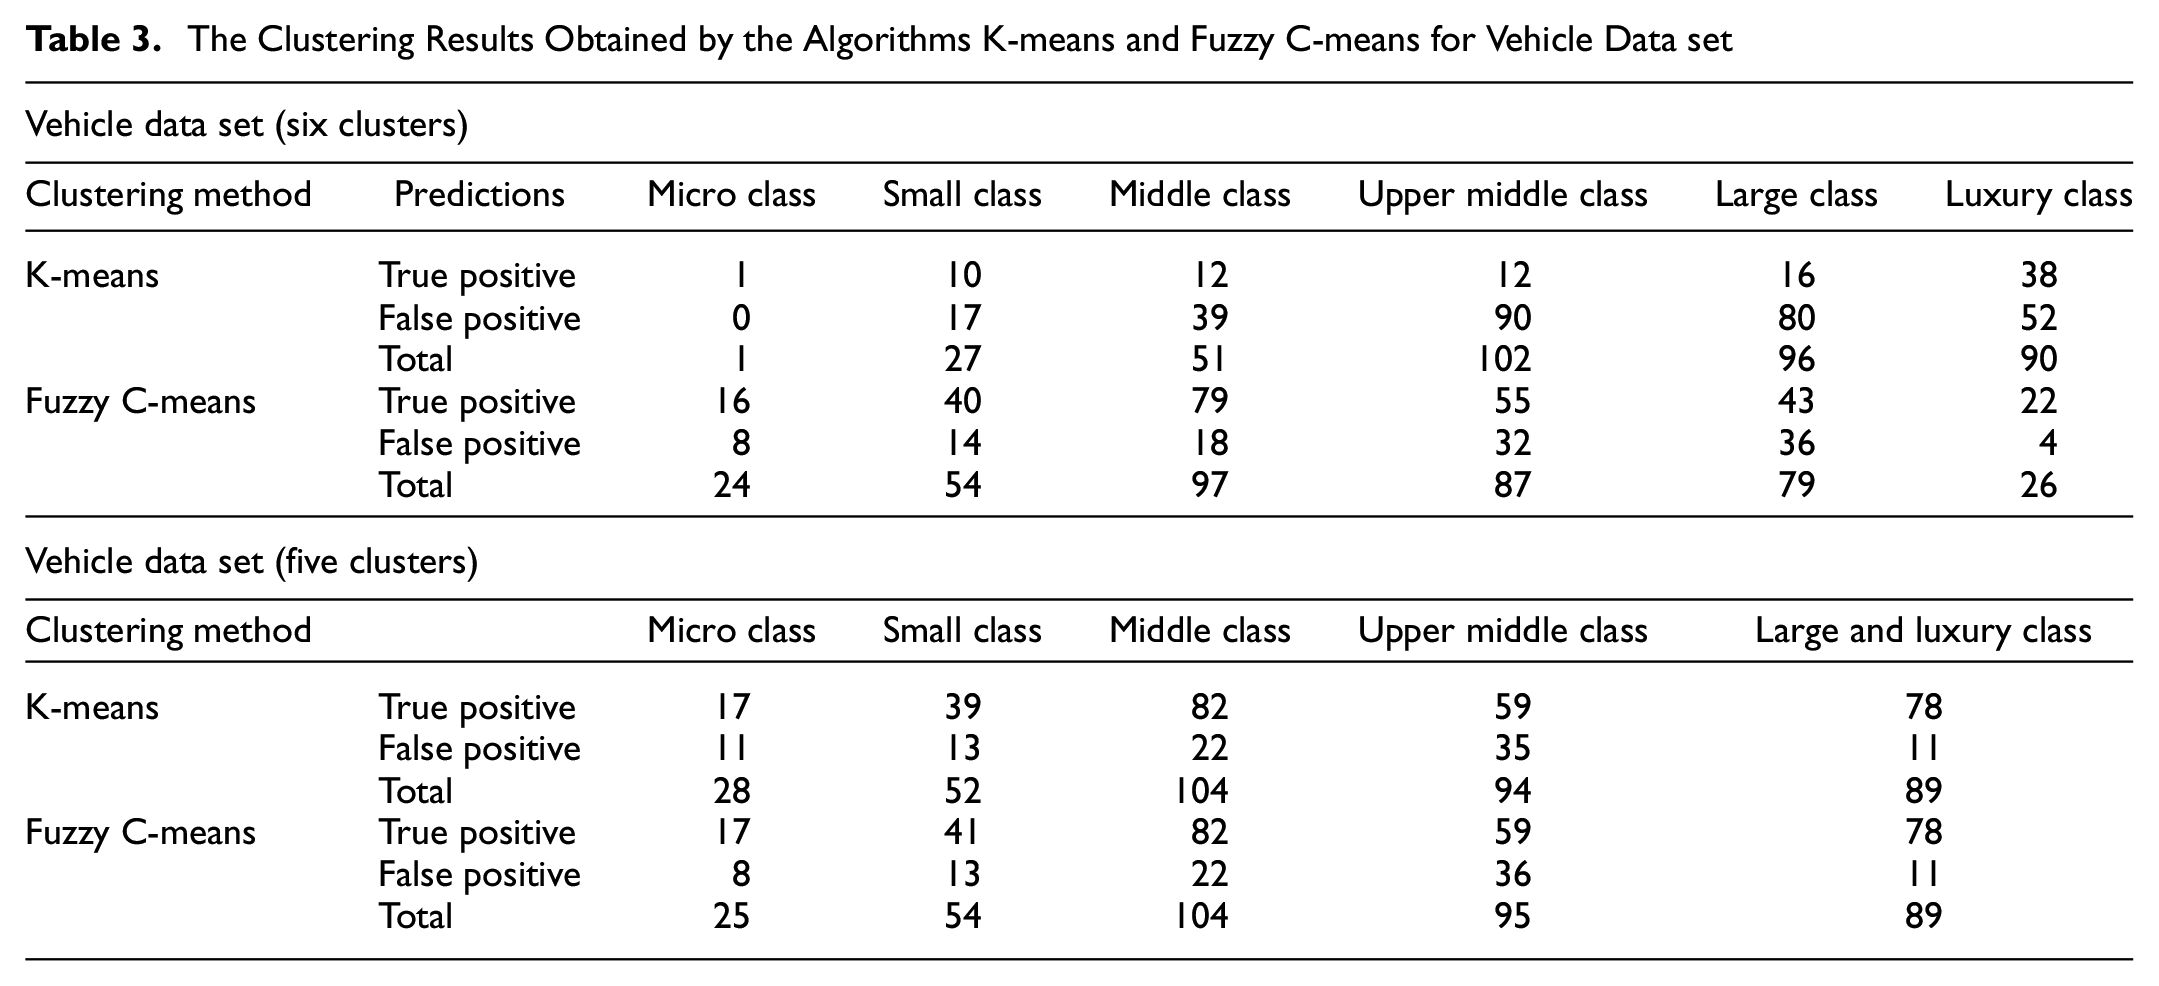
Table 3 presents for each clustering method the number of samples that are classified properly (true positive prediction) and improperly (false positive prediction) into the respected clusters of the data sets in comparison with the expert segmentation.
The Clustering Results Obtained by the Algorithms K-means and Fuzzy C-means for Vehicle Data set
Discussion
If we take the expert segmentation as a reference, the six cluster solution of the KM algorithm only categorizes properly one out of 18 samples of the micro class group, and attributes the remaining 17 samples to the small and middle class categories. For FCM these frequencies are equal to 16 and two samples, respectively. Further, out of 51 samples of the small class category, KM classifies 10 samples equally and attributes the remaining 41 samples to the middle and upper middle class groups. For FCM these frequencies are equal to 40 and 11 samples, respectively. For the 110 samples in the middle class cluster, KM classifies 12 samples equally and assigns the remaining 98 samples to the upper middle and large class categories. For FCM these frequencies are equal to 79 and 31 samples, respectively. From the 84 samples in the upper middle class, KM classifies 12 samples equally and assigns the remaining 72 samples to the large class and luxury class categories. For FCM these frequencies are equal to 55 and 29 samples, respectively. Out of the 60 samples in the large class category, KM assigns 16 samples equally and attributes the remaining 44 samples to the upper middle class and luxury class categories. For FCM these frequencies are equal to 43 and 17 samples, respectively. From the remaining 44 samples that belong to the luxury class, KM assigns 38 samples equally and attributes the remaining six samples to the upper middle class and large class categories. For FCM these frequencies are equal to 22 and 22 samples, respectively.
Considering the solutions with five clusters, out of 18 samples of the micro class group, both KM and FCM classify 17 samples equally to the expert segmentation and attribute the remaining sample to the small class category. Further, out of 51 samples of the small class category, KM classifies 39 samples equally and attributes the remaining 12 samples to the micro class and middle class categories. For FCM these frequencies are equal to 41 and 10 samples, respectively. For the middle class cluster with 110 samples, both KM and FCM classify 82 samples equally and attribute the remaining 28 samples to the small class and upper middle class categories. For the upper middle class with 84 samples, both KM and FCM classify 59 samples equally and attribute the remaining 25 samples to the middle, large, and luxury classes. From the remaining 104 samples that belong to the merged category including the large and luxury class, both KM and FCM assign 78 samples to the merged category and assign the remaining 26 samples to the middle class and upper middle class categories.
To measure the similarity between actual (based on expert segmentation) and predicted classes in the clustering process, we compute the confusion matrix. The confusion matrix contains diagonal entries that represent equal categorization, and off-diagonal entries that represent unequal ones (Table 4).
Confusion Matrix
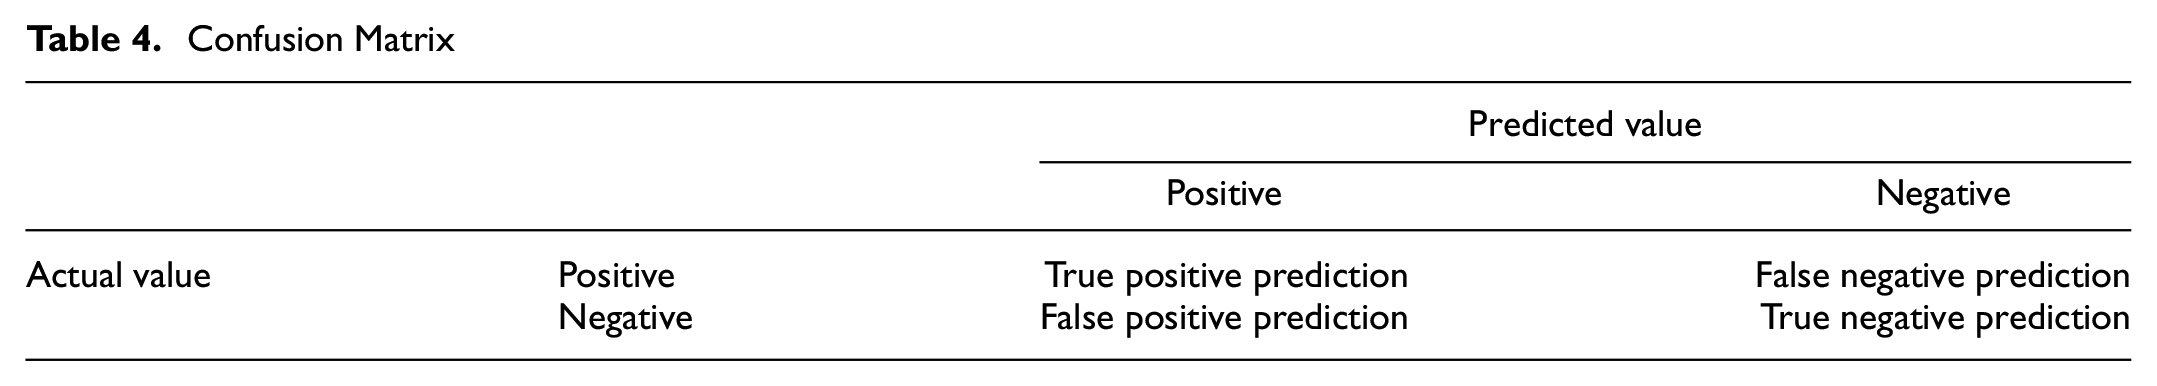
The output of the confusion matrix serves to calculate performance measures such as True Positive Rate (TPR) and Positive Predictive Value (PPV) as given in the following.


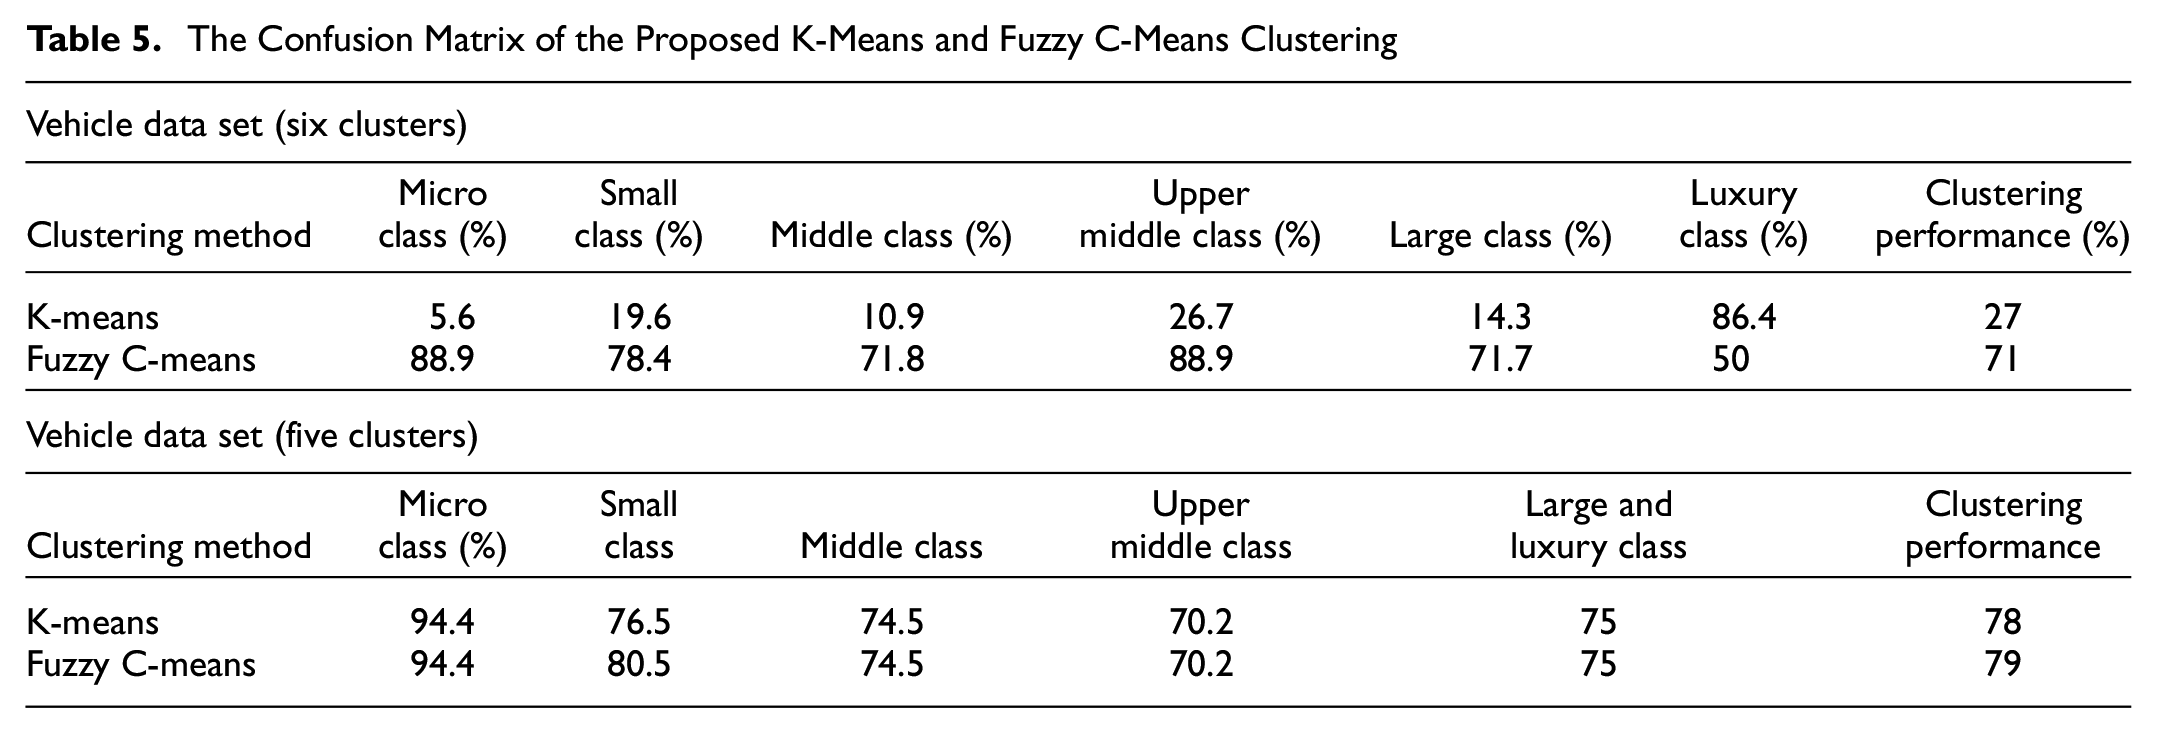
Table 5 summarizes the confusion matrix of the detected results and the performance in two clustering methods. For the vehicle data set with six clusters, the algorithm FCM achieved the highest recognition accuracies for almost all classes (overall accuracy of 71% for FCM and 27% for KM). On the other hand, when we set the number of clusters to five, both algorithms achieve similar performance (79% for FCM and 78% for KM), and only for the small class category, FCM achieves a slightly higher performance than the KM algorithm (80.5% and 76.5%, respectively).
The Confusion Matrix of the Proposed K-Means and Fuzzy C-Means Clustering
Based on these results, FCM with five clusters is superior to KM with the same cluster number by only 1%, which implies that both KM and FCM clustering algorithms are practically applicable for passenger vehicle classification with high recognition accuracies. Figure 5 shows the overall performance of the KM and FCM algorithms.
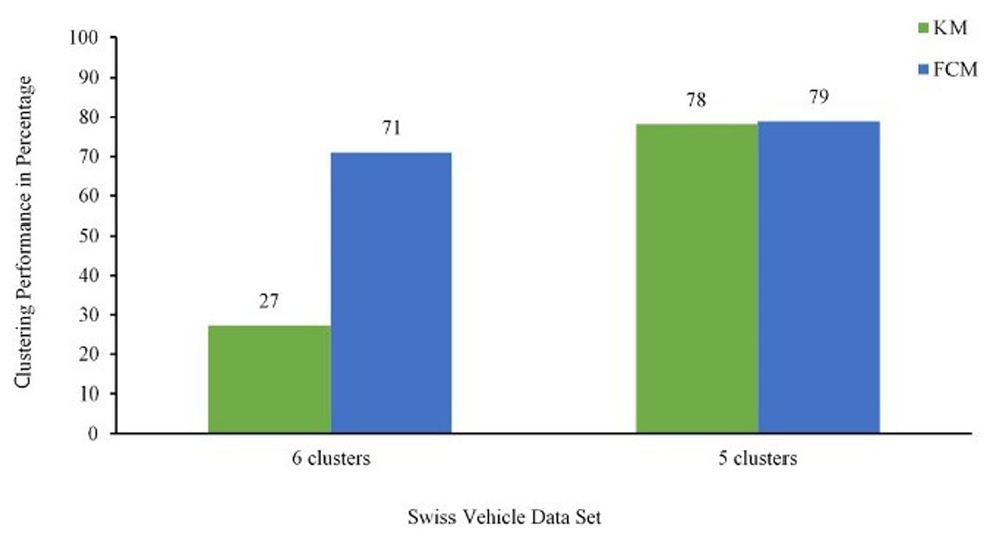
Performance comparison between K-means (KM) and Fuzzy C-means (FCM) algorithms.
Table 6 presents the clustering results of the two methods evaluated and shows that the proposed FCM clustering outperforms the KM algorithm. The classifier accuracy of FCM algorithm with five clusters 79% and the PPV 75% are superior to other algorithms. This means that FCM can extract richer information from vehicle dimensions and obtain a more discriminative recognition rate than KM algorithm, particularly in the categories of micro class and small class. Moreover, initializations of the partition matrices using five clusters improve the accuracy of the results for both methods.
The Clustering Results using K-means and Fuzzy C-means Algorithms
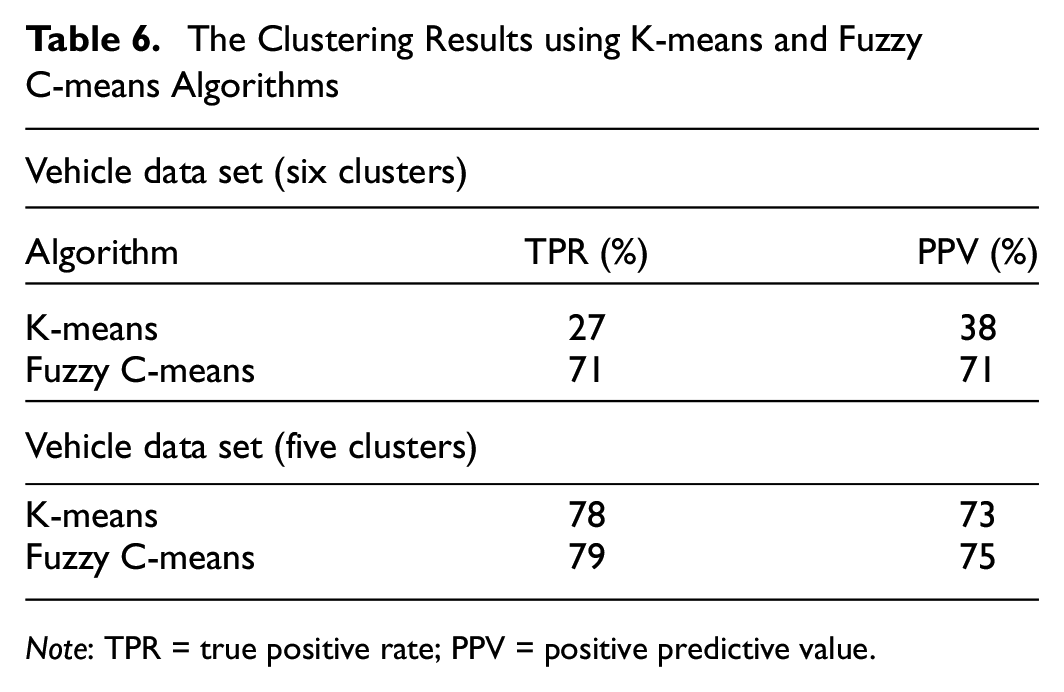
Note: TPR = true positive rate; PPV = positive predictive value.
Conclusions
To summarize, we developed potential vehicle classification tools based on a scientific approach in contrast to the expertise approach to investigate high levels of vehicle classification. We propose KM and FCM clustering algorithms to partition a vehicle data set into several clusters using dimensions attributes. The vehicles from the same cluster have the most similar measured features, which could be distinguishable for those of other clusters. The proposed approach is able to classify vehicles in the micro, small, middle, upper middle, large, and luxury classes. We analyze and compare the performance of the two algorithms with a Swiss expert segmentation data set.
The experimental results showed that the soft clustering algorithm performed better than the hard algorithm. The performance of the FCM with five clusters was promising for different classes, with an average accuracy rate of 79% and an average PPV of 75%. The results show that the differences between the FCM results and the expert segmentation often arise from vehicles classified in different adjacent segments. Considering that the expert segmentation does not take into consideration the vehicle dimensions, these differences and the related decrease in the accuracy do not necessarily indicate a low classification performance.
Furthermore, we have shown that determining the dimension boundaries of each segment can enhance the consistency of expert-defined segmentations, particularly for vehicles from different classes with similar dimensions. The vehicle fleet composition will likely change in the near future for vehicle segments and vehicle dimensions because of the new carbon dioxide legislation. The proposed approach facilitates the accurate analysis of such changes enabling automated vehicle classification of large databases. Another important advantage of the clustering based mathematical segmentation is that it removes the subjectivity factors affecting expert-based segmentations, reducing classification errors and making databases from across the world comparable. Finally, the automatized clustering approach also reduces classification costs and training time.
A further area of potentially fruitful research would be to use the proposed method in combination with specific intra-class classifications and intra-cluster features to improve the clustering performance using semi-supervised deep learning algorithms especially for the vehicles with similar features to deal with the inter-class classification problem.
Footnotes
Acknowledgements
The authors thank the Federal Office (ASTRA) for providing Swiss Vehicle Information System (MOFIS) data as well as vehicle technical data set, Vehicles Expert Partner (auto-i-dat) and Thomas Bütler, who assisted greatly in the collection of the data. In addition, the authors would like to express their gratitude to Dr. Florian Kiefer for his assist in data manipulation.
Author Contributions
The authors confirm contribution to the paper as follows: study conception and design: N. Niroomand, C. Bach; data collection: N. Niroomand; analysis and interpretation of results: N. Niroomand, C. Bach; draft manuscript preparation: N. Niroomand, C. Bach, M. Elser. All authors reviewed the results and approved the final version of the manuscript.
Declaration of Conflicting Interests
The author(s) declared no potential conflicts of interest with respect to the research, authorship, and/or publication of this article.
Funding
The author(s) received no financial support for the research, authorship, and/or publication of this article.