
Abstract
Walking is the most basic and sustainable mode of transportation, and many jurisdictions would like to see increased walking rates as a way of reducing congestion and emission levels and improving public health. In the United States, walking trips account for 10.5% of all trips undertaken. To increase this rate, additional research on what makes people feel more comfortable while walking is needed. Research on pedestrian quality of service (QOS) has sought to quantify the performance of the pedestrian facilities from a pedestrian’s perspective. However, the impact of pedestrian safety countermeasures on pedestrian QOS for roadway crossings is largely unknown. The objective of this study is to discern pedestrian QOS based on physiological measurements of pedestrians performing normal walking activities in different traffic contexts. The naturalistic walking study described in this paper recruited 15 pedestrians and asked each to wear an instrumented wristband and GPS recorder on all walking trips for one week. Surprisingly, the findings from the study showed no correlation between participants’ stress levels and individual crossing locations. Instead, stress was associated with roadway conditions. Higher levels of stress were generally associated with walking in proximity to collector and arterial streets and in areas with industrial and mixed (e.g., offices, retail, residential) land uses. Stress levels were tempered in lower-density residential land uses, as well as in forest, park, and university campus environments. The outcomes from this study can inform how planners design urban environments that reduce pedestrian stress levels to promote walkability.
Walking is the most basic and sustainable mode of transportation, and many jurisdictions would like to see increased walking rates as a way of reducing congestion and emission levels and improving public health. In the United States, on a typical day in 2017, there were 38.9 million walking trips accounting for 10.5% of all trips undertaken. Walking is thus the second most prevalent mode after driving or riding in an automobile ( 1 ). Despite this, walking has received far less attention than the automobile with respect to guidance on planning, designing, and operating safe, functional, and comfortable facilities. Early research efforts on pedestrian quality of service (QOS) analysis employed vehicular performance measures such as delay and density.
More recent research efforts have sought to quantify the operation of the pedestrian facilities from the pedestrian’s point of view and have been included in the recent versions of the Highway Capacity Manual (HCM) ( 2 , 3 ). The HCM defines QOS as “a description of how well a transportation facility or service operates from a traveler’s perspective.” The HCM 6th ed. uses pedestrian delay as the basis for determining the level of service (LOS) of uncontrolled street crossings ( 3 ). The effects of some countermeasures on LOS can be evaluated using the HCM based on their ability to improve motorist yielding rates to pedestrians, shorten crossing distances, or both, which tends to reduce pedestrian delay. However, it is not known whether the presence of safety countermeasures improved QOS in other ways. For example, all else being equal, does the presence of a safety countermeasure correspond to a decrease in stress for the pedestrian?
The objective of this study was to determine how safety countermeasures affect the pedestrian QOS of roadway crossings, based on physiological measurements of pedestrians performing normal walking activities in varied traffic contexts. This study was part of a larger National Cooperative Highway Research Program (NCHRP) Project 17-87, the objective of which was the determine the effect of specific safety countermeasures on pedestrian satisfaction. The larger study followed a three-pronged approach to evaluating pedestrian crossing satisfaction and included the naturalistic walking study, which is the focus of this paper.
The naturalistic walking study recruited 15 pedestrians in Chapel Hill, North Carolina, and asked each to wear an instrumented wristband and GPS recorder on all walking trips for one week. Physiological measurements, including heart rate (HR) and electrodermal activity (EDA) were collected to record indicators of actual pedestrian stress levels, which are a proxy of pedestrian QOS. During their normal walking trips, participants encountered a variety of environments, from high traffic roadways with signalized intersections to tree-lined paths in pedestrian dominated areas. This provided a variety of contexts from which to compare pedestrian stress levels. This approach is novel in the study of pedestrian satisfaction. The findings from this study demonstrated no correlation between participants’ stress levels and individual crossing locations. Instead, stress was associated with roadway conditions with higher levels of stress being generally associated with walking in proximity to collector and arterial streets and in areas with industrial and mixed (e.g., offices, retail, residential) land uses. Stress levels were tempered in lower-density residential land uses, as well as in forest, park, and university campus environments.
The paper is laid out as follows. The background section provides a summary of related work on pedestrian QOS. The methods section is next, followed by results and conclusions.
Background
To date, efforts to assess pedestrian QOS have differed in the settings featured, the methods used, and the definition of “quality of service” employed. Means of assessing pedestrian QOS have been met with criticism for being too abstract, not sufficiently real, or based on pedestrians’ unique perspectives, and not adequately representative of the diverse locales and roadway types encountered by pedestrians across the country ( 4 ).
Existing HCM methods for evaluating QOS have been developed by different projects using a variety of data collection methods. One of the earliest methods to measure pedestrian QOS along a street, was based on a “Walk for Science” event held in Pensacola, FL in which 75 participants walked a 5-mi course, rating their satisfaction with the conditions experienced along each segment ( 5 ). NCHRP Project 03-70 conducted video labs in four cities around the United States, in which participants rated the walking environment shown in video clips, each of which depicted a walk along a street section, followed by crossing a side-street at a signalized intersection ( 4 ). The HCM 2010 incorporated a theoretical model of pedestrian delay at uncontrolled crossings based on the average pedestrian wait time for a suitable gap in traffic (assuming no motorist yielding) and the potential delay reduction as a result of driver yielding (based on field measurements or on national defaults for different crossing treatments) ( 2 ).
As these examples illustrate, previous attempts to construct a defensible, sensitive, and accurate measure of pedestrian QOS have proven challenging. For one, measuring perceptions is a difficult task to accomplish reliably and validly. For example, consumer research highlights how people’s evaluations of their experiences transcend simple rating schemes. Instead, people tend to draw on a complex array of cognitive appraisals and emotions when judging their experience of something ( 6 ). Moreover, depicting real-world walking scenarios can be difficult, as most study participants are asked to rate their appraisals of walking environments out of context. Even when in real pedestrian contexts, participants are often asked to act in contrived ways (e.g., acting as though one were actually in a hurry or rating environments “objectively” as one is being observed), which can elicit a host of response biases ( 7 ).
People often lack access to their physiological responses to habitually encountered environments ( 8 , 9 ). For example, a person who crosses the same street every day might be unaware that crossing four lanes of traffic tends to heighten sympathetic nervous system activity—which indicates significant distress. People’s brains often tune out constant, unchanging stimuli, such as traffic noise. Therefore, a promising data collection method might be to employ biosensors to detect changes in EDA and HR variability—physiological indicators of stress—as people experience varied pedestrian environments. This approach is supported by past work examining experienced drivers’ ability to anticipate road hazards before being consciously aware of them ( 9 ).
An emerging line of research involves the use of wearables that monitor participants’ physiological states. Much of this work has focused on monitoring clinical patients’ cardiovascular or cognitive functioning, such as anticipating epileptic episodes ( 10 , 11 ), stroke events ( 12 , 13 ), and sleep disorder patients’ position within the sleep–wake cycle ( 14 ). Other scholars have associated participants’ physiological states with the contagion of arousal thought to occur in collaborative learning settings ( 15 ). Closer to the present study, Chrisinger and King assessed individuals’ and groups’ stated and physiologically reported stress reactions to their urban neighborhoods finding that their EDA varied substantially by land use and the street type and often closely aligned with their verbal ratings of the built environment ( 16 ). The present study builds on this emerging psycho-physiological research by incorporating a naturalistic study design.
Methods
This section describes the naturalistic walking study: recruitment process, data collection equipment, pilot test, and the analysis tool used.
Recruitment Process
Study participants were recruited through the University of North Carolina’s (UNC’s) mass e-mail system. After receiving an exemption through UNC’s Institutional Review Board, Highway Safety Research Center (HSRC) staff sent an e-mail to 6,943 UNC employees and 2,042 students. Within two hours, 212 individuals expressed interest in participating. The team randomly selected and reached out to 20 study candidates from this pool of 212 individuals. The first 15 people who responded in the affirmative to all study criteria became study participants. The criteria required that the participants be at least 18 years old, have daily access to an iOS (Apple) smartphone, were willing and able to wear a biosensing wristband and carry a small GPS device with them for seven consecutive days, were willing to meet the members of the research team on two separate occasions, did not have any scheduled travel during the study period, and normally walked at least four times a week within downtown Chapel Hill, NC.
Participants were briefed on the data collection procedure during the intake meetings. During this session, participants downloaded an app to their phone used to sync data from the wristband, and practiced the two-step requirement on going for a walk of ensuring their GPS device was on and synced with GPS satellites once outside, and making sure their wristband was synced with the live stream app. Although smartphones have a built-in GPS chip that provides position information, the researchers decided not to use this for two reasons. First, the live streaming app did not have the capability to attach location information to data obtained from the wristband, meaning that a second app would need to be used at the same time to obtain location data. Second, the researchers were concerned about the smartphone’s battery drain associated with constant GPS use that could lead to lost data mid-trip or participant reluctance to record trips to preserve their phone’s battery charge for personal use.
At the intake meetings, participants were shown how to turn the devices on and off, how to charge them, and how often to do so. Participants also completed a brief intake questionnaire which collected their demographic information and their preferred time of day for receiving and responding to a daily “trip reconstruction questionnaire.” Researchers monitored participants’ use of the equipment daily noting how all participants appeared to make use of them each day. Over the seven-day study period, the research team sent each participant an average of two reminders to keep their devices charged and to sync their wristbands with their smartphones. At the completion of the data collection period, the researchers collected the equipment and conducted a debriefing session with each participant to review each of their walking trips, including trip purpose, presence of companions, presence of distractions (e.g., listening to music), and emotional state. Participants were compensated with $200 VISA gift cards for successfully completing the week-long data collection effort.
Data Collection Equipment
Physiological data were recorded using two of the Empatica E4 wristband’s four sensors:
1. The photoplethysmography (PPG) sensor, which estimates blood volume pulse (the relative volume of blood), interbeat interval (the time between two successive heartbeats), and running average HR (in beats per minute), the last of which was in 1-s intervals and used in this study; and
2. The electrodermal activity (EDA) sensor, which measures skin conductance in 0.25-s intervals. EDA was used as a proxy for stress in this study.
The two additional Empatica E4 sensors not used in this study were an accelerometer, which measures acceleration along three axes at 5-s intervals and proved too crude for this study’s purposes, and a thermometer, which measures skin temperature and proved overly sensitive to outside ambient temperatures for use in this naturalistic study.
The wristbands record data in “sessions,” meaning that participants had to manually start and stop each data collection session, corresponding to the start and end of each walking trip. Participants were given the option of removing the wristband between walking trips, if desired. Data were continually transmitted via a Bluetooth connection from the wristband to the live streaming app running on the participant’s smartphone. The app appended a timestamp to the data, conducted the HR post-processing, and uploaded the session data when possible via the phone’s Internet connection (cellular or WiFi). Participants had to charge their wristband at the end of each day.
Location data were collected using Spytec STI-GL300 real-time GPS trackers. These trackers are capable of recording latitude and longitude coordinates at 5-s intervals and uploading the data on a regular basis to the GPS service vendor using a built-in cellular connection. The devices’ battery life was such that, in most cases, no charging was required during the data collection period. However, the devices’ default data-recording interval is one minute and required the GPS vendor to manually change the recording interval to 5 s via the devices’ built-in cellular connection.
Data Collection Procedure
Research staff tested the wristbands and GPS units in February 2019 to understand the devices’ data output and data processing options. These insights were then applied in developing a web tool for processing the data, described below. One issue that was noted was that even though the project ordered and paid for GPS data reporting at 5-s intervals, the test device initially reported its position at its default 1-min interval. It took multiple contacts with the GPS vendor to get the device’s settings changed to reporting at 5-s intervals. It may be that the typical use cases for the devices (e.g., real-time tracking of delivery vehicles, tracking potentially cheating partners) do not require more than 1-min tracking intervals and the vendor was not accustomed to dealing with more-frequent reporting intervals, even though it was offered as an extra-cost option.
A pilot data collection effort with five participants took place from April 1 to 7, 2019, with data for the remaining 10 participants collected from April 12 to 18, 2019. The project team continued to experience problems with the GPS vendor not providing data at the desired 5-s intervals and being slow to make the necessary updates to the units, with the result that more than half of the usable walking trips had location data recorded at 1-min intervals, rather than the desired 5-s intervals.
Analysis Tool
The researchers developed a web-based tool to process the data files for individual walking trips, match wristband data to location data based on timestamps, and visualize the data on a map. Because different people have different skin conductance values and resting HRs, and because their baseline values for these factors change over the course of a walking trip, a focus of the data analysis effort was to identify and evaluate peaks in skin conductance and HR. For example, based on the literature, a change in skin conductance of 0.05 microSiemens (μS) or more over 0.25 s is considered a “skin conductance response” (i.e., peak) ( 12 ). The greater the number of peaks per minute, the greater the stress level being experienced. Similarly, sudden changes in HR can indicate sudden events, such as being startled by a deer (as happened during a test session) or a close call with a vehicle.
Figure 1 provides an example visualization of a walking trip taken by one study participant. The left-side map in the figure shows the path of this walking trip. The blue marker on the map indicates the beginning of the trip; the red marker at the top of the map indicates its end. The red line shows the GPS-reported path of the walking trip. Surrounding the red line outlining the walking trip path are cooler (green and blue) and warmer (yellow, orange, and red) bands indicating the participant’s EDA and HR associated with spots and segments along the trip. The right-side graphs in Figure 1 display the participants’ average and maximum EDA metrics over the duration of the walking trip. As one can see from the map and graphs, the participant’s EDA on this trip was relatively low earlier on but elevated significantly about two-thirds of the way into the trip. Fluctuations in the participant’s HR were not as volatile yet demonstrated variability over the course of the trip.
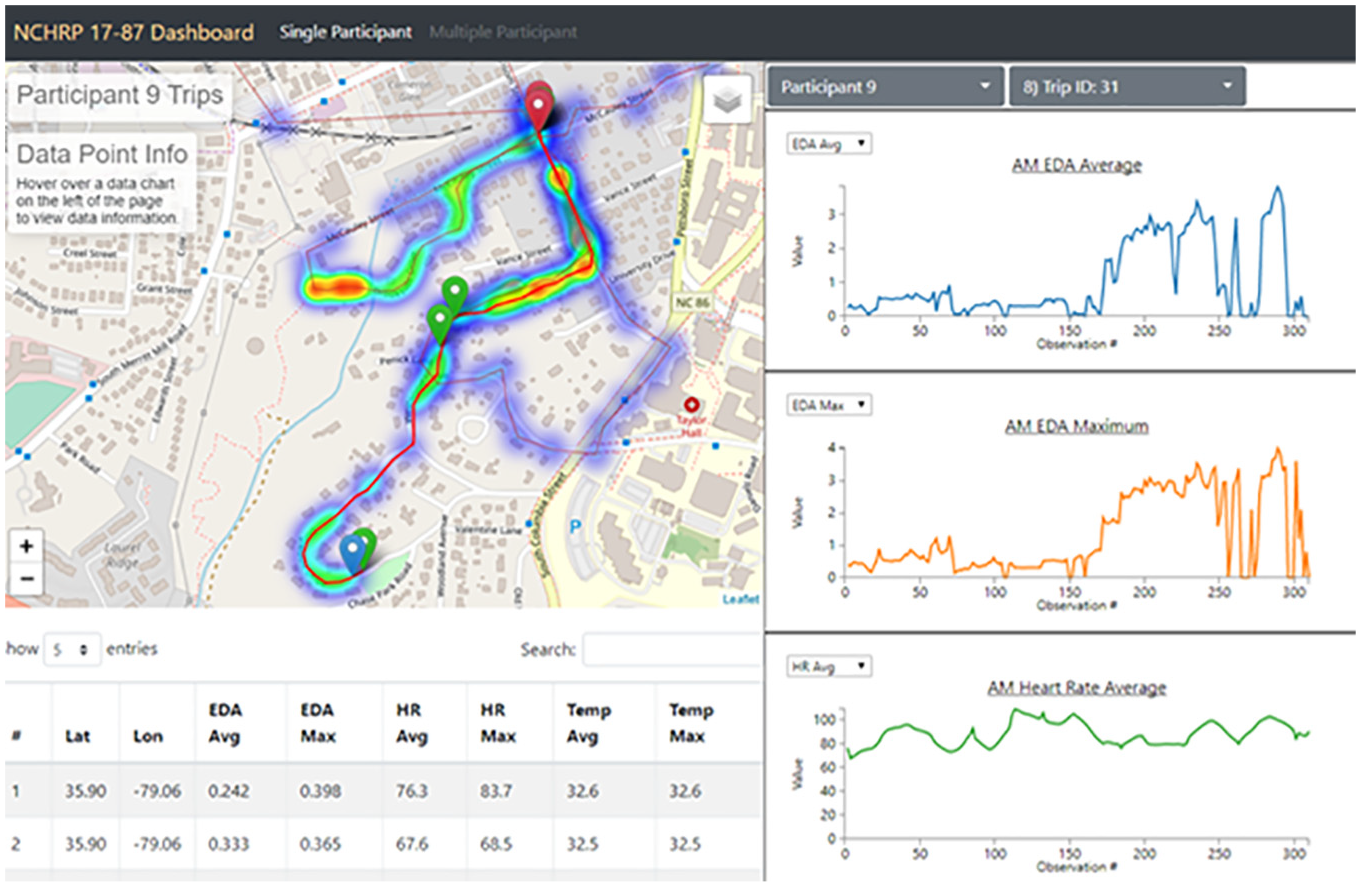
Example visualization of a participant’s walking trip, with time- and location-bound electrodermal activity (EDA) and heart rate (HR) readings.
Results
Participant Characteristics
Despite the study sample being comprised of UNC staff and students, the 15 naturalistic walking study participants closely resembled the adult population of Chapel Hill, NC in age and sex. However, a disproportionately high percentage of study participants graduated from college and identified as Black, whereas no study participants identified as non-White Hispanic (Table 1).
Participant Demographics
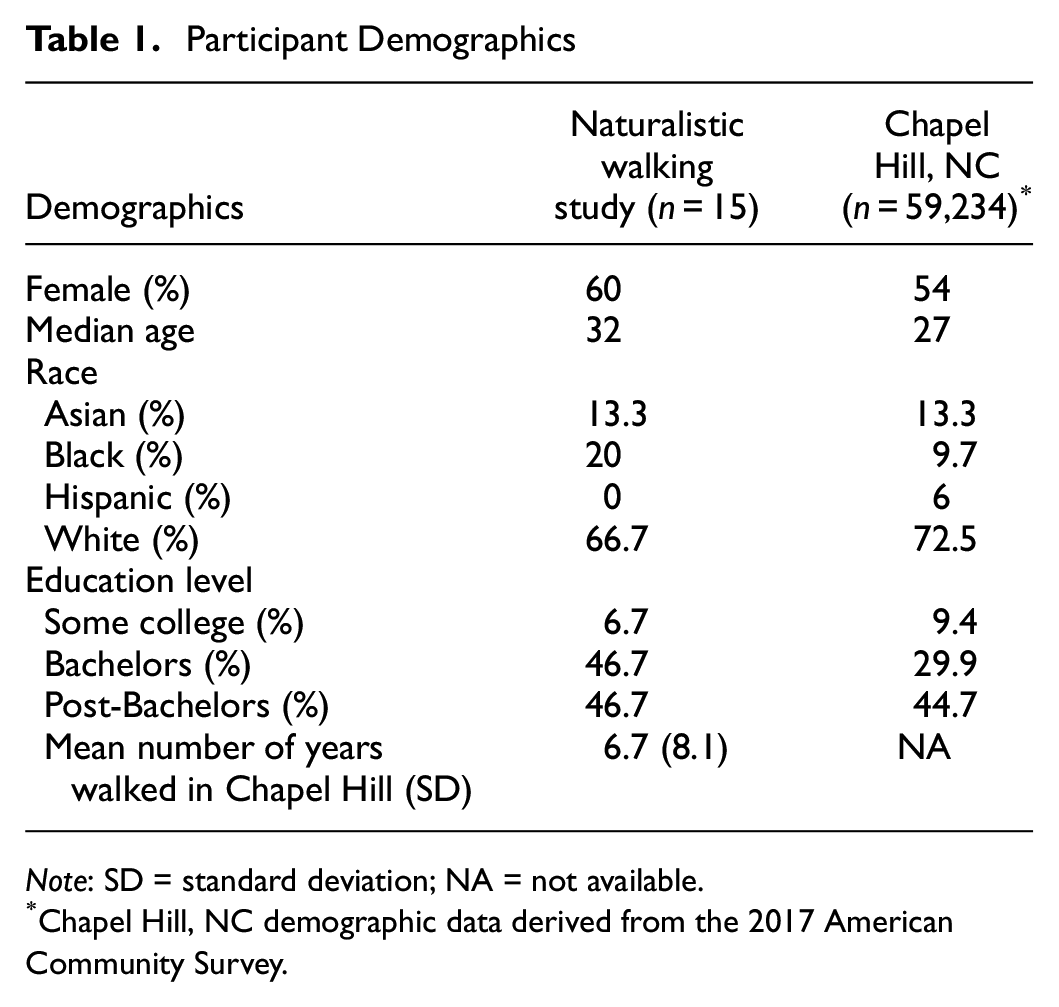
Note: SD = standard deviation; NA = not available.
Chapel Hill, NC demographic data derived from the 2017 American Community Survey.
Data Preparation
After a seven-day period, participants produced linked wristband and GPS data for a total of 21 walking trips. Among these 21 trips, nine recorded participants’ GPS location data at 5-s intervals; the remaining 12 trips provided GPS location information at 1-min intervals. The team expected to receive data for about 60 walking trips in total. However, over the course of the study, several participants reported forgetting to start wristband sessions on performing one or more walking trips. Moreover, within three days of involvement in the study, three participants’ GPS devices shut off because of lack of power. Other participants did not carry their GPS devices with them on walks. Finally, two participants provided linked data for several trips lasting less than 10 min, often depicted as walks across UNC’s campus. Although the research team applied a daily data monitoring and reminding protocol, as referenced earlier, the team only obtained linked data for an estimated 35% of probable walking trips. Specifically, 11 participants each recorded one qualifying trip, two participants each recorded two qualifying trips, and another two participants each recorded three qualifying walking trips. Thus, a total of 21 trips from 15 participants were included in the final analysis, representing a total of 1,693 unique observations.
Modeling Approach
To assess participants’ stress levels while engaging in their typical walking routines, the research team incorporated the mean and maximum measures of both EDA and HR for each of the 1,693 time intervals in the data set as dependent variables into the present analysis. EDA and HR have been used as a measure of physiological stress in related studies ( 16 , 17 ). It was hypothesized that maximum and mean EDA, and maximum and minimum HR readings would covary substantially within trips. Mean EDA and HR measurements were used to capture the central tendency of participants’ physiological activity per interval. Maximum EDA and HR measures were used to capture peak events within each time interval.
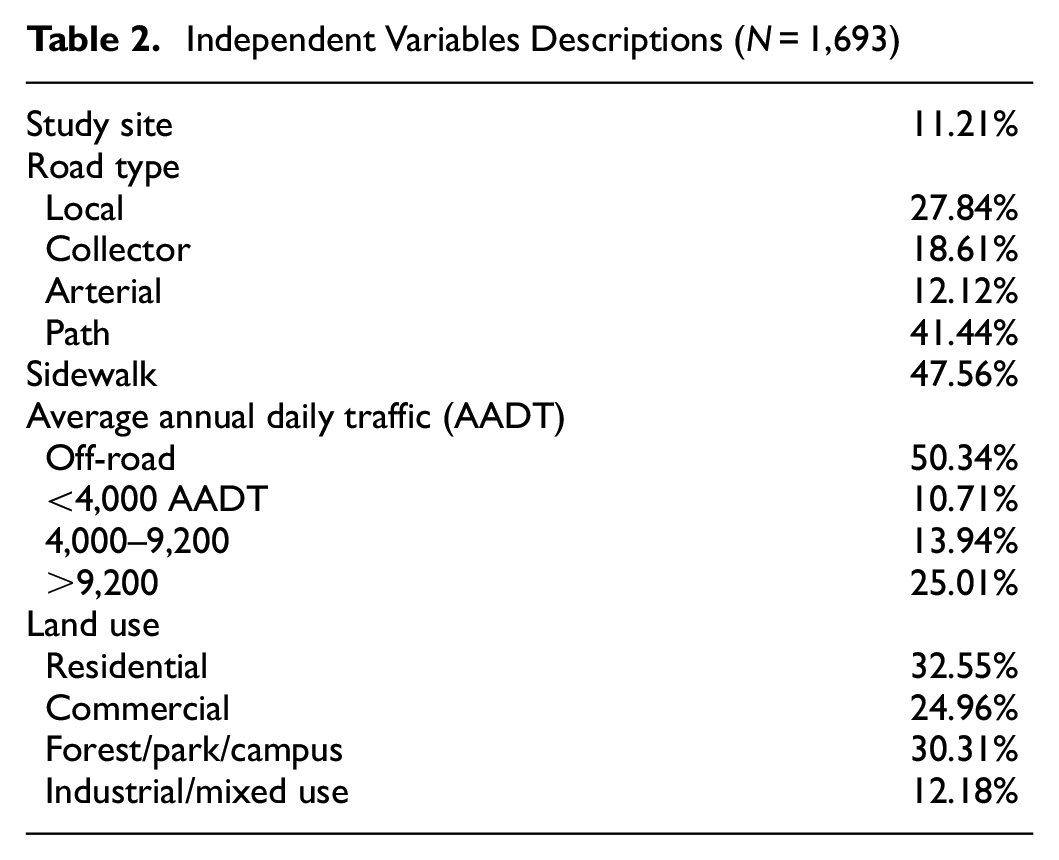
To explain variation in mean and maximum EDA and HR, the team gathered data on four classes of independent variables from the town of Chapel Hill’s Open Data Streets geographic information system ( 18 ). These variables reflected the road type (i.e., local, collector, arterial, and off-road path) and presence of a sidewalk; the average annual daily traffic (AADT) of the adjacent roadway; whether participants passed by or walked across any of the NCHRP 17-87 Project’s study sites; and the adjacent land uses. Table 2 describes the independent variables used in this study. In the interest of avoiding small sample bias, some land use types were collapsed. For example, parks, forested landscapes, and UNC’s campus were collapsed into one land use category. Similarly, industrial and mixed land use categories were collapsed to achieve better fitting models.
Independent Variables Descriptions (N = 1,693)
Employing multilevel mixed-effects generalized linear models with gamma distributions using Stata version 16 software ( 19 ), all four dependent variables were regressed onto independent variables described in Table 2. This modeling approach was selected after considering the dependent variables’ fitting a ratio measurement scale and their adherence to a gamma distribution. All models were of the form:

where Y ij represents one of four dependent variables (i.e., mean and maximum EDA and HR) at time interval i (with i = 1, 2, …n intervals) occurring within trip j (with j = 1, 2, …21 trips). The vector X comprises trip-level variables from Table 2. The error term ε ij reflects the residuals unaccounted for in the fixed-effects portion of the model. The model’s intercept β 0ij has a mean γ0 with a variation around it among individual trips, as depicted by the random variable u0j with E(u0j) = 0 and var.(u0j) = σu02 written as:

The coefficient β1ij associated with variable X ij is assumed to be random, where the coefficient has a mean γ1 and its variation among individual trips is described by a random variable u1j with E(u1j) = 0 and var.(u1j) = σu1 2 :

To assess associations among the study’s four dependent variables (i.e., mean and maximum EDA and HR), the research team calculated Pearson correlations (Table 3).
Correlation among Participants’ Electordermal Actibity (EDA) and Heart Rate (HR) Readings
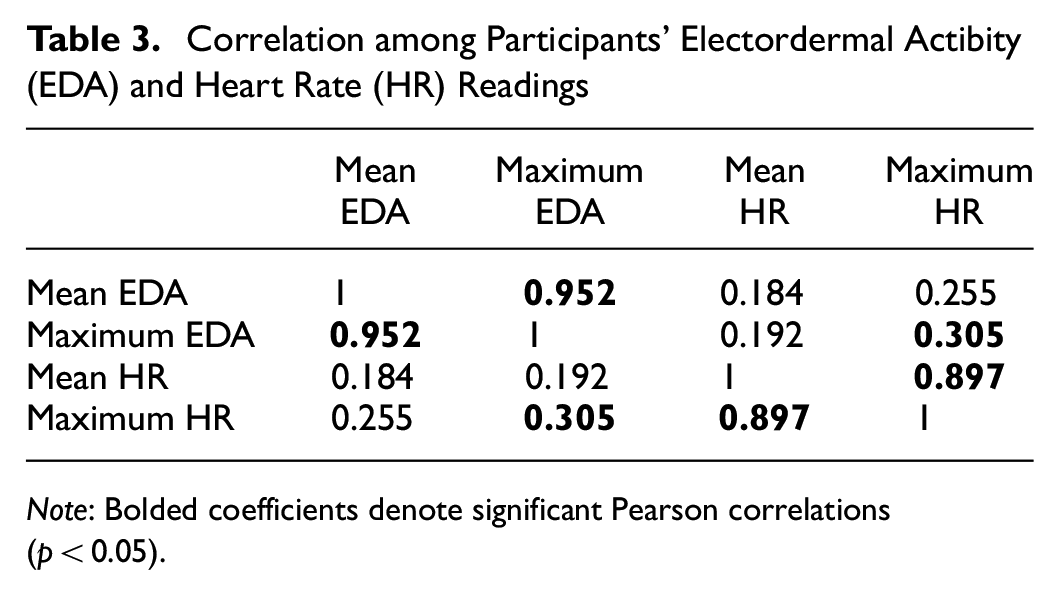
Note: Bolded coefficients denote significant Pearson correlations (p < 0.05).
As seen in Table 3, participants’ maximum EDA and HR readings were significantly, yet modestly correlated. Participants’ HR elevated during some portions of their walk, such as when they walked uphill, whereas their EDA may have indicated relative relaxation. Another factor likely involved the relative volatility of participants’ EDA, which often varied widely over the course of a walking trip. HR on the other hand, rarely oscillated by more than 20% throughout a walking trip.
Findings
Multilevel mixed-effects generalized linear models revealed that participants’ mean and maximum EDA values (i.e., levels of stress) were elevated in environments with industrial and mixed land uses (e.g., offices, retail, residential) located along collector and arterial roadway types. Their stress levels were relatively low in lower-density residential land uses, as well as in forest, park, and university campus environments (Table 4 and Figure 1).
Multilevel Mixed-Effects Generalized Linear Model Results for Participants’ Electrodermal Activity (EDA) and Heart Rate (HR), with a Random Interval Fit at the Level of Participants’ Trips (n = 21)
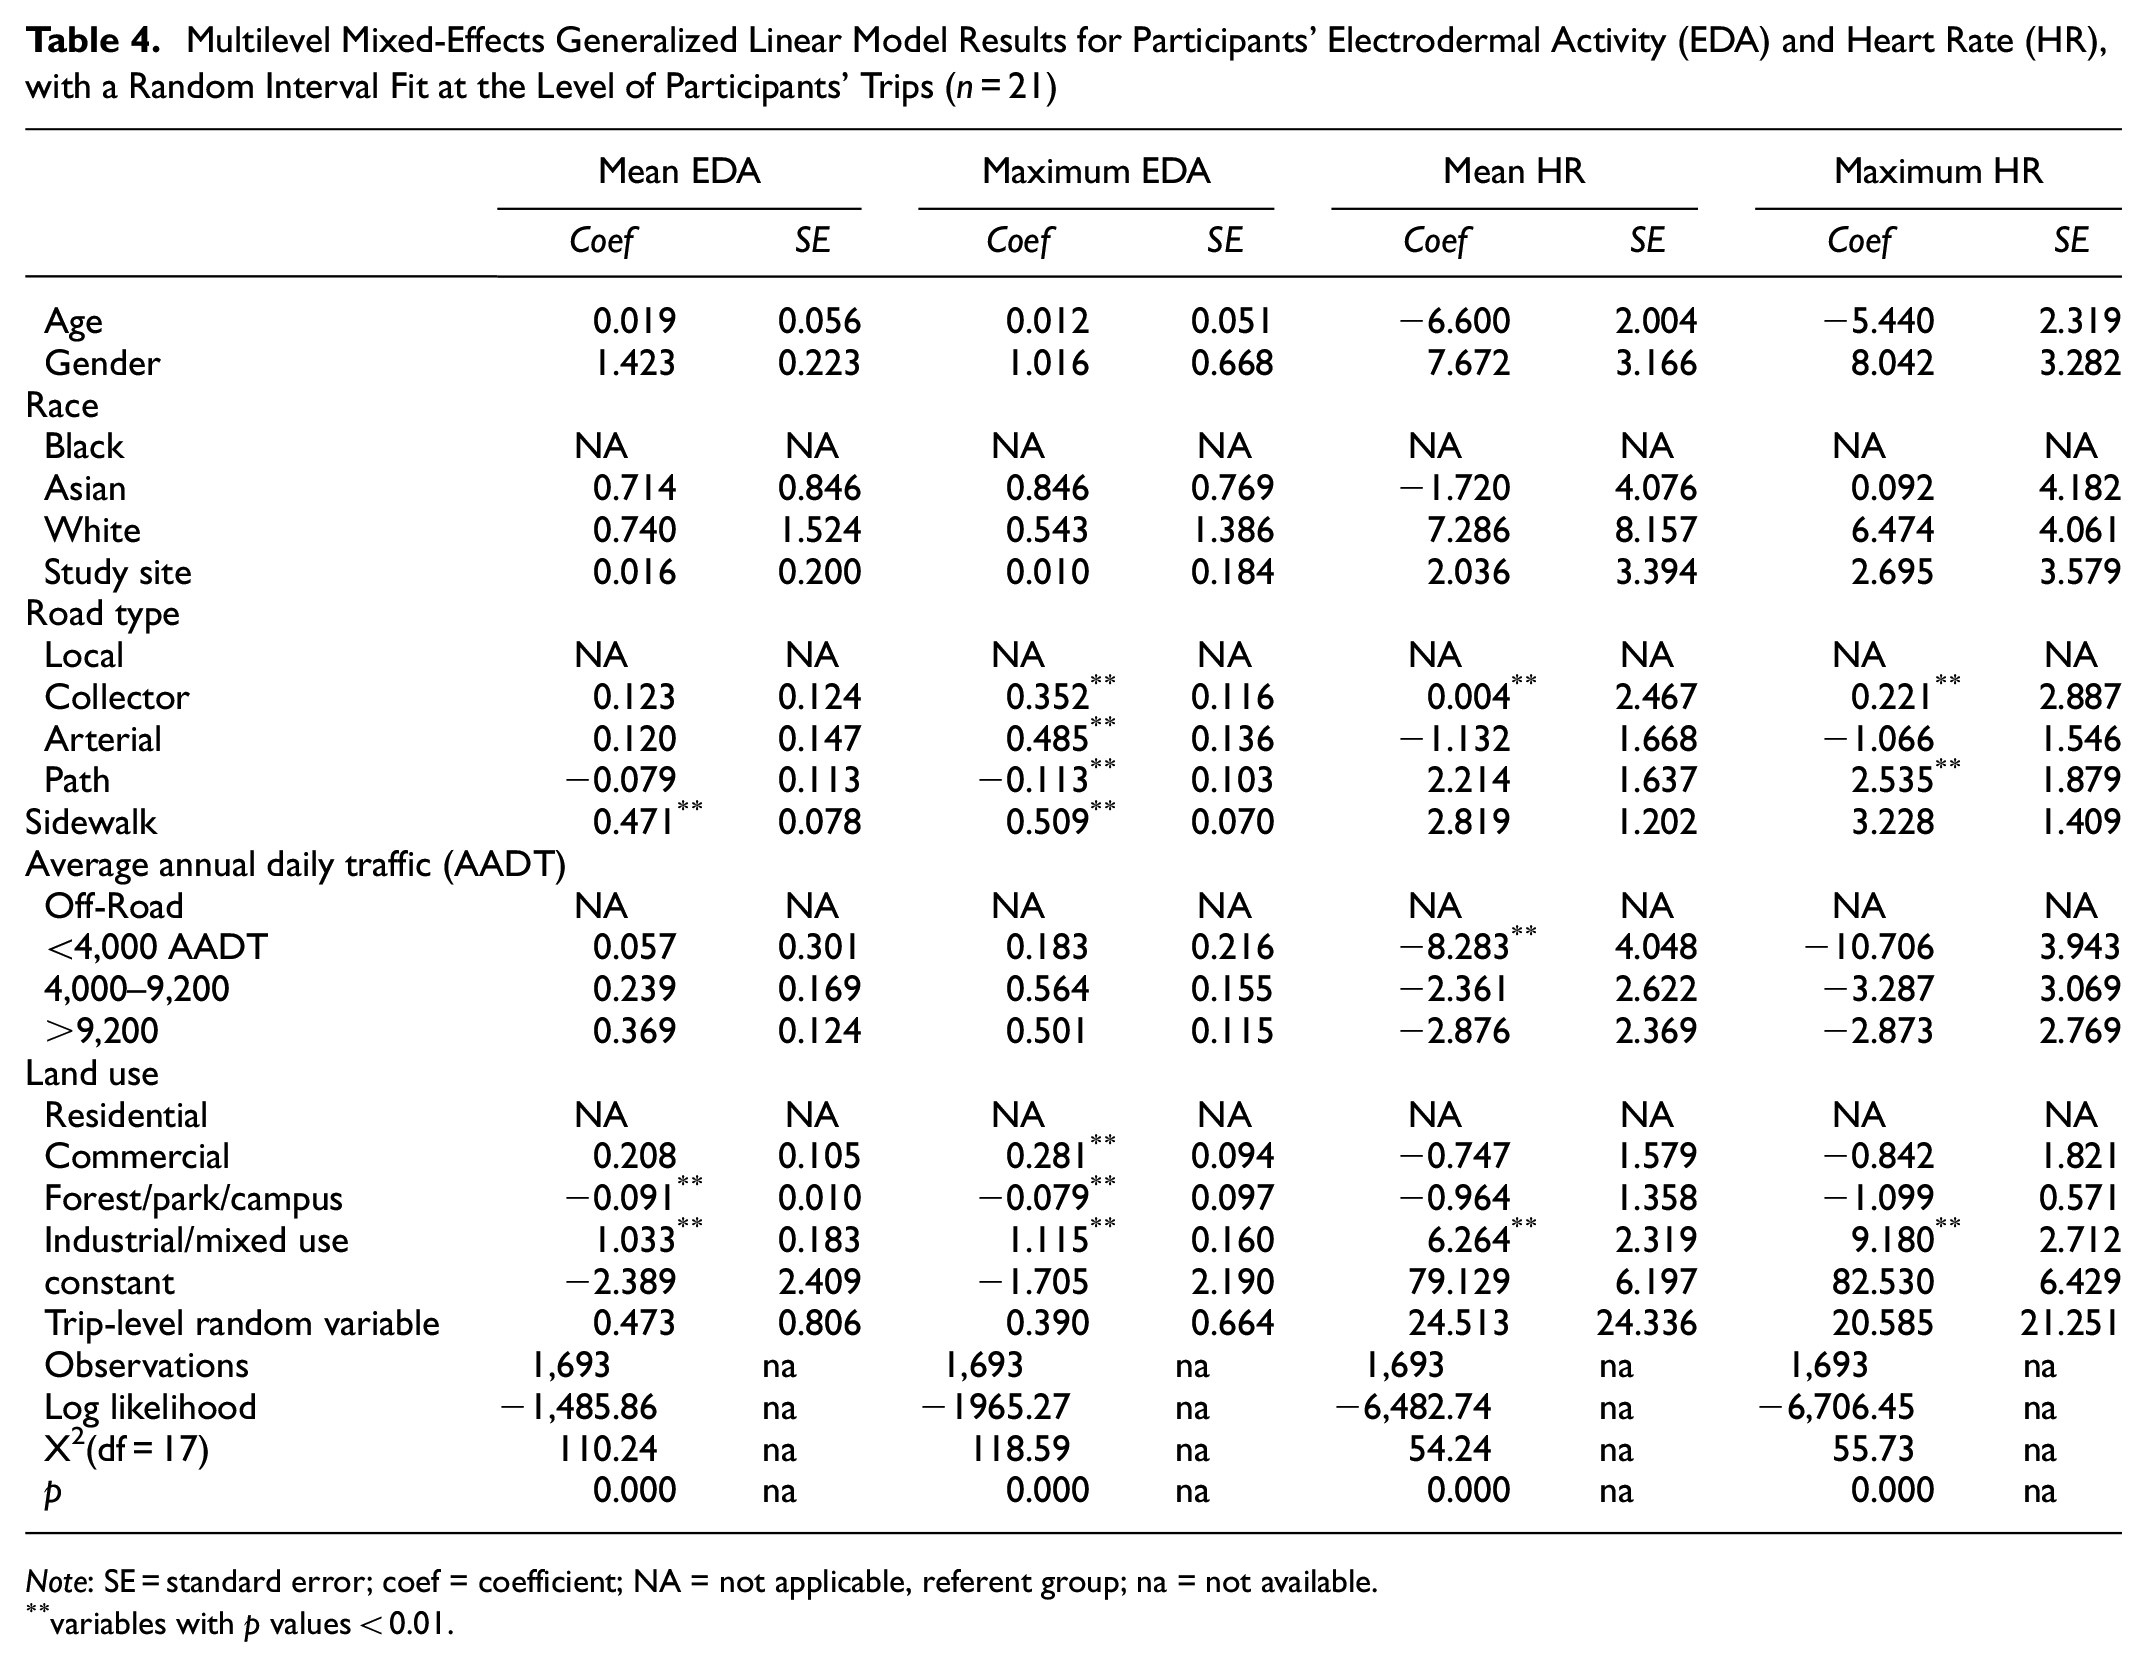
Note
variables with p values < 0.01.
The participants’ mean and maximum HR were elevated in land contexts with mixed and industrial uses, as well as along collector roads. Participants’ HR was lower when walking along paths and in environments with lower motor vehicle traffic (<4,000 AADT). In contrast to the expectation at the start of the study, EDA and HR measures were not significantly associated with participants’ proximity to study sites (i.e., crossings treated with safety countermeasures) being studied through other NCHRP Project 17-87 research tasks (Table 4, Figures 2 and 3).
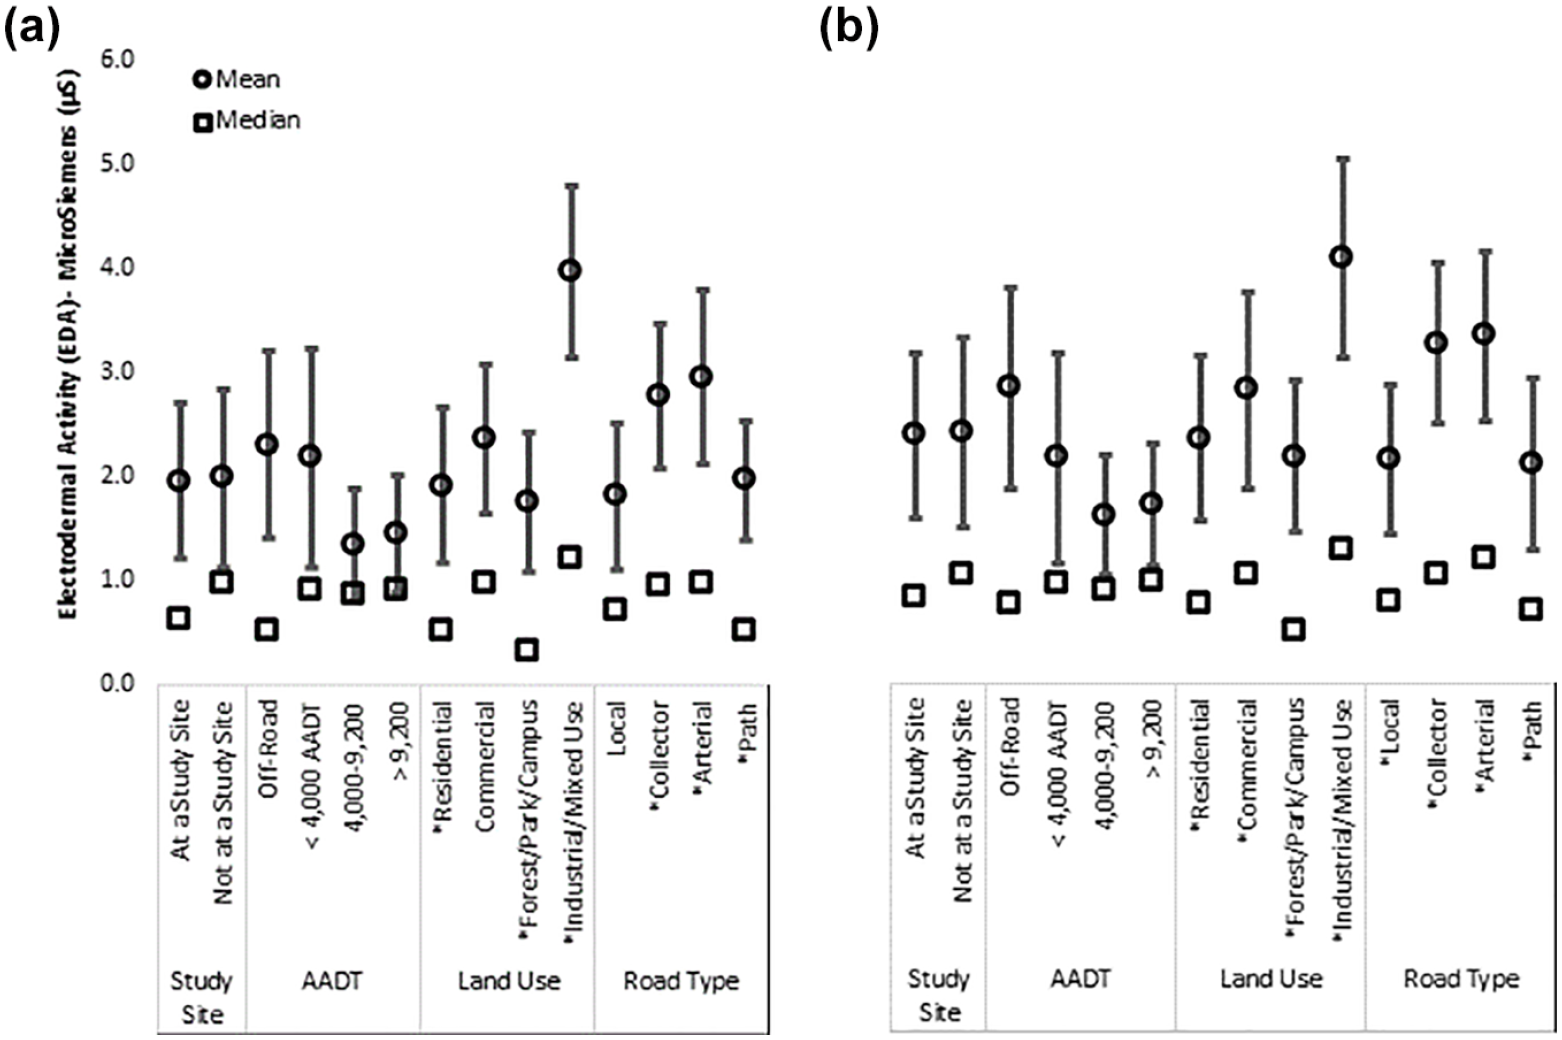
Participants’ mean: (a) and maximum (b) EDA recordings while walking through various land use and roadway environments.
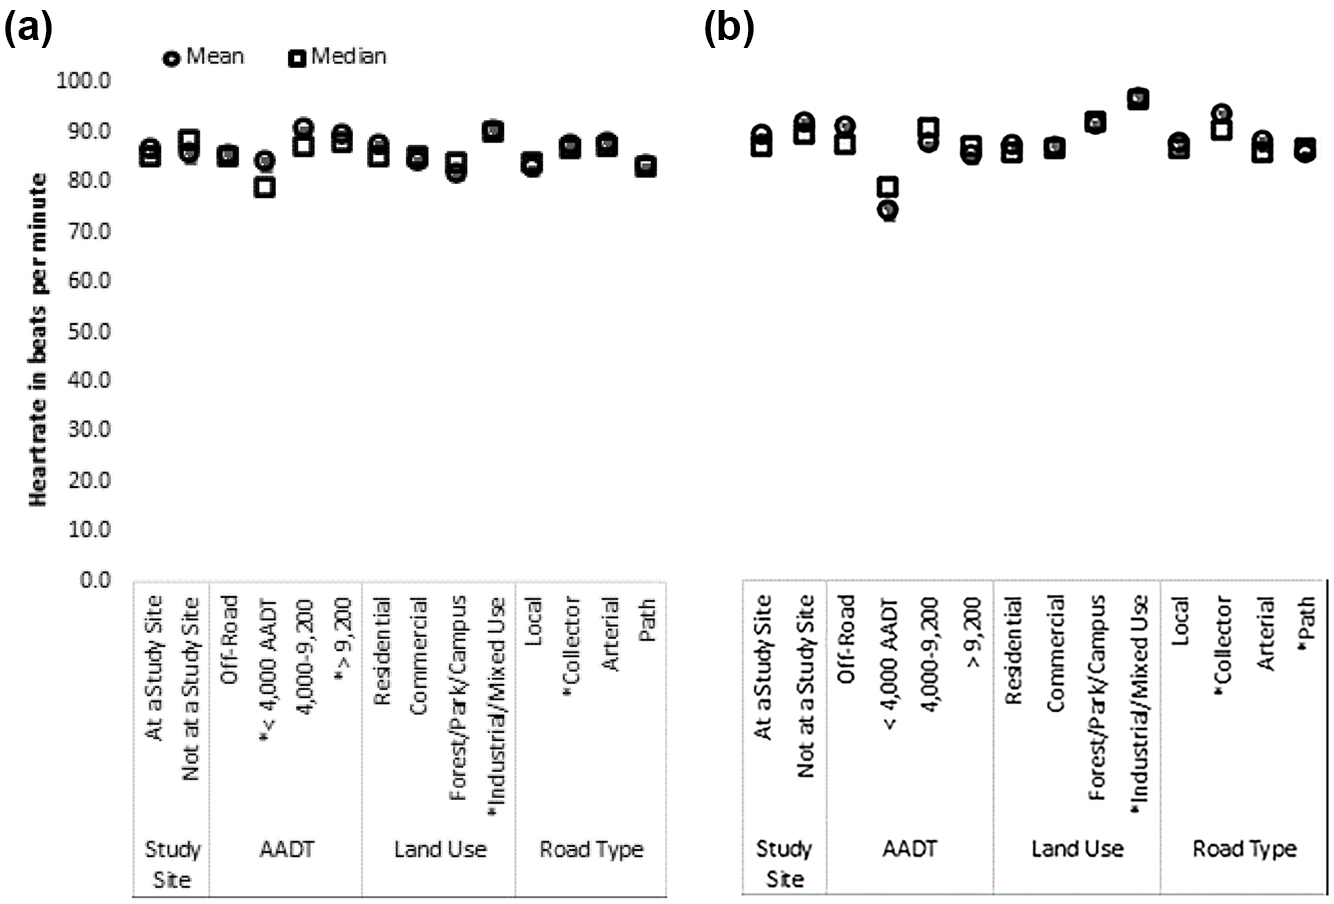
Participants mean (a) and maximum (b) heart rate values while walking through various land use and roadway environments.
Discussion
Surrounding land uses interplayed with participants’ stress levels when walking. Participants experienced greater levels of stress in places with mixed or industrial land uses. This finding corroborates research indicating that pedestrians traveling on a segment in mixed or dense land development are more prone to crash risk ( 20 ). Pedestrians, unlike drivers who experience landscapes in a vehicle-mediated and thus dampened fashion, are more exposed to the dynamics of urban environments. Larger roadway types tend to serve more traffic than their smaller counterparts, and thus produce higher ambient noise and, in locations with many intersections and driveways, more opportunity for stress-inducing interactions (e.g., conflicts or crashes) with motor vehicles. This environmental exposure likely explains the lack of a significant relationship between pedestrians’ stress levels in proximity to crossings treated or untreated with safety countermeasures while also explaining the heightened stress response to busier land development. The mere proximity to potential conflicts or crashes may heighten stress, even if the perception of a lack of safety is subconscious ( 9 ).
As background noise has been shown to increase cognitive load ( 21 , 22 ), noisier roadways may rapidly deplete pedestrians’ cognitive resources, which can result in lapses of judgment and depressed mood ( 23 ). On collector and arterial roadways, motor vehicles often travel at higher speeds, which portend louder roadway environments. To the human ear, traffic traveling at 65 mph sounds twice as loud as traffic traveling at 30 mph, and 2,000 motor vehicles sound twice as loud as 200 vehicles ( 24 ). As traffic noise is positively associated with experiences of psychological stress ( 25 ), it stands to reason that pedestrians in this study, and in similar contexts, would indicate higher levels of physiological stress while walking along larger roadways which carry higher amounts of motor vehicle traffic. Similar logic applies fear-inducing interactions with drivers of motor vehicles. The greater the number of motor vehicles traveling alongside and or turning into pedestrians’ travel trajectories, the higher their tension and stress.
Natural environments, on the other hand, are known to restore what is called “directed attention”—“an attentional mechanism that requires effort, that can be brought under voluntary control, and that depends on inhibition for its operation” ( 26 ). For example, White and Shah demonstrate how the human attention system has evolved for interacting with nature and that attention is taxed by urban environments ( 27 ). They explore how exposure to nature can restore people’s attention and ameliorate their stress. This helps explain why participants’ stress levels were modulated in environments with abundant nature, such as forest paths, lower traffic, tree-lined local streets, and on UNC’s oak tree-strewn campus. This finding is supported by the NCHRP 17-87 project’s intercept survey results, where participants reported greater satisfaction with their crossing experiences in locations with less traffic, on lower-classification roadways, and where they experienced less delay in crossing.
Another purpose of this naturalistic walking study was to validate intercept survey and video observation data obtained at sites with pedestrian safety countermeasures. As reported in post-study debriefing sessions and verified—to the extent possible— by GPS data, a handful of participants crossed at study crossings treated with safety countermeasures. The statistical models used in this analysis failed to detect significant relationships between participants’ crossings at study sites—or crossings more generally—and their stress levels. It appears that stress was associated with simply walking on a busy street, rather than with the act of crossing the street.
Although this pilot study represents one of the first to examine pedestrians’ physiological states while engaging in mundane walking activity, it maintains a few notable limitations. For one, the loss of data from approximately 40 walking trips precluded the research team from discerning patterns of stress experience within participants. Missing data stemmed predominantly from two sources. First, from participants forgetting to sync their wristbands with their smartphones and to keep devices charged. Second, from recording information for exceedingly short trips (i.e., most often <8 min in length). Future studies should explore the use of devices or apps which integrate GPS and biosensing, incorporate safeguards for reporting participants’ locations on at least 5-s intervals, and enrolling participants for whom walking is a primary form of transportation.
No correlation was found between participants’ stress levels and individual crossing locations, including those crossings that were part of the intercept survey and video observation studies. Though it is possible that higher EDA activity indicated eustress, that is, excitement or stimulation in some instances and environments, participants tended to describe negative stress when walking along busier urban facilities during study debriefing sessions and demonstrated a preference for lower traffic environments, as revealed in their spending more than half of their time walking on off-road paths and in residential areas (Table 2). Thus, in this study, higher EDA activity was generally thought to indicate instances of negative stress. Further, the team did not account for topographic slope in our analyses, which would conceivably covary with participants’ heartrate and constitutes a limitation of this study. Higher stress levels were generally associated with walking in proximity to collector and arterial streets and in areas with industrial and mixed (e.g., offices, retail, residential) land uses. Stress levels were relatively low in lower-density residential land uses, as well as in forest, park, and university campus environments. Participants’ mean and maximum HRs were elevated in land contexts with mixed and industrial uses, as well as along collector roads. Participants’ HRs were lower when walking along paths and in environments with lower motor vehicle traffic (<4,000 AADT). While none of these findings are particularly surprising, they do provide a quantitative confirmation of findings from previous qualitative studies involving pedestrian satisfaction surveys. Nonetheless, as the preponderance of EDA research has taken place in indoor settings, more research is needed to identify how well EDA correlates with stress vis-à-vis other factors in outdoor environments.
Prospective studies that employ similar methodologies could include measures of participants’ EDA in the context of larger crowds, exploring how crowding along sidewalks, at crossings, and so forth interacts with participants’ self-reported and physiological stress levels. Other studies might use this methodology to explore interactions among different pedestrian treatments, walking surface qualities, and pedestrian stress; all of which could inform the development of infrastructures for people of all ages and abilities. Still others could estimate the cost effectiveness of applying physiological measures of pedestrian stress over larger scales and in comparison with other methods of estimating pedestrian QOS. Finally, the current methodology could be integrated into pedestrian safety studies, ones that explore whether and to what extent sudden shifts in pedestrians’ EDA anticipate hazards in the road environment, thereby advancing pedestrian risk assessment.
Conclusions
The major contributions of this pilot study are twofold. First, this study shows the connection between pedestrian stress and roadway conditions. Specifically, higher stress levels were generally associated with walking in proximity to collector and arterial streets and in areas with industrial and mixed (e.g., offices, retail, residential) land uses. Pedestrian stress was tempered in lower-density residential land uses, as well as in forest, park, and university campus environments. The outcomes from this study can inform how planners design urban environments that temper pedestrian stress to promote walkability.
Second, this study adapts a methodology used in other fields for measuring physiological response as an additional QOS metric for evaluating the built environment. Future studies can expand on this study by verifying the findings of the sample study and introducing physiological response as a performance measure to consider while planning urban environments.
Footnotes
Acknowledgements
The authors would like to thank Sarah Brown for her assistance with piloting the use of the study equipment and onboarding study participants, as well as Bill Rogers and the NCHRP 17-87 project panel for their valuable feedback.
Author Contributions
The authors confirm contribution to the paper as follows: study conception and design: Seth LaJeunesse and Krista Nordback; data collection: Seth LaJeunesse; analysis and interpretation of results: Seth LaJeunesse, Paul Ryus, Wesley Kumfer, and Sirisha Kothuri; draft manuscript preparation: Seth LaJeunesse, Paul Ryus, Sirisha Kothuri, and Wesley Kumfer. All authors reviewed the results and approved the final version of the manuscript.
Declaration of Conflicting Interests
The author(s) declared no potential conflicts of interest with respect to the research, authorship, and/or publication of this article.
Funding
The author(s) disclosed receipt of the following financial support for the research, authorship, and/or publication of this article: Funding was provided by the National Cooperative Highway Research Program (NCHRP) grant # 17-87, and the project was managed by the Transportation Research Board (TRB) of the National Academies of Science, Engineering, and Medicine.
The opinions and conclusions expressed or implied here are those of the authors. They are not necessarily those of the Transportation Research Board (TRB), the Academies, or the (National Cooperative Highway Research Program) NCHRP.