
Abstract
Unplanned rail disruptions result in substantial delays to passengers and severe effects on the economy of a large city like Toronto. While bus bridging has been a widely adopted method to replace the subway service in such events, its effect on the operational resilience of the subway service is less often studied. This study assesses the resilience of the subway network of Toronto employing an optimal bus bridging strategy. First, subway incidents are categorized based on their characteristics using K-mean clustering analysis. The incidents are then grouped based on the performance of optimal bus bridging plans. Classification and regression tree analysis is used for this task, employing two metrics: the total user delay and total number of shuttle buses under the optimal bridging scenario. Queueing and optimization models developed previously by the University of Toronto are used to determine and simulate the optimal bus bridging plans of a sample of incidents. The severity of unplanned disruptions is finally demonstrated using a severity scale and the effect of incident duration uncertainty is analyzed. The results show that along the congested city alignments, where the capacity of the roads and stations is limited, the bus bridging service is often insufficient to replace the train service. However, it could be a good alternative in uncongested subway segments where the available street capacity is relatively high, allowing large bus volumes to serve the corridor. This model is easily applicable to different rail systems and it could assess other systems to produce better bridging plans.
Public transit is the backbone of the transport network and linchpin of the economy in any major world city. Unfortunately, there has been a declining trend in transit ridership across Canada and the U.S.A. in recent years and an upward trend in automobile use and road congestion, with severe impacts on air quality and road safety ( 1 ). Reversing these trends requires providing high quality and reliable transit service with minimal service interruption. Designing a resilient network, that can quickly go back to its normal operation and swiftly absorb shocks of major disruptions, has been of interest to transit operators and researchers.
The literature presents several definitions of transport system resilience while distinguishing it from related system characteristics such as vulnerability. For example, Berdica ( 2 ) states that “Vulnerability in the road transportation system is a susceptibility to incidents that can result in considerable reductions in road network serviceability.” Mattsson and Jenelius ( 3 ) believe that this definition is valid for other modes of transportation, including public transit. However, they distinguish it from resilience by defining the latter as “a broader socio-technical perspective on the transport system’s capacity to maintain or quickly recover its function after a disruption or a disaster.” Transit network resilience could be associated with major large-scale events with long lasting effects, such as natural disasters, wars, or union strikes. On the other hand, some researchers introduce the notion of service or operational resilience which is associated with unplanned disruptions of daily operations in specific services of the transport network ( 4 ). These services could be part of the rail system, bus network, or other services of the transit/transportation system. Although major events have widespread and long lasting impacts on the entire network and society, they happen rarely. In contrast, unplanned operational disruptions occur relatively frequently, with their effects limited to certain corridors or portions of the network. Being the most effective means to move large masses of passengers, frequent operational interruptions in rail service can cause extensive delays and major losses to the economy. The New York Comptroller office reports the annual economic cost of major subway disruptions in New York at 389 million U.S. dollars ( 5 ). Filling network gaps caused by subway disruptions and returning to normal service quickly are essential to mitigate these economic losses.
The design and built-infrastructure of the rail network, more specifically the position of the turnback tracks, crossovers, or interlockings, allowing trains to change their direction/turn in case of operational disruptions, is a key determinant of the resilience of the rail service. In the absence of turnback tracks at each rail or subway station, the resilience of the subway service deteriorates. An incident at a single station can cause a series of consecutive rail stations to be out of service. The length of the closed segment depends on the location of the turnback tracks. A research study explored the placement of turnback tracks in the rail system of Melbourne, Australia, and its effect on managing unplanned rail disruptions. The authors concluded that placing crossover tracks near areas that are highly susceptible to disruptions benefits both users and operators substantially ( 6 ). Nevertheless, bridging the gap between disrupted stations remains a challenge in many rail systems.
In Toronto, like many other cities in North America and Europe, major operational disruptions in rail services are usually replaced with temporary bus services linking the disrupted stations, a strategy known as bus bridging. The application of this strategy in practice is often simplistic, relying heavily on professional experience and ad-hoc decisions. Most of the shuttle buses running between disrupted stations are pulled from scheduled bus routes in the transit system, further worsening the service elsewhere in the network. As such, bus bridging decision support tools are important to enhance the resilience of subway service in the face of unplanned disruptions. Data-driven analysis of bus bridging operations is key to understanding how this strategy affects the resilience of the subway service. A decision support tool was developed recently to help agencies manage unplanned service interruptions using optimized bus bridging strategies (7–9).
Building on the recent efforts by the transit research team at the University of Toronto, this paper aims at studying the effect of bus bridging on the operational resilience of the subway network operated by the Toronto Transit Commission (TTC), the public provider of transit in the City of Toronto. Unplanned rail disruptions in Toronto occur frequently, with an average of 2.5 incidents per day in the streetcar system and 0.4 incidents per day in the subway network ( 10 ). The rising population of Toronto, which is the fastest growing city in North America ( 11 ), exerts high pressure on the subway system. Before the COVID-19 crisis, an average of 1.4 million daily trips were made on a typical business day on the subway network operated by TTC in 2018 ( 12 ). In fact, certain segments of Line 1 (yellow line), shown in Figure 1, run with demand levels above capacity during morning peak. In such conditions, any disruption of the service cause severe delays to passengers and substantial economic losses.
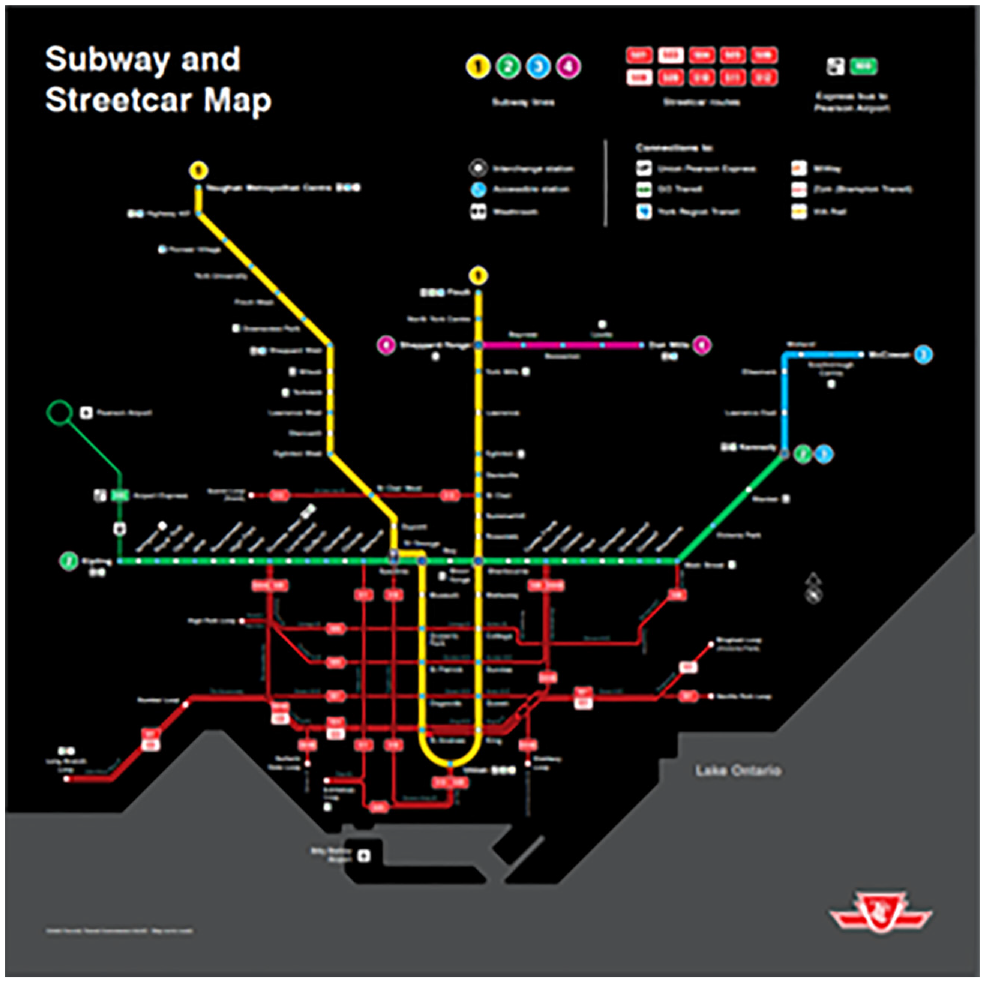
Toronto Transit Commission (TTC) subway and streetcar system map ( 13 ).
This paper explores the categorization of unplanned disruptions based on the performance of the optimal bus bridging strategy. Two types of analyses, namely clustering and classification and regression tree (CART), are used to categorize incidents of the subway network in Toronto based on two major metrics: the total user delay (TUD) and the required number of shuttle buses under an optimal bus bridging strategy. The optimization framework developed by Itani et al. ( 7 ) is adopted in this paper to determine the optimal bus bridging plan for the selected incidents. The data used for the analysis include a total of 205 unplanned disruptions affecting the subway network and where shuttle buses were deployed. An incident severity scale is then established based on the results of the analysis.
The paper proceeds with a review of the recent literature on the operational resilience of subway service under unplanned disruptions. Subsequently, the paper discusses the data and research method used to undertake the clustering and CART analyses. Results and a severity scale are then presented with policy recommendations. Finally, the paper concludes with a summary and possible research opportunities.
Literature Review
Transit system resilience has been studied by many researchers to better understand and quantify the effects of a major disruption on users, operators, and the economy. While a wide range of methods exist in the literature to analyze transport resilience, there is no specific method or a single metric to measure and analyze the resilience of a network ( 14 ). Methods from graph theory have been commonly used to analyze the connectivity in the transit and transportation network, while other studies on resilience and vulnerability have been concerned with the interaction between demand and supply, and passenger response to major disruptions ( 3 ).
Some researchers have studied the resilience of the rail network against major unplanned events, such as hurricanes and earthquakes ( 15 , 16 ). Major disruptions lasting for an extended duration (three or more weeks) were shown to have a significant impact on transit ridership ( 1 ). However, other researchers have focused on the resilience of the rail network under operational disruptions with shorter durations ( 4 , 14 , 17 , 18 ) which commonly result from mechanical failures, human emergencies, and other incidents that disrupt the daily operations. This paper is focused on the latter type, using the subway network in Toronto as a case study.
A recent study of the subway system in Toronto examines the effect of outdoor tracks and weather conditions on the recurrence of rail service disruptions while quantifying the delays at the stop level using data collected in 2013 ( 18 ). Another study utilizes graph theory to measure the resilience of the same network ( 14 ). Lastly, Diab et al. ( 17 ) used statistical analysis of subway disruption that triggered the deployment and allocation of shuttle buses. The analysis demonstrated the inefficiency of the current agency practices, highlighting the need for analytical and optimization tools to improve shuttle service operations.
Management of unplanned rail disruptions has attracted recent interest among researchers and transit operators. Shalaby et al. ( 19 ) developed a systematic review of the recent research studies that focused on managing unplanned rail disruptions. The extensive review focused on bus bridging strategies and management of supply, demand, and passenger flow during unplanned rail disruptions. Pender et al. investigated the economic viability of having a dedicated shuttle fleet for bus bridging ( 20 ). The same group also studied the effect of bus garage locations on the travel time of standby buses ( 21 ). However, another study noted that in the event of unplanned railway disruptions during peak periods it is rare to have enough standby buses and drivers ( 17 ), and therefore shuttle buses are commonly pulled from existing regular routes rather than from bus garages. Other researchers have proposed an optimal temporary shuttle bus network to connect the disrupted rail stations based on the demand between the disrupted stations. Such methods have focused on optimizing the transit assignment on a temporary network of shuttle buses (22–28). This strategy is more applicable to planned disruptions than unplanned ones since new station-bus route connections can confuse rail passengers and bus drivers.
A handful of research studies have investigated the optimal bus bridging service. One recent study proposed a genetic algorithm model that determines the optimal deployment and allocation of shuttle buses, considering the subway passenger delays and the impact on bus riders ( 7 ). The optimal number of shuttle buses is subject to bus-bay capacity constraints and the method is applied to a case study in Toronto. In this paper, the optimization framework developed by Itani et al. ( 7 ) is used to undertake the analysis.
While several studies focused on studying the operational aspects of bus bridging and optimizing the shuttle bus movement, the impacts of this strategy on network resilience are less often explored. This paper aims to fill the aforementioned gap by analyzing the resilience of the subway network in Toronto under the deployment of an optimal bus bridging plan, using methods in machine learning, like clustering and CART analysis. The next section focuses on the research methods followed to study the impacts of the optimal bus bridging practice on the resilience of the rail transit network in Toronto. The section has three main components; first, it presents the data used in the statistical analysis, it then presents the clustering results, and finally discusses the results of the CART analysis.
Methods
This section presents the methodology followed to analyze the resilience of the subway service in Toronto, under the optimal bus bridging strategy. The effect of the optimal bus bridging strategy on the operational resilience of the subway service could be studied from different views and considering several performance metrics. Figure 2 shows the different impacts of a bus bridging plan that could be used as performance measures in the analysis of subway service resilience under unplanned operational disruptions.
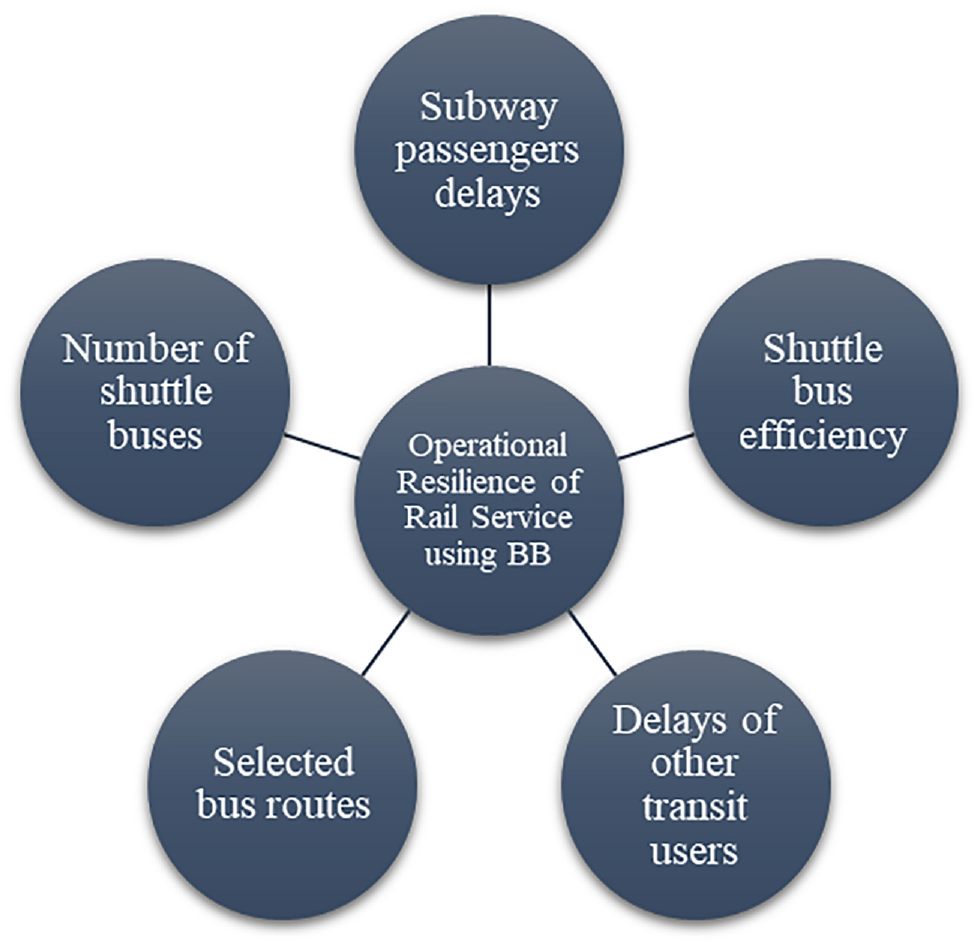
Operational resilience of rail service during unplanned disruptions.
A bus bridging plan is characterized by the required number of shuttle buses, which varies based on the incident characteristics and constrained by the capacity of streets and stations. This creates additional challenges to agencies and limits the effectiveness of the bus bridging strategy in mitigating subway passengers’ delays. The passengers’ delay is a key metric in managing unplanned disruptions and what most agencies implicitly or explicitly aim to minimize. Nevertheless, delays could be mitigated even with a limited number of buses, if dispatched and managed efficiently. The efficiency of shuttle buses is measured using the deadhead time, out-of-service time, and total out-of-service duration of shuttle buses that are pulled from in-service bus routes. Thus, identifying appropriate bus routes is critical for a good bus bridging plan; a balance between faraway routes and congested corridors should be maintained. Furthermore, some research studies looked into the equity lens of shuttle bus selection. Liu quantified the effect of bus bridging on disadvantaged neighborhoods in Toronto, observing a reduction in bus service capacity in these neighborhoods during subway disruption ( 29 ). As such, the delays experienced by other transit users, especially bus riders of routes from which shuttle buses were selected, is another key metric. Bus riders are not directly affected nor informed about the disruption, but they experience an unplanned reduction in their service frequency.
This study considers two metrics, the first being the total users’ delays, including both the subway and bus riders’ delays ( 7 ). The second metric is the total number of shuttle buses. Both metrics are part of the outcome estimated by the tool developed in Pender et al. ( 6 ) and Itani et al. ( 8 ). The estimated delays of subway passengers also consider the time needed to dissipate the queues after a disruption is over. The metrics are used to classify the disruptions using CART analysis to understand the severity of each category of incidents. Before that, the incidents are clustered based on their characteristics. This section explains, in detail, the data and methods used to run the clustering and CART analysis.
Data and Research Method
The data used in this study pertained to a series of unplanned subway disruptions that involved dispatching shuttle buses, and which occurred in 2015, 2018, and January–May of 2019 in the TTC network. The TTC operates a grid network of four subway lines, 11 streetcar lines, and 146 bus routes. The network has a substantial fleet of 1,926 buses, 249 streetcars, and 868 trains ( 30 ). Figure 1 shows the rail network. The Yellow line runs north–south and is known as Line 1. This line has two sections, the eastern segment running along Yonge Street (Line 1-Y) and the western segment along University and Spadina Avenues and is referred to as the University-Spadina segment (Line 1-U). Two lines of the subway system run east–west, the green line (Line 2), and the purple line (Line 4). The blue line (Line 3) serves the eastern suburb of Toronto and it is a medium capacity line. This section continues with a statistical analysis of the incidents’ characteristics under study. These incidents are used to generate the optimal bus bridging scenarios.
Incident Data and Disruption Characteristics
The sample of unplanned incidents during 2015 is obtained from the shuttle bus service reports from the TTC’s Route Management Department. In contrast, the sample of incidents from 2018 until May 2019 is obtained from Twitter. The TTC reports all unplanned closures on Twitter and specifically mentions if shuttle buses were dispatched or not. The same incident attributes are collected from Twitter and the TTC, indicating the incident duration, location of disruption, and the closed stations. Only incidents with a duration between 20 and 180 min each are considered in the analyses. After cleaning the data and keeping the unplanned incidents that involved dispatching shuttle buses, a total of 205 incidents are modeled. Figure 3 shows a descriptive analysis of the disruption data under study.
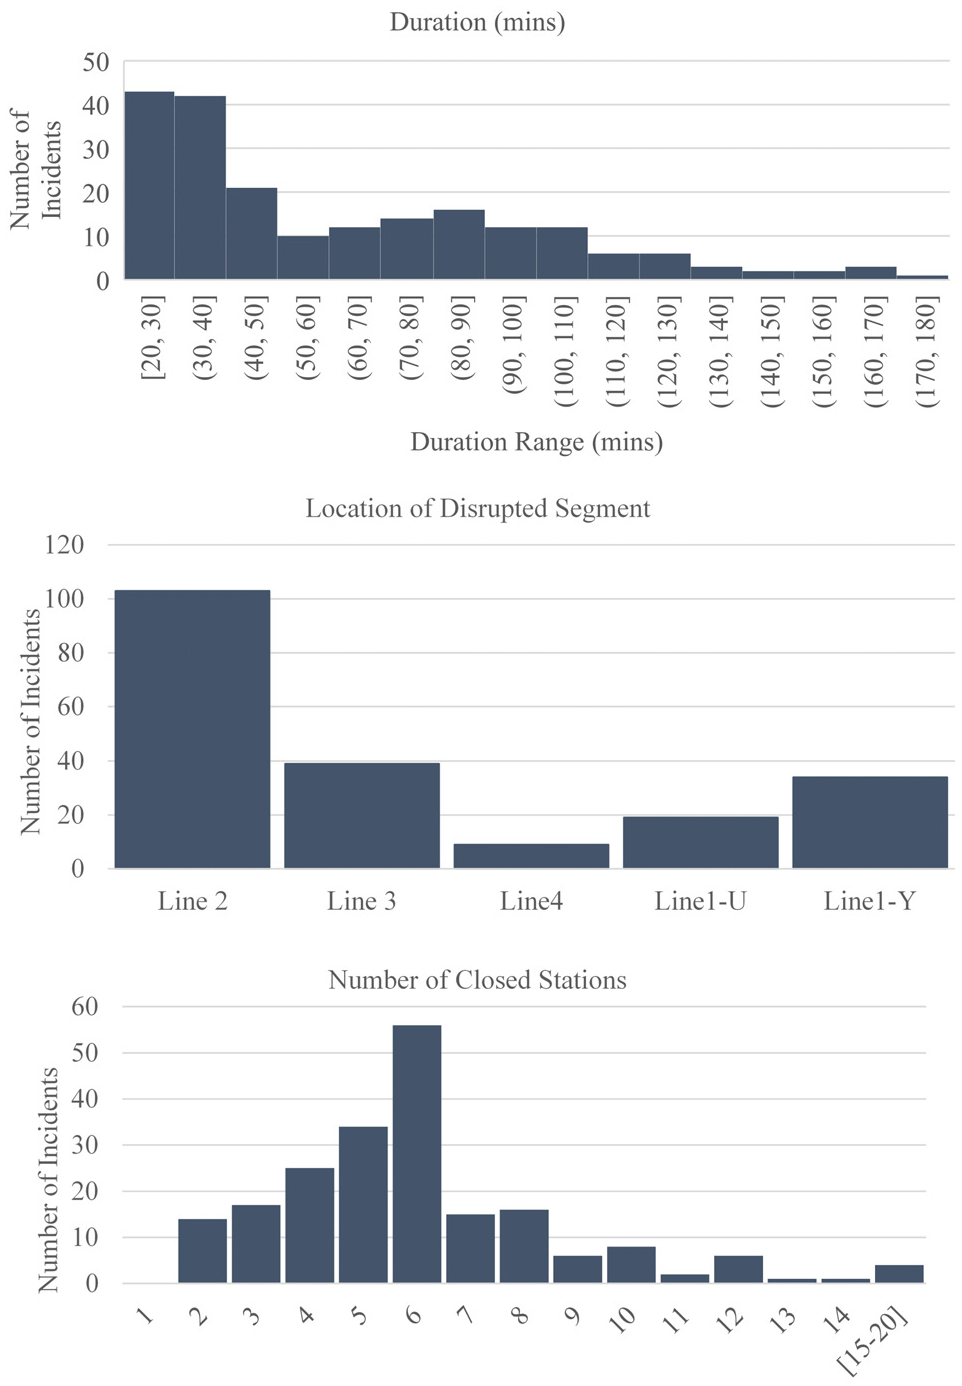
Descriptive statistics of unplanned subway disruptions under study.
The incident duration is defined as the time from when a closure is announced until the train service is resumed. The shuttle bus service reports indicate the start and end time of an incident, and additionally the TTC announces the start and end of an unplanned closure on its Twitter account. Therefore, the incident duration is easy to determine for both data samples. Most of the incidents lasted between 20 and 40 min, and very few incidents lasted for more than 140 min. The number of closed stations is affected by the design and location of the turnback tracks. Given that only incidents affecting two or more stations are considered, most disruptions involve six closed stations with few incidents closing more than 15 stations. Line 2 and Line 1 are the spines of the TTC network, but more closures occur on Line 2 since the trains running along Line 1 have been replaced with new trains (called the “Toronto Rocket”) whereas older trains are still operating along Line 2. The average passenger demand per station along the disrupted segment for each line is presented in Figure 4.
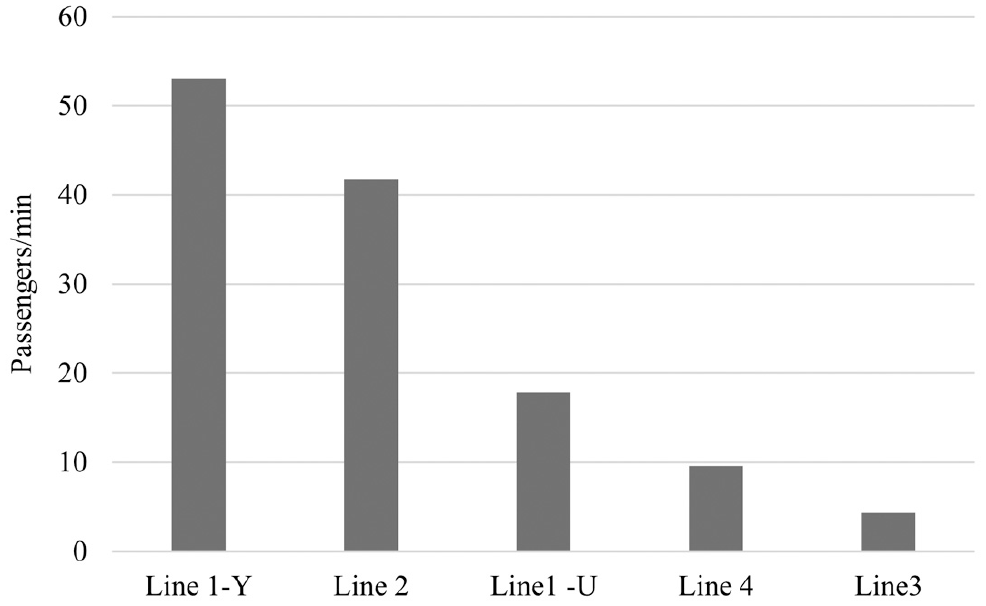
Passenger demand per disrupted station by line.
The demand is defined as the passenger flow rate (per minute) per disrupted station and is referred to henceforth as the average demand rate per affected station. The results show that there is a strong correlation between the location of the incident (the closed subway line) and the average demand per station, as depicted in Figure 4. Incidents along Line 3 involve the lowest number of passengers whereas incidents happening on Line1-Y involve higher demand levels followed by closures affecting Line 2. Note that that these two lines serve demand levels higher than their service capacity during the peak periods. As a result, three major attributes are considered in the clustering analysis, namely the incident duration, number of closed stations, and the average demand per station. Incident data is then used to run the optimal bus bridging scenarios for each of the incidents.
Optimal Bus Bridging Data
The optimal bus bridging plans for each of the incidents are obtained using the methodology and tools developed by Itani and colleagues ( 7 , 9 ). The tools use genetic algorithm and queueing analysis for the assessment and optimization of the bus bridging strategy. The optimization model requires a set of data inputs that describe the unplanned disruption, the transit demand, network characteristics, and finally the deadhead travel time. The transit data and network characteristics are simulated using the NEXUS platform ( 31 ). Figure 5 demonstrates the queueing and optimization models of the tools used to obtain the bus bridging plan and estimate the performance metrics used in this study. Although this study focuses on the transit system in Toronto, the approach could be replicated in other cities.
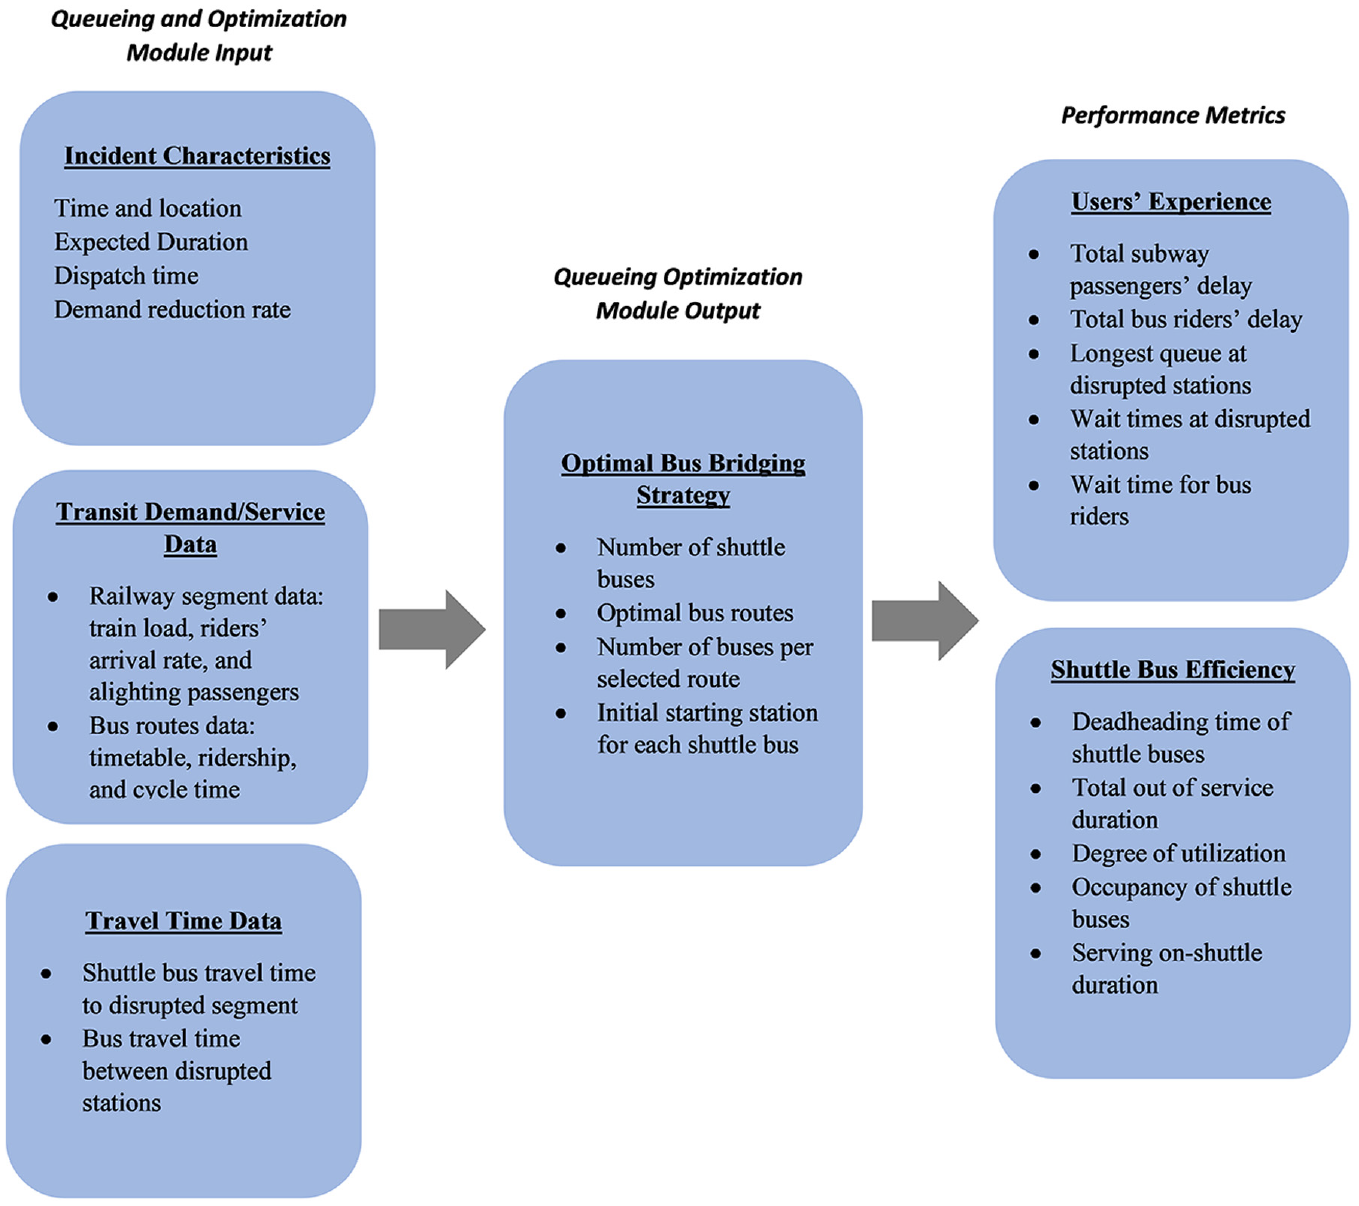
Queueing and optimization module data input and output.
The optimization model is run for all 205 incidents and the outcomes of the model are tabulated. The performance of each scenario is measured by the subway users’ delays, bus users’ delays, and the number of shuttle buses. Figure 6 shows the frequency distributions of the performance metrics of the optimal bus bridging plans.
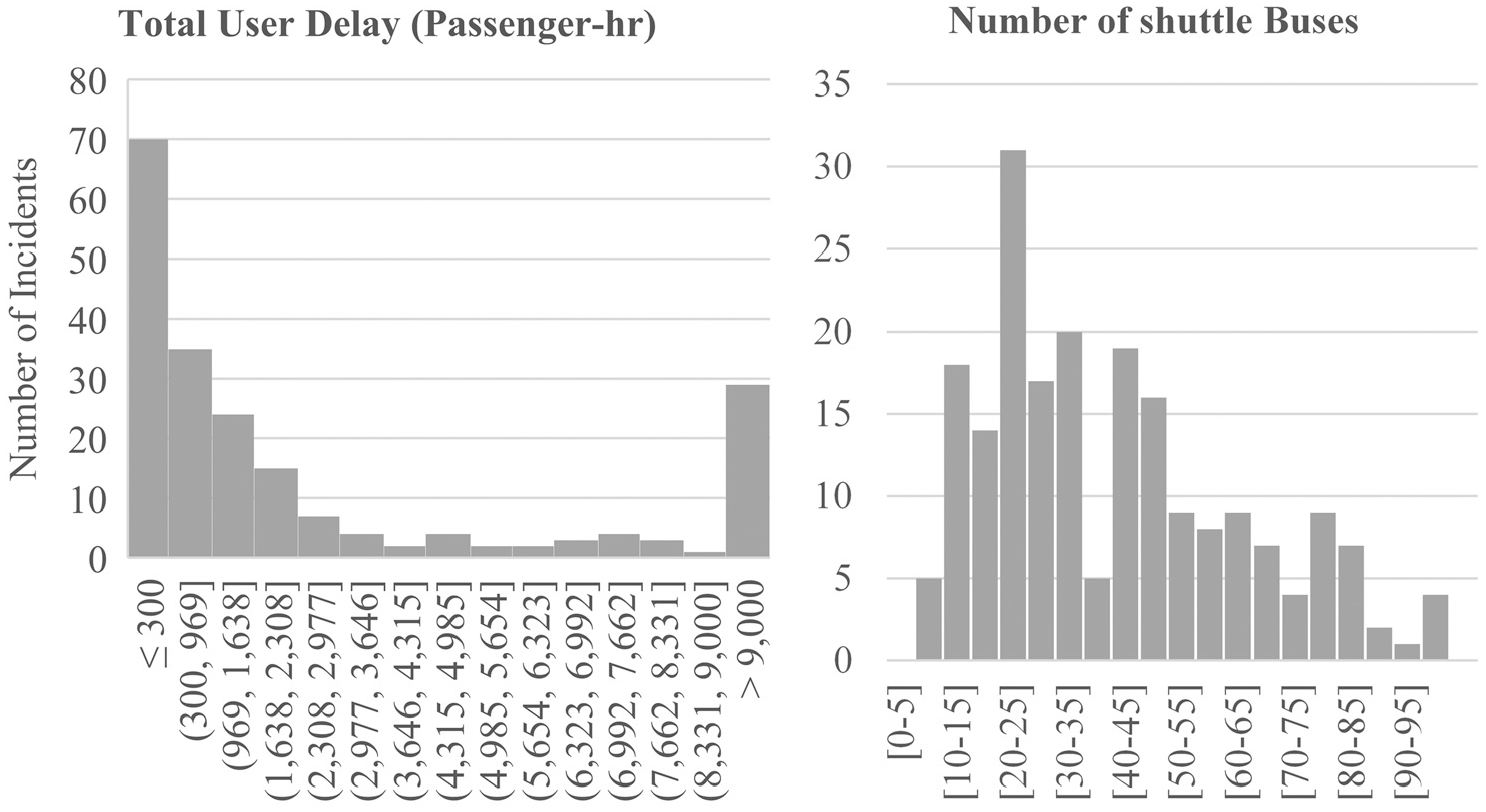
Distributions of the performance metrics of the optimal bus bridging plans.
The results show that most incidents have a TUD less than 300 passenger-hours, but many incidents have a TUD greater than 9,000 passenger-hours. Most of the incidents require 55 buses or fewer to serve stranded passengers and only seven disruptions require more than 85 shuttle buses. These results are used in the CART model, which is discussed later in this section.
K-means Clustering Analysis
To classify the incidents based on their characteristics, K-means clustering analysis is used. This is a widely applied method to create different categories based on various characteristics. In this paper, Python 3 Sklearn library is used for the clustering analysis and the CART analysis described in the next section. The clustering analysis aims to group different incidents based on key characteristics, namely (i) incident duration, (ii) number of closed stations, and (iii) demand of the disrupted stations. These attributes define the incidents and not the bus bridging plan. Five clusters are generated, as demonstrated in Figure 7 which shows a three-dimensional graph of the clusters.
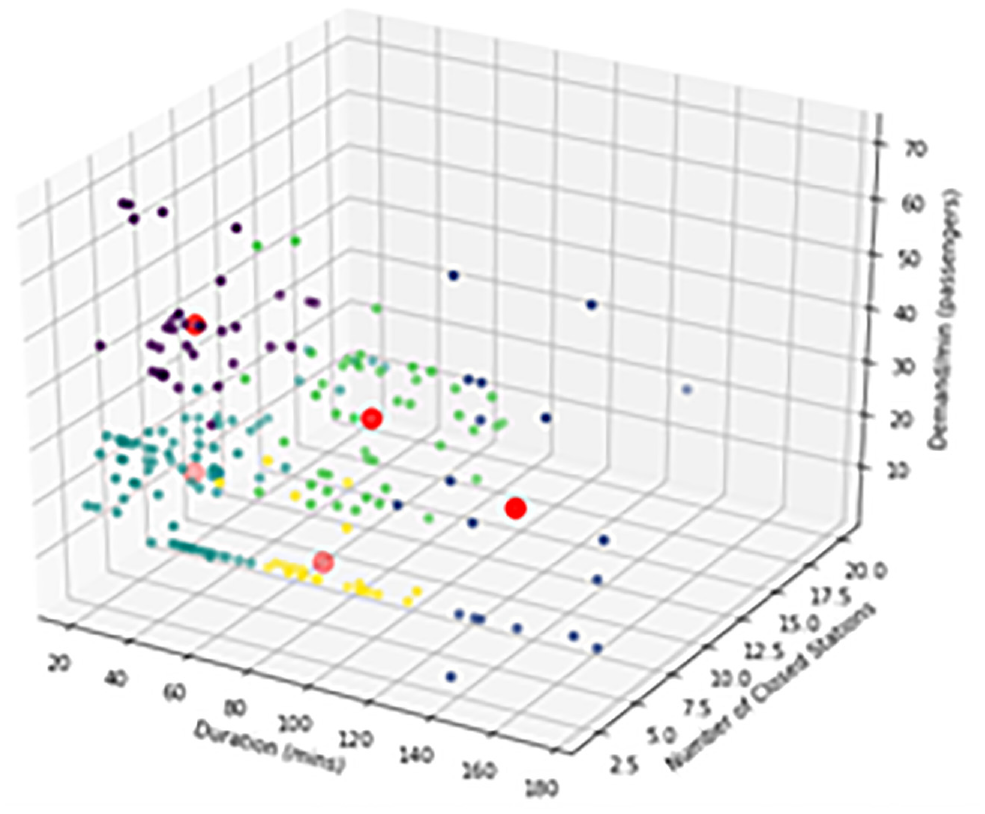
Three-dimensional graph of the generated clusters.
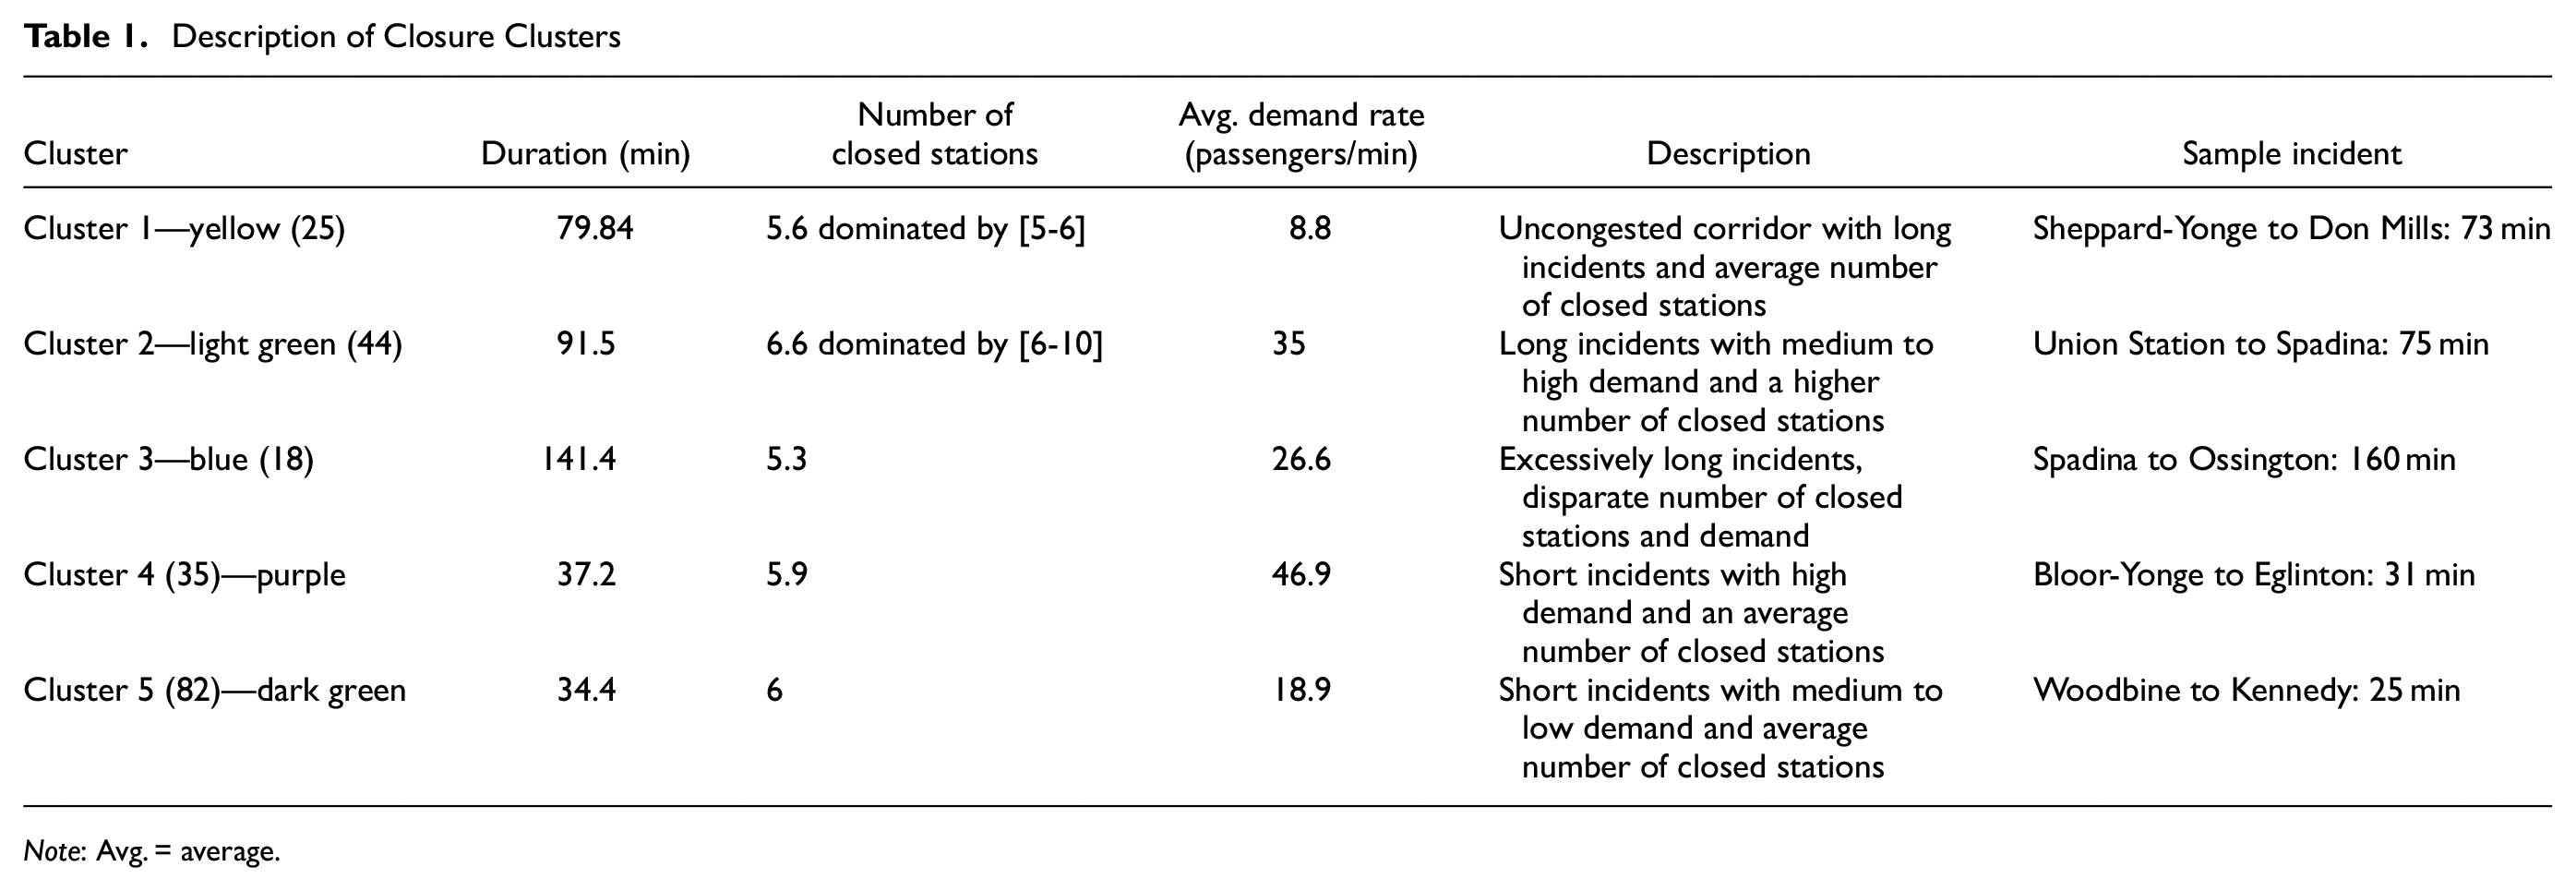
Table 1 shows the average of each of the attributes for the five cluster groups along with the description of each cluster. The numbers between parentheses show the number of closures under each cluster group and the color is identified to link the table to each of the clusters shown in Figure 7.
Description of Closure Clusters
Note: Avg. = average.
To better illustrate the clusters, sample incidents are defined in the last column of Table 1 showing a sample of unplanned disruptions obtained from the data. The same incidents presented in this table will be used later in the severity scale analysis. The incident representing the first cluster occurred along Line 4 between Sheppard-Yonge and Don Mills stations, in the northern portion of the subway system running east–west. The incident representing the second cluster occurred between Union and Spadina stations affecting Line1-U, the western side of the yellow line which runs north–south. This incident disrupted a major portion of the subway network running in downtown Toronto, which is a very busy area, especially during peak periods. The third closure between Spadina and Ossington stations disrupted the western portion of line 2, affecting a busy portion of the subway system that serves large passenger volumes from the western suburban neighborhoods to downtown Toronto in the morning peak period. Also, this incident lasted for an extensively long time, more than 2 h. The fourth incident, between Bloor and Eglinton, affected a portion of midtown Toronto along Line 1-Y, a congested corridor of the subway network connecting northern Toronto to downtown Toronto and serving many passengers coming to downtown during the morning peak period. The last incident occurred between Woodbine and Kennedy stations along the eastern end of Line 2, connecting the eastern suburbs with downtown. The following subsection explains the CART analysis and its results.
CART Analysis
CARTs are nonparametric statistical methods that identify mutually exclusive subgroups of a population that share common characteristics. These characteristics directly influence the dependent variable of interest. If the dependent variable is continuous, the regression trees are used. In this paper, two trees are generated, one using TUD, and one using the number of shuttle buses. Both variables are considered continuous variables and the regression tree is used. The independent variables are (i) duration of the disruption, (ii) average demand along the disrupted segment, and (iii) number of closed stations. An illustration of the method is shown in Figure 8.
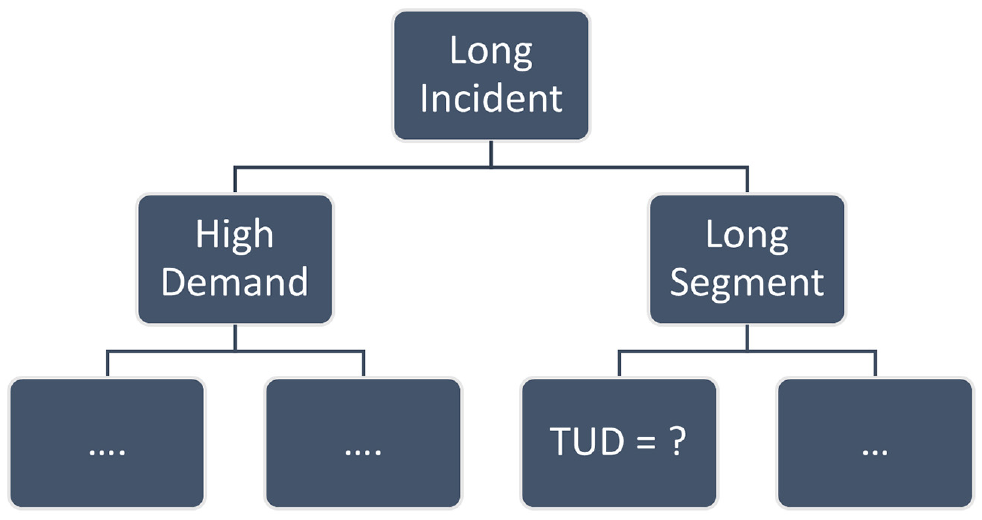
Sample illustration of classification and regression tree.
The top node of the tree is called the parent node and it includes the entire population of incidents under study. Starting from the parent node, CART fits a linear model for every possible split at that node, and estimates the mean predicted value and deviation. The model decides on the split based on the value of the independent variable that creates the most homogenous groups at the children nodes while minimizing the prediction error of the target value. The deviation from observed and predicted value presents the node impurity, computed in the form of mean square error ( 32 ). Each of the children nodes will then be branched following the same procedure while using the sub-population under the corresponding node. The procedure continues until a stopping criterion is reached. The stopping criteria used in our analysis are based on the size of a subgroup and depth. The minimum sample size was given a range between 10 and 60, whereas the maximum depth was limited to five. The leaf nodes are the final classifiers/classes including several closures having specified characteristics and showing an average estimate of the dependent variable (TUD or number of shuttle buses). The Sklearn library in Python is used and the “GridSearchCV” function is applied. This function utilizes the cross-validation method, that randomly divides the data set into N groups based on the outcome of interest; in this study, it is the TUD or number of shuttle buses. This method randomly assigns one subset for validation and builds the model using N-1 subsets, the procedure is repeated N times. Although it is an exhaustive method, it yields more accurate results for the regression trees. Figure 9 shows the first CART tree based on the optimal number of shuttle buses and the associated clusters with final subgroups (leaf nodes).
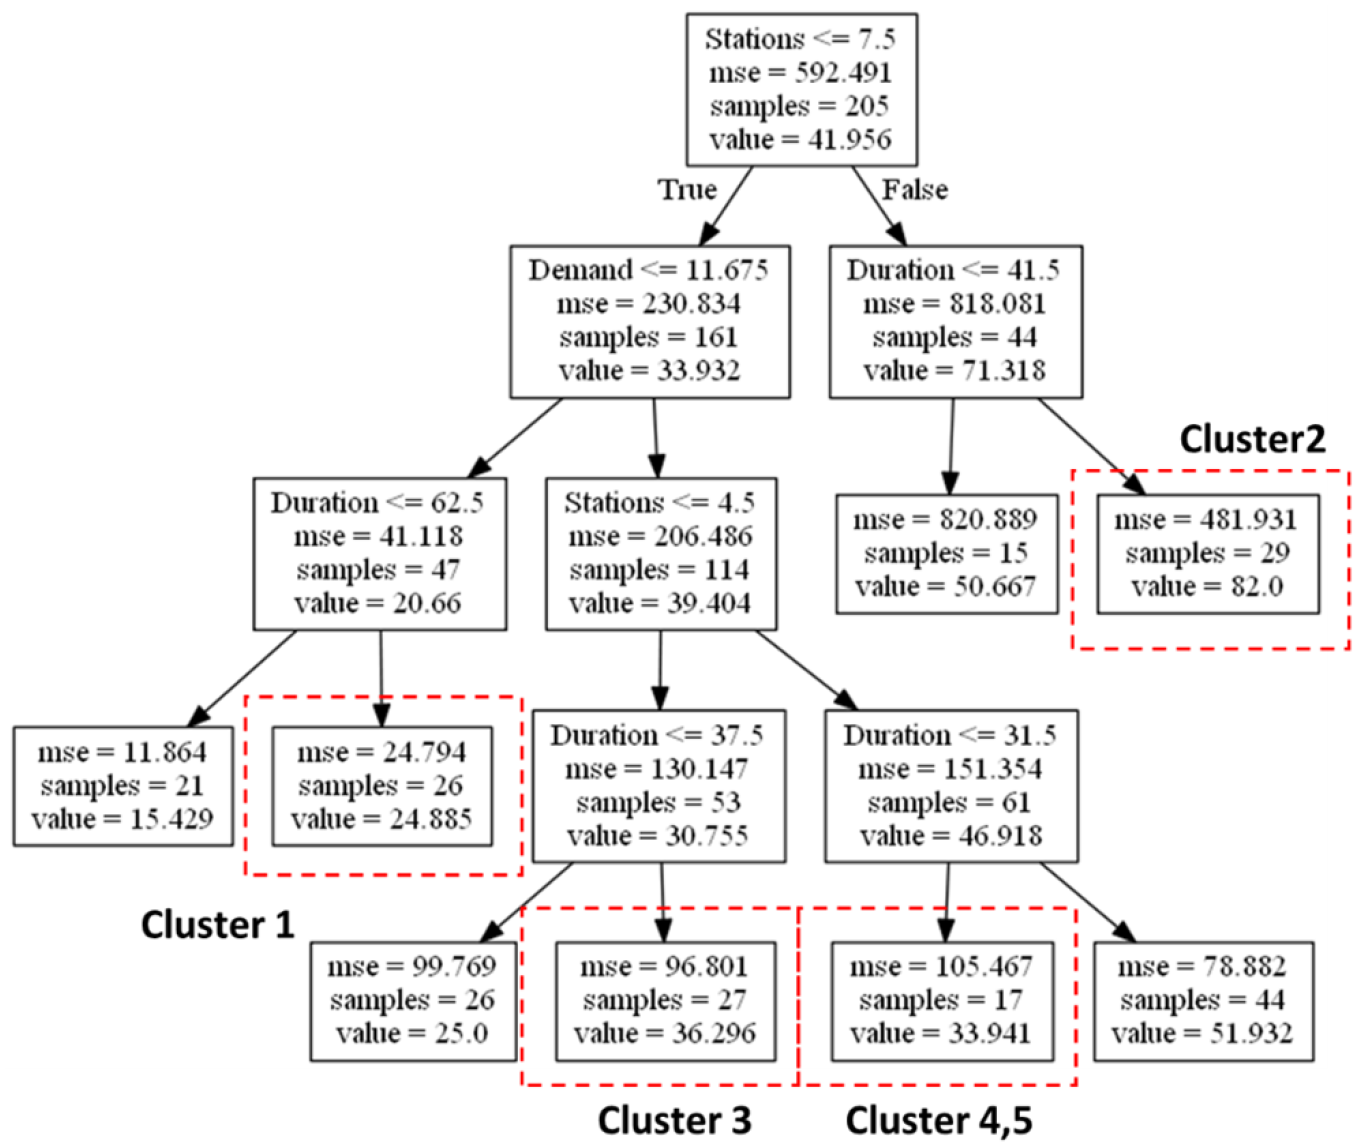
Classification and regression tree based on the number of shuttle buses.
The number of shuttle buses is a key output of the bus bridging optimization module and plays a major role in mitigating TUD. Short incidents affecting few stations and involving uncongested subway segments are expected to use fewer shuttle buses than incidents that last for a longer duration and affect highly congested segments. As the tree shows, the most significant attribute affecting the number of shuttle buses is the number of closed stations. This is expected, as one constraint on the number of shuttle buses is a function of the cycle time, which is directly proportional to the number of stations. The more the disrupted stations are, the longer the cycle time is, and thus more buses can serve. The leaf nodes in Figure 9 present the final subcategorization based on the optimal number of shuttle buses. The subgroups are then linked to the clusters, generated above, based on the characteristics of the sample incidents forming each subgroup. Incidents of Cluster 2 involve the highest number of shuttle buses (82 buses). This is because incidents under this category are highly congested, last for a relatively long duration, and involve eight or more disrupted stations. Clusters 4 and 5 represent incidents having five to seven disrupted stations, lasting for shorter than 31 min with an average number of shuttle buses equal to 34 buses. Cluster 1 shows a relatively low number of shuttle buses because this category of incidents involves very low demand (less than 12 passengers per station per minute) with seven or fewer disrupted stations, which justifies the low number of shuttle buses. Although incidents under Cluster 3 are expected to have more shuttle buses serving a disruption, given their long duration and relatively congested stations, these incidents involve seven or fewer disrupted stations, which makes those incidents sensitive to the bus-bay capacity and fewer shuttle buses are allowed to run. As a result, similar incidents are expected to have extensive delays, despite deploying a good bus bridging plan. The analysis based on the total user delay is shown in Figure 10 and the associated clusters with the final subgroups are highlighted in red.
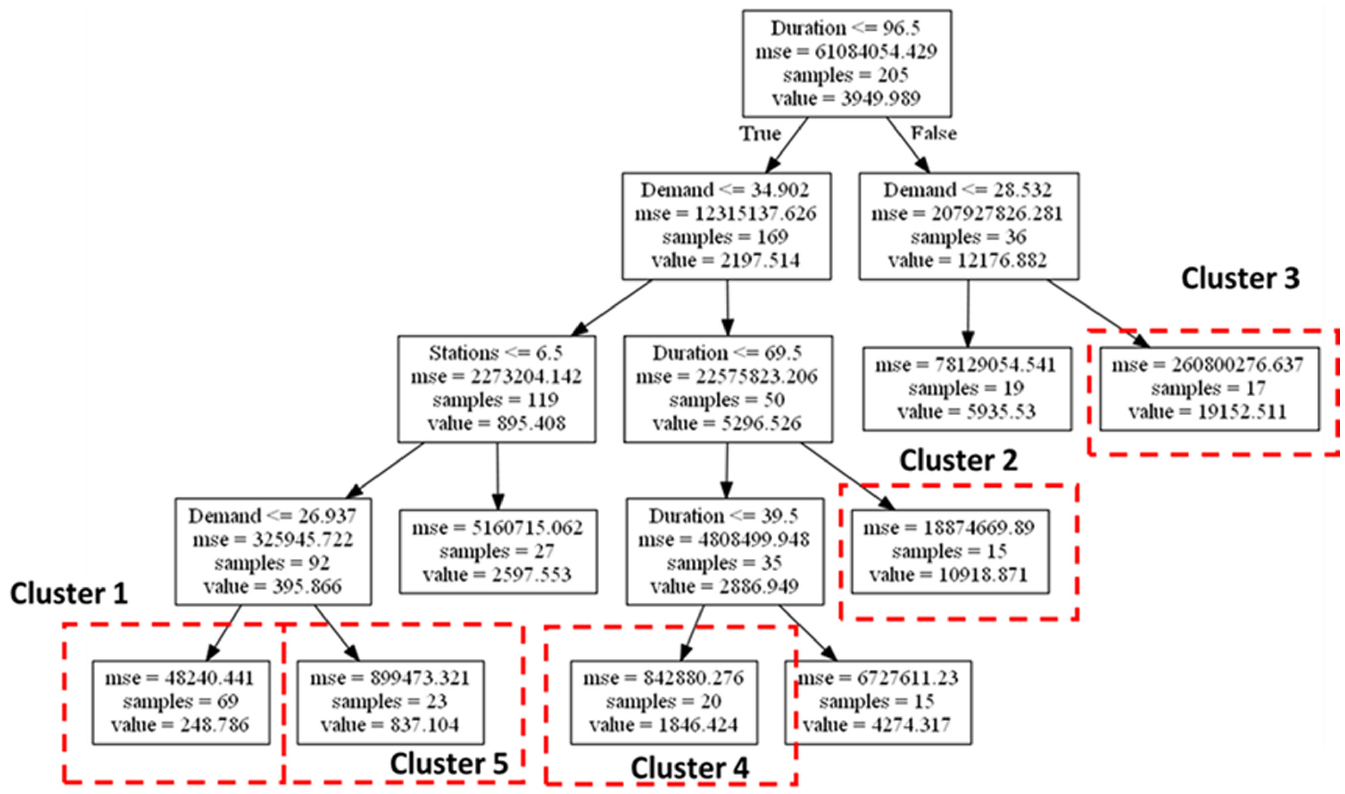
Classification and regression tree based on total user delay (TUD).
The classification based on TUD shows that the most influencing attribute is the duration of the disruption, followed by the average demand per station per minute. The leaf nodes present the final classifiers and based on the characteristics of the sample incidents forming each subgroup, and the CART categorization is linked to the clusters generated above. The results show that Cluster 3, representing very long incidents, longer than 96 mins, and affecting a demand larger than 28.5 passengers per station per minute has an average estimated TUD of 19,152 passenger-hours. Cluster 2 represents incidents lasting for a relatively long duration (between 70 and 96 min) and highly congested subway corridor having a demand of more than 35 passengers per station per minute. The average estimated TUD of these incidents is 10,918 passenger-hours. Cluster 4 represents incidents that last for less than 39 min but with a demand greater than 35 passengers per station per minute. This category demonstrates short incidents affecting a congested subway corridor, the estimated average TUD of the corresponding incidents is 1,846 passenger-hours. Clusters 1 and 5 represent the least severe cases, where the estimated average TUD of the incidents are 248 passenger-hours and 827 passenger-hours, respectively. These incidents have a shorter duration (less than 96 min) and just six or fewer stations are disrupted. Cluster 1 corresponds to incidents affecting uncongested subway segments (less than 27 passengers per station per minute), thus being the least severe category of incidents. Cluster 5 represents incidents having demand between 35 and 27 passengers per station per minute and thus it is associated with slightly congested segments. From this analysis, a severity scale is developed and used for making policy recommendations. The next section discusses both the construction of the severity scale and the policy implications.
Severity Scale and Policy Implications
In the context of the above discussion, incidents could be placed on a severity scale based on their effect on the system with regard to the total users’ delay. Figure 11 illustrates the severity scale of unplanned closures having different characteristics.
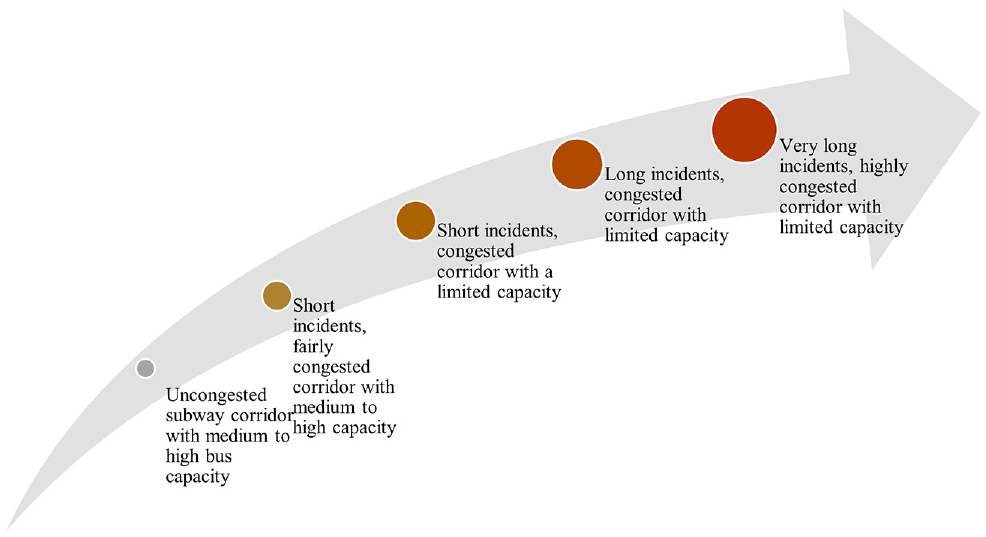
Rail disruption severity scale.
The most severe incidents are those that are limited by their bus-bay capacity but last for a very long duration and affect high demand stations, similar to those demonstrated by Cluster 3. Incidents that last for a shorter duration but affect congested corridors and have limited capacity have a medium severity; however, these incidents are most critical when the estimated disruption time is underestimated, and the incident lasts longer. The least severe disruptions are those affecting the uncongested subway corridor with medium to high capacity, regardless of the incident duration. In such incidents, as demonstrated by Cluster 1, shuttle buses can replace the train service with minimal delays.
The CART and clustering analysis made it possible to plot a severity scale based on the optimal number of shuttle buses and the TUD. The incidents along a congested subway corridor with limited bus-bay capacity would suffer the most since the optimal dispatched shuttle buses are insufficient, resulting in remarkably high user delays. But there is a hidden uncertainty associated with the inaccurate estimation of the incident duration. Unplanned disruptions display high variability in the duration of the disruption, and the risk is higher for the incidents with medium severity on the scale. The following subsection discusses the variation in the incident duration and its effect on the severity of incidents.
Time Variation and Severity Scale
This analysis examines how robust the optimal plan is to varying incident durations by comparing the optimal plans at different time estimates with the performance of the optimal plan at the average estimated duration; keeping the bus bridging plan unchanged while extending the time of the incident. For example, if an optimal plan is generated for an incident duration of 30 min, the same plan is then used to estimate the system performance if the duration is 35 min, 40 min, 45 min, and so on. These performance results are compared with those of the optimal plans for incident durations of 35 min, 40 min, 45 min, and so on.
This analysis is done using the five incidents described in Table 1, where each incident belongs to one category and is placed on the severity scale. The blue line in Figure 12 shows the TUD of the optimal plans generated using the bus bridging optimization tool developed by Itani et al. ( 7 ) at different durations, while the orange line presents the TUD of the non-optimal plan estimated using the bus bridging assessment tool presented in Aboudina et al. ( 9 ). The closure between Sheppard-Yonge and Don Mills Station (Line 4) belongs to the least severe category since the line serves an uncongested corridor. The time variation shows that the optimal plan remains valid for different incident durations. On the other hand, the closures between Woodbine-Kennedy and Bloor-Eglinton designate medium to highly congested segments; however, the optimal plan does not remain optimal if the closure lasts for longer, as shown in Figure 12. This is because as the incident extends, more buses are needed. On the other hand, highly congested subway corridors lasting for a long time, as shown in closures between Ossington and Spadina (Line 3) and Union-Spadina (Line 1-U), are less sensitive to time variations. This is because the optimal plan in these incidents tends to utilize the maximum possible number of shuttle buses, whatever the bus-bay capacity allows, and thus the optimal plans at longer durations do not benefit from more dispatched buses. Therefore, in such situations, the optimal bus bridging plan remains optimal in the most severe incidents.
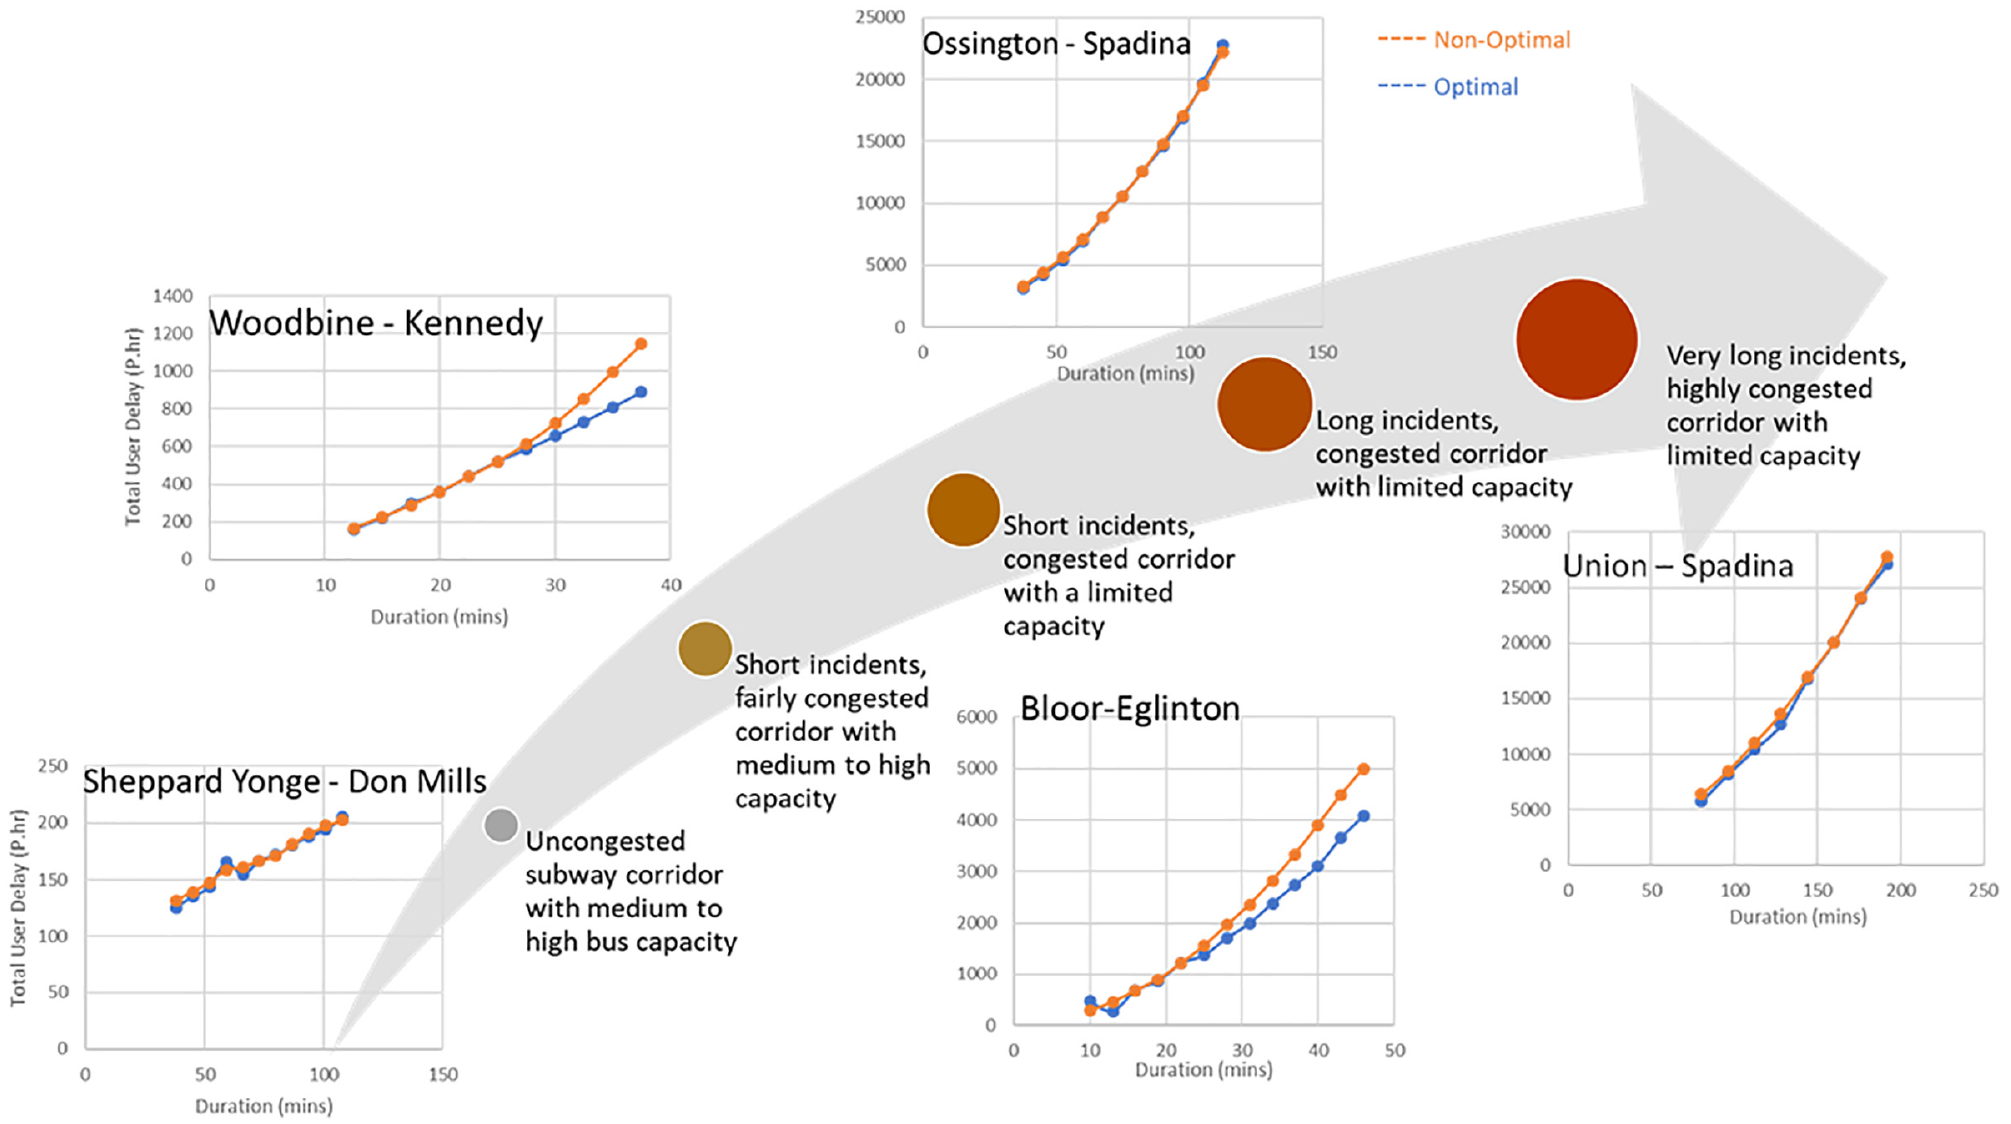
Unplanned rail severity in relation to variation of incident duration.
Conclusions and Limitations
Subway closures have a significant impact on passengers’ choice of using public transit. Transit agencies have relied on several methods to manage unplanned rail disruptions and mitigate their economic impacts. The most commonly used strategy is bus bridging. This paper studies the resilience of the rail network in Toronto, specifically the performance impacts of the optimal bus bridging plan. The number of required shuttle buses and the total user delay, experienced by affected subway passengers and bus riders’ from which shuttle buses are taken, are used to capture the effect of bus bridging on the operational resilience of the subway service. The subway disruptions are clustered into groups based on their characteristics using K-mean clustering. Using an optimal bus bridging scenario, the incidents are then categorized using CART analysis, linking the incidents’ characteristics to the performance of the bus bridging plan.
The results of the clustering and CART analysis showed that incidents are most severe when they have limited bus bay and street capacity, restricting the ability to provide sufficient shuttle buses to serve the passengers along a busy subway corridor. In such cases, other mitigation plans, such as directing buses to parallel routes and using active modes or shared mobility options, would help relieve the crowding at the disrupted segment. Another challenging aspect is imposed by the incidents that last for a relatively short duration but disrupt a busy corridor. Similarly, incidents of medium severity but with highly uncertain incident duration pose a challenge. Slight changes in the duration of these incidents can cause large impacts on the number of required shuttle buses. If too many buses are dispatched from the start and the incident has a shorter duration than expected, there will be a waste of resources. On the other hand, if the incident lasts for longer than expected, more buses are needed. There is an upper limit to the number of shuttle buses, and beyond a certain incident duration threshold the number of shuttle buses will saturate, and such incidents would be considered of higher severity. The threshold of the incident duration depends on the incident characteristics and differs from one incident to another. As such, medium severe incidents benefit from an adequate estimation of the incident duration. Operators can set pre-defined candidate bus routes, from which more shuttle buses could be pulled, to support the initial strategy when needed. Running the optimization model while extending the incident duration would help agencies to select additional candidate bus routes.
The resilience of the subway network under the bus bridging strategy, therefore, varies based on the segment and the incident characteristics. Some parts of Toronto’s subway network can swiftly mitigate the subway passenger delays by replacing the train service with enough buses. These incidents are of low severity, disrupting uncongested corridors along roads of higher capacity. In such cases, the service provided by shuttle buses can provide similar quality to the original service and passenger delays are minimized. On the other hand, in the city core, where subway segments often operate above capacity, especially during peak periods, shuttle buses are limited by the capacity of streets and stations, leading to a limited service, and resulting in extensive delays. Thus, other measures could be adopted by agencies to improve operational resiliency in the downtown core.
Future extensions to this work include classifying the bus bridging strategy based on the shuttle bus efficiency and not only the number of buses. This requires more analysis from the operator’s perspective. Other attributes such as the ridership of the selected bus routes and proximity to the incident could also be included in the classification to gain an understanding of the effect of the chosen strategy on the system, with regard not only to performance but also to the strategy itself. This could be done using joint classification including different attributes, but more data is required to draw a more generalized conclusion.
Footnotes
Acknowledgements
The authors would like to acknowledge Trapeze Group for funding support, provincial funding provided by the Ontario Centres of Excellence and Ontario Research Fund, Canadian federal funding provided by the Natural Sciences and Engineering Research Council, and SOSCIP.
Author Contributions
The authors confirm contribution to the paper as follows: study conception and design: A. Itani, A. Shalaby; data collection: A. Itani; analysis and interpretation of results: A. Itani, A. Shalaby; draft manuscript preparation: A. Itani. All authors reviewed the results and approved the final version of the manuscript.
Declaration of Conflicting Interests
The author(s) declared no potential conflicts of interest with respect to the research, authorship, and/or publication of this article.
Funding
The author(s) received the following financial support for the research, authorship, and/or publication of this article. Trapeze Group, Ontario Centres of Excellence and Ontario Research Fund, Natural Sciences and Engineering Research Council of Canada, and SOSCIP.