
Abstract
As e-commerce and urban deliveries spike, cities grapple with managing urban freight more actively. To manage urban deliveries effectively, city planners and policy makers need to better understand driver behaviors and the challenges they experience in making deliveries. In this study, we collected data on commercial vehicle (CV) driver behaviors by performing ridealongs with various logistics carriers. Ridealongs were performed in Seattle, Washington, covering a range of vehicles (cars, vans, and trucks), goods (parcels, mail, beverages, and printed materials), and customer types (residential, office, large and small retail). Observers collected qualitative observations and quantitative data on trip and dwell times, while also tracking vehicles with global positioning system devices. The results showed that, on average, urban CVs spent 80% of their daily operating time parked. The study also found that, unlike the common belief, drivers (especially those operating heavier vehicles) parked in authorized parking locations, with only less than 5% of stops occurring in the travel lane. Dwell times associated with authorized parking locations were significantly longer than those of other parking locations, and mail and heavy goods deliveries generally had longer dwell times. We also identified three main criteria CV drivers used for choosing a parking location: avoiding unsafe maneuvers, minimizing conflicts with other users of the road, and competition with other commercial drivers. The results provide estimates for trip times, dwell times, and parking choice types, as well as insights into why those decisions are made and the factors affecting driver choices.
In recent years, cities have changed their approach toward managing urban freight vehicles. Passive regulations, such as limiting delivery vehicles’ road and curb use to given time windows or areas ( 1 ), have been replaced by active management through designing policies for deploying more commercial vehicle (CV) load zones, pay-per-use load zone pricing, curb reservations, and parking information systems. The goal is to reduce the negative externalities produced by urban freight vehicles, such as noise and emissions, traffic congestion, and unauthorized parking, while guaranteeing goods flow in dense urban areas. To accomplish this goal, planners need to have an understanding of the fundamental parking decision-making process and behaviors of CV drivers.
Two main difficulties are encountered when CV driver behaviors are analyzed. First, freight movement in urban areas is a very heterogeneous phenomenon. Drivers face numerous challenges and have to adopt different travel and parking behaviors to navigate the complex urban network and perform deliveries and pick-ups. Therefore, researchers and policy makers find it harder to identify common behaviors and responses to policy actions for freight vehicles than for passenger vehicles. Second, there is a lack of available data. Most data on CV movements are collected by private carriers, who use them to make business decisions and therefore rarely release them to the public ( 2 ). Lack of data results in a lack of fundamental knowledge of the urban freight system, inhibiting policy makers’ ability to make data-driven decisions ( 3 ).
The urban freight literature discusses research that has employed various data collection techniques to study CV driver behaviors. Cherrett et al. ( 4 ) reviewed 30 UK surveys on urban delivery activity and performed empirical analyses on delivery rates, time-of-day choice, types of vehicles used to perform deliveries, and dwell time distribution, among others. The surveys reviewed were mostly establishment-based, capturing driver behaviors at specific locations and times of the day. Allen et al. ( 5 ) performed a more comprehensive investigation, reviewing different survey techniques used to study urban freight activities, including driver surveys, field observations, vehicle trip diaries, and global positioning system (GPS) traces. Driver surveys collect data on driver activities and are usually performed through in-person interviews with drivers outside their working hours or at roadside at specific locations. In-person interviews provide valuable insights into driver choices and decisions but are often limited by the locations at which the interviews occur or might not reflect actual choices because they are done outside the driver work context. Vehicle trip diaries involve drivers recording their daily activities while field observations entail observing driver activities at specific locations and establishments; neither collects insights into the challenges that drivers face during their trips and how they make certain decisions. The same limitations hold true for data collected through GPS traces. Allen et al. ( 5 ) mentioned the collection of travel diaries by surveyors traveling in vehicles with drivers performing deliveries and pick-ups as another data collection technique that could provide useful insights into how deliveries/pick-ups are performed. However, they acknowledged that collecting this type of data is cumbersome because of the difficulty of obtaining permission from carriers and the large effort needed to coordinate data collection.
This study aims to fill that gap by collecting data on driver decision-making behaviors through observations made while riding along with CV drivers. A systematic approach was taken to observe and collect data on last-mile deliveries, combining both qualitative observations and quantitative data from GPS traces. The ridealongs were performed with various delivery companies in Seattle, Washington, covering a range of vehicle types (cars, vans, and trucks), goods types (parcels, mail, beverages, and printed materials), and customer types (residential, office, large and small retail). The data collected will not only add to the existing literature by providing estimates of trip times, parking choice types, time and distance spent cruising for parking, and parking dwell times but will also provide insights into why those decisions are made and the factors affecting driver choices. The objectives of this study are to provide a better understanding of CV driver behaviors and to identify common and unique challenges they experience in performing the last mile. These findings will help city planners, policy makers, and delivery companies work together better to address those challenges and improve urban delivery efficiency.
The next section of this paper describes the relevant literature on empirical urban freight behavior studies. The following section then introduces the ridealongs performed and the data collection methods employed. Next, analysis of the data and qualitative observations from the ridealongs are described, and the results are discussed in five overarching categories: the time spent in and out of the vehicle, parking location choice, the reasons behind those choices, parking cruising time, and factors affecting dwell time.
Relevant Literature
Most scientific studies on urban parking behaviors have considered the perspective of passenger vehicles, often ignoring the different needs and behaviors of commercial freight vehicles. This section reports on relevant studies that have analyzed CV parking behaviors in urban areas, including the parking choice and factors affecting that, cruising for parking, and parking dwell times. Table 1 summarizes the relevant literature.
Studies on Freight Parking Behaviors
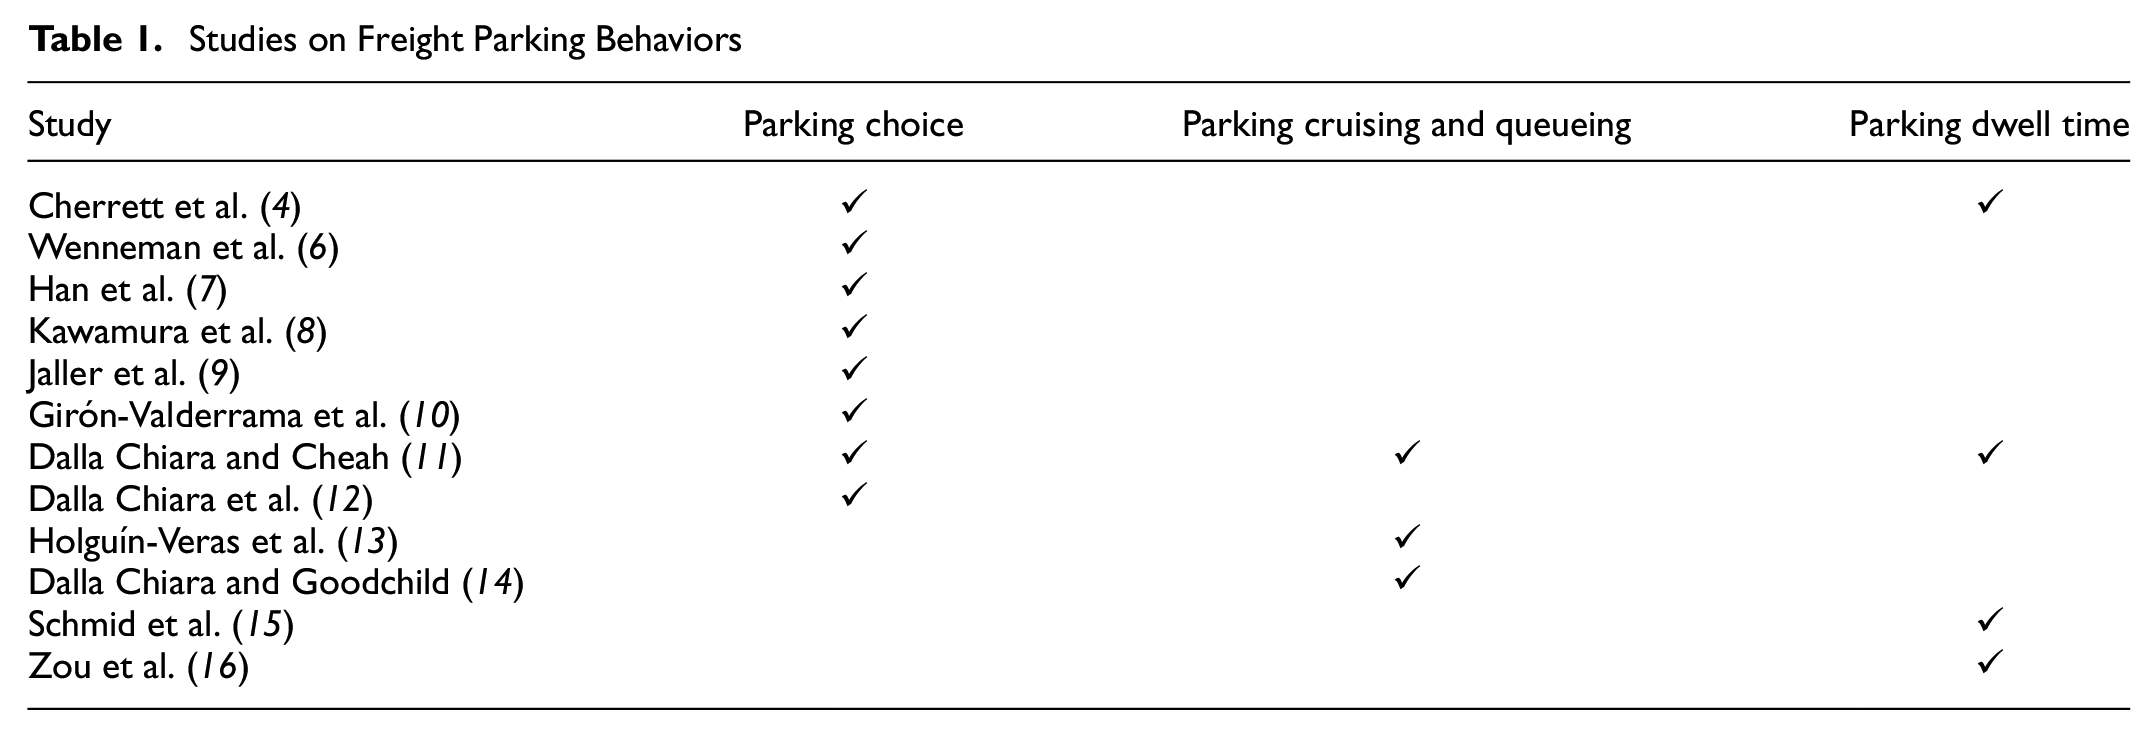
One of the most studied aspects of urban truck parking has been drivers’ attitudes toward unauthorized parking. Several papers have analyzed truck parking citation records to quantify the magnitude of unauthorized truck parking ( 6 – 8 ). Their data sets revealed that most citations were not a result of trucks stopping in the travel lane, arguably the parking behavior that causes the most negative externalities to other road users. In fact, parking in the travel lane represented only 2.8% ( 8 ) to 2.4% ( 6 ) of parking citations. Instead, most parking citations were a result of other infractions, such as expired meters or parking in curb spaces reserved for other vehicles.
While parking citation records reflect only unauthorized parking events, other papers have studied parking choice by collecting field data, recording both authorized and unauthorized parking events ( 4 , 9 , 10 ). These studies found that most parking events took place at the curb (in both authorized and unauthorized curb spaces), and only between 1.3% and 4% of observed drivers chose to park in the travel lane. Dalla Chiara and Cheah ( 11 ) recorded truck parking events by using video cameras near large shopping malls and reached a similar conclusion that most drivers (approximately 70%) chose to park in off-street parking and in the travel lane.
More recent studies have taken a disaggregated approach to study the factors affecting driver parking choice. Dalla Chiara et al. ( 12 ) estimated a random utility model of parking type choice between loading/unloading bays, unauthorized parking, and paid parking. They identified several factors that affect the type of parking choice, including the presence of helpers, vehicle type, parking congestion, and expected dwell time. Cherrett et al. ( 4 ) reviewed several field observation studies and reported that the type of vehicle and goods delivered also influence the choice between on- and off-street parking.
A well-known parking behavior of passenger vehicles is cruising for parking, defined as the action of searching for parking near a desired destination. Several studies, focusing on passenger vehicles, have estimated cruising for parking times between half a minute and 16 min ( 17 – 20 ), while Millard-Ball et al. ( 21 ) estimated an average of 32.1 m of cruising for parking distance. Only two studies have focused on the cruising for parking behavior of CVs. Holguín-Veras et al. ( 13 ) interviewed 16 drivers, who reported an average cruising for parking time of 24 min per trip. Dalla Chiara and Goodchild ( 14 ) used GPS data from a parcel delivery carrier to estimate cruising time and found a median cruising time of 2.3 min per trip. No studies have estimated cruising for parking distances for CVs.
A behavior similar to cruising for parking is queueing. The difference between the two behaviors is that whereas cruising is defined as an “invisible queue” of vehicles looking for available curb space ( 17 ), queueing happens when an off-street parking facility (e.g., a loading/unloading bay) is full and arriving vehicles have to wait in line to access the facility. Such behavior for CVs was described and quantified by Dalla Chiara and Cheah ( 11 ), who recorded CV arrivals and queueing times at loading/unloading bays of large shopping malls. They found a mean queueing time of 7.7 min for vehicles parking at the loading/unloading bays.
Several studies have analyzed the parking dwell times of CVs. Cherrett et al. ( 4 ) observed different dwell time distributions for different types of delivery vehicles, ranging from 8 min for cars to 31 min for heavy goods vehicles. Dalla Chiara and Cheah ( 11 ) found different dwell time distributions according to parking location, with a median dwell time of 7 min for vehicles parked in the travel lane and 24 min for vehicles parked off-street. Schmid et al. ( 15 ) collected field data in different neighborhoods in New York and observed mean parking dwell times of 15.7 min. Moreover, they found that vehicle type and parking choice were the most explanatory variables for the variability in dwell times. Zou et al. ( 16 ) also collected field data in different neighborhoods in New York and observed median dwell times of approximately 30 min for central Manhattan areas and 20 min for peripherical areas.
Data Collection
Ridealong Definition
To better understand CV driver behaviors, detailed data were collected through ridealongs with different logistics carriers performing deliveries and pick-ups in Seattle, Washington. Usually, a ridealong is an activity through which a driver who is new to a route is trained with an experienced driver, following and observing how they perform a delivery tour. In the current work, we conceived ridealongs as data collection tasks in which observers attended delivery tours by following a driver, starting and ending at the carrier depots. This included both in-vehicle segments, in which a vehicle moved between customers or between the first/last customer locations and the depot, and out-of-vehicle segments, in which a vehicle was parked, and the driver walked to the delivery/pick-up locations.
Scheduling and Conducting Ridealongs
The Urban Freight Lab (UFL) at the University of Washington, where the present research was conducted, is a strategic research partnership between academia, transportation agencies, and private companies working in the urban freight space. To schedule ridealongs, the research team reached out to UFL industry partners, explaining the purpose of the study and requesting a date and time when data collectors could ride along and follow one or more of their drivers during their shifts.
Each ridealong took between 3 h and 8 h. Observers met the assigned drivers at the companies’ depots, boarded the vehicles and rode along, and followed drivers in all processes performed throughout their shifts. Those included walking to the delivery destinations and entering customers’ buildings, except for when drivers accessed the back of the trucks for loading/unloading purposes because of safety concerns.
All companies already had procedures and policies in place for ridealongs, as they frequently used ridealongs to train new drivers. While it is difficult to know whether drivers changed their behaviors during a ridealong because of the observers, we note that drivers were accustomed to being followed during ridealongs (because they often trained new drivers), and their shifts were business as usual, including all challenges and difficulties they normally encountered in their day-to-day work.
Data collectors were deemed to be “observers” and were trained such that their presence would cause little to no interference or impact on driver behavior. A data collection protocol was designed and shared with observers to collect the different types of data. This is described in the following subsection.
Types of Data Collected
During a ridealong, observers collected four types of data:
GPS data;
parking data;
activity data; and
qualitative data.
GPS data were collected through a mobile application installed on an observer’s mobile phone. Observers started recording data when they entered the vehicle at the depot and stopped the recording on returning to the depot. Such data consisted of GPS latitude/longitude coordinates and a timestamp of the recording, collected every 5 s. GPS traces were also assigned to segments: a new segment was created every time an observer left the vehicle after parking, as well as every time an observer entered/re-entered the vehicle before traveling to the next destination. This segmentation was used to separate GPS coordinates recorded while the vehicle was in motion (i.e., in-vehicle segments) from those recorded while the vehicle was parked (i.e., out-of-vehicle segments).
Parking data were obtained whenever the vehicle parked by recording the parking location, the type of parking, and the time when the driver parked.
Activity data were collected manually at each stop, including:
The numbers of customer locations served;
The types of activities performed, classified as delivery, pick-ups, and others (e.g., taking a break); and
total volumes of goods handled.
Qualitative data were obtained by observing and, whenever appropriate, conversing with drivers to learn about their decision making and any challenges in the delivery process that would be otherwise difficult to obtain by collecting only quantitative data. Topics included any challenges encountered during the parking search, the choice of parking type, and the route choice.
Ridealongs Performed
Six ridealongs were performed between May 2019 and March 2020, with four different carriers (named A to D), delivering and picking up a variety of goods in Seattle, Washington. A total of 31.1 h of observations were recorded, while the carriers performed 79 stops and drove for more than 200 km. Table 2 describes each ridealong.
Description of Ridealongs Performed
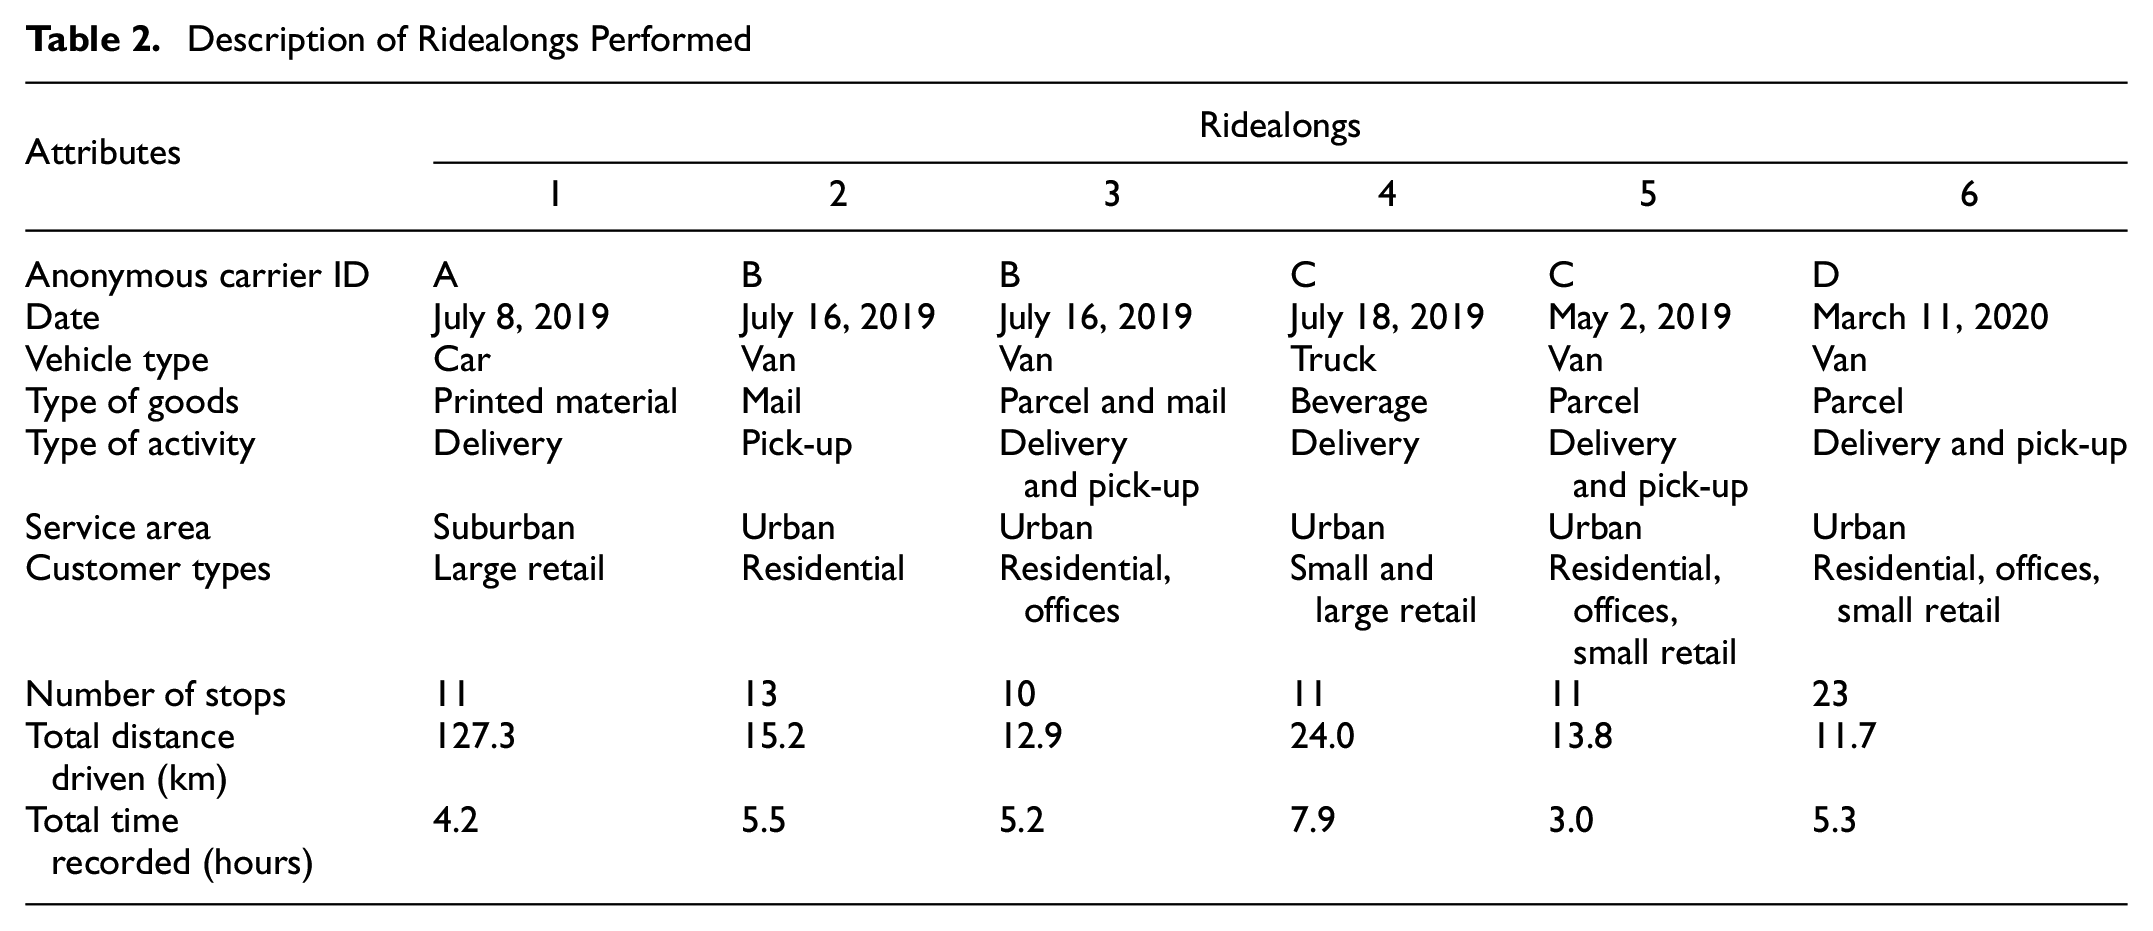
Ridealong 1 was performed with carrier A, which delivered printed materials to large retail stores located mostly in suburban areas; deliveries were performed with a car.
Ridealongs 2 and 3 were with carrier B, which performed deliveries and pick-ups of parcels and documents; deliveries were performed with a van.
Ridealong 4 was with carrier C, a beverage distributor; deliveries were performed with a box truck.
Ridealongs 5 and 6 were with carrier D, a parcel delivery company, which performed deliveries and pick-ups in downtown Seattle; deliveries were performed with a van.
Ridealong 1 was the only ridealong that served suburban areas; all the other ridealongs served customers in downtown. The total distance driven during Ridealong 1 was also much higher than all other ridealongs.
Figure 1 shows each ridealong’s service area, defined as the smallest circle that contains all delivery locations served during a ridealong. While Ridealongs 2 through 6 each served a relatively small area, Ridealong 1 (not plotted on the map) covered a much larger area and is not shown on the map.
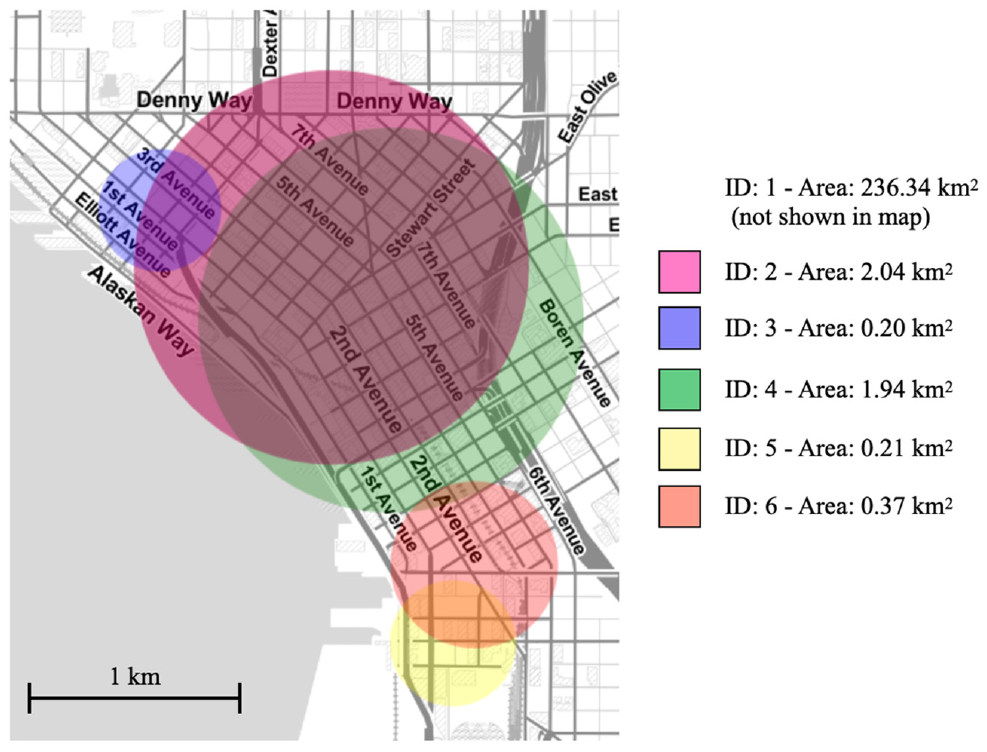
Ridealong service areas (Ridealong 1 took place in a suburban area and is not shown on the map).
Ridealong 6 was performed on March 11, 2020, just before the “Stay Home-Stay Healthy” order by the State of Washington was enacted on March 25, 2020, in response to the COVID-19 pandemic ( 22 ). Therefore, although all businesses were still open during this ridealong, traffic and parking congestion were already significantly reduced.
We would like to note that the intent of the sampling approach was to collect data from a range of delivery types to allow a qualitative description of driver behaviors; we did not mean to collect a statistically robust sample of the population of delivery drivers. The intended outcome was an identification of driver behaviors that would provide a first description of and a paradigm for classifying and understanding commercial driver parking behaviors, previously absent from the literature.
Results Analysis
How Much Time do Drivers Spend In/Out of the Vehicle?
On average, passenger vehicles are parked 95% of their lives and are only driven the other 5% ( 23 ). How about CVs? It is easily assumed that because of the tour-chain behavior of CVs, they are driven for longer times than passenger vehicles; however, to the knowledge of the authors, such estimates have not been computed. By using timestamps obtained during the ridealongs, we computed the total amount of ridealong time during which the observed CVs were parked.
Figure 2 shows the percentage of time a driver spent in/out of the vehicle during each ridealong. In-vehicle time was the time a driver spent inside the vehicle while driving. Out-of-vehicle time was the time a driver spent loading/unloading the vehicle, walking to customer locations, performing deliveries/pick-ups and other activities while the vehicle was parked. On average, drivers delivering in urban areas (Ridealongs 2–6) spent 20% of their time driving, and the vehicle was parked during the remaining 80%. The longest time spent driving in urban areas was seen in Ridealongs 2 and 4, which also covered the largest service areas. The driver in Ridealong 1, delivering to suburban areas, spent approximately 80% of the time driving and 20% delivering.
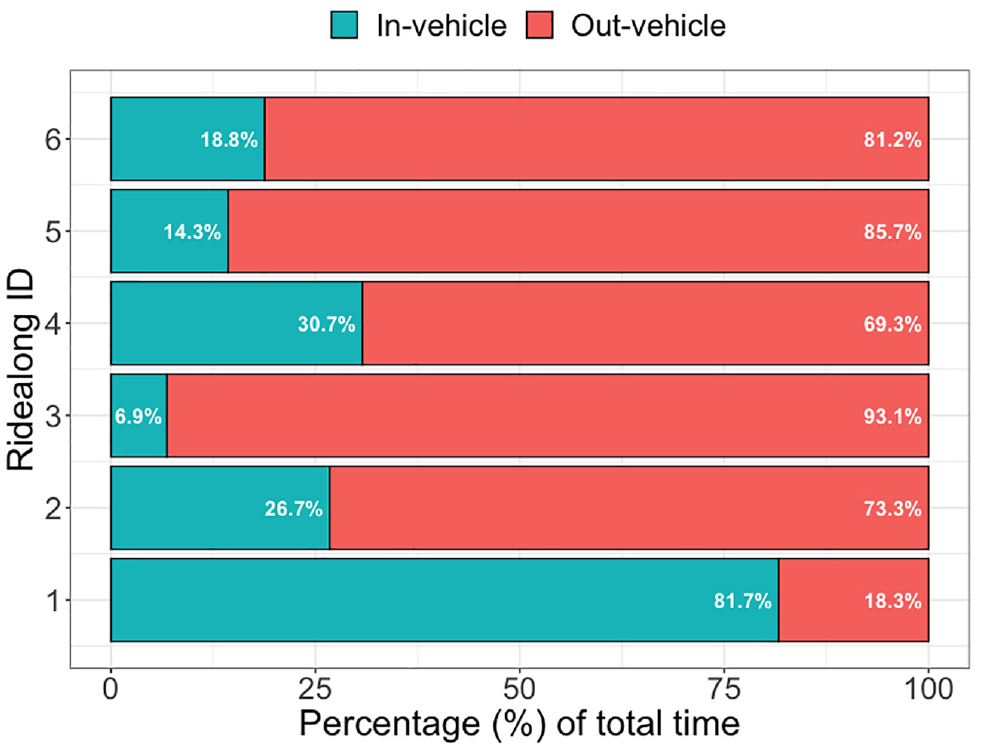
Percentage of tour time a driver spent in/out of the vehicle. Ridealongs 2 to 6 delivered to urban areas, whereas Ridealong 1 delivered to suburban areas.
Where do Commercial Vehicles Park?
In Figure 3 we classify parking space types where CVs might park into four typologies: authorized curb, unauthorized curb, travel lane, and others. About 85 km (52 mi) of curb space in downtown Seattle is allocated to vehicle parking, and approximately 11% is allocated to commercial vehicle load zones (CVLZs) ( 24 ). CVLZs can be accessed by commercial vehicles that display a parking permit, which in Seattle costs US$250 and lasts for a year ( 25 ). A maximum of 30 min per loading/unloading event is allowed. CVs can also use paid parking areas on payment via parking meters or parking mobile applications. Another curb parking type often used by CVs is the passenger load zone, which is dedicated for picking up/dropping off passengers and has a maximum parking limit of 3 min. CVLZs, paid parking, and passenger load zones are categorized as “authorized curb parking” in this paper (although this definition might not reflect the official definition found in cities’ regulations). Conversely, no-parking zones and bus zones are classified as “unauthorized curb parking.” CVs might also park in the travel lane. The final typology, “Others,” includes loading bays, garages, off-street parking lots, and alleys. Most alleys are only wide enough to accommodate a single lane, and therefore vehicles are at risk of being blocked if another vehicle is parked in the alley ( 26 ).
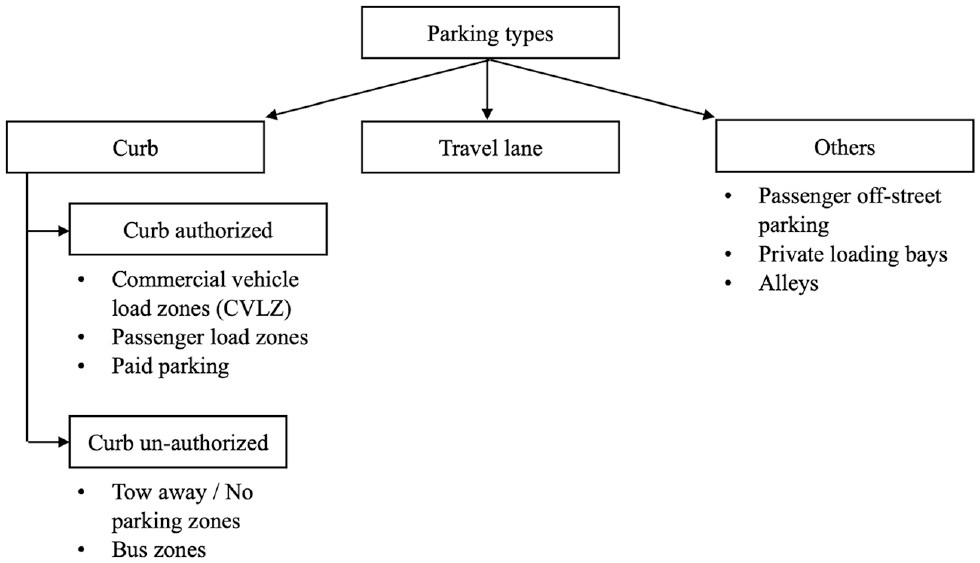
Commercial vehicle parking space typologies.
Figure 4 displays the observed driver parking choices given the parking typology described above. Most parking stops took place at the curb (approximately 74% of stops occurred in authorized or unauthorized curb spaces). More than half of all stops were recorded at authorized curb spaces, while unauthorized curb usage corresponded to 20.5% of recorded stops. Parking at private loading bays and alleys was observed 21.6% of the time. Vehicles rarely parked in the travel lane (4.5%).
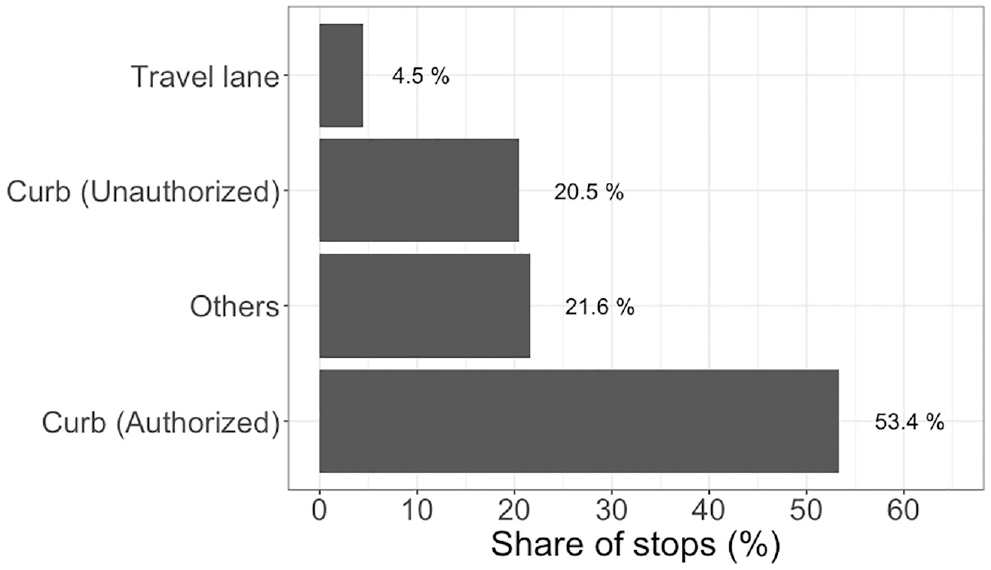
Share of parking choices for all stops during the ridealongs.
These findings are in line with previous literature ( 6 , 8–10). Previous empirical studies have observed percentages of parking events in the travel lane between 1.3% and 2.8%, with most observed parking occurring in authorized or unauthorized curb spaces.
Figure 5 displays the percentage of stops by parking type and ridealong. It can be observed that the parking behaviors significantly differed across ridealongs. Mail, parcel, and heavy goods deliveries occurred mostly in authorized curb spaces, with the exception of Ridealong 5. Car-based and parcel express deliveries, however, had a larger share of unauthorized parking. In particular, car-based deliveries were more reliant on unauthorized curb spaces and off-street parking.
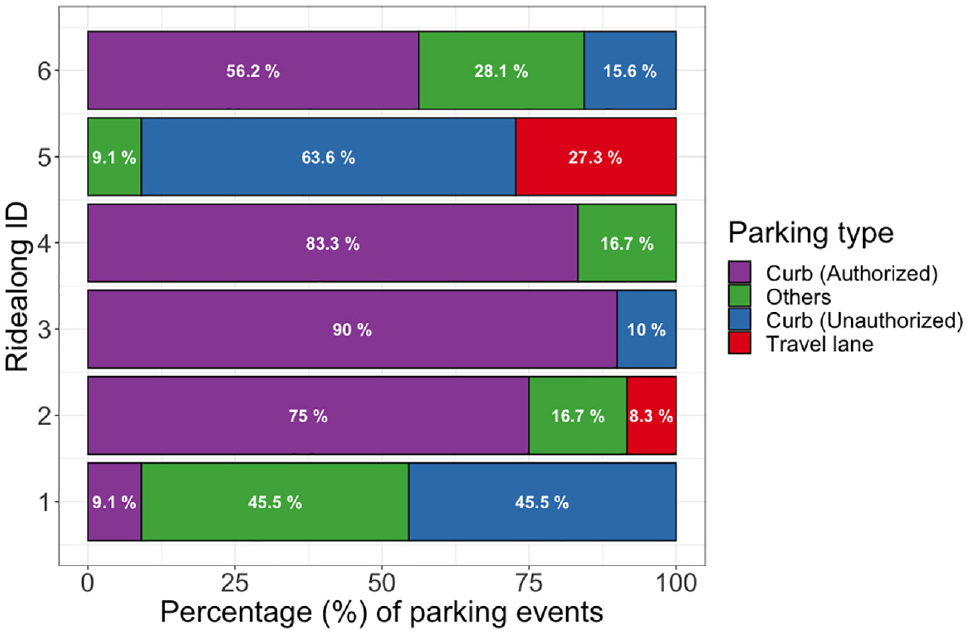
Percentage of parking type choice by ridealong ID.
Ridealongs 5 and 6 were performed by the same parcel delivery carrier but during different time periods. In particular, Ridealong 6 occurred right before the COVID-19 lockdown in Seattle. Although no statistical conclusions can be reached, as other factors might have affected the different observed distributions of parking choices, we believe that the pandemic, and its subsequent effect on urban road traffic and parking congestion, affected driver behaviors. Figure 5 shows that for Ridealong 5 (pre-lockdown) the driver never parked in authorized curb areas and preferred unauthorized curb and travel lane parking. However, in Ridealong 6 (during the lockdown) there was a clear preference for authorized curb parking. In Ridealong 6, we observed that even with less congested curbspace, the lack of curb allocated to CVLZs still forced the driver to choose alternative parking locations.
How do Drivers Choose Where to Park?
The parking choice process is a complex one that remains poorly understood by planners because of a lack of shared empirical research. Previous studies have approached the problem of identifying the factors that explain driver parking choice by using quantitative methods ( 4 , 12 ). These studies are useful for identifying potential factors that affect this decision, but they do not provide an understanding of the reasons behind those decisions. In this study we relied instead on qualitative observations collected during the ridealongs. Observers identified the following three main criteria for parking choice.
Safety. Drivers chose parking lots that were large enough to fit the vehicle plus extra space to load/unload goods. However, we observed that even when adequately large CVLZs were available, drivers often preferred parking spaces located at the end of block-faces, even if they were unauthorized. Drivers noted that the reason for this choice was safety, as the presence of other vehicles in neighboring spots would have forced the driver to back the vehicle and perform other maneuvers to enter/leave the parking lot that were considered unsafe.
Conflicts. Drivers preferred to avoid parking in locations that could generate conflicts with other drivers and curb users. This explains the low percentages of parking in travel lanes and alleys discussed in the previous section. Parking in the travel lane comes with the risk of blocking traffic and other vehicles parked at the curb. Parking in alleys is also risky, as the driver might get blocked by other vehicles, as most alleys are not wide enough to allow overtaking ( 26 ).
Coopetition. Drivers compete with each other for limited curb space in urban areas. However, such competition takes the form of a competition among experienced drivers who routinely serve the same urban area. For instance, drivers of smaller vehicles would often not occupy large CVLZs, as such space might be more suitable for larger trucks.
Do Commercial Vehicle Drivers Search for Parking?
Dalla Chiara and Goodchild ( 14 ) estimated cruising for parking times by using GPS data from a commercial carrier. However, the study considered only cruising times but not cruising distances, that is, how many extra miles were driven in search of available parking. Using Dalla Chiara and Goodchild’s methodology, both cruising times and distances were estimated in this study by using the GPS data from the observed ridealongs. Matching such estimates with qualitative information on driver behaviors shed further light on the question of whether commercial vehicles cruise for parking.
From each trip time and distance (the time and distance of each in-vehicle segment), the respective expected travel time and distance estimated with the Google Maps Distance Matrix API ( 27 ) were subtracted to obtain the so-called trip time and distance deviations. The expected travel times and distances were computed for the same trip start and end GPS coordinates, same trip start time, day of the week, and month. The resulting expected trip times and distances were estimated by taking into account historical traffic congestion levels but not parking congestion levels. Then, as done by Dalla Chiara and Goodchild ( 14 ), trip time deviations were computed as the difference between real trip times (recorded during the ridealongs) and their expected travel times (obtained by querying Google Maps). Trip distance deviations were computed as the difference between the real trip distances (recorded during the ridealongs) and their expected travel distances, which were the length of the fastest route to reach a given destination (obtained by querying Google Maps). The resulting trip time deviations were estimates of cruising for parking times, while trip distance deviations were estimates of cruising for parking distance.
The joint distribution of the resulting trip time and distance deviations is reported in Figure 6a, where each point in the graph represents the pair of trip time and distance deviations for a given trip recorded during a ridealong. The mean trip time and distance deviations are shown in the figure with dashed lines. The mean trip time deviation was 3.8 min, and the median was 1.4 min, while the mean trip distance deviation was 0.5 km (1,640 ft), and the median was 0.1 km (328 ft).
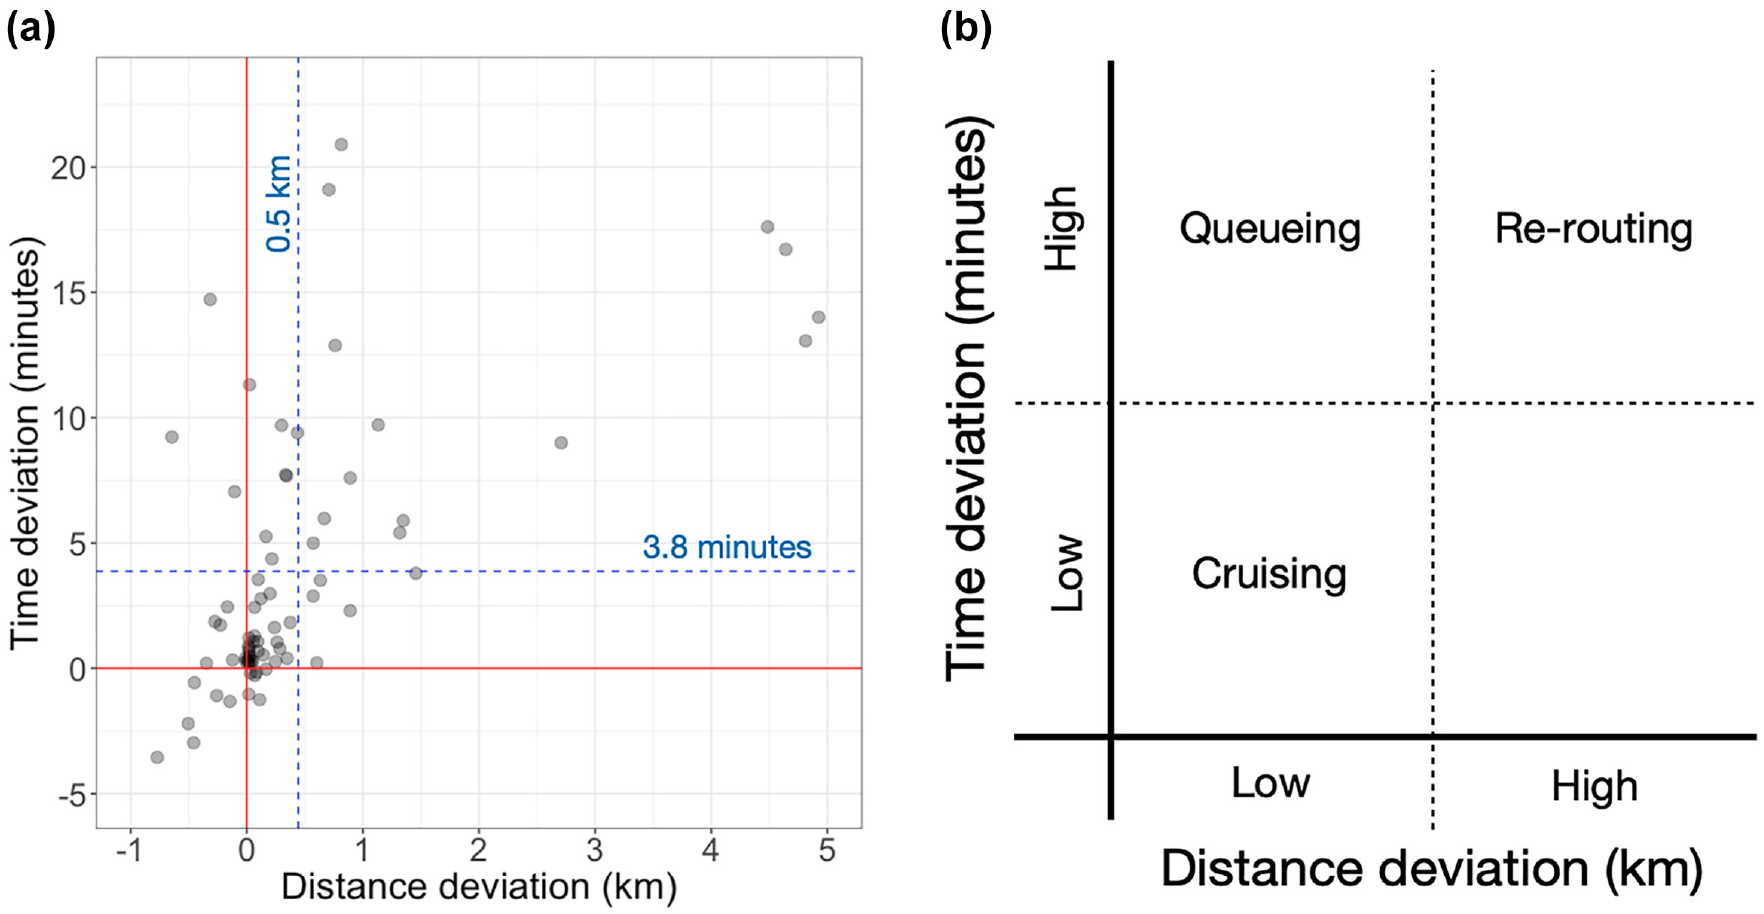
(a) Empirical joint distribution of trip time and distance deviations. The dashed lines represent the mean trip time and distance deviations; and (b) classification of identified parking behaviors.
The average per trip cruising for parking time obtained here was close to that obtained by Dalla Chiara and Goodchild ( 14 ), who estimated a median per trip cruising time of 2.3 min. To the knowledge of the authors, no other previous studies have provided an empirical estimation of cruising distance for commercial vehicles.
From the joint distribution of trip time and distance deviations, and by using the qualitative data obtained during the ridealongs, it was possible to characterize different cruising behaviors, summarized in Figure 6b. Most of the trips were characterized by deviations of between zero and the respective mean values. In those instances, the expected trip times and distances (from Google Maps) were very close to the actual trip times and distances (from the ridealongs), showing that most trips had little or no estimated cruising times and distances.
Two other clusters are identifiable. In the top-right quadrant of Figure 6a, trips are characterized by large (above mean values) trip time and distance deviations. These trips are characterized by a behavior that we refer to as “re-routing.” In the absence of available parking, instead of cruising, vehicle drivers chose to change the trip destination and travel to the next delivery destination, therefore re-routing the vehicle. In Figure 7, we plot one trip characterized by such re-routing behavior. The figure shows the GPS traces for a trip in which the driver started in the bottom-right corner of the map, traveled and searched for parking in the top-left corner of the map, and eventually re-routed the vehicle to a different delivery destination, located in the bottom-left of the map.
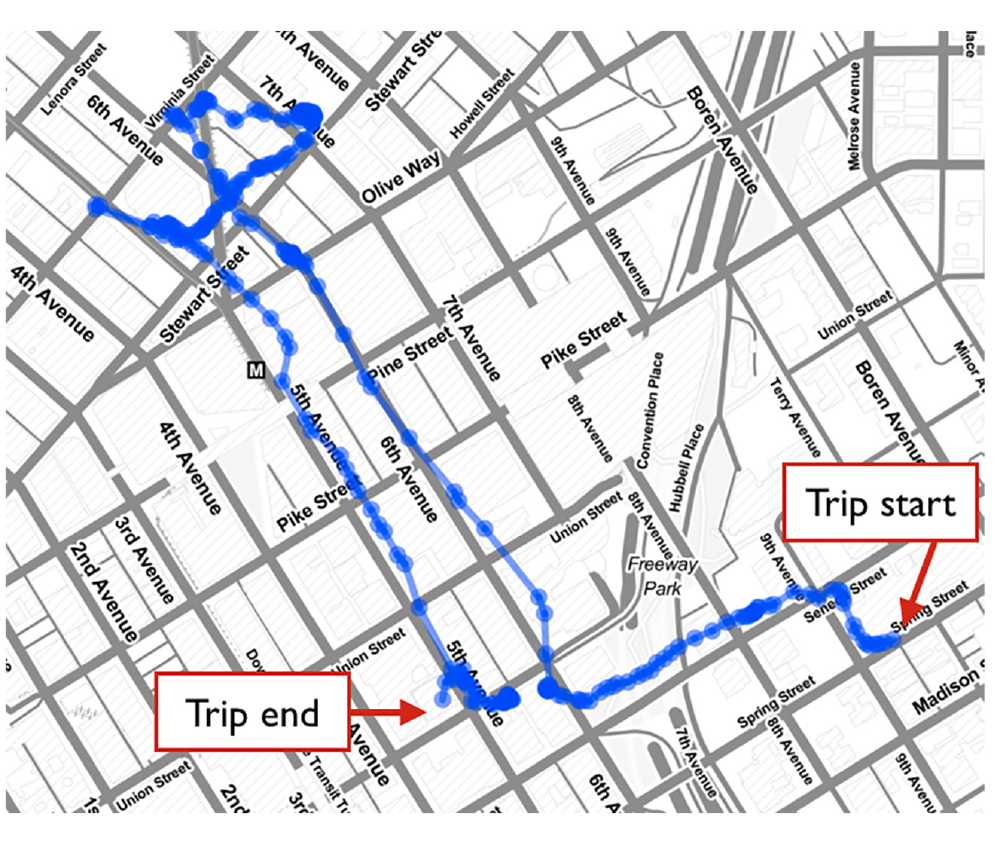
Global positioning system traces from a commercial vehicle trip showing a re-routing behavior.
The second cluster is characterized by trips with a large trip time deviation, but short trip distance deviation, therefore located in the top-left quadrant of Figure 6a. These trips are characterized by a behavior that we refer to as “queueing.” During the ridealongs some drivers were observed parking in an unauthorized curb space and waiting in the vehicle for a nearby authorized curb space to become available. Therefore, an “invisible queue” was formed, with vehicles waiting in other parking locations while another vehicle completed its operations, and then a waiting vehicle would take over that parking spot. As a consequence, the trip time deviation was long, because of the waiting, while the trip distance deviation was short, because the vehicle did not move while waiting. The trip time deviation for these trips ranged from 3.8 min to up to 20 min. Such behavior was similar to the queueing time observed for off-street loading/unloading bays by Dalla Chiara and Cheah ( 11 ), who reported that commercial vehicles waited on average 7.7 min to access off-street parking facilities.
What Affects Commercial Vehicle Parking Dwell Time?
Figure 8 displays the empirical dwell time distribution for each ridealong. Similar to what was observed for parking choice distribution, dwell times varied significantly among delivery types. The longest median dwell times were observed for mail (Ridealongs 2 and 3) and heavy goods (Ridealong 4), with values of 14, 22, and 14 min, respectively. Factors that were observed affecting longer dwell times were as follows:
mail delivery services usually served a larger number of customers from a single parking location in densely populated areas;
mail delivery services often required sorting mail into mailboxes, which took a considerable amount of time, especially in large apartment buildings;
apartment buildings required delivery personnel to sort large amounts of items and deliver them to the right recipient;
heavy goods delivery services were less flexible with regard to vehicle movements, since the vehicles used were larger and therefore usually parked farther from the delivery destination; and
recipients of heavy goods deliveries were usually businesses and generally received higher volumes of goods that needed to be loaded, which took drivers longer to load/unload, sort, and carry to the delivery destination.
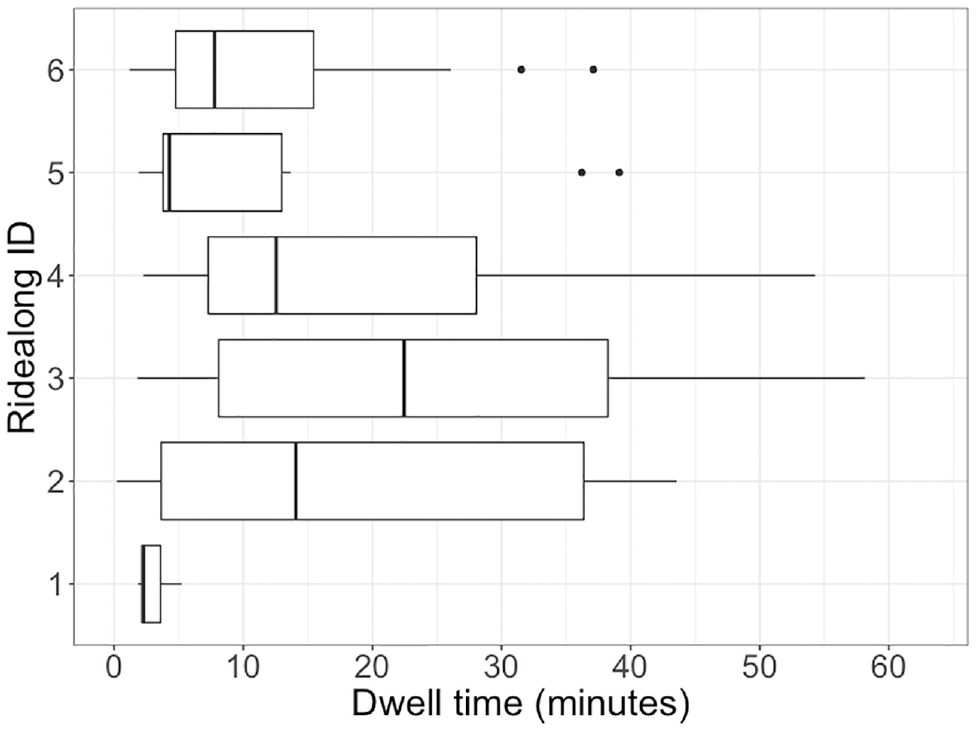
Boxplots of observed dwell time distributions per ridealong. From left to right, the vertical lines of each “box” represent the first quartile, median, and last quartile of the empirical distribution.
Conversely, pure parcel delivery services (Ridealongs 5 and 6) had shorter dwell times (median dwell times between 4 min and 7 min). Still, multiple customers were served from a single parking location, but the distance walked was shorter than the distance for Ridealongs 2 and 3.
Lastly, car-based deliveries (Ridealong 1) had the shortest dwell times (median 2 min). This is because the delivery mode was oriented to fast and low volume deliveries to a network of distribution centers for a single, large retail customer per stop. Furthermore, the easier handling and reduced space constraints of a passenger vehicle allowed more flexibility in parking choice, and the vehicle could often be parked closer to the final destination.
These results showed a larger heterogeneity of factors affecting dwell times than those identified in the literature. Previous studies ( 15 , 16 ) have associated smaller vehicles with shorter dwell times. This is partially true, as Ridealong 1 was performed in a car and had the shortest dwell time, whereas Ridealongs 2 and 3, performed in vans, had the largest dwell times—even larger than Ridealong 4, which was done in a box truck. As noted earlier, other factors associated with the type of activity also influenced the dwell time distribution, including: number of deliveries performed per parking stop, how far the driver walked to perform deliveries, and the ancillary activities needed to perform the deliveries (e.g., sorting mail).
Figure 9 shows the dwell time distribution by parking space type. The dwell times in the authorized curb spaces were significantly longer than those of alternative parking space types. Among the remaining categories, “others,” which contained off-street parking and private loading bays, showed slightly higher dwell times than unauthorized curb and travel lanes. Travel lane parking had the shortest dwell times. This was expected, as unauthorized curb parking and travel lane parking are considered more “risky” parking locations than authorized curb parking, and drivers seemed to be less willing to spend longer times there. Previous studies have found similar results, in which dwell times of vehicles that double parked were shorter than those of vehicles parked in authorized locations ( 11 , 12 , 21 ). A novel observation found here was that the dwell time distributions of unauthorized curb parking and parking in alleys and off-street locations (labeled as “others” in this study) were closer to the double-parking dwell time distribution than authorized parking.
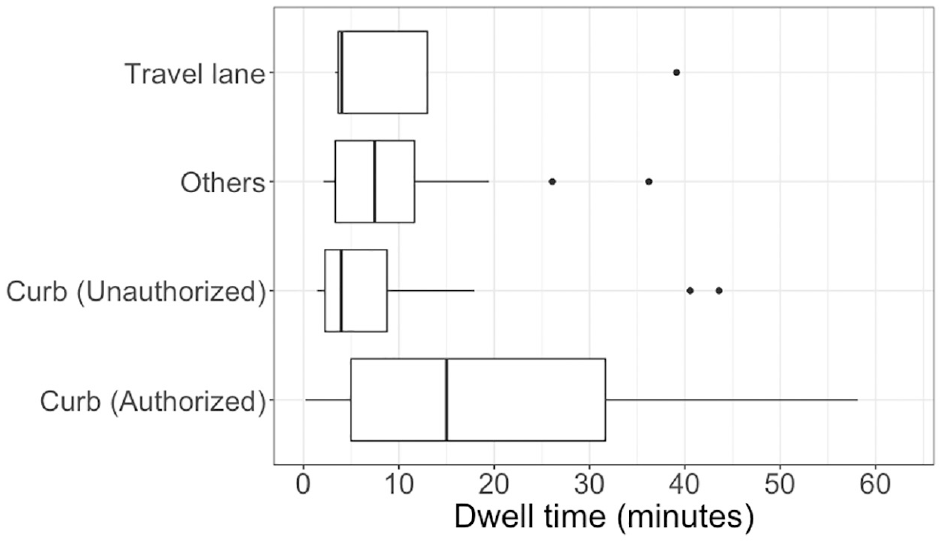
Dwell time distribution by parking type.
Summary and Conclusions
In the current study, a new data collection method was designed: observers performed ridealongs with commercial vehicle drivers, manually collecting observations and qualitative data while simultaneously obtaining GPS data for the vehicle and driver activities. Data obtained included parking dwell times and parking choices, trip times, and trip routes. The combination of qualitative information with quantitative data was fundamental for observing driver choices and simultaneously obtaining insights into how and why those choices were made.
Six ridealongs were performed with four different logistics carriers: a parcel delivery company, a parcel and mail delivery company, a beverage delivery company, and a distributor of printed materials. Observers followed commercial vehicle drivers performing deliveries and pick-ups in Seattle for a total of 31 h, driving for more than 200 km and collecting data on 79 delivery stops.
This research produced several key insights into the parking decision-making process and travel and parking behaviors. While it has been previously shown that, on average, passenger vehicles are parked 95% of the time and drive only 5% ( 23 ), to the knowledge of the authors a similar statistic has not been calculated for commercial vehicles. Intuitively, commercial vehicles are driven longer than passenger vehicles, as drivers perform trip-chain tours across multiple delivery locations. The observed urban commercial vehicles were parked on average 80% of their daily operating time, while during the remaining 20%, the vehicles were driven between delivery locations and from/to the depot. The only exception was for a suburban ridealong, in which very short deliveries were performed.
Several studies have assumed that commercial vehicle drivers mostly park in unauthorized parking locations. However, this study found, in line with other empirical studies ( 4 , 13 ), that most of the observed stops occurred at authorized parking locations, with less than 5% of the stops occurring in travel lanes. However, the parking choice distribution differed widely across different carriers, with heavier vehicles preferring authorized parking and lighter vehicles showing a greater tendency to park in unauthorized locations.
We also identified three main criteria for choosing a parking location from observations and conversations with drivers. Drivers showed preferences for parking lots that had an easy way out, such that the driver did not need to back the vehicle and perform possibly unsafe maneuvers. It was observed that, even if commercial vehicle loading zones were available, drivers preferred to park in other curb parking spots located at the end of block-faces to avoid backing the vehicle. Therefore, not only the size of the commercial vehicle loading zones and their availability, but also their location and the availability of neighboring parking spots play an important role in commercial vehicle driver parking decision making.
An analysis of trip times and distances showed that, in response to the lack of available parking, drivers took one of the following behaviors:
Unauthorized parking: Drivers parked in alternative locations that included unauthorized curb parking, travel lanes, alleys, and other off-street parking.
Cruising: Drivers searched for available parking; given the observed data, the estimated average cruising for parking time was 3.8 min.
Queueing: Drivers parked and waited in the vehicle while a desired parking spot became available.
Re-routing: Drivers changed their delivery destination en route, postponing the parking choice to serve a given location at a later time.
Finally, parking dwell times varied both by delivery type and parking type. Mail deliveries and heavy goods deliveries had longer dwell times; the former because of the larger number of delivery customers served per stop, and the latter because of the bulkier goods transported. The dwell times associated with authorized curb parking were also significantly longer than those of other parking types.
Although, because of the nature of the data collection through ridealongs and our relatively small sample size, it is not possible to extend the findings to the whole population of urban freight vehicles, this study represents an important first step in identifying and analyzing a wide range of parking behaviors, which could be further investigated through automatic and larger data collections (e.g., using GPS traces). However, as shown in this study, it is necessary to match detailed quantitative data with qualitative observations to gain a better understanding of the heterogeneity and variety of urban freight parking behaviors.
Footnotes
Acknowledgements
We would like to thank the management of the delivery carriers for allowing us to collect the data for this study and the delivery drivers who took part in the study.
Author Contributions
The authors confirm contribution to the paper as follows: study conception and design: G. Dalla Chiara, A. Goodchild; data collection: G. Dalla Chiara, F. Krutein; analysis and interpretation of results: G. Dalla Chiara, F. Krutein, A. Ranjbari, A. Goodchild; draft manuscript preparation: G. Dalla Chiara, F. Krutein, A. Ranjbari, A. Goodchild. All authors reviewed the results and approved the final version of the manuscript.
Declaration of Conflicting Interests
The author(s) declared no potential conflicts of interest with respect to the research, authorship, and/or publication of this article.
Funding
The author(s) disclosed receipt of the following financial support for the research, authorship, and/or publication of this article: This material is based on work supported by the U.S. Department of Energy’s Office of Energy Efficiency and Renewable Energy (EERE) under the Award Number DE-EE0008462.
The views expressed here do not necessarily represent the views of the U.S. Department of Energy or the United States Government.