
Abstract
In the Netherlands, more than 80% of the highways are surfaced by porous asphalt (PA) mixes. The benefits of using PA mixes include, among others, the reduction of noise and the improvement of skid resistance. However, pavements with PA mixes are known to have a shorter lifetime and higher maintenance costs as compared with traditional dense asphalt mixes. Raveling is one of the most prominent distresses that occur on PA mix pavements. To analyze the raveling distress of a PA mix pavement, the stress and strain fields at the component level are required. Computational models based on finite element methods (FEM), discrete element methods (DEM), or both, can be used to compute local stress and strain fields. However, they require the development of large FEM meshes and large-scale computational facilities. As an alternative, the homogenization technique provides a way to calculate the stress and strain fields at the component level without the need for much computation power. This study aims to propose a new approach to analyze the raveling distress of a PA mix pavement by using the homogenization technique. To demonstrate the application of the proposed approach, a real field-like example was presented. In the real field-like example, the Mori–Tanaka model was used as a homogenization technique. The commonly available pavement analysis tool 3D-MOVE was used to compute the response of the analyzed pavement. In general, it was concluded that the homogenization technique could be a reliable and effective way to analyze the raveling distress of a PA mix pavement.
Porous asphalt (PA) mixture (air voids content >20%) is often used as a wearing course as it has several advantages. In the Netherlands, more than 80% of the highways are surfaced by PA mixes, primarily because of its noise-reducing capabilities ( 1 ). PA mixes also offer other benefits such as the improvement of skid resistance, the reduction of hydroplaning risks, and the reduction in splashing and spraying during wet weather driving ( 2 ). However, it has been widely reported that the short lifetime and the high maintenance costs are great challenges for PA mixes ( 3 ). The average service life of PA mixes is estimated to be around 10–12 years, which is shorter as compared with the traditional dense asphalt mixes that have a service life expectancy of 18 years ( 4 ).
The reduction of a PA mix’s lifetime is often associated with its susceptibility to raveling, which is defined as the loss of individual aggregates as a result of abrasion caused by traffic load, weather conditions, or both ( 4 ). After the initial raveling, the damage can progress rapidly. Ultimately, raveling can lead to the formation of potholes, which can significantly reduce the driving safety of the road ( 5 ).
To reduce the probability of raveling, experimental methods have been developed to characterize the susceptibility of a given PA mix to raveling. The commonly used tests include, among others, the Rotating Surface Abrasion Test ( 6 ), Achener Raveling Tester ( 7 ), and Skid Resistance & Smart Raveling-Interface Testing Device ( 8 ). In these tests, the movement of wheels generates shear forces which introduce the loss of the stones from the surface of the specimen. The raveling resistance is indicated by the loss of the specimen’s mass. Although these tests provide a quick and simple way to compare the raveling resistance of PA mixes, they do not give any fundamental insight into the physical mechanisms related to raveling.
In recent studies, researchers pointed out that raveling can be considered as a type of fatigue failure that occurs within the stone-on-stone contact regions ( 4 ). In the microscale, two types of damage modes can occur: cohesive damage and adhesive damage ( 4 ). Cohesive damage is the failure of the mortar bridges that bond two particles, whereas adhesive damage is the failure of the mortar–aggregate interface, see Figure 1. Based on this raveling mechanism, the problem of analyzing the raveling distress of a PA mix pavement can be converted to the problem of analyzing the fatigue characteristics of the mortar and the mortar–aggregate interface. The susceptibility of the given mix to raveling can be assessed on the basis of the information about the predominant damage mode and the number of tire passages required to cause this damage (fatigue life).
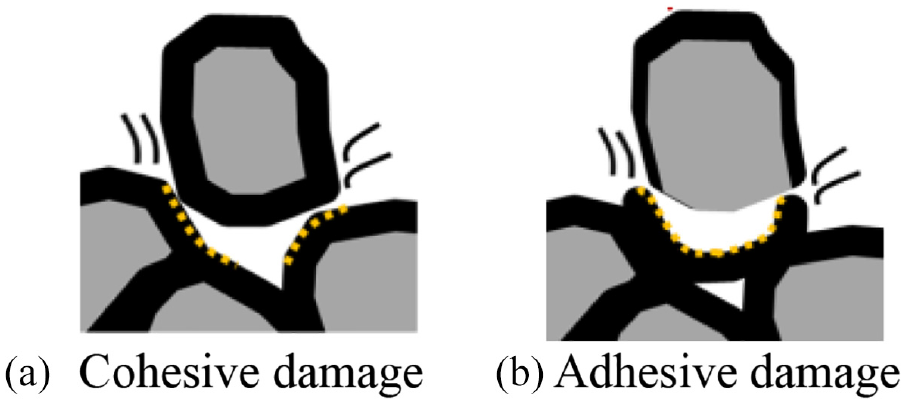
Two damage modes of raveling distress.
It is known that the fatigue life of a material can be assessed only when a certain level of stress/strain is given. Therefore, to analyze the fatigue characteristics of the mortar and the mortar–aggregate interface of a PA mix, it is required to understand the component level to capture the local stress/strain field of each phase. Currently, the most commonly used method to obtain the local stress and strain fields at the component level is the computational technique based on finite element methods (FEM), discrete element methods (DEM), or both ( 9 – 13 ). In these models, a PA mix is modeled as a heterogeneous material with different phases (mortar/mastic, aggregates, and air voids), and each phase is composed of a huge number of FEM/DEM elements. Although FEM/DEM-based models can handle complex compositions and almost realistic mix components, the modeling of different phases requires large FEM meshes (usually done by computed tomography scans) and very large-scale computational facilities ( 12 ). Such extensive computational tools and facilities are not typically available in engineering practices.
As an alternative, the homogenization technique can be used to obtain the stress and strain field of each phase without the need for much computation power. Essentially, the homogenization technique provides a way to derive a relationship between the effective properties of a heterogeneous material in the macroscale and the properties of its individual phases in the microscale ( 14 ). Generally, the homogenization technique can be used in two different ways:
In a forward way, the properties of each phase in the microscale can be transferred into the macroscale to obtain the effective modulus of a composite. Research endeavors using the homogenization technique in a forward way are not new in the pavement community. Homogenization models, such as Christensen’s model ( 15 , 16 ) and micromechanical models based on Eshelby’s solution ( 17 ) (i.e., the dilute model [ 17 ], the Mori–Tanaka [MT] model [ 18 ], the self-consistent [SC] model [ 19 ], the generalized self-consistent [GSC] model [ 20 ], the differential model [ 21 ], etc.) have been widely used to predict the mechanical properties of asphaltic composites ( 22 – 25 ). The advantage of using homogenization models is that it eliminates (reduces) the need of conducting time-consuming laboratory tests whenever (1) it is required to alter the mix design; (2) a mix design is prepared using new materials; (3) it is impossible to obtain samples for testing; and (4) testing facilities are not available in the laboratory. Besides, micromechanical modeling helps understand the fundamental mechanisms behind the mechanical behavior of asphalt mixtures.
In an inverse way, the stress and strain of the composite in the macroscale can be transferred back to the microscale to obtain the local stress and strain of each phase. Although many researchers have realized the advantage of using the homogenization technique in a forward way, little attention has been paid on the benefits of using this technique in an inverse way. As highlighted above, analyzing the local stress/strain directly at the component level requires very powerful computational facilities. On the contrary, using the homogenization technique in an inverse way, the local stress/strain of each phase can be obtained from the stress/strain of the mix. As the stress/strain of the mix can be analyzed in the macroscale by considering the mix as a homogenized material, much less computational power is required.
Taking advantage of the homogenization technique, this study aims to propose a new approach to analyze the raveling distress of a PA mix pavement. The application of the proposed framework is demonstrated with a real field-like example. The scope of this study includes:
introducing the general procedure to analyze the raveling distress of a PA mix pavement using the homogenization technique;
elaborating on how each step of the general procedure is implemented in the real field-like example;
discussing the information relating to raveling distress that can be obtained from the proposed approach.
Background Knowledge
Homogenization Theory
Homogenization theory was developed to relate the effective properties of a mix to the properties of its individual phases (
26
). The relationships between the average stress <


In Equations 1–2,

where

with
Based on the values of <

To calculate

where
By substituting Equations 4–6 into Equation 1, the value of

Once the value of
Mori–Tanaka Model
In this study, the MT model was used to homogenize the PA mix. This model was preferred over other models according to the findings of the previous research work by the authors ( 27 ), in which different models were compared for predicting the modulus of PA mixes on the basis of the properties of mastic, aggregates, and air voids. It was found that the predicted moduli using the SC model did not show frequency dependency, and these values were much higher than the experimental results. When the GSC model, which was developed for a two-phase composite, was used to predict the modulus of a PA mix consisting of three phases, the predicted results were sensitive to the order of adding the inclusions.
The differential model (or the differential scheme) performed better than all the other models. However, as the concept of this model is to add inclusions into the matrix step by step, it is difficult to find a logical method to calculate the stress and strain of each phase by using this model in an inverse way. Therefore, the MT model, which provided better predictions and can be used in an inverse way to compute the stress and strain of each phase, was used in this study.
Brief Description of the MT Model
In the MT model, a composite is described as inclusions embedded into a medium that has the same properties as the matrix, see Figure 2. A PA mix was considered as a three-phase composite of mortar, coarse aggregates, and air voids. The mortar phase was considered as the matrix, and the aggregates phase and the air voids phase were considered as inclusions.
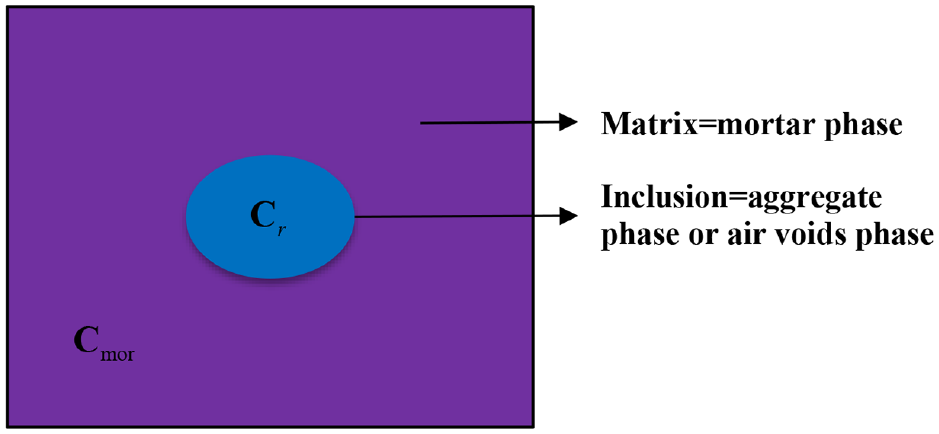
Illustration of a composite in the Mori–Tanaka (MT) model.
According to the Eshelby’s solution ( 17 ), when an inclusion (the aggregate phase or the air voids phase) is embedded into an infinite medium which has the same properties of the matrix, the relationship between the strain of the inclusion and the strain of the matrix is given as:
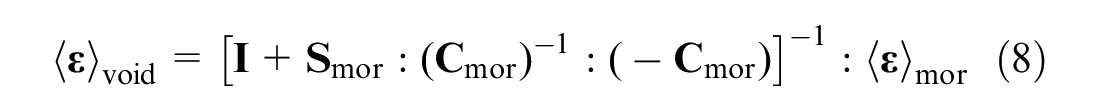
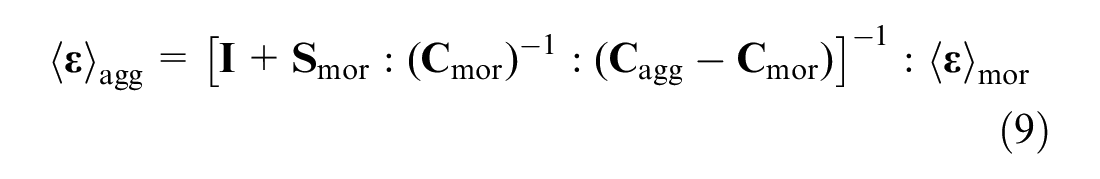
where the subscripts “mor,”“void,” and “agg” denote the mortar phase, the air voids phase, and the coarse aggregates phase, respectively;
According to the definition of
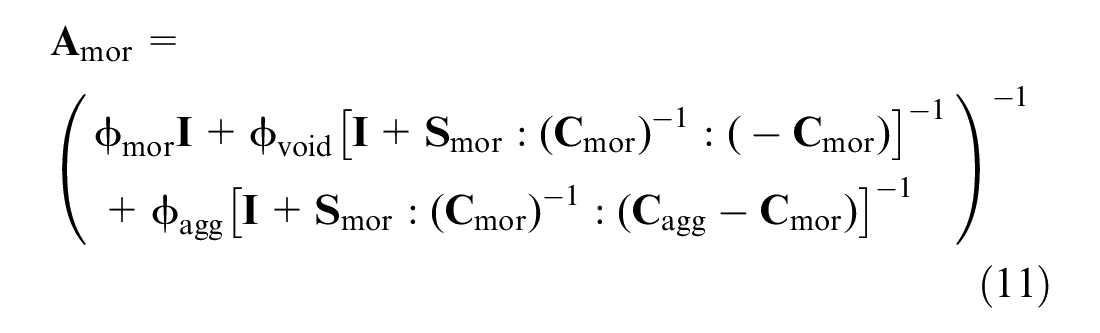
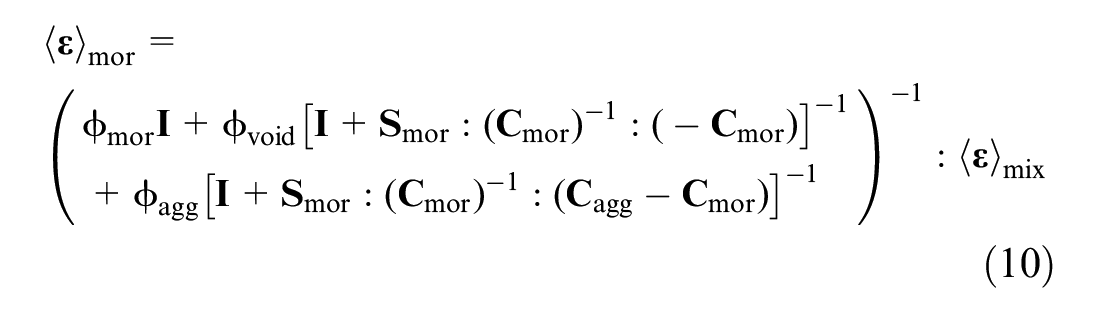
The value of
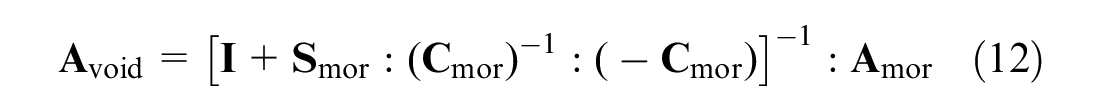
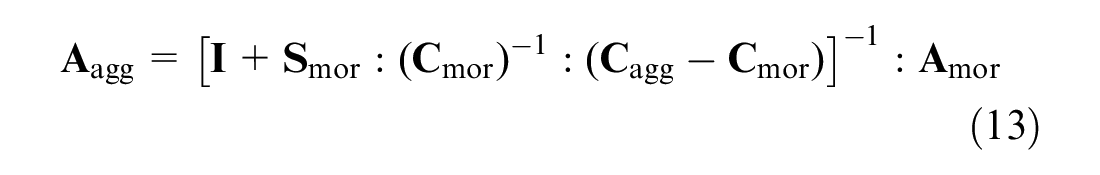
In Equations 11–13, the value of
By considering all the phases as isotropic and the inclusions as spheres, the value of
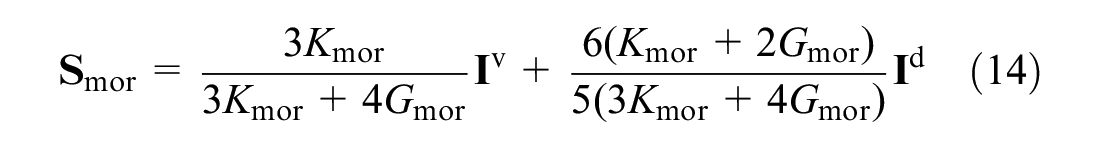
By substituting Equations 11–14 into Equation 7, the value of

with
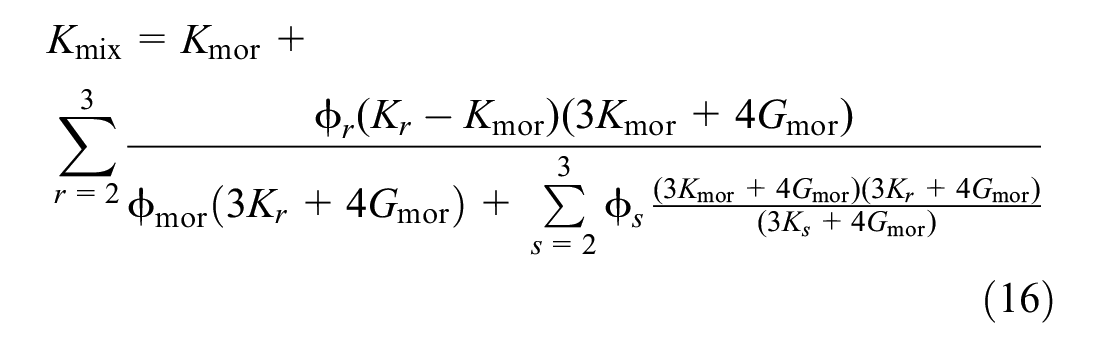
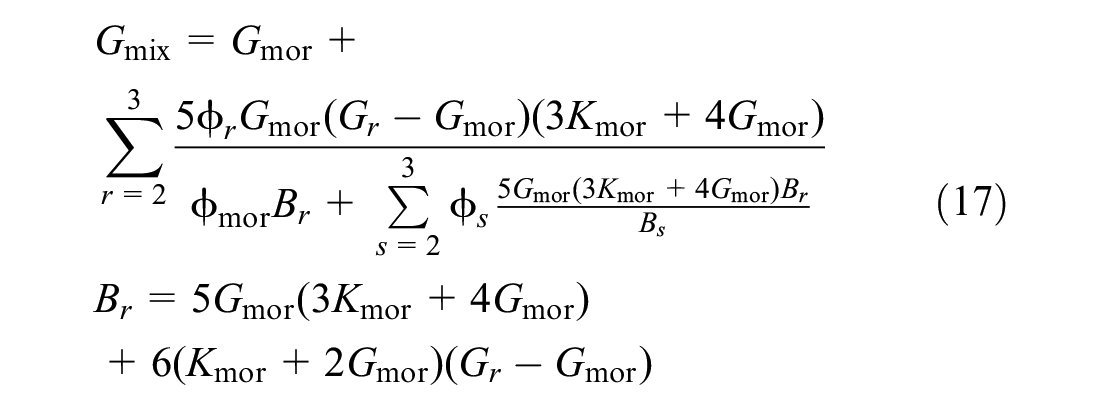
where the subscripts “2” and “3” represent the aggregate phase and the air voids phase, respectively.
It is noted that although all the micromechanical models were initially developed for elastic materials, they can be used for viscoelastic materials by replacing the elastic moduli with the complex moduli according to commonly adopted elastic–viscoelastic corresponding principle ( 29 ).
Proposed Methodology
General Procedure
By means of the homogenization technique, the raveling distress of a PA mix pavement can be analyzed in the following three steps (see Figure 3):
Step 1: effective modulus calculation. The effective modulus of the mix from the properties of its individual phases is determined by using homogenization models in a forward way. In this step, it is of vital importance to ensure the selection of a suitable model that can accurately predict the modulus of the mix. The accurate modulus is required for the accurate calculation of the response of the pavement system. Moreover, the ability of the model to accurately predict the modulus of the mix supports the reliability and validity of the predicted stress and strain fields of each phase.
Step 2: pavement response analysis. Based on the obtained effective modulus, the stress/strain fields of the mix (as a homogenized material) are calculated on top of a pavement structure. The calculation is carried out by means of any available pavement analysis tool, which can be analytical methods such as ElSYM5 and 3D-MOVE ( 30 , 31 ) or numerical methods such as FEM and DEM. Based on the calculated results, the critical locations and critical times where and when raveling is most probable to occur are determined. The critical locations are identified as the positions where the stress/strain of the mix that relates to raveling (i.e., tensile stress, shear stress, etc.) is the highest. When a wheel passes the critical locations, the times when this stress/strain is the highest are identified as the critical times.
Step 3: individual phases’ stress/strain field calculation. Based on the stress/strain fields of the mix at critical locations and critical times, the homogenization technique is used in an inverse way to compute the stress/strain fields in individual phases. Under these stresses/strains loading conditions, the fatigue characteristics of the mortar (cohesive damage) and the mortar–aggregate interface (adhesive damage) are measured from laboratory tests. By comparing the fatigue life of the mortar and the mortar–aggregate interface, the predominant damage mode and the corresponding number of tire passages that result in raveling can be determined.

Homogenization technique.
A Real Field-Like Example for Demonstration
To demonstrate the application of the proposed approach, a real field-like example is presented in this section. The properties of each phase (mortar, aggregates, and air voids) of a PA mix are given in the later section “Properties of each Phase in the PA Mix”. The pavement structure ( 32 ) consists of five layers: 1) the PA mix layer; 2) a representative asphalt concrete (AC) layer which is equivalent to all asphalt layers beneath the PA mix layer; 3) a mixed granular aggregates base layer; 4) a sand subbase layer; and 5) a subgrade layer. The detailed properties of each layer and the loading condition are presented in the later section “Characteristics of the Pavement Structure.”
The detailed procedure used in the field-like example is given in the following paragraphs. For the ease of readability, the whole procedure is summarized in Figure 4. It is noted that the laboratory equipment, the test methods, the homogenization model, and the pavement analysis tool used in the field-like example could be altered depending on the availability and the desired accuracy. In any case, the proposed framework, as shown in Figure 4, more or less remains the same.
Step 1: effective modulus calculation. The shear modulus of mortar was measured from frequency sweep tests by using a dynamic shear rheology (DSR) device. The Poisson’s ratio of mortar, the shear modulus, and the Poisson’s ratio of aggregates were assumed from the literature. The MT model was used to predict the modulus of the mix. Previous studies ( 22 – 25 ) have shown that at lower temperatures, micromechanical models have the ability to predict the modulus of asphalt mixtures. However, most of these studies used dense asphalt mixtures for the evaluation, and thus their observations cannot be directly used for PA mixes. Therefore, laboratory tests were conducted in this study to validate the ability of the MT model in predicting the modulus of PA mixes. It is noted that depending on the mix’s components, other homogenization models that are more suitable for the prediction of the effective modulus could easily replace the MT model in the framework (see Figure 4).
Step 2: pavement response analysis. The 3D-MOVE software ( 30 , 31 , 33 ) was used in the field-like example to compute the stress and strain response of the pavement. According to research ( 13 ), raveling can occur in the tensile mode or the shear mode. In this field-like example, raveling was assumed as a failure resulting from shear stresses. Therefore, the shear stress of the mix was used to determine the critical location(s) and critical time(s). Several locations where the highest value of the shear stress was possible to occur were selected and compared. As raveling is a surface-related phenomenon ( 13 ), these locations were chosen on the top of the PA mix layer in the vertical (z) direction (z = 0). In the transverse (y) direction, four different locations, that is, a location outside the tire–pavement contact area, the edge of the tire–pavement contact area, the center of the tire–pavement contact area, and the middle point between the edge and the center, were selected. The values of the maximum shear stress τmax_mix at these locations were compared. The location at which the highest value of τmax_mix occurred was identified as the critical location. At the critical location, the time when the value of τmax_mix was the highest was identified as the critical time. It is noted at a certain location, shear stress can be different depending on the direction of the stress plane, and τmax_mix was identified as the maximum value of the shear stress at this location.
Step 3: individual phases’ stress/strain field calculation. The strains of the aggregate phase <

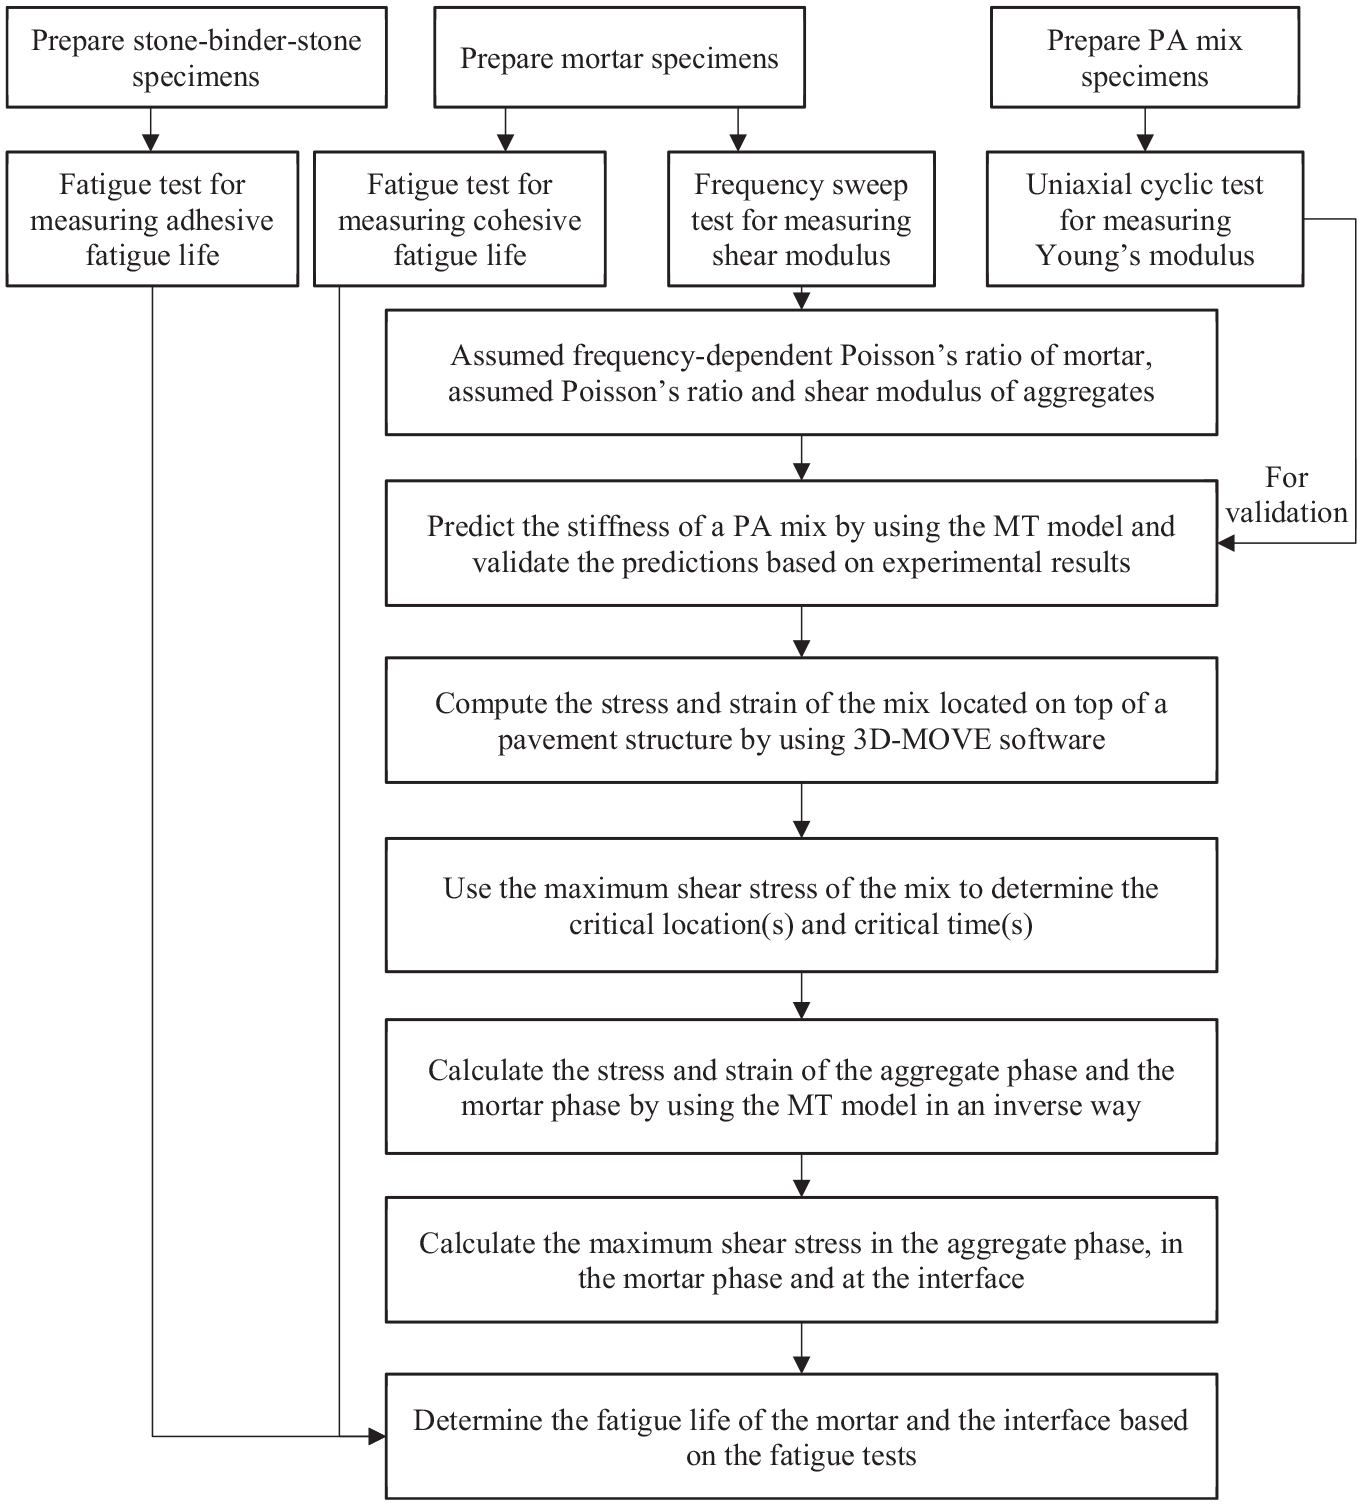
Detailed procedures used in the real field-like example.
It is highlighted that although the tensile mode raveling may be more predominant than the shear mode raveling ( 13 ), it does not make a significant difference to use the shear mode or the tensile mode to demonstrate the proposed approach. The procedure analyzing the tensile mode raveling is similar to that used for the shear mode except that:
For the tensile mode raveling, in step 2, the critical times and critical locations are determined on the basis of the maximum tensile stress of the mix.
In step 3, after the stress and strain of each phase (<
Preparation of Specimens and Test Methods
Preparation of Specimens
Preparation of PA Mix Specimens
PA mix specimens were prepared and tested to validate the predicted modulus from the MT model. The aggregates gradation and the density of each size are shown in Table 1. The aggregates consisted of crushed Norwegian BESTONE aggregates (2–16 mm) and crushed sand (0–2 mm), which were obtained from BAM Construction Company. The filler was Wigro 60K filler (25%–35% lime), produced by Ankerpoort NV.
Aggregates Gradation in Porous Asphalt Mix and Mortar
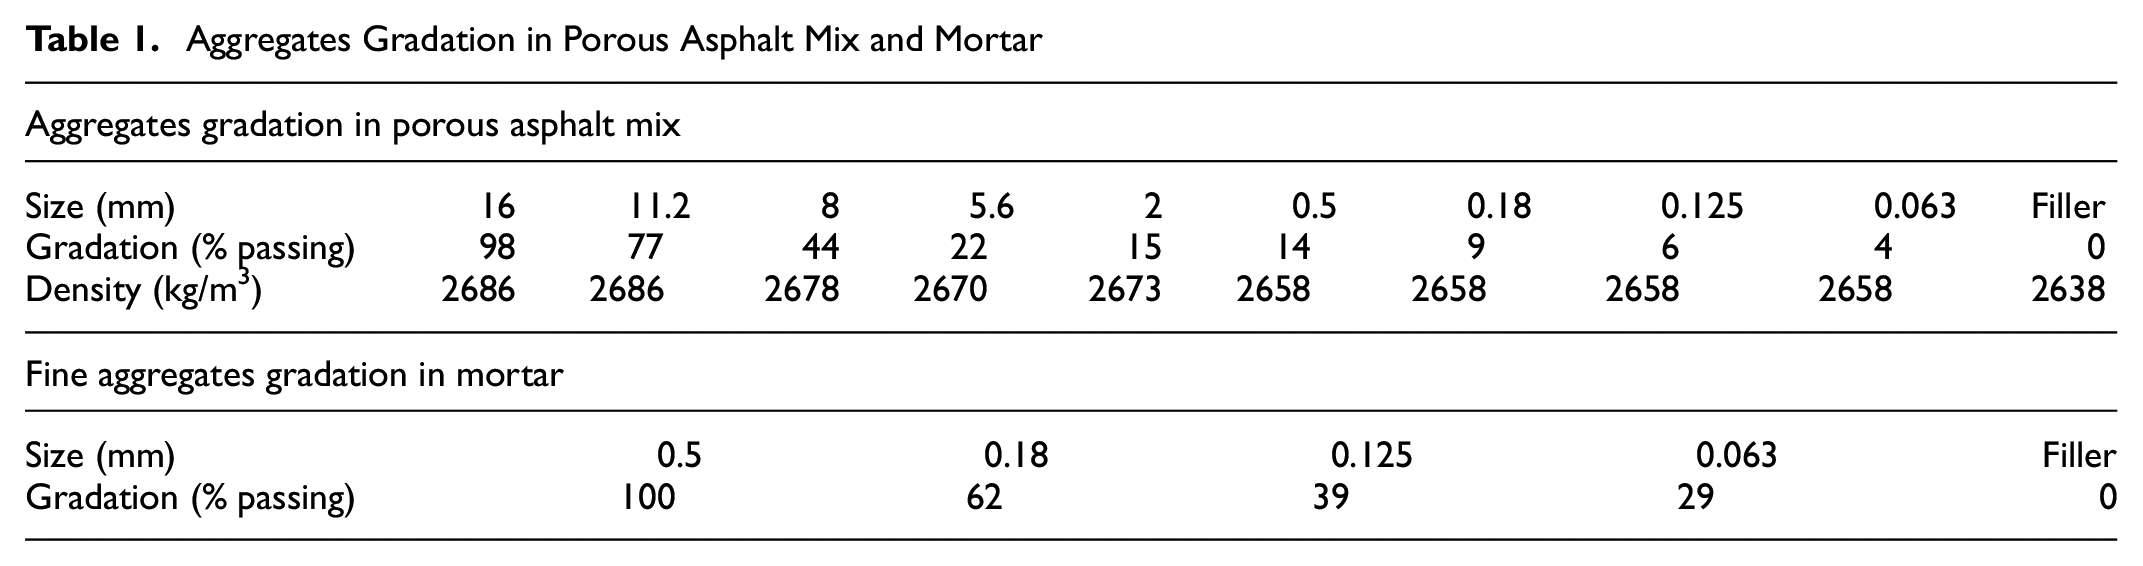
The asphalt binder, provided by Q8/Kuwait Petroleum B.V., had a penetration grade of 70/100. The content of the asphalt binder was 4.3% in relation to the total weight of the specimen. The density of the asphalt binder was assumed to be 1.03 kg/m3. The value of
The specimens were prepared according to the AASHTO standard ( 34 ). Initial specimens, with a diameter of 150 mm and a height of 170 mm, were compacted by using a gyratory compactor. These specimens were further cored and cut to obtain the testing specimens with a diameter of 100 mm and a height of 150 mm.
Preparation of Mortar Specimens
Mortar specimens were prepared for testing Gmor and the cohesive fatigue performance. In this study, the mortar was considered to consist of all the contents of asphalt binder, filler, and fine aggregates (<0.5 mm) in the mixture. In a PA mix of 100 g, as the asphalt binder content was 4.3%, the mass of asphalt binder was 4.3 g. From the aggregate gradation in Table 1, the total mass of filler and fine aggregates (<0.5 mm) was computed as 100 × (1%–4.3%) × 14% = 13.4 g. Thus, the content of asphalt binder in the mortar was 4.3 g/(13.4+4.3)g = 24%. The fine aggregates gradation in the mortar was calculated by normalizing the proportions of fine aggregates in the mix with respect to the maximum sieve in the mortar, see Table 1.
The size of the mortar specimens was 6 mm in diameter and 12 mm in height, see Figure 5a. Steel rings with a thickness of 1 mm and a height of 4 mm were attached at the ends. A clamping system was mounted to a DSR device to hold the specimens via the rings, see Figure 5b. A special mold was used to make these specimens, see Figure 5c. The hand-mixed mortar materials were slowly poured into the preheated mold (at 160°C for 30 min) to prevent the formation of air voids. Then, the filled mold was placed back in the oven at 160°C for 10 min to remove air bubbles in the mortar. After cooling down the mold for 10 min at room temperature and around 24 h in the freezer, the specimens were removed from the mold.
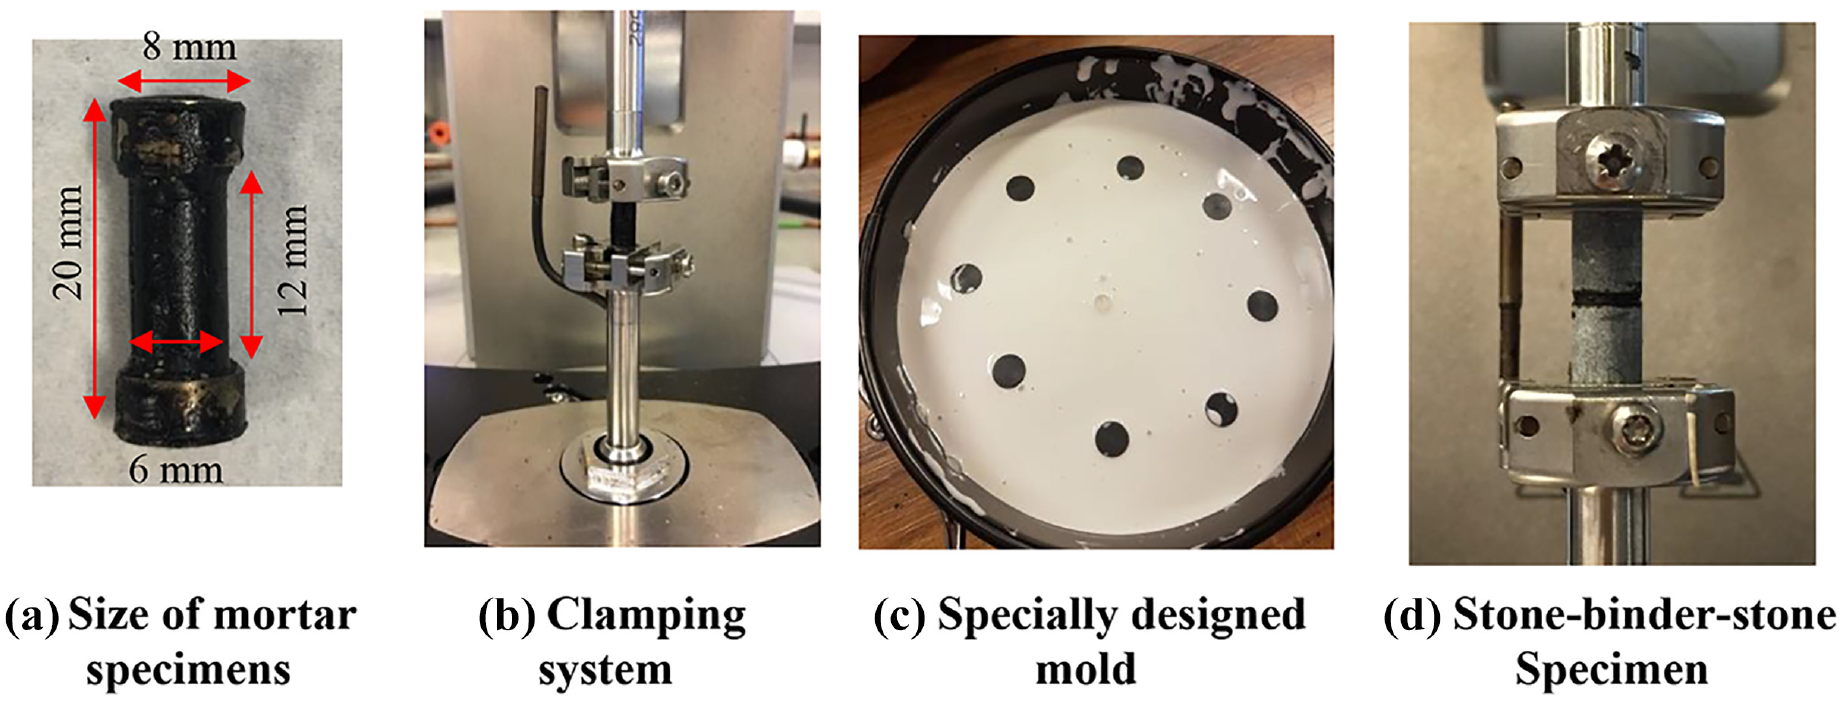
Preparation of mortar specimens.
It is highlighted here that the mortar materials in this study can smoothly flow like a liquid at high temperatures, and thus no compaction effort was performed during the fabrication. This behavior may be different from the observation in other studies ( 35 ) that mortar had a solid-like behavior and thus can be compacted. However, the properties of mortar are highly dependent on its composition and the properties of each component. To date, there is no widely accepted method to determine the composition of the mortar material (i.e., the maximum aggregate size, the aggregate gradation, the asphalt binder content, the air voids content, etc.) in a mixture ( 36 ). According to the mortar’s definition used in this study, the binder content was much higher than the values used in other studies ( 35 , 36 ); therefore, it is reasonable that the mortar in this study was more viscous. Moreover, this viscous behavior was obtained by other researchers as well ( 37 ).
Preparation of Stone–Binder–Stone Specimens
According to the previous research work at Delft University of Technology ( 38 ), the adhesive fatigue property was tested by using stone–binder–stone specimens. Each specimen with a thin asphalt binder layer of approximate 100 μm was sandwiched between two stone columns of 10.9 mm in diameter and 15 mm in height ( 39 ), see Figure 5d. The stone columns were obtained by cutting, sandblasting, and coring raw stones.
The same clamping system as the mortar column was used to hold the ends of the stone columns. After the stone columns were mounted and centered, the gap between these two columns was set to be zero. This was achieved by moving the DSR drive shaft down to a position where there was just no contact force between two column surfaces. The stone columns were kept at a temperature of 140°C for 10 min, and then one droplet of asphalt binder was placed on top of the bottom stone. The gap was set to 100 μm at a lower temperature of around 30°C to avoid the effect of the shrinking of asphalt binder on the interface’s properties during the decrease of temperature.
Test Methods
Uniaxial Cyclic Test
The dynamic Young’s modulus of the specimens Emix was measured from the uniaxial cyclic test. Forces with small amplitudes in tension–compression mode were subjected to PA mix specimens to measure the linear viscoelastic properties of the mix. The displacements were measured by using three linear variable differential transformers. The testing frequencies were 20 Hz, 10 Hz, 5 Hz, 1 Hz, 0.5 Hz, and 0.1 Hz at three different temperatures of −10°C, 4°C, and 21°C.
Frequency Sweep Test
Frequency sweep tests on DSR were conducted to measure the value of Gmor. The testing frequency ranged from 20 Hz to 0.1 Hz, and the testing temperatures were −10°C, 4°C, and 21°C. Small strains with constant amplitudes were applied to ensure the linear viscoelastic response of the specimens. From low to high temperatures, the amplitudes were 0.1%, 0.5%, and 1%, respectively.
Fatigue Test
The fatigue tests were performed on mortar and stone–binder–stone specimens to measure the properties of cohesive failure and adhesive failure, respectively. The tests were conducted in stress-controlled mode by using DSR at 20°C. The failure point was defined as the moment when the shear modulus showed a sudden drop. During the fatigue tests of the stone–binder–stone specimens, damage can happen both in the binder and at the binder–stone interface. Only when the damage happened mainly at the interface was it considered as an adhesive failure, see Figure 6. Each specimen was virtually checked after the test to confirm the adhesive failure.
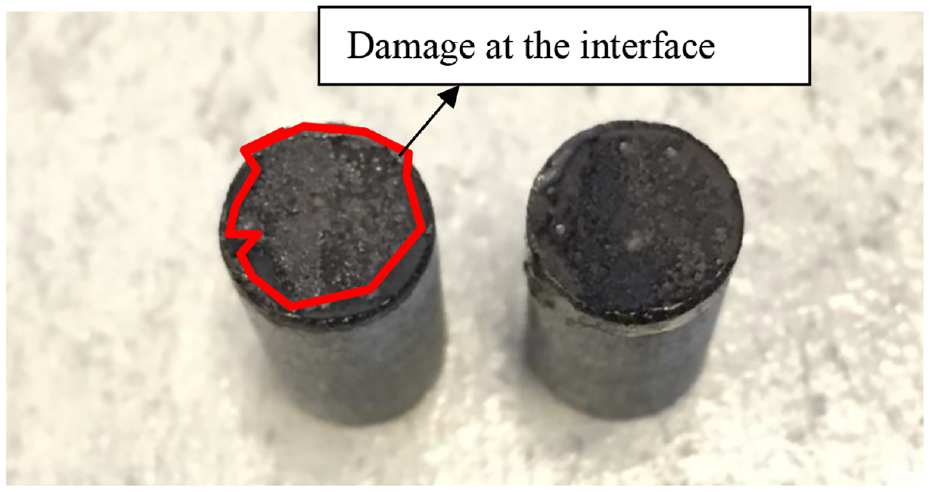
Adhesive failure.
At each stress level, at least three replicates were used to determine fatigue life. It is highlighted here that for the adhesive fatigue tests, three replicates mean three stone–binder–stone specimens with adhesive failures. As explained above, as damage can occur both in the binder and at the interface, the fatigue life of different stone–binder–stone specimens varied with each other. However, the fatigue life of the specimens with the adhesive failure (damage happened mainly at the binder–stone interface) did not vary significantly.
Properties of Each Phase in the PA Mix
The volumetric and mechanical properties of each phase in the PA mix are required for predicting the modulus of the mix. Based on the designed value of
Mortar
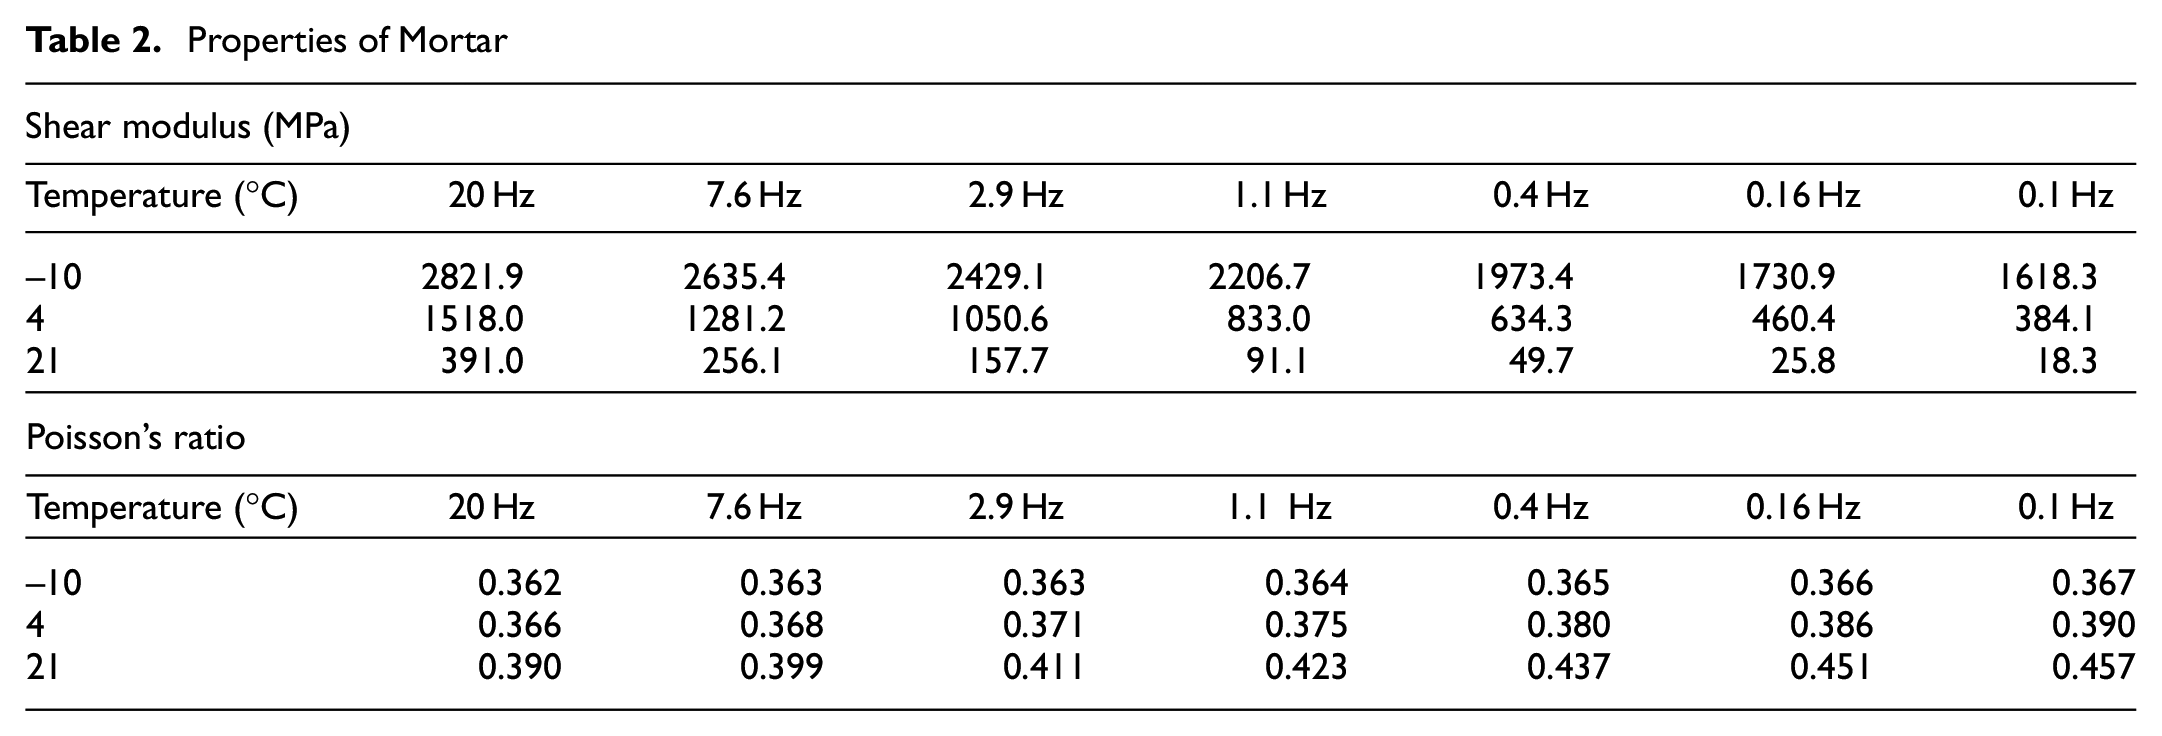
The measured results of Gmor at different temperatures and frequencies are presented in Table 2. It can be seen that the value of Gmor decreases with the decrease of frequency and the increase of temperature, as observed by many other studies ( 25 ). Because of the limitation of the testing device, it is difficult to accurately measure the Poisson’s ratio of mortar νmor. Therefore, based on the literature ( 40 , 41 ), it was assumed that the value of νmor was frequency and temperature dependent. It varied from 0.35 at higher frequencies/lower temperatures to 0.5 at lower frequencies/higher temperatures, see Table 2 ( 42 ).
Properties of Mortar
Aggregates
According to the literature ( 24 , 42 ), the shear modulus Gagg and the Poisson’s ratio νagg of aggregates were assumed to be constants of 20.8 GPa and 0.27, respectively. Based on the values of G and ν, the value of K was calculated by using the following equation:

Characteristics of the Pavement System
As mentioned earlier, the pavement in the field-like example was a five-layer system. The PA mix layer and the AC layer were considered as linear viscoelastic materials, and the analysis temperature was 20°C. The base layer, the subbase layer, and the subgrade layer were assumed to be linear elastic. The properties of each layer are shown in Table 3. The thickness of each layer was determined based on typical thicknesses used in provincial carriage roads in the Netherlands ( 32 ). The Poisson’s ratio of each layer was assumed to be constant, as followed by other researchers ( 4 , 31 ). The value of Emix for the PA mix layer was predicted from the properties of mortar and coarse aggregates by using the MT model. The Young’s modulus of the representative AC layer at different temperatures and frequencies was given in Table 3. The damping ratios were assumed according to the literature ( 43 , 44 ). The unit weights of the PA mix layer and the AC layer were obtained from the bulk densities of the mixes. For other layers, the unit weights were assumed as commonly used values.
Properties of Each Layer
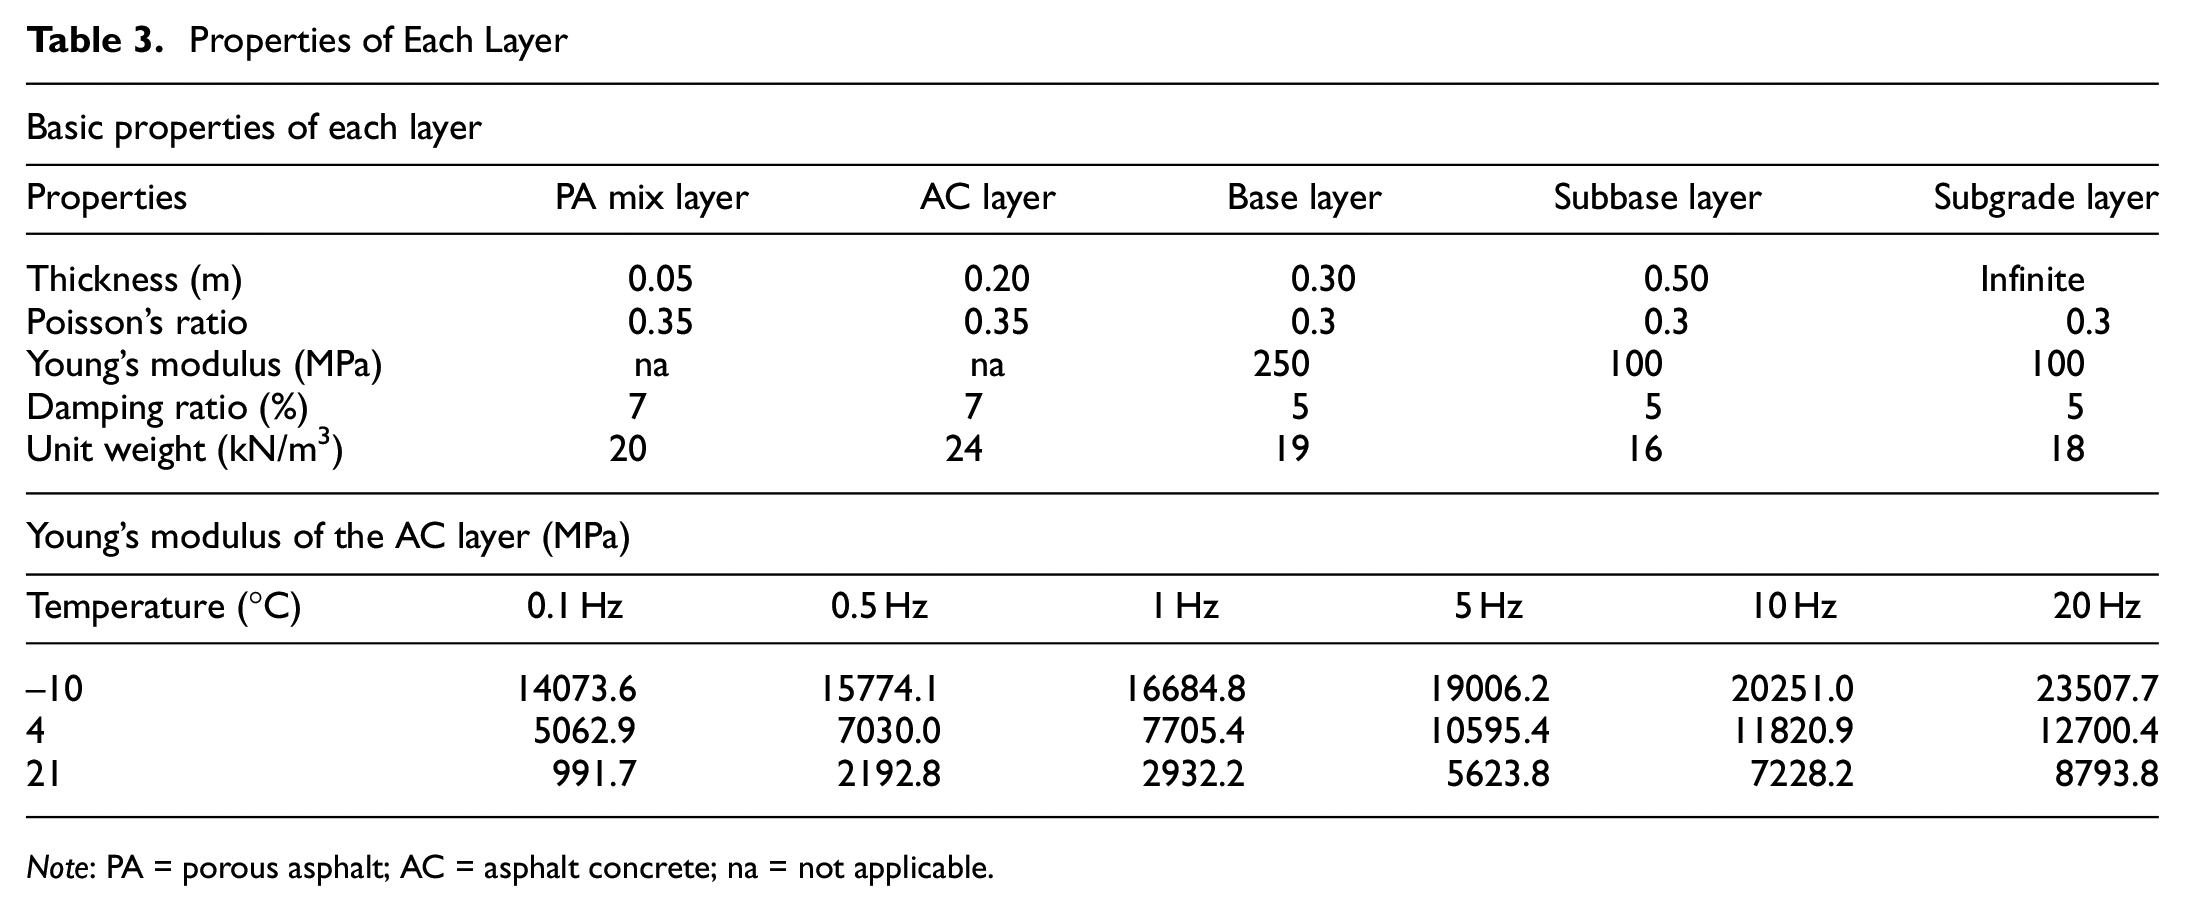
Note: PA = porous asphalt; AC = asphalt concrete; na = not applicable.
The loading condition was imposed by a single rolling wheel passing over the pavement. According to the Dutch design method ( 45 ), the circular tire load of the wheel was designed as 35 kN with a tire–pavement contact pressure of 750 kPa and a tire–pavement contact radius of 0.122 m. The wheel moved at a speed of 50 km/h. The rolling friction coefficient was assumed to be 0.02 based on the work of researchers ( 46 ). The braking friction coefficient was not considered as there is no braking case included in this analysis.
It is noted that as this study aimed at demonstrating the use of the homogenization technique, a simple tire–pavement contact was assumed. However, the geometry of the tire–pavement contact area and the stress distribution are affected by many factors, such as the type of the tire, the surface properties of the pavement, and so forth ( 47 ). The properties of the real tire–pavement contact may be different from the assumption used in this field-like example. As the pavement responses heavily depend on the properties of the tire–pavement contacts, the analysis results of raveling distress can be different with different contact properties. Therefore, in future studies, more accurate tire–pavement contacts are required.
Results and Discussions
Predicted Results of Emix
The predicted values of Emix were calculated from Gmix and Kmix by using Equation 20. From Figure 7, it can be seen that the predicted values of Emix match well with the tested results. This indicates that at lower temperatures, the MT model has the ability to predict the modulus of PA mixes from the properties of mortar, aggregates, and air voids. Therefore, in future research studies, without doing laboratory tests, it is possible to directly obtain the modulus of PA mixes using micromechanical models. Furthermore, as mentioned earlier, the accuracy of the predicted modulus also supports the reliability and validity of the following predicted stress and strain fields of each phase.

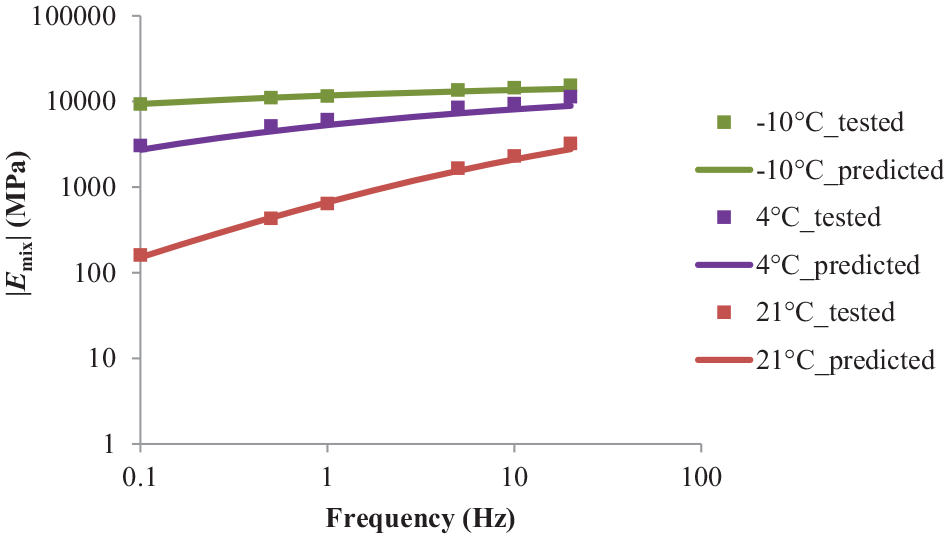
Comparison between the predicted and the tested values of Emix.
Critical Location and Critical Time
The calculated values of τmax_mix at different locations in the y-direction, that is, y = –0.06 m (a location outside the tire–pavement contact area), y = 0 (the edge of the tire–pavement contact area), y = 0.06 m (the middle point between the edge and the center), and y = 0.122 m (the center of the tire–pavement contact area), are shown in Figure 8a. It can be seen that at the edge of the tire–pavement contact area, the value of τmax_mix is the maximum. Therefore, the critical location was chosen as the edge of the tire–pavement contact area. At the critical location, the change of τmax_mix with time t is shown in Figure 8b. Peak values of τmax_mix occurred when the wheel approached and moved away from the observation plane. Because of the effect of the tire–pavement friction, the peak value when the wheel moved away from the observation plane was slightly higher than the other. Therefore, tc was chosen as the time when the second peak occurred: tc = 0.255 s.
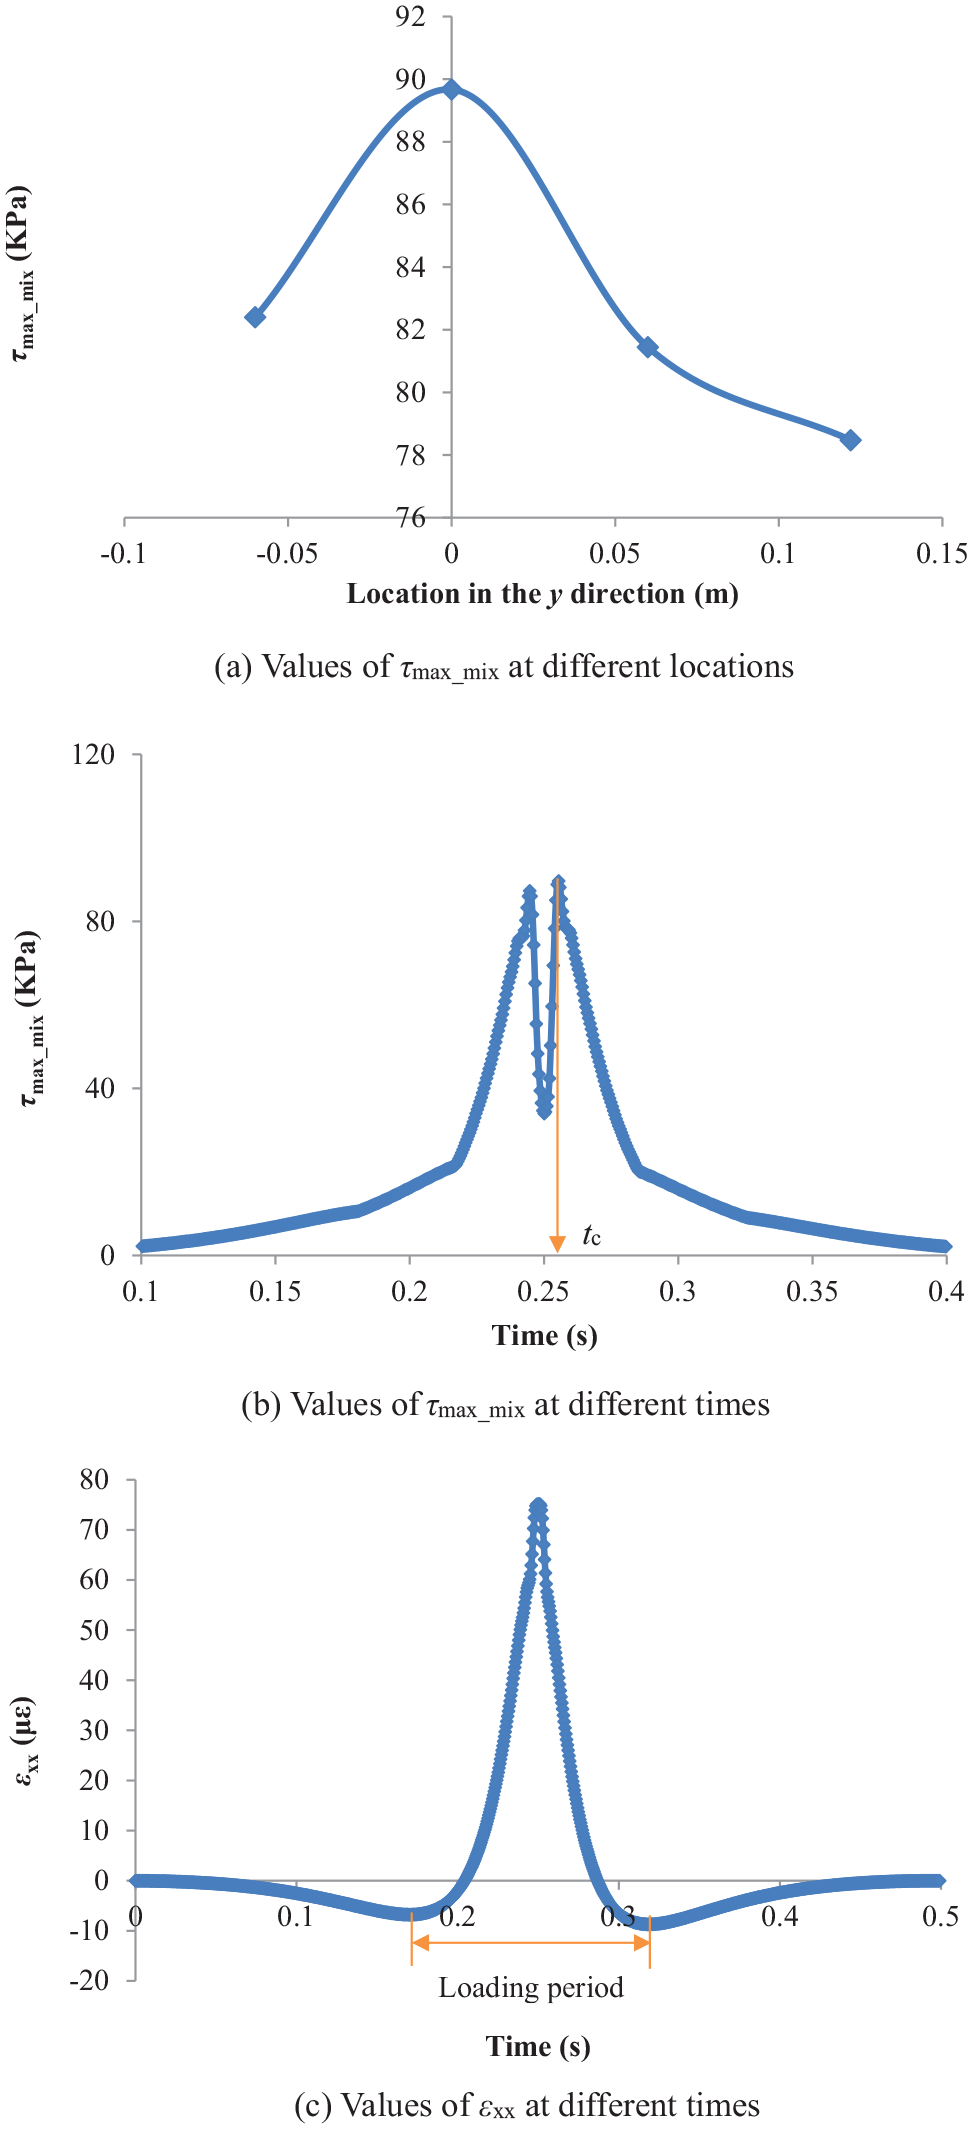
(a) Values of τmax_mix at different locations; (b) values of τmax_mix at different times; (c) values of εxx at different times.
Calculated Stress and Strain of Each Phase
At the critical location and the critical time, the values of <
Values of Principle Strains and Stresses
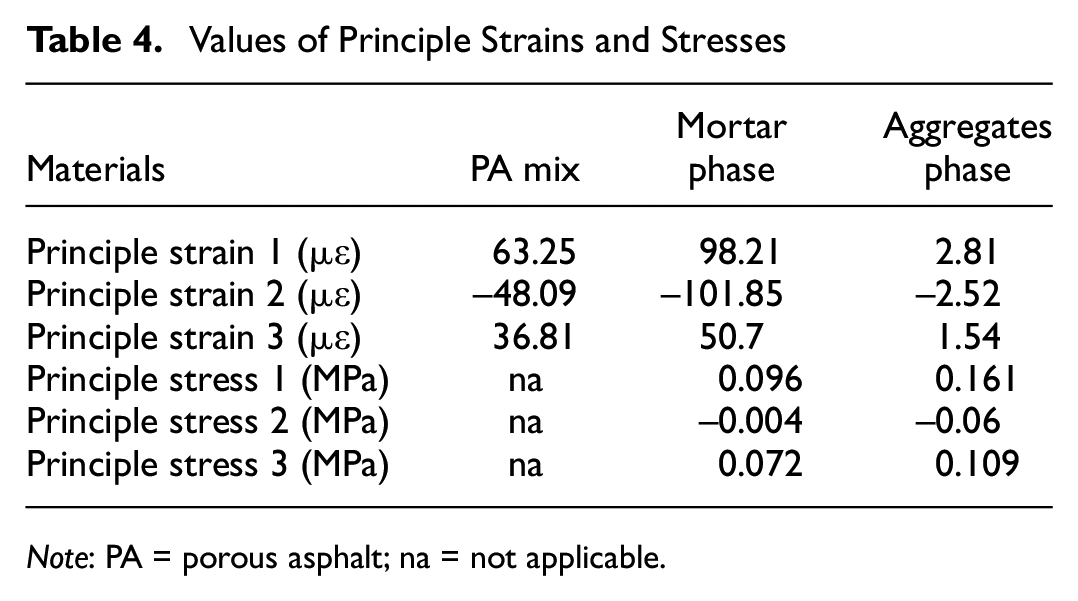
Note: PA = porous asphalt; na = not applicable.
The calculated results of <
Predicted Fatigue Life of the Mortar and the Interface
The calculated results of τmax_agg, τmax_mor, and τmax_int are 0.111 MPa, 0.050 MPa, and 0.061 MPa, respectively. Because of the significant difference of τmax between the mortar and the aggregates, the value of τmax_int is higher than τmax_mor by 18%.
The measured fatigue life curves of the mortar and the interface at 20°C are shown in Figure 9. It is observed that under the same loading condition, the fatigue life of the mortar is lower than the fatigue life of the interface. This is because at a relatively high temperature, the mortar is soft, and thus it is susceptible to fatigue damage. As the soft mortar forms a strong bonding with the aggregates, the fatigue resistance of the interface is high. Under the loading condition of τmax, Nmor and Nint were obtained as 2.4E+5 cycles and 6.8E+7 cycles, respectively. This indicates that at 20°C, the PA mix is more susceptible to the cohesive failure, which is in line with the findings from previous studies that the cohesive failure is predominant at high temperatures ( 4 , 49 ).
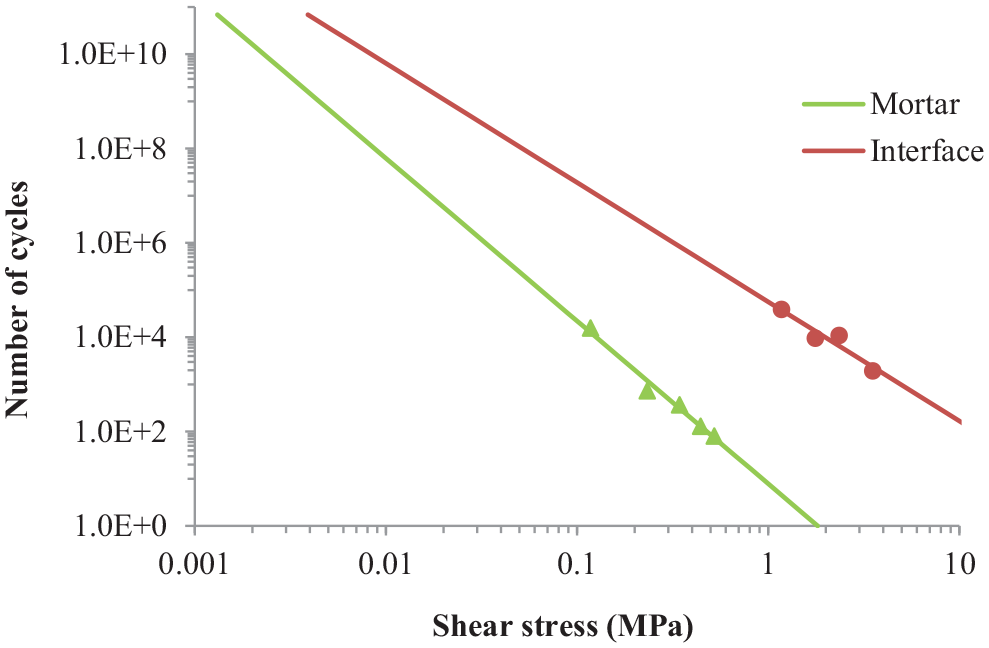
Fatigue life of cohesive and adhesive damage at 20°C.
In conclusion, based on the above discussions, the following information was obtained:
Raveling was supposed to initially occur at the edges of the circular tire–pavement contact area (critical locations).
At the critical locations, raveling was supposed to occur in a cohesive damage mode. The mortar bridge that bonds aggregates together was supposed to break, which resulted in the separation of the aggregates from the pavement surface.
Based on the measured fatigue life of the mortar bridge, raveling was supposed to occur after the wheel passed by for 2.4E+5 times.
It is noted that the above conclusion is just for the field-like example where a specific tire load, a specific pavement system, and a specific analysis temperature were predefined. For other cases, the analysis results should be different, but the basic information relating to the raveling distress, that is, the location where raveling occurs, the predominant damage mode, and the number of tire passages which result in raveling, can always be given by means of the proposed homogenization technique.
Conclusion
This paper proposed an approach to analyze the raveling distress of a given PA mix pavement by using the homogenization technique. To demonstrate the application of the proposed approach, a real field-like example was presented. Based on the obtained results, the following conclusions can be drawn:
Raveling can be considered as a type of fatigue failure that occurs within the stone-on-stone contact regions. The problem of analyzing the raveling distress of a PA mix pavement can be converted to the problem of analyzing the fatigue characteristics of the mortar and the mortar–aggregate interface.
The homogenization technique provides a way to derive a relationship between the effective properties of a heterogeneous material in the macroscale and the properties of its individual phases in the microscale. Taking advantage of the homogenization technique, raveling distress can be analyzed in different scales. In the macroscale, by considering PA mixes as a homogenized material, the average stress and strain of the mix can be easily computed. After that, the homogenization technique can be used to transfer the average stress and strain of the mix back to the microscale to obtain the local stress and strain of each phase.
The proposed homogenization technique can provide the basic information relating to the raveling distress, that is, the location where raveling occurs, the predominant damage mode, and the number of tire passages which result in raveling.
In the real field-like example, simple frequency sweep tests of mortar were performed by using the DSR device which is available in most of the pavement research organizations. In comparison with FEM/DEM models, the used homogenization model is much easier to solve, and the free available pavement analysis tool is much less time-consuming. Despite these simplicities, reasonable predictions have been obtained.
Future Work
This paper demonstrated the proposed approach by using only one case. Other cases, that is, different properties of each phase, different pavement structures, different loading conditions, different analysis temperatures, and so forth, will be investigated in future research. This investigation will be of great importance to further validate the proposed method. Moreover, it will also be beneficial to obtain a better insight into raveling and to optimize the design of PA mixes and the pavement.
Footnotes
Author Contributions
The authors confirm the contribution to the paper as follows: study conception and design: Athanasios Skarpas, Sandra Erkens, Kumar Anupam, Hong Zhang; data collection: Hong Zhang; analysis and interpretation of results: Hong Zhang, Kumar Anupam, Athanasios Skarpas, Cor Kasbergen; draft manuscript preparation: Kumar Anupam, Hong Zhang. All authors reviewed the results and approved the final version of the manuscript.
Declaration of Conflicting Interests
The author(s) declared no potential conflicts of interest with respect to the research, authorship, and/or publication of this article.
Funding
The author(s) disclosed receipt of the following financial support for the research, authorship, and/or publication of this article: The corresponding author would like to thank the financial support from China Scholarship Council.
Data Accessibility Statement
The datasets generated, analyzed, or both, during the current study are available from the corresponding author on reasonable request.