
Abstract
This paper discusses demand and willingness to pay for mobility as a service (MaaS) plans. Given the rising popularity of the MaaS concept, research exploring preferences and demand for such services is valuable to researchers and policy makers as well as other involved stakeholders and mobility operators. This research investigates individual preferences for MaaS utilizing data collected via questionnaire surveys from Greater Manchester, United Kingdom. The surveys collected socio-demographic data and data in relation to individuals’ attitudes and typical mode use patterns, while stated preference data were also obtained by designing menu-based stated preference experiments where the respondents were able to create their ideal MaaS plan. A hybrid choice model is developed to explore user choices toward MaaS, while distributed willingness to pay values are estimated. A latent variable that captures the latent predisposition of people toward using multiple modes of transport is constructed. The results indicate that individuals who are more prone to using multimodal mobility options are willing to pay more for being offered both traditional and emerging mobility services as part of a monthly MaaS plan. Considering that the implementation of MaaS is still at an immature phase, while research efforts in relation to the demand for MaaS are limited, the results of this paper provide significant insights into individuals’ preferences toward MaaS and the heterogeneity between different user segments, and could be exploited to formulate valuable plans and contribute to the successful implementation of MaaS.
Bundling of services, products, or both, is a common marketing strategy utilized by various sectors, such as telecommunications and hospitality, and offers several benefits for both customers and product/service providers ( 1 ). The key reasons behind the integration of different products, services, or both, in one package for a special price are the increase of their market share, cost savings, and customer satisfaction ( 2 – 5 ). These undeniable benefits of bundling, along with recent technological developments (i.e., the Internet of things, smartphone technology, automation) and societal trends (i.e., sharing economy, increased environmental awareness), have inspired the development of mobility as a service (MaaS), which promises “a user-centric, intelligent mobility management and distribution system, where an integrator brings together the offerings of the multiple mobility service providers, and allows end-users to seamlessly plan and pay for mobility through a digital interface” ( 6 , 7 ).
MaaS is expected to be a major disruptor in the transportation industry. Several studies have been conducted so far concerning MaaS, focusing mostly on identifying the MaaS ecosystem ( 8 – 10 ), and discussing the existing MaaS schemes ( 8 , 9 , 11 , 12 ) and corresponding business models ( 13 – 15 ), while some researchers have focused on potential barriers and challenges for MaaS implementation ( 16 – 19 ). However, only limited research has been conducted with respect to MaaS demand and willingness to pay. The objective of this paper is to capture and analyze individuals’ preferences toward MaaS packages that include a variety of traditional and emerging mobility services; and to estimate individuals’ willingness to pay for different bundles of services. This is achieved by developing a hybrid choice model which models the probability of individuals choosing a MaaS package based on its attributes (including different mobility services, levels of the offerings, price of the package), as well as the individuals’ characteristics and attitudes toward mobility. The data was collected via surveys conducted in Manchester, United Kingdom. The questionnaire collected both revealed and stated preferences data in relation to MaaS plans.
More specifically, this study aims to address the following research questions:
Which services should be included in a MaaS plan to increase its value proposition?
This is one of the key questions that need to be addressed to provide valuable and suitable MaaS offerings to customers. Thus, it is important to specify what kind of mobility services should be included (i.e., public transport, car sharing, bike sharing, carpooling, taxi, etc.) and to what extent these services should be offered (i.e., hours of car sharing, unlimited use of public transport, etc.). Current research is still at an early stage and there is limited evidence of how the MaaS packages should be structured to meet individuals’ preferences. Esztergár-Kiss and Kerényi ( 20 ) investigated this topic from the perspective of the supply side, by creating different mobility packages in 15 European cities considering several city-specific parameters such as demography, cost of living, modal split, weather conditions, and environmental friendliness. While the user perspective, and thus individuals’ preferences, were not considered by this research, some other studies have made significant efforts in this direction. Matyas and Kamargianni ( 21 ) explored individual preferences for MaaS plans by collecting quantitative and qualitative data through an online survey and in-depth interviews with individuals in Greater London. The results indicated that, although plans including public transport were mostly preferred by the respondents, there was a strong disfavor toward plans that included other modes such as bike sharing, car sharing, and taxi. Additionally, Feneri et al. ( 22 ) showed that users are affected by a combination of monthly fees and discounts rather than the price of a specific mode included in a MaaS package. This partially contradicts the results reported by Guidon et al. ( 23 ) and Reck and Axhausen ( 24 ), who concluded that car sharing is evaluated higher in a MaaS bundle than as a stand-alone service. The above findings have been made from stated preference experiments that asked participants to choose between MaaS bundling services. However, allowing users to create their own MaaS plans by combining different transport modes and levels of offerings might give more useful insights in relation to the packages that could increase the likelihood of individuals subscribing to MaaS. Thus, this paper contributes to the existing approaches by conducting menu-based stated preference experiments in relation to MaaS. The menu-based experimental survey design methodology provides “closer to real-life” conditions to respondents, giving them the ability to construct their most preferred (“ideal”) product from a given set of attributes and levels ( 25 , 26 ). Although not used extensively in transportation research until now, this approach is ideal for addressing the underlying complexity of defining MaaS packages in a highly competitive and price sensitive environment.
How much are individuals willing to pay for each mobility service that could be offered as part of a MaaS package?
There is currently limited evidence on willingness to pay (WtP) for MaaS; the literature does not provide a clear picture since different values are presented from one study to the other. Ho et al. ( 27 ) estimated that travelers in Sydney, Australia, were willing to pay AUD 6.40 (3.94 €) for an hour of access to car share while the average WtP for a day of unlimited public transport use to be included in a fortnightly MaaS plan was AUD 5.90 (3.63 €). Furthermore, Ho et al. ( 28 ), using the same approach as in Sydney, estimated the WtP for transport services offered as part of MaaS in Tyneside, UK. They found that travelers were willing to pay on average 3.72 GBP (4.35€) for 1 day of unlimited public transport, 5.28 GBP (6.18€) for 1 h use of one-way car share, and 4.32 GBP (5.06€) for 1 h use of round-trip car share, while the WtP for free-float bike sharing was almost zero. Another study in relation to WtP for MaaS was conducted by Feneri et al. ( 22 ) in the canton of Zurich in Switzerland. Based on their results, people are willing to pay about 120.2 CHF (109.55€) for 1 month of public transport use as part of a MaaS package (which is equal to $121/month), while the WtP for car sharing was estimated at the low level of 2.3 CHF/month (about 2.10€ per month). In addition, the authors estimated negative WtP for taxi services, indicating that the average consumer did not wish to purchase a monthly taxi subscription as part of a MaaS package. Mulley et al. ( 29 ) estimated the WtP for community transport offered through MaaS based on the type and number of trips offered. They found that individuals were willing to pay AUD13.84 (8.51 €) for a medical trip to be included in their monthly plan, AUD 8.16 (5.02 €) for a shopping trip, and AUD 6.97 (4.29 €) for a social trip. However, the estimated WtP was considerably smaller than the actual costs of offering the community transport service. Liljamo et al. ( 30 ) estimate a mean WtP for a generic MaaS package of 140€, with a range from 10€ to 700€. Additionally, they identify that individuals who are on the lower end of monthly spending are the most willing to pay a higher price for MaaS, but in general they comment that “People’s willingness to pay for a mobility package is still relatively far from the prices of existing MaaS services that combine several mobility services.” This paper contributes to the above limited evidence on WtP for MaaS by estimating the WtP for different traditional and emerging transport services to be included in MaaS packages such as public transport, car sharing, bike sharing, and taxi.
To what extent does WtP for MaaS vary among different population segments?
Matyas and Kamargianni ( 21 ) found that socio-demographic characteristics and the individual’s current mobility habits affect the choice of a specific MaaS package, while the respondents showed habit persistence in preferences when choosing fixed MaaS plans. Furthermore, Ho et al. ( 27 ) indicated that the potential uptake levels vary across population segments, with infrequent car users being the most likely adopters, and car non-users the least. Alonso-González et al. ( 31 ) employ a latent class cluster model to identify five population segments with different attitudes toward MaaS. Based on socio-demographics, mobility characteristics (patterns, availability of car or public transport subscription, driving license), and technology-related characteristics, the authors identify two clusters that are positive toward MaaS (flexible individuals and multimodal public transport supporters) and three clusters that are neutral or negative toward MaaS. The above findings are consistent with the existing literature on habitual behavior ( 32 , 33 ), which highlights that the prior behavior of an individual is very important when they choose between different mobility alternatives. To this end, it is important to investigate individuals’ characteristics as well as their perceptions and opinions about MaaS to understand how the choice of a MaaS package and related WtP vary for different population segments. This paper develops an integrated choice and latent variable model to capture the impact of individuals’ characteristics and attitudes on their choices in relation to MaaS. More specifically, a latent variable called “Intermodallers” is constructed to capture the latent predisposition of travelers toward using multiple modes of transport. Distributed values of WtP are also estimated for the different levels of this latent variable which, to the best of the authors’ knowledge, has not been researched by others.
This paper is composed of six sections. The second section presents the modeling framework. The third section describes the research approach including the questionnaire survey and the stated preference experiment design. The fourth section presents the model estimation results followed in the fifth section by the findings in relation to WtP for the mobility services to be included in MaaS packages. The final section discusses the conclusions and implications of the present research.
Modeling Framework
The modeling framework developed in this paper is based on the generalized framework presented by Ben-Akiva et al. ( 34 ) and Walker ( 35 ) which has been used extensively in modeling transport-related decisions ( 31 , 32 , 36 ). The main assumption of this framework is that individuals’ utility depends not only on measurable attributes (observed), but also on unobserved (latent) variables where indicators are used for identifying these latent variables. The integrated choice and latent variable structure explicitly model the latent variables that influence the decision-making (choice) process, with the use of measurement equations that link the unobservable latent variable to its observable indicators and a structural equation that links the latent variable with observed attributes.
Figure 1 presents the modeling framework of choices of MaaS plans. The yellow ellipses represent the latent variable. The rectangles represent the observable variables, either explanatory or indicators of the latent variable. The solid arrow that links the explanatory variables to the decision represents the structural equation of the decision-making process, while the dashed arrow represents the measurement equations.
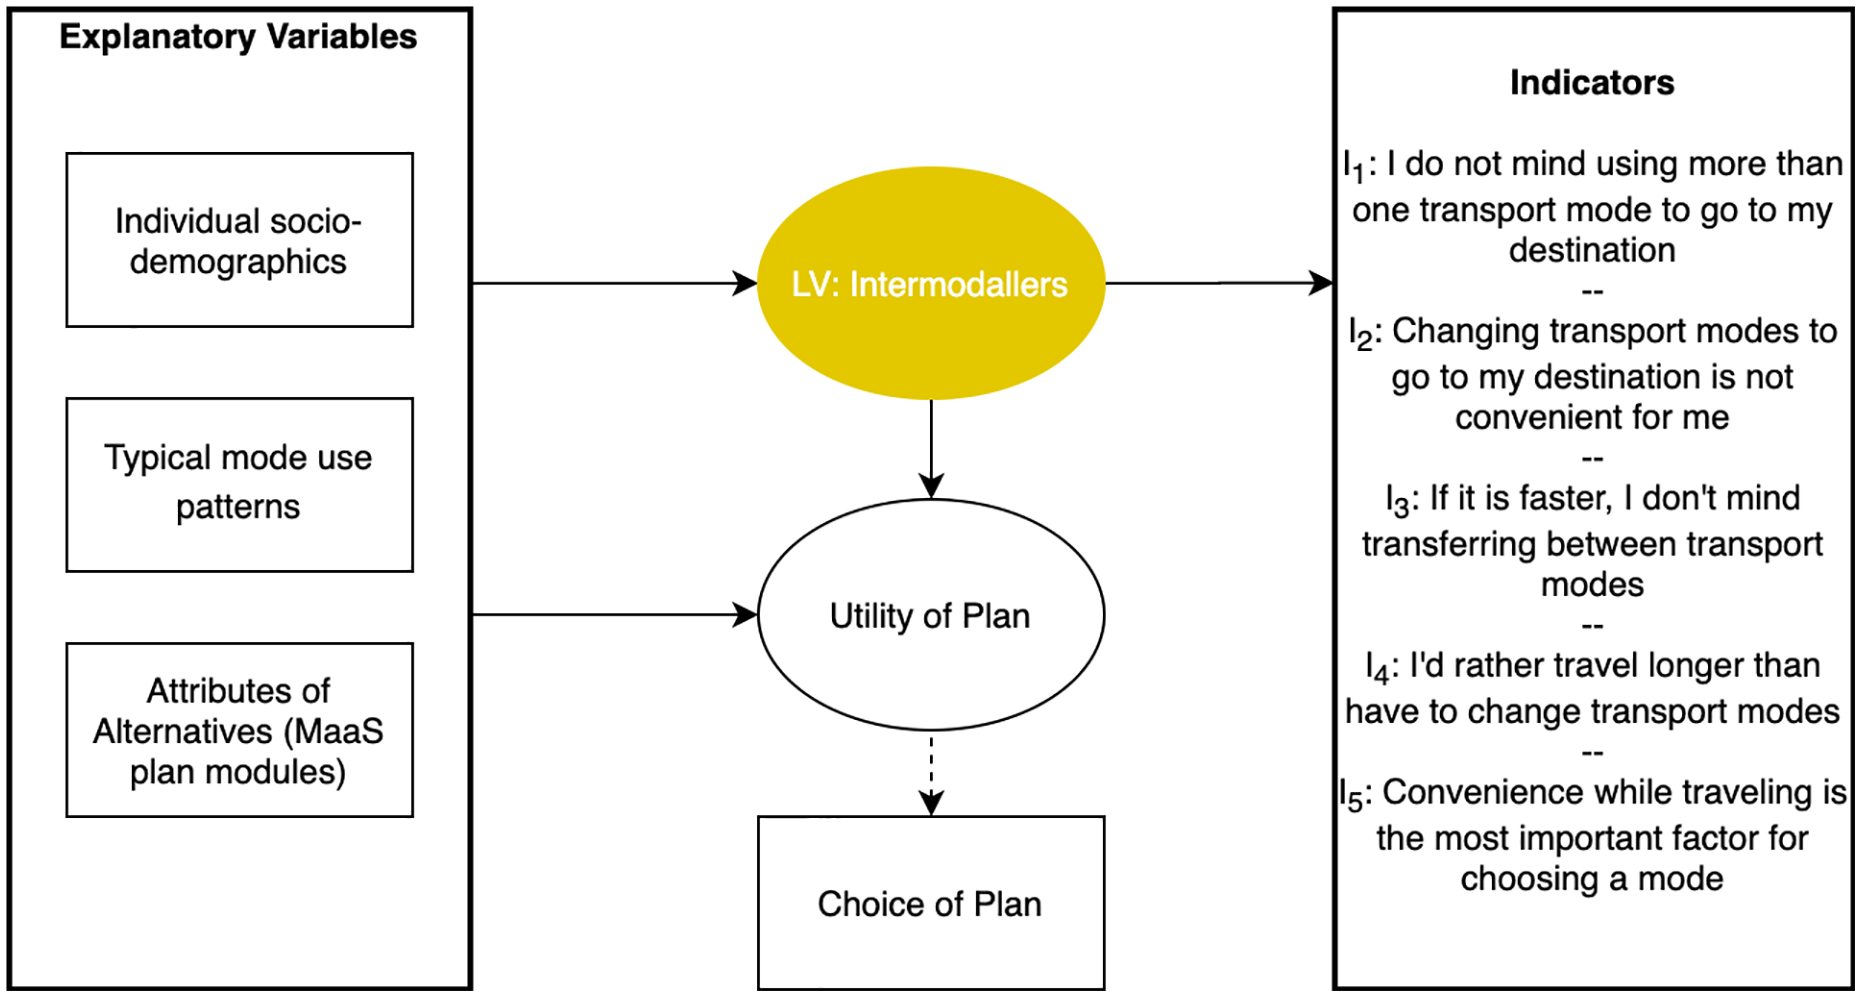
Modeling framework.
The attributes that influence individuals’ decision-making patterns can be broadly categorized into three groups. The first group consists of socio-economic characteristics, such as gender and age. The second group includes variables that express individuals’ habitual travel patterns, such as frequency of car usage, frequency of public transport use, and so forth. The third group includes the attributes of the MaaS plans, such as price, available mobility services (public transport, car sharing, bike sharing, taxi), as well as levels of the mobility offerings (i.e., hours of carsharing, limited or unlimited use of public transport, etc.).
The model developed includes a latent variable, called “Intermodallers”. Five seven-point Likert scale questions are utilized as indicators of the latent variable as presented in Figure 1. It is assumed that “Intermodallers” is a group of individuals with a latent predisposition toward using multiple modes of transport to reach their destination without inconvenience, thus being an optimal target group for adopting MaaS plans. The “Intermodallers” latent variable is affected by socio-demographics and the habitual travel patterns of the respondents.
In travel behavior literature, the term “Intermodal” is used interchangeably with “Multimodal” (51,800 results for keywords “intermodal freight transport” in Google Scholar versus 35,800 for “intermodal passenger transport”). In a note of terminology, the term “Intermodaller” is used in this paper to identify individuals who are comfortable shifting from one to another or more modes to get to their destination. The authors hypothesize that if a user is “intermodal” trip-wise (i.e., comfortable switching modes for a single trip) they would be also more likely to purchase a MaaS plan, given that they would benefit from the multiple available transport modes in the plan and also in the long-term (monthly plan). This hypothesis is consistent with findings in the literature such as the work of Alonso-González et al. ( 31 ).
The latent variable is interacted with the estimated coefficients of price to allow the estimation of distributed WtP among individuals for MaaS services. The specification is a standard linear-in-the-parameters model. The actual choice of variables is limited by data availability and postulated based on a priori expectations. The model specification has been refined based on statistical tests on results of alternative model estimations. The hybrid choice model consists of two parts: a discrete choice model and a latent variable model as described in the next sections.
Structural Model
The latent variable Intermodallers is structured by using socio-demographic characteristics and habitual travel patterns of the individuals. After specification testing and multiple iterations, the structural model of the latent variable uses five individual-specific variables. The variables are gender (dummy variable with male as base), age (continuous variable), education (dummy variable, using non-degree holders as base), work flexibility (dummy variable, taking the value of zero for the persons with flexible working hours), frequency of reported public transport trips (dummy variable, taking the value of zero for respondents who use public transportation less than once per week). The structural equation of the latent variable is defined as a function of a deterministic part, which includes the observable person-specific variables

where n is the individual and
Measurement Model
The measurement model utilizes five seven-point Likert scale questions as indicators and relates the latent variable “Intermodallers” with the indicators IIntermodallers, as presented in Equation 2:

where
Choice Model
The last component of the model corresponds to the choice model, which estimates the probability that an individual will choose a specific MaaS plan. It is assumed that the alternatives with larger utility are more likely to be chosen by the respondents. The equation of the utility function can be written in a general form, as given in Equation 3, and is estimated for each specific MaaS plan alternative.

where
The choice model is assumed to be based on utility maximization:

The likelihood function of the model to be maximized is defined as:
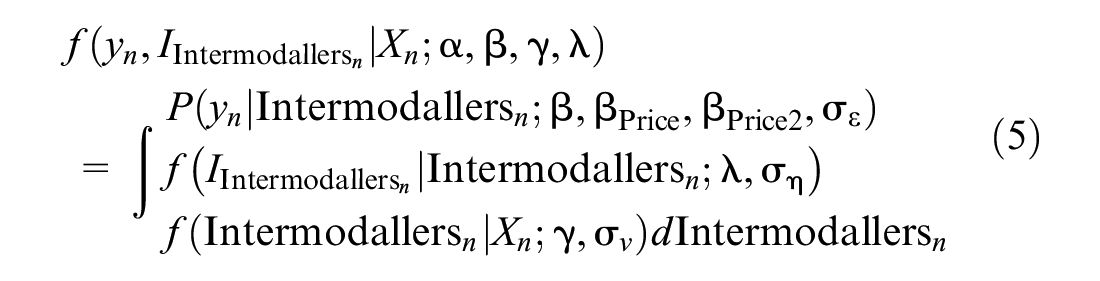
The likelihood function is integrated over the distribution of α, β, γ, λ. The model is estimated using pythonbiogeme ( 37 ).
Research Approach
The survey was distributed to the respondents through an online platform and was comprised of two parts: a section on socio-demographic, habitual travel patterns, and attitudinal data and a section with several SP experiments for MaaS products. The survey was launched as part of the MaaS4EU project, which is an ongoing research and development project funded by the European Horizon2020 research and innovation program. More information on the survey structure and its content can be found in MaaS4EU, Market Research Survey Tool (Wave 1) (2018) ( 38 ). The data presented in this paper were collected in Manchester, UK, and include socio-demographic characteristics, attitudes, and SP experiment responses from 449 individuals.
The use of SP experiments to understand and model decision making for innovative travel products and services has been extensive in the past decades ( 39 , 40 ). However, the survey design techniques applied so far introduce challenges when it comes to representing “real-life market situations.” The main issues include the lack of familiarity of respondents with the presented products, and the potential introduction of scenarios that do not correspond to actual market conditions or user specific preferences ( 41 ). In this survey, within the menu-based SP experiment, the respondents were asked to indicate their ideal MaaS package, with choices including various transport models, such as public transport, car sharing, taxi, and bike sharing options. The chosen MaaS package was then allocated a specific price. This price depends on the package structure and components—with attribute prices varying from one experiment to another. Base prices for the different mobility services included in the MaaS packages were derived by analyzing market prices in the Manchester area of the different operating companies (taxi, car sharing, and bike sharing companies); while for public transport the prices charged by Transport for Greater Manchester were employed. The respondents, then, reviewed their chosen plan with its respective price and made the final decision on whether to purchase the plan or not. The respondents who indicated that they would not purchase the package based on the final price also reported the maximum price they would be willing to pay for the package they created.
An indicative example of the presented menu-based SP experiment is shown in Figure 2, which illustrates the choice of a customized MaaS plan that includes 1 month of unlimited use of public transportation, no bike sharing, three taxi trips, and 5 h of car sharing. Each respondent was presented with two consecutive experiment screens to create their ideal plan, with varying prices of different attributes.
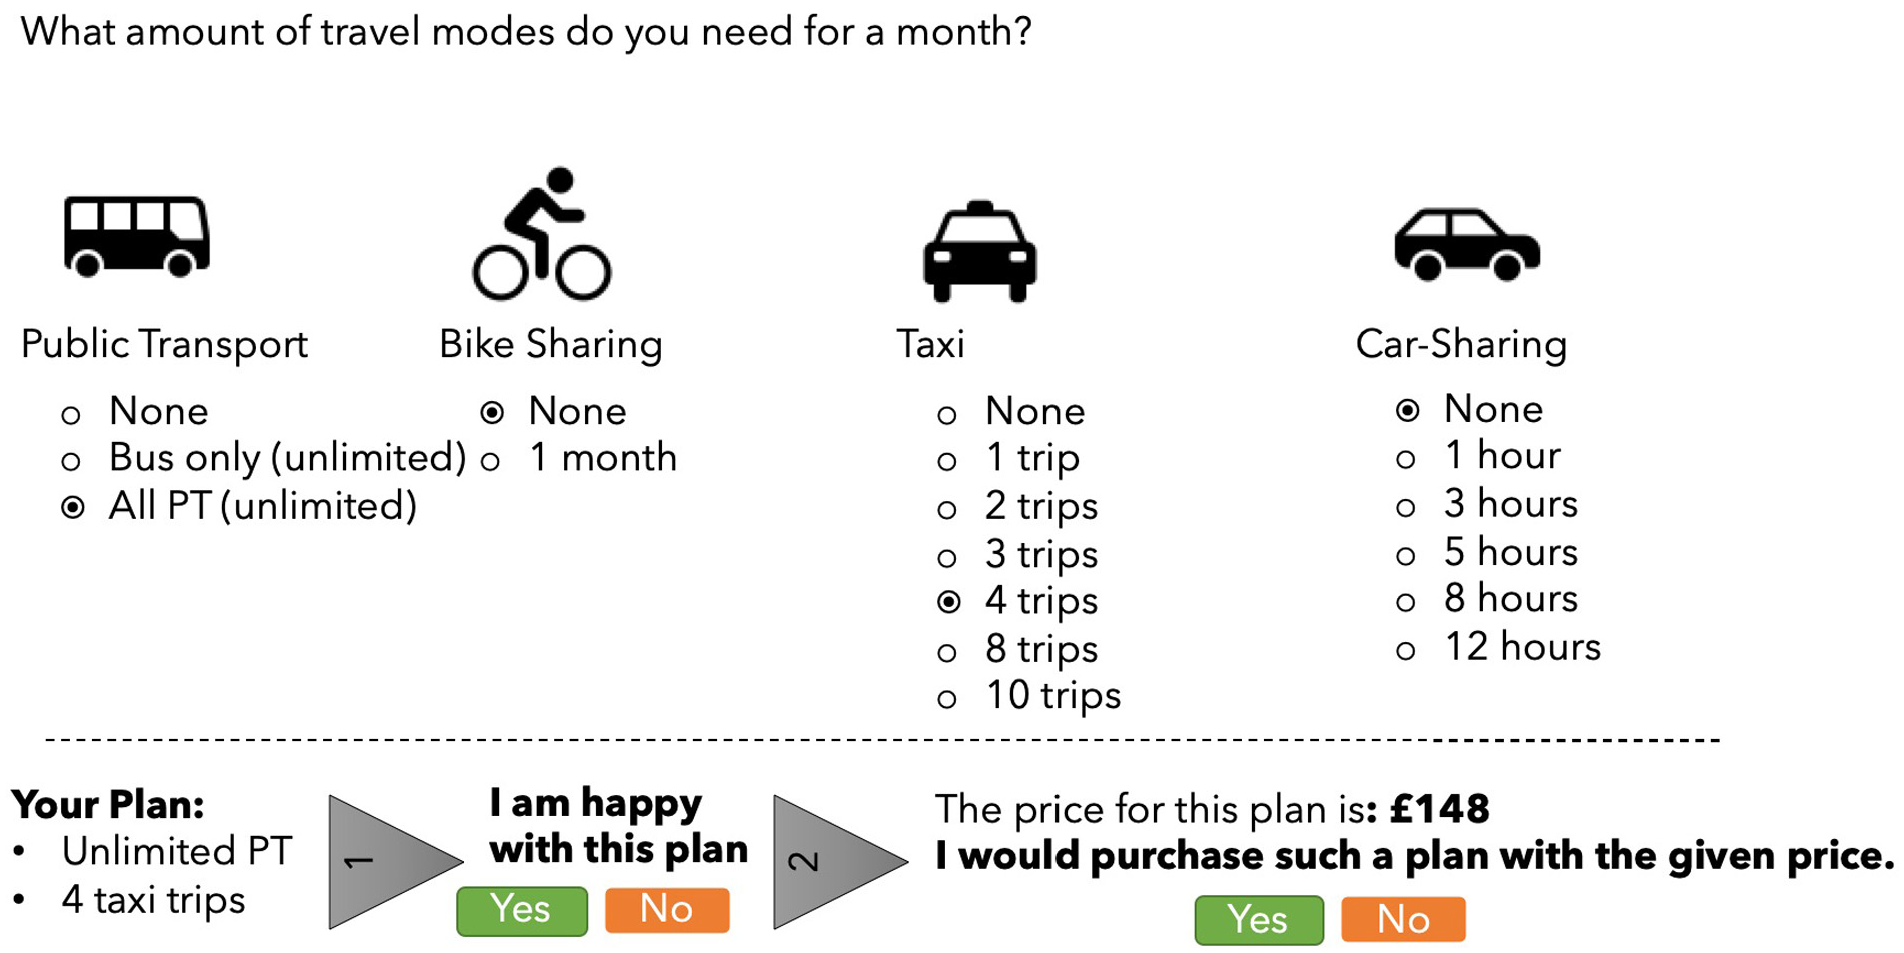
Indicative example of the menu-based stated preferences experiment.
Sample Characteristics
Table 1 presents the descriptive statistics of the sample from Manchester. Overall, the mean age of the respondents is 40.2 years old and the sample is slightly skewed toward males. Most of the respondents report full-time employment, with 7.5% students and 5.8% retirees. Almost 21% of the sample hold a university degree, which is relatively high compared with population means across the European Union (on average 40% of the population aged 30–34 attended tertiary education in the EU, 48% in the UK [42]). The sample is divided equally among respondents who state they have strict working hours and those with complete flexibility in their working hours.
Sample Descriptive Statistics
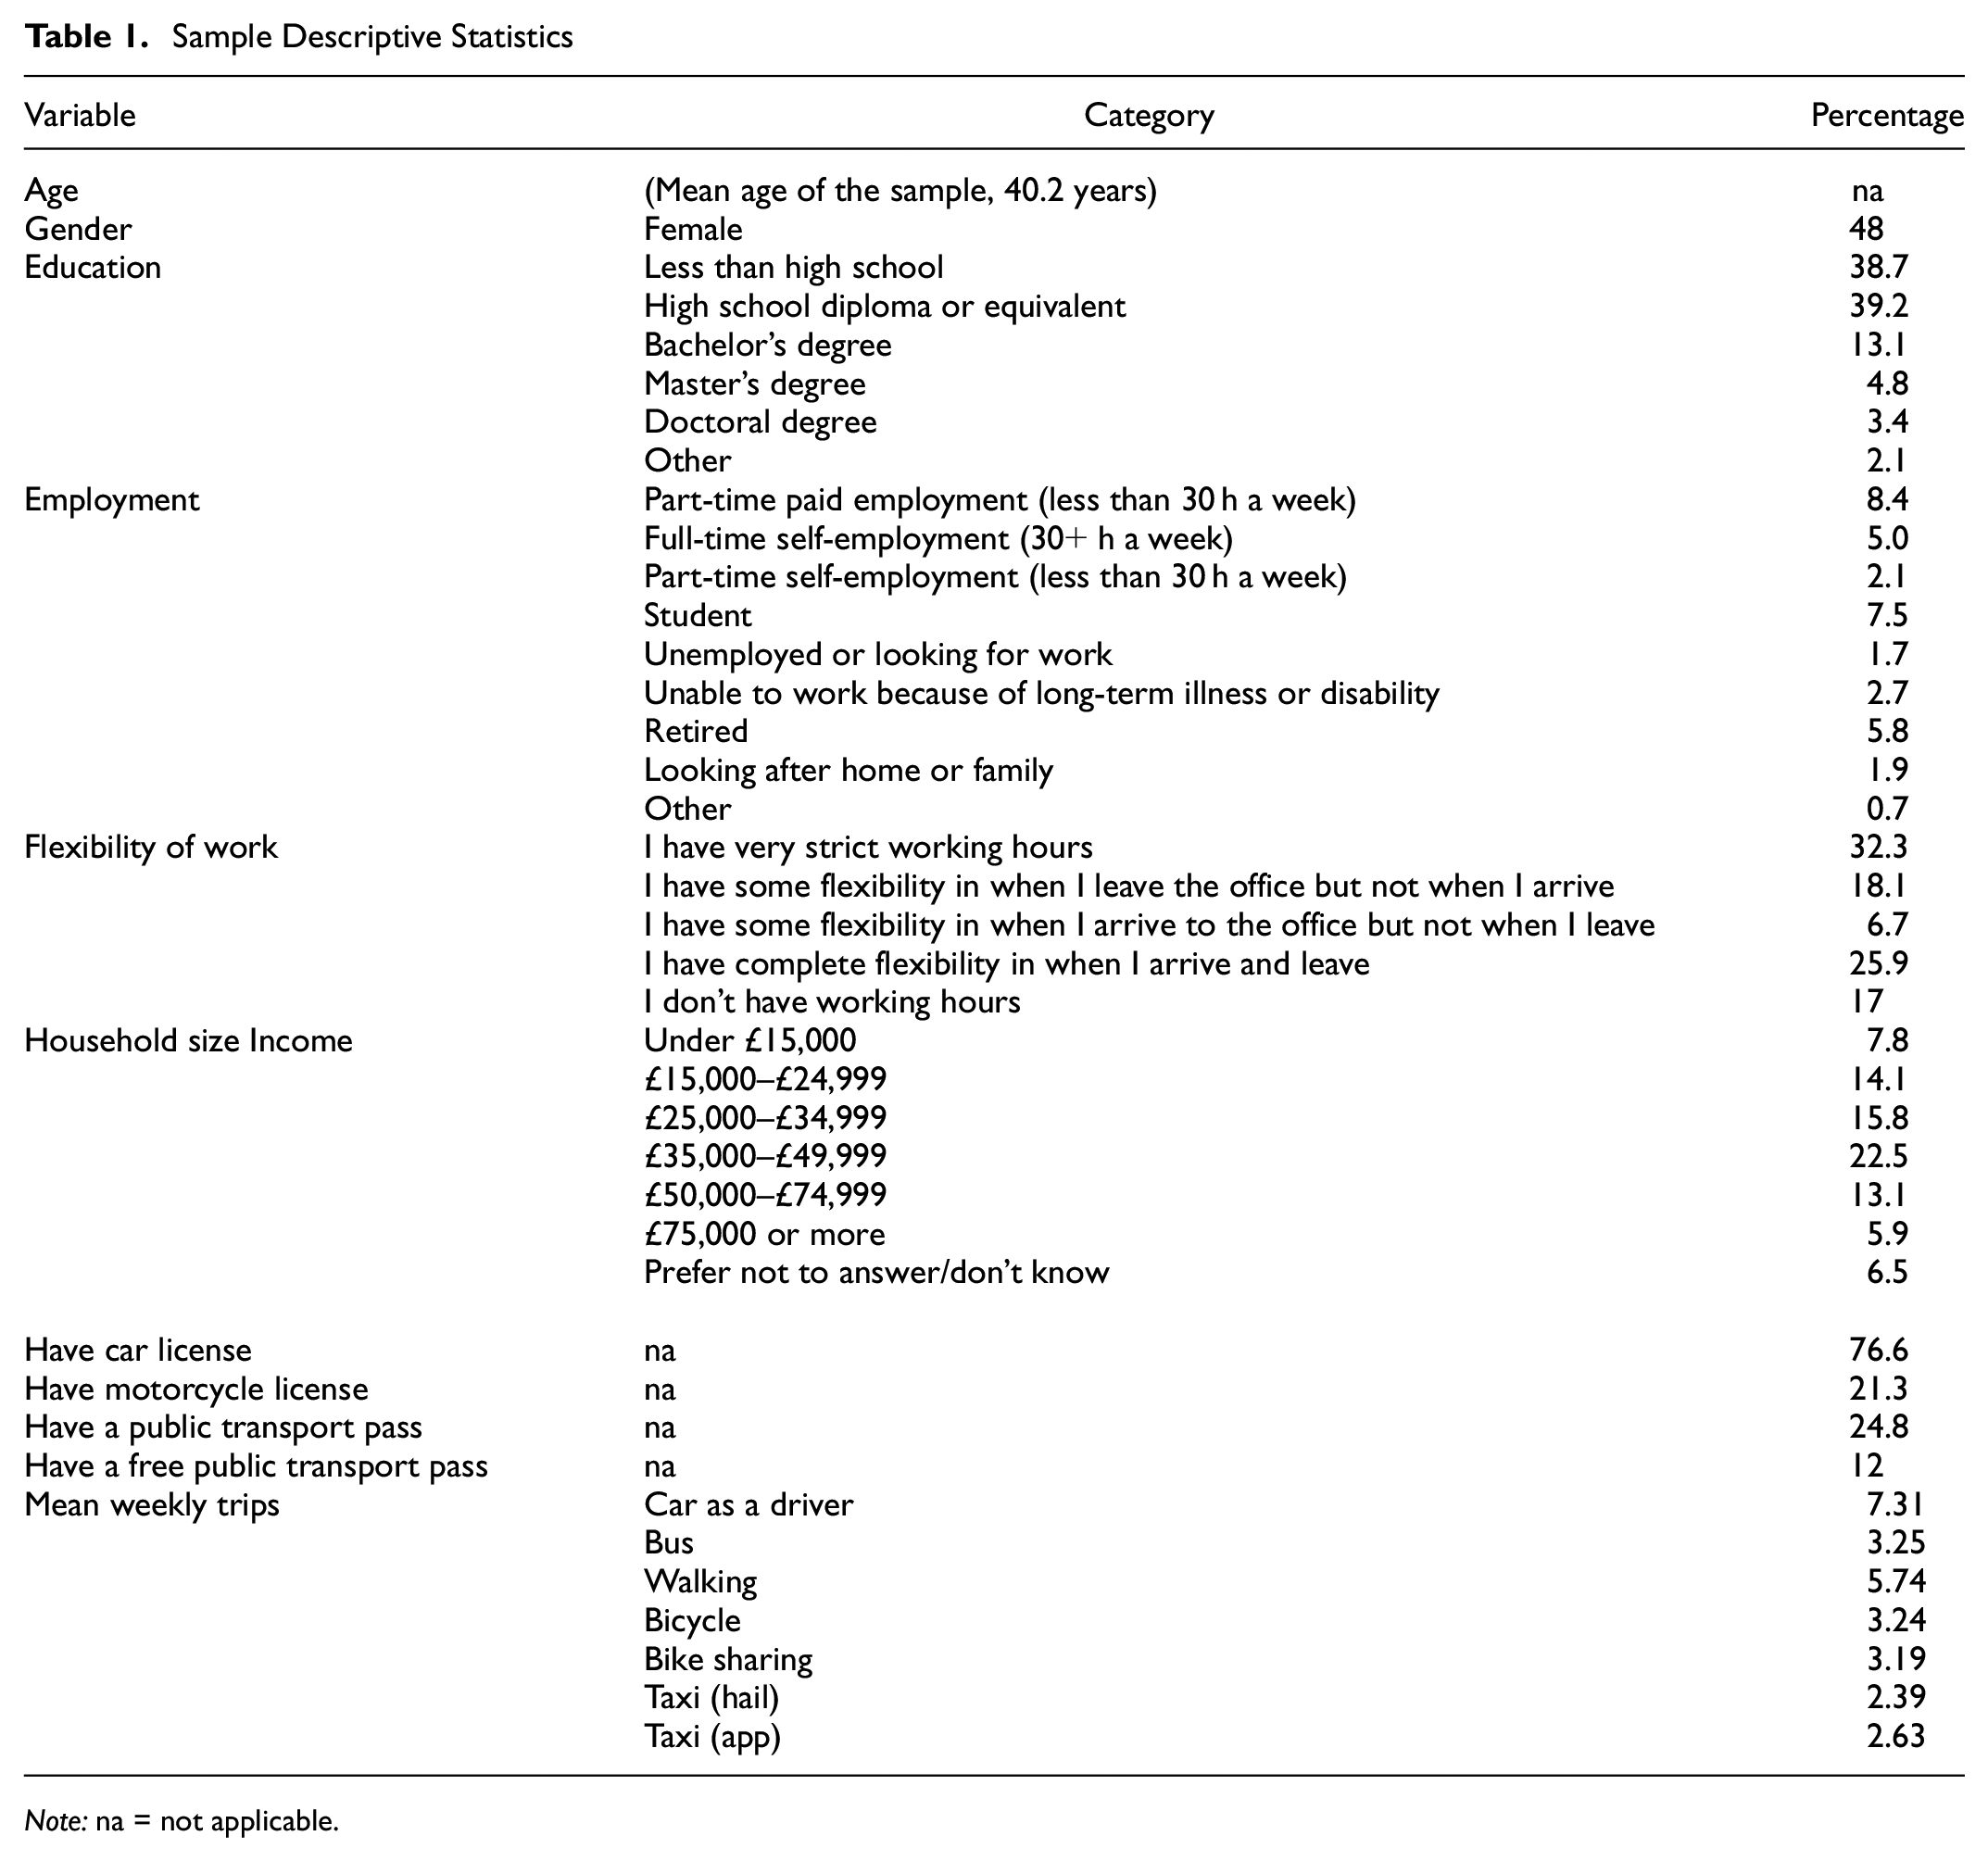
Note: na = not applicable.
With regard to the mobility-related questions, almost four out of five respondents have a car driving license, while less than one out of five have a motorcycle license. One quarter (24.8%) of the sample have a public transport pass, one third of whom have a free pass. In relation to their mobility habits, the respondents reported on a weekly basis average 7.3 car trips, 3.3 bus trips, 5.7 walk trips, 3.2 cycle trips, 3.2 bike sharing trips, and 2.4 ride-hailing taxi trips and 2.6 taxi trips by ordering the ride through an app.
Model Estimation Results
The MaaS packages created by the respondents vary based on: (a) the combination of the mobility services (i.e., public transport, taxi, car sharing, bike sharing) in each plan; and (b) the level of the mobility offerings for each mode (hours of car sharing, number of taxi trips, limited or unlimited use of public transport, etc.).
The levels of the mobility services offered are as follows:
Public transport—three levels: (i) no public transport; (ii) bus only (basic plan); and (iii) 1 month of unlimited public transport (unlimited plan);
Bike sharing—two levels: (i) yes and (ii) no;
Car sharing—six levels (hours of car sharing per month): (i) 0 h; (ii) 1 h; (iii) 3 h; (iv) 5 h; (v) 8 h; and (vi) 12 h;
Taxi—seven levels (number of taxi trips per month): (i) 0 trips; (ii) 1 trip; (iii) 2 trips; (iv) 3 trips; (v) trips; (vi) 8 trips; and (vii) 10 trips.
One approach in relation to the model specification would be to create utility functions corresponding to the full factorial design, creating 3 × 2 × 6 × 7 = 252 different utility functions with most of them having the same level of public transport and variance based on a single additional taxi trip or car sharing hour. However, this approach is impractical for two main reasons: (a) it leads to many alternatives that are not chosen by anyone and subsequently, will have to be removed from the model; (b) the main competitor of most plans is the none option (chosen from 286 out of the 449).
For the above reasons, the alternatives were reduced to 15 by removing unpopular alternatives (i.e., those chosen by very few respondents). These alternatives are presented in Figure 3. The numbers in the last row of the table indicate the number of mobility services included in each of the MaaS plans.
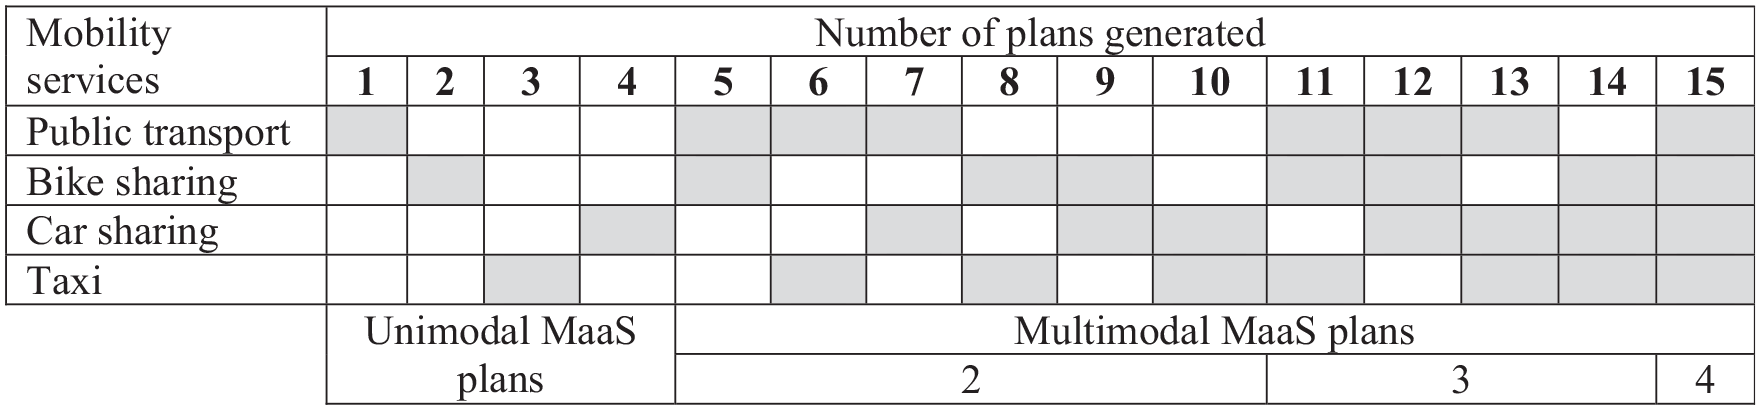
Final MaaS plans created by the respondents.
Structural Equation of the Latent Variable: Estimation Results
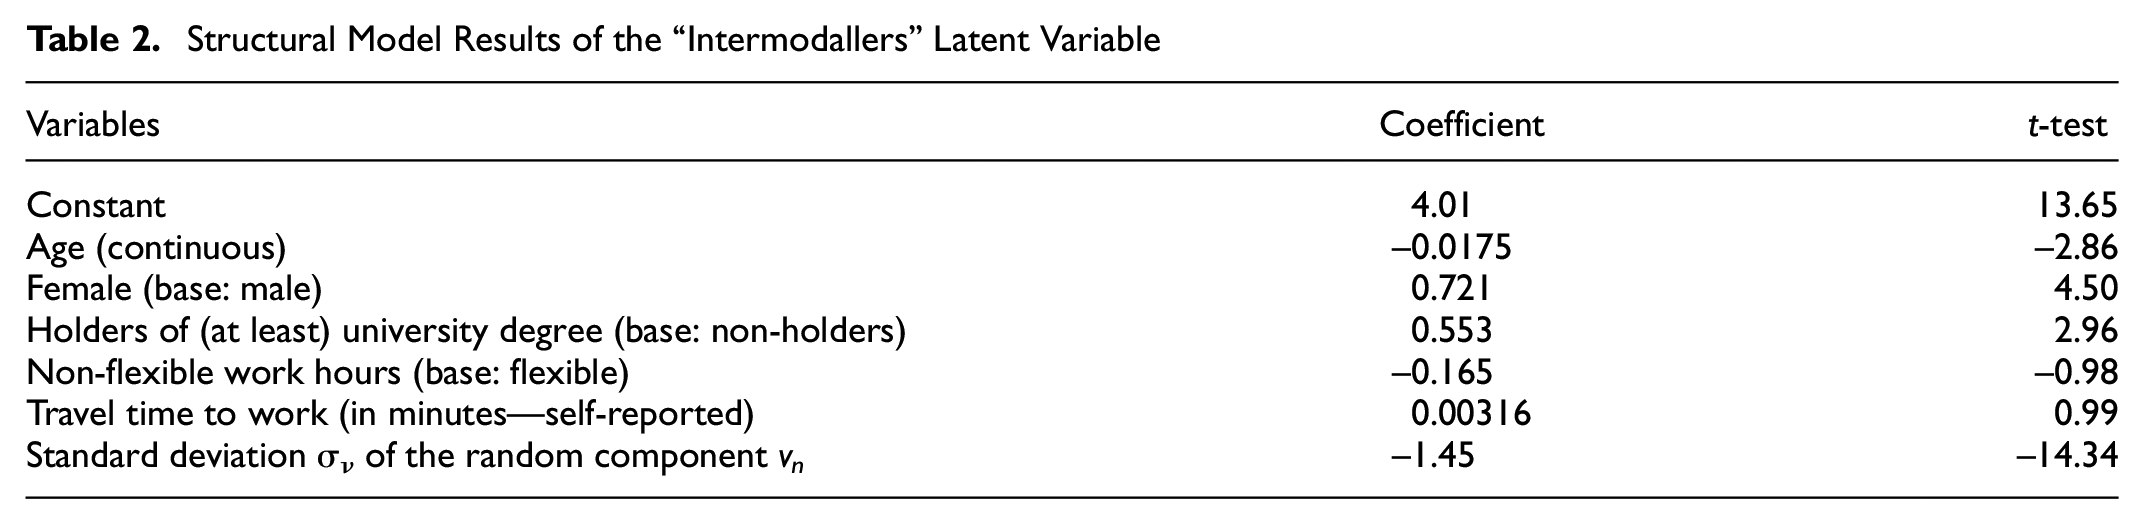
Table 2 presents the estimation results of the structural model equation of the latent variable model. The results indicate that younger individuals, females, and holders of at least a bachelor’s degree are more likely to be Intermodallers. On the other hand, work flexibility (temporal) and travel time to work (self-reported) did not seem to affect the latent variable.
Structural Model Results of the “Intermodallers” Latent Variable
Measurement Equation of “Intermodallers” Latent Variable: Estimation Results
Table 3 presents the measurement model estimation results of the latent variable model. The five indicators have the correct signs, which satisfy the measurement of the latent variable. More precisely, as expected, the indicator “If it is faster, I don’t mind transferring between transport modes” has a positive sign. The indicators I2, I3, and I4, which reveal negative preference about transferring between transport modes, have a negative sign.
Measurement Model Results of the “Intermodallers” Latent Variable
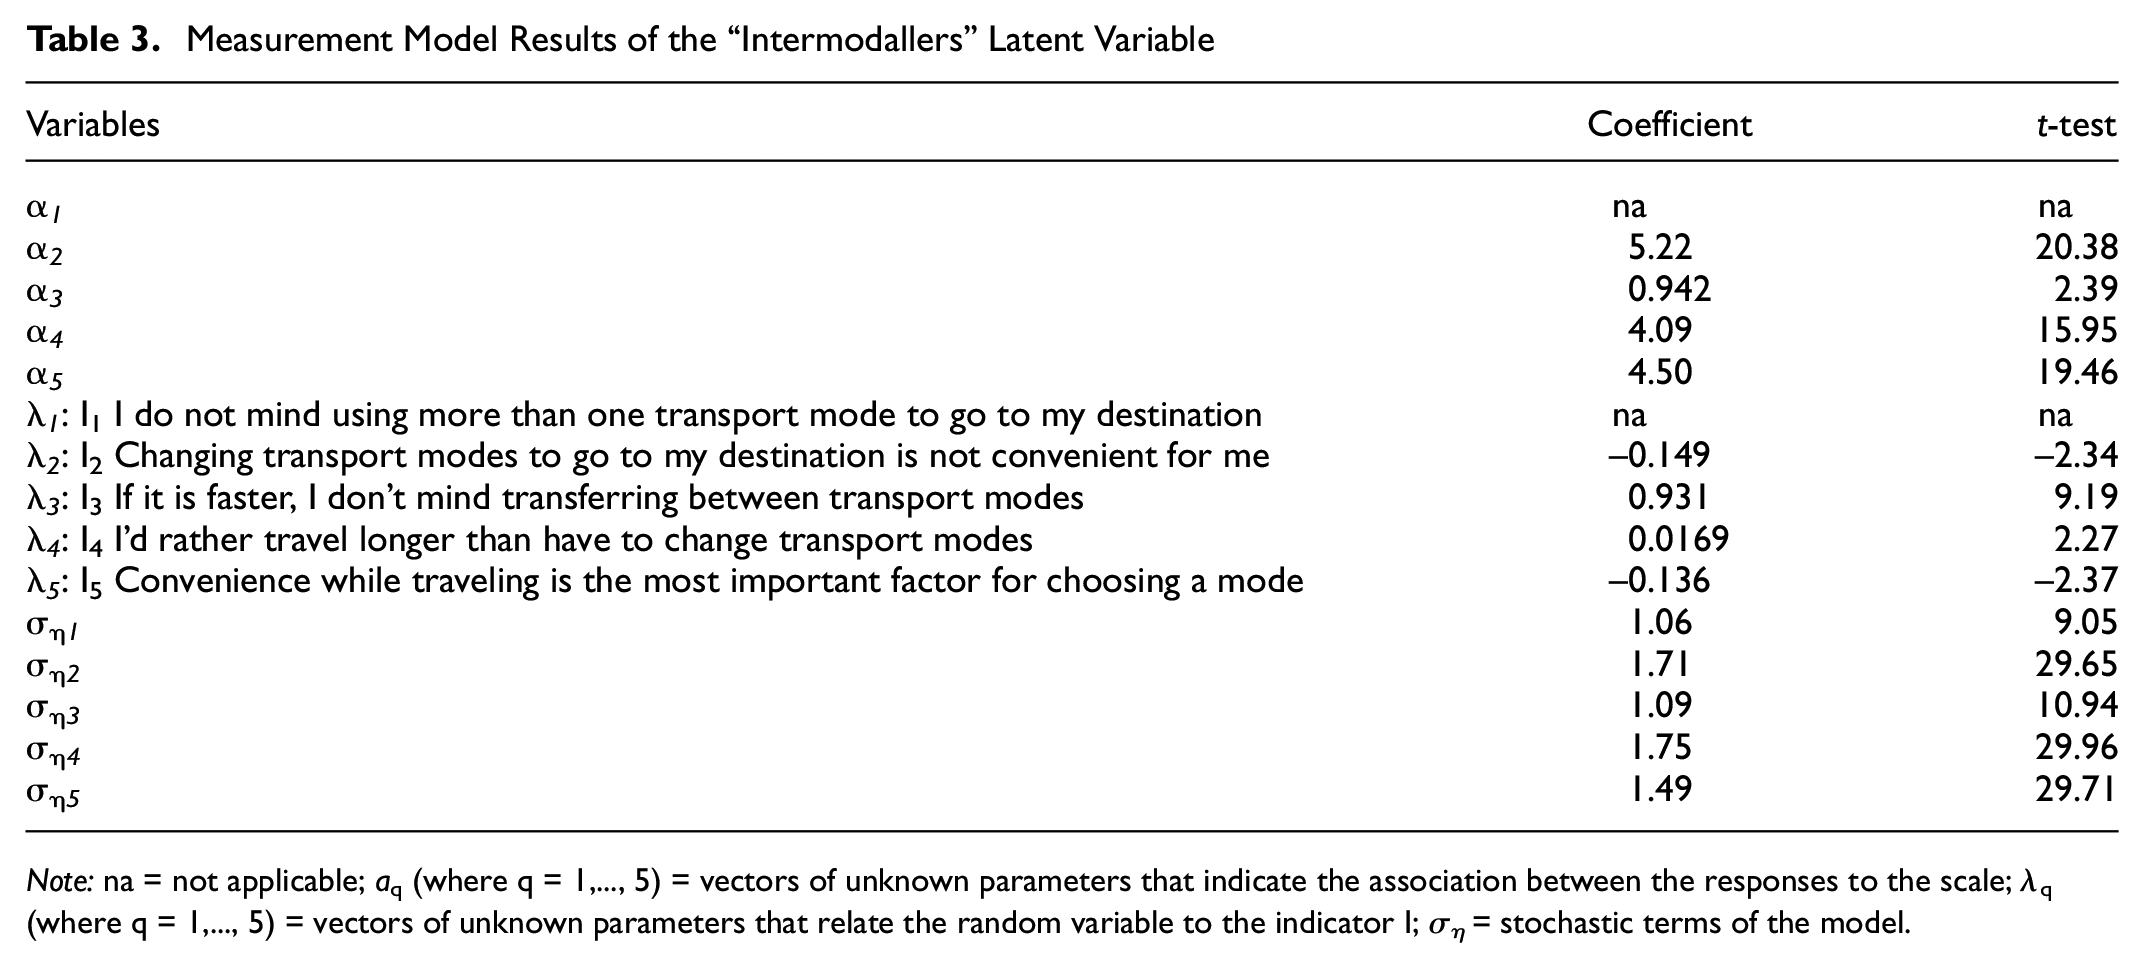
Note: na = not applicable; aq (where q = 1,..., 5) = vectors of unknown parameters that indicate the association between the responses to the scale; λq (where q = 1,..., 5) = vectors of unknown parameters that relate the random variable to the indicator I; ση = stochastic terms of the model.
Choice Model Structural Equation: Estimation Results
Table 4 presents the estimation results of the choice model, where the alternative specific coefficient of each MaaS plan is indicated (the plans are presented in Figure 3). From the negative signs of the alternative specific coefficients, it can be deduced that overall the “none” option (which is the reference alternative) is preferred. This means that while the respondents have created their “ideal” plans during the experiment, most of them were not happy with the price and they decided that they would not buy the constructed plan.
Choice Model Estimation Results
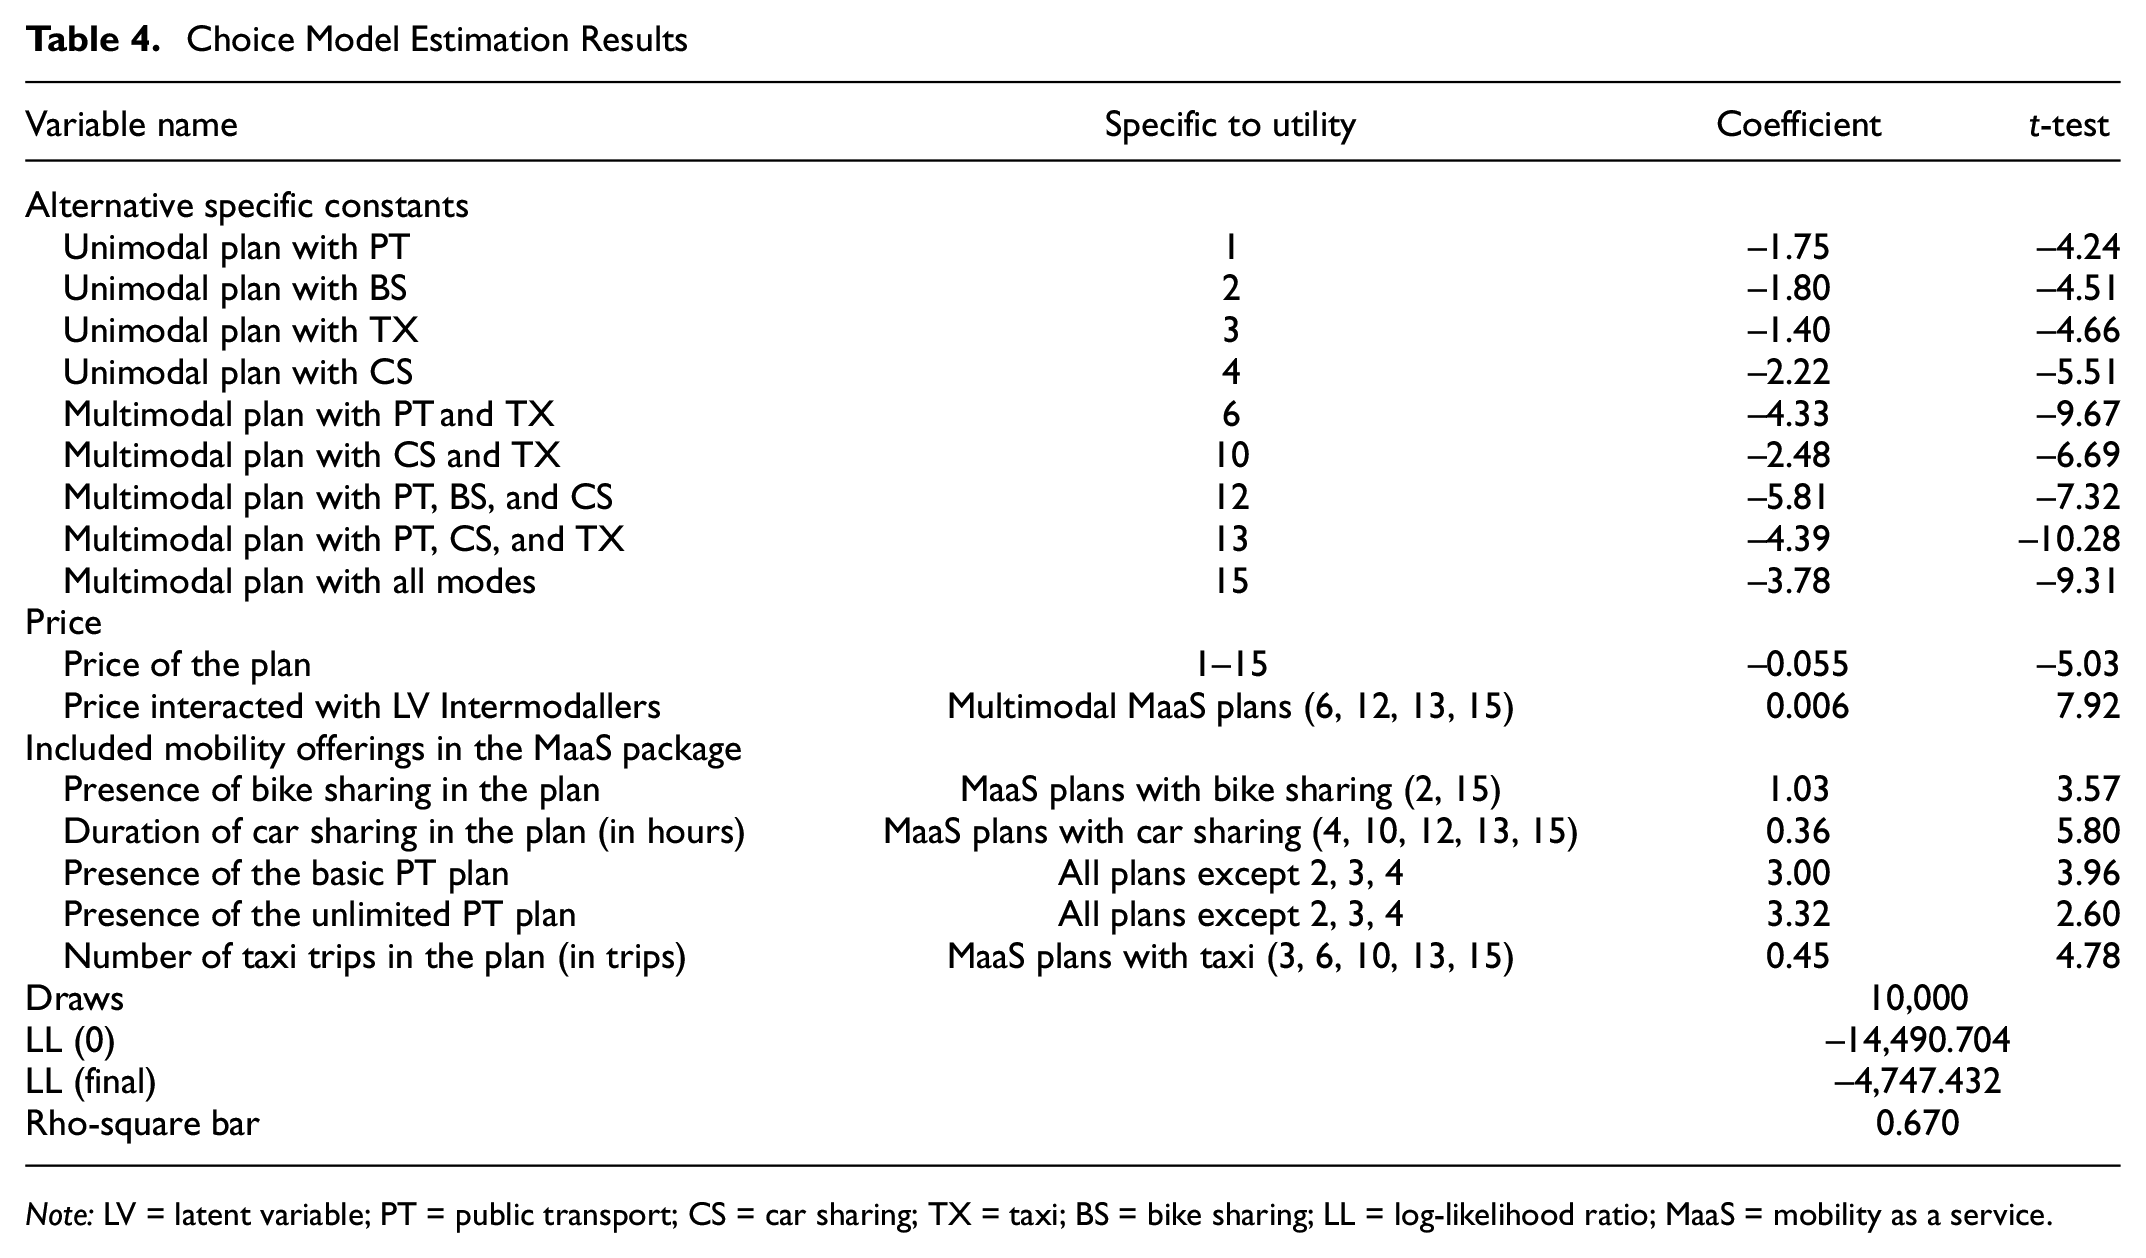
Note: LV = latent variable; PT = public transport; CS = car sharing; TX = taxi; BS = bike sharing; LL = log-likelihood ratio; MaaS = mobility as a service.
Overall the results are as expected and can be interpreted in a meaningful way. The presence of public transport, taxi, car sharing and bike sharing as modules in the plans have positive signs and are statistically significant. This means that including such services in a MaaS plan would significantly affect the success of its implementation in a city. Besides, this also explains the configuration of MaaS packages currently being offered by commercial applications, such as Whim. In addition, the coefficient of public transport (which equals 3.33) indicates that it is the core mobility service that should be included in a MaaS plan in Manchester. This result enhances the existing literature findings that public transport is the backbone of MaaS ( 43 , 44 ).
The presence of public transport is explored through two different categorical variables, PT1 and PT2, which represent the basic plan (only bus) and unlimited public transport plans. Absence of the public transport module from the plan is used as the base.
The presence of bike sharing (specific to the plans that include bike sharing) is also statistically significant and positive. The presence of the bike sharing service is measured as a dummy variable, interacted with frequent cyclists (over three cycling trips per week). Car sharing and taxi are measured with continuous variables, in hours of car sharing per month and number of taxi trips respectively. The signs of all included mobility services are positive, and their coefficients will be used to determine individuals’ WtP when compared with the coefficients of price (both single and interacted with the latent variable).
Model Application
The modeling approach allows us to calculate distributed WtP based on the latent variable of Intermodallers. The latent variable has a random disturbance, leading to distributed values of WtP. Therefore, in the case of the integrated choice and latent variable model, the distributed values of WtP are estimated based on the following formula:

Figure 4 presents the distributed WtP for the different mobility offerings of the MaaS packages. The (continuous) latent variable is split into four distinct categories resulting in different latent variable categories with an almost equal amount of the sample (the sample was split into quartiles). The main trend of the figure is that higher “Intermodallers” categories are willing to pay more for all the specific plans. This finding supports the a priori hypothesis that respondents who are self-regarded as “Intermodallers,” who currently conduct multimodal journeys with frequent mode changes, sacrificing fewer transfers for greater speed (see Table 3 for detailed indicators), are willing to pay more for mobility services included in a MaaS plan. This finding applies across all the considered mobility services (basic public transport, unlimited public transport, car sharing, taxi, and bike sharing) presented in the SP experiments.
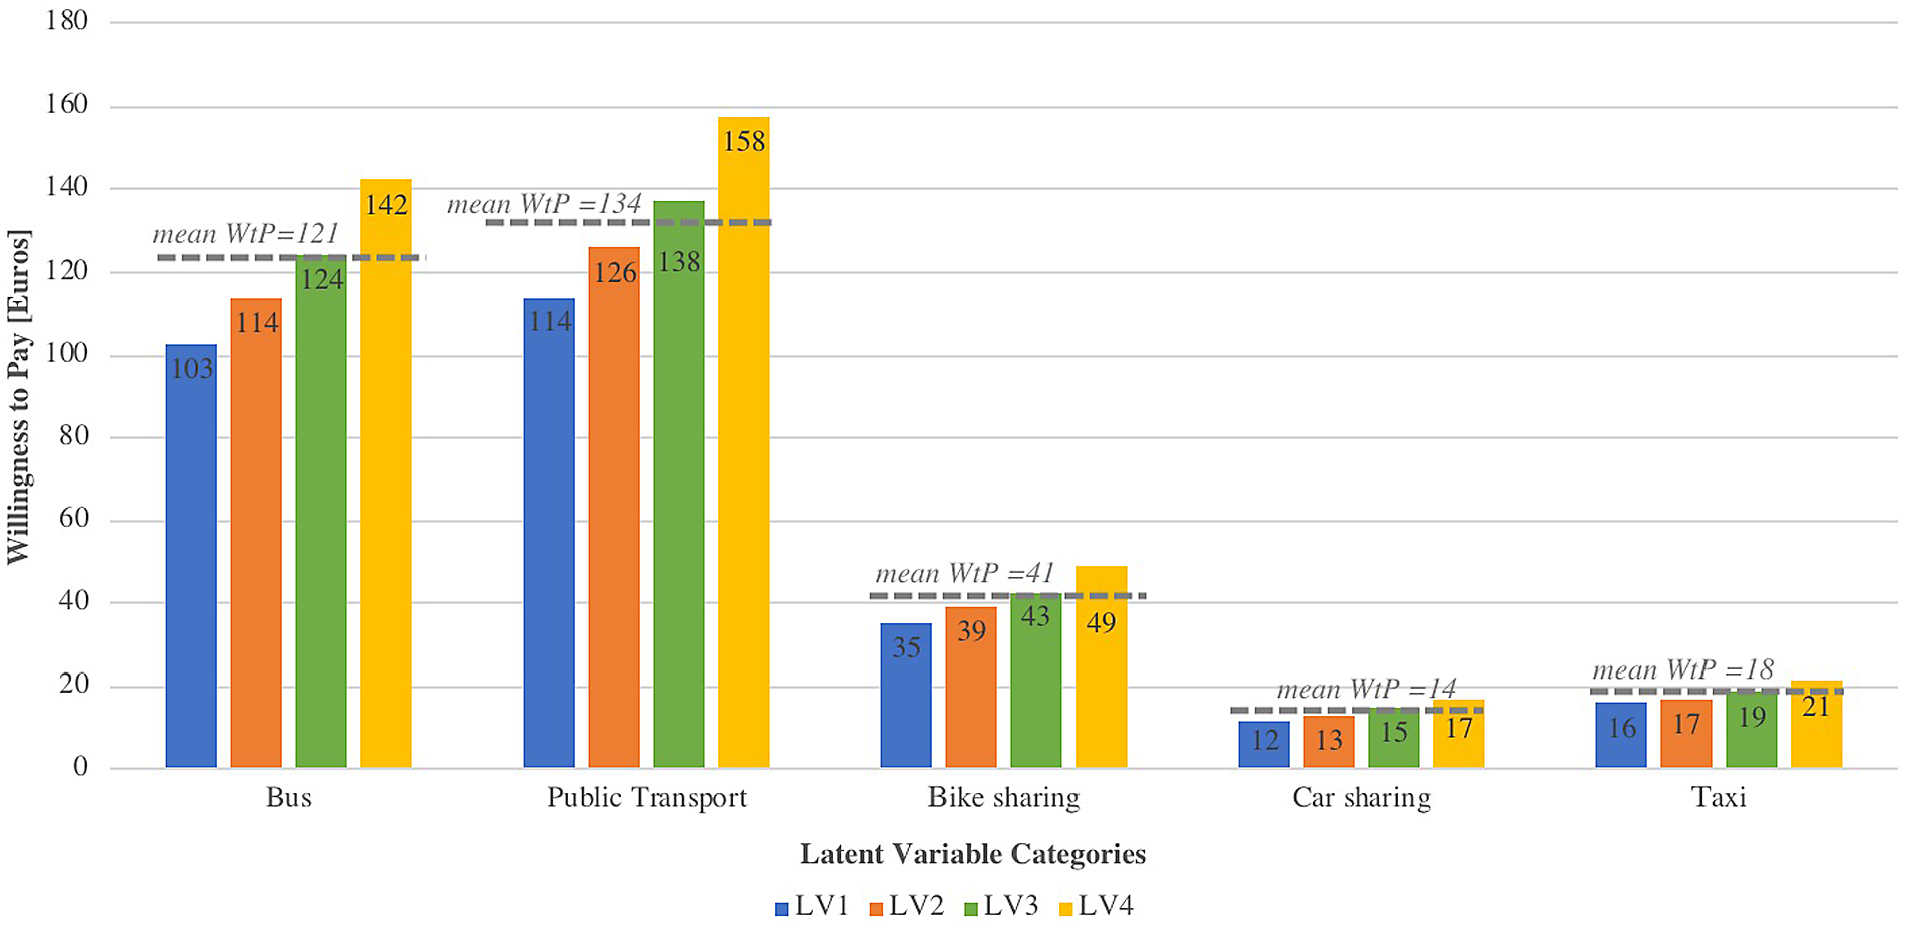
Distributed willingness to pay (WtP) for the mobility offerings of mobility as a service (MaaS).
For each mobility service, the WtP averaged for all latent variable categories can be calculated. More specifically, it is estimated that individuals are willing to pay 121€ for the basic public transport service, 134€ for unlimited use of public transport, 14€ for an additional hour of car sharing, 18€ for an additional taxi trip, and 41€ for unlimited access to bike sharing as part of a monthly MaaS plan. An interesting point is the difference between the public transport plan including only bus and the unlimited public transport plan; a result that stresses the importance and the preference of users toward bus, which seems to be the backbone of public transport in Manchester. The current price for a monthly bus pass in Manchester is 65.00 GBP (73€), which is lower than the estimated WtP, while a monthly pass for bus and tram costs 125.00 GBP (140€) which is within the WtP ranges for unlimited public transport access. Additionally, Mobike (bike sharing) is currently available in the UK, with prices starting from 9.90 GBP per month (not currently available in Manchester), while 1 h of car sharing could cost around 11€ for a 22-mile trip (which is the average car trip distance in Manchester, based on https://www.numbeo.com/traffic/in/Manchester). Finally, taxi trips vary depending on distance and travel time. Indicative fares for an UberX trip of five, 10, and 15 miles are 9 GBP (10€), 18 GBP (20€), and 25 GBP (28€), respectively.
Given that transport fares and the cost of living vary significantly between different areas in the world, directly comparing WtP findings with the existing literature is a strenuous and delicate task. However, the WtP values estimated in this study do not vary significantly compared with the results from Ho et al. ( 27 ). An additional hour of car sharing in a monthly plan is estimated at almost 6€ per fortnight while this study estimates it at 14€ per month. Unlimited public transport is estimated at 158 € per month in Australia while it is estimated at 134€ per month in this study (the higher bound in WtP estimated here is 158€ per month).
Conclusion
This paper explores individuals’ preferences and WtP for MaaS plans, using data collected through a questionnaire survey conducted in two European cities. More specifically, data from menu-based SP experiments were collected and an integrated choice and latent variable model was estimated. The model estimation results reveal that: (a) there is significant preference for both traditional and innovative mobility services in MaaS plans; (b) significant heterogeneity exists among indiviudals’ WtP for MaaS plans; and (c) the menu-based approach allows for a detailed estimation of unitary WtP (for example, for an additional hour of car sharing service included in a monthly MaaS plan). The latter finding is important as it enables the computation of WtP for monthly bundled services that include different mobility services and levels of offerings (number of taxi rides, hours of car sharing, etc.) and the synthesis of detailed MaaS plans with realistic price ranges based on WtP.
Given that the research work on demand for MaaS is still limited, with estimation of WtP confined to a few papers (21, 22, 27–30), the main contribution of this research is that it provides insights into the demand analysis for MaaS and explores a different SP and modeling framework to capture detailed information about price sensitivity for modules of MaaS plans, detailed WtP, and bundling preferences.
A main finding of this research is that the users who are self assessed as “Intermodallers,” mostly people who state they have no issue switching between modes for a trip if the trip is faster or more efficient overall, are willing to pay more for MaaS services. This finding, while expected and logical, may contradict similar research findings such as the work of Feneri et al. ( 22 ) who found that car drivers and passengers are less willing to continue using their private vehicle when presented with a MaaS option; the authors recognize though that the sample used has already declared a high interest in MaaS. Contradictions like this reveal the need for additional exploration of user preferences and segmentation in relation to demand for MaaS.
A limitation of this study is the omission to include a different mode for transportation network companies (TNCs) (e.g., Uber, Lyft) in the stated preference experiment. The experiment presents taxi as a single option, without including TNCs. This omission may have hindered our ability to explore user preferences in relation to TNCs, as the literature reveals that significant heterogeneity exists between user preferences and choices between taxi and TNCs ( 45 ). Given that this study provides distributed WtP values for taxi as a mode, the authors assume that respondents may include potential TNC users.
The usage of a menu-based SP experiment revealed both advantages and drawbacks in this analysis. On the one hand, the menu-based approach, differing from a conventional SP design approach, results in parameter estimations only for the respondents who have actually demonstrated preference for specific services. For example, the parameter estimation for bike sharing is based on respondents who have choosen bike sharing as a mode in their plan. This fact could potentially lead to higher estimation of WtP values. On the other hand, the menu-based SP experiment provides a useful platform which is very similar to “create-your-own” plan services provided by mobility service companies, simulating the environment in which the potential user takes decisions, thus resulting in a more realistic modeling of user choices. Comparing the usage of a menu-based and a traditional SP design to model MaaS could be an interesting direction for future research.
The findings of this paper would be useful for potential, future MaaS operators or mobility service providers that would like to participate in a MaaS scheme. More specifically, the results provide interesting insights into individuals’ preferences about the mobility services offered in the MaaS bundled plans, while the estimated values of the distributed WtP provide significant evidence on the prices that could be set for each mobility offering in a MaaS package. Thus, this model could supplement the decision-making tools used by the MaaS actors to define their pricing strategy in MaaS.
Further work will focus on validating the findings of this research utilizing revealed preferences data from actual MaaS implementations. As part of the MaaS4EU project, a second wave of data collection is planned where the actual choices of individuals will be recorded during scheduled pilot demonstrations. The findings of such real-life experiments will be used to analyze the individuals’ actual choices and preferences toward MaaS. Finally, considering the sample size and the area/country coverage of this study, an interesting extension of the authors’ work would be to acquire data from more countries, with different characteristics, cultures, and individuals’ habits. This could give a more representative overall picture of WtP and user preferences toward MaaS.
Footnotes
Author Contributions
The authors confirm contribution to the paper as follows: study conception and design: A. Polydoropoulou, I. Tsouros, I. Pagoni, A. Tsirimpa; data collection: I. Tsouros; analysis and interpretation of results: I. Tsouros, I. Pagoni, A. Tsirimpa; draft manuscript preparation: I. Tsouros, I. Pagoni, A. Tsirimpa. All authors reviewed the results and approved the final version of the manuscript.
Declaration of Conflicting Interests
The author(s) declared no potential conflicts of interest with respect to the research, authorship, and/or publication of this article.
Funding
The author(s) disclosed receipt of the following financial support for the research, authorship, and/or publication of this article: This research is part of the Project “MaaS4EU” (End-to-End Approach for Mobility-as-a-Service tools, business models, enabling framework and evidence for European seamless mobility). This project has received funding from the European Union’s Horizon 2020 research and innovation programme under grant agreement No. 723176.
This paper reflects only the authors’ views and the European Commission is not liable for any use that may be made of the information contained therein.