
Abstract
Rounding errors are often observed in reported trip departure and arrival times in paper-based travel surveys, and most of the reported times are multiples of 5, 15, 30, or 60 min. However, the rounding is rarely systematically analyzed. This study aimed to analyze the rounding of reported departure time in paper-based travel surveys by extending the rounding model proposed by Rietveld in 2002. The model parameters were estimated using the maximum likelihood method with constraints. The data in a 2012 household travel survey in Kumamoto, Japan, was used. The data in Japan were found to be often rounded to 10 min, which contrasted with the frequent rounding to 15 min in the Netherlands and United States. The model estimation results indicated that rounding to 5 and 10 min most often occurred. The response-error distribution when the reported departure time was 30 min was demonstrated using the Bayesian theorem and it was shown that the probabilities in which the actual departure times were exactly 30 min, 25–35 min, and 20–40 min were 7.9%, 63.5%, and 84.3%, respectively. Business trips were found to contain large rounding errors, and most public-transportation trips exhibited smaller rounding errors. These results may be used to refine several travel behavioral models in the future.
Rounding errors are often observed in reported trip departure and arrival times in paper-based travel surveys, and most of the reported times are in multiples of 5, 10, 15, 30, or 60 min. These values are defined as “rounded values” in this study. This rounding can cause a problem because travel times are computed using the departure and arrival times and their error can negatively affect the precision of the mode-choice models and other travel-demand models ( 1 ). The new travel-survey methods that use GPS logger or smartphone devices can be promising methods to overcome the problem of rounding errors, and several researchers have compared self-reported time and GPS-based data (2–9). However, paper-based surveys will remain to be used in the future because large-scale implementation of the new methods is not very easy and some people such as the elderly will prefer to participate in a paper-based survey rather than the new survey method. Hence, examining the rounding errors in self-reported paper-based survey remains an important issue.
A few studies have reported that the trip departure and arrival times were often rounded to 00 and 30 min (10, 11). Bhat and Steed indicated the existence of rounding errors in the departure times of shopping trips ( 12 ). However, systematic analyses of rounding errors have been limited. The error can be different between habitual and non-habitual trips, and travel modes that use timetables can affect the error. Few studies have examined the impacts of travel purpose and travel mode on rounding errors, revealing the research gap. Hence, the present study addresses the following research question: “Does the rounding error differ relative to the travel purpose and travel mode?” This study adopted the modeling framework proposed by Rietveld ( 13 ). He proposed a rounding model that computes the probability that a reported time means an actual time. He examined the rounding errors in the trip departure and arrival times in a mail-based survey in the Netherlands. His model was simple and elegant, but the application of his model was limited. To the authors’ knowledge, no study has applied his model in travel survey data in other countries or investigated the effect of travel purpose and travel mode. Therefore, the present study applied his model to a household travel survey, namely, person trip (PT) survey, in Kumamoto, Japan. The objective of this study is summarized as follows.
To examine the rounding error of the trip departure time in the PT survey in Kumamoto, Japan
To compare the effects of travel purpose and travel mode on the rounding error
As an example of rounding errors in transportation studies, Yamamoto et al. applied a heaping model to the travel distance and attempted to correct the rounding error (14–16). Additionally, it is noteworthy that a rounding error can occur not only in travel surveys but also in the other items in the surveys, such as reported income, smoking behavior, criminal behavior, number of sexual partners, percent chance that some future event may occur, and willingness to pay (17–25). This study attempts to contribute to the literature by empirically investigating the impacts of travel purpose and travel mode on the rounding errors in trip departure times. These findings may contribute to the examination of several rounding errors in social surveys.
Method and Data
Formulation: Rounding Probability
The modeling framework presented in this paper is based on the model developed by Rietveld (
13
). This model was extended in two aspects as explained below. In the original model, when the actual departure time of the respondent is m min, the (conditional) probability of rounding to the nearest multiple of 5 min, namely,

where


where


Here,
In
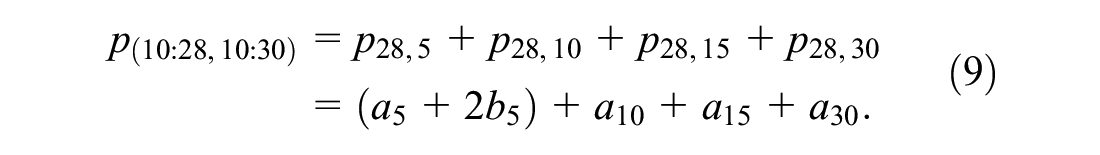
These probabilities may overlap. For example, when the actual departure time is 10:28, the probability of rounding to 10:30,
Please note that two extensions of this model are demonstrated in comparison with the original model: the inclusion of the probability of rounding to a multiple of 10 min, and constant assumption of rounding probabilities in 10–60 min multiples.
Maximum Likelihood Estimation
Assuming that the probability that the respondent actually departs at
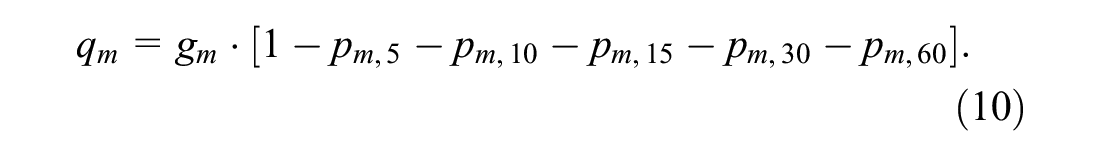
For example, when
On the other hand, when
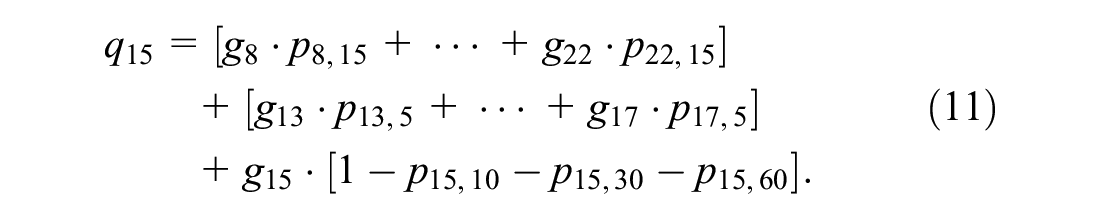
The first right-hand-side terms in Equation 11 represent the sum of the probabilities of actually departing at approximately 15 min and a reported rounded value of 15 min. The first and second terms represent the sum of the rounding probabilities to 15 and 5 min, respectively. The third term represents the product of the probability of actually departing at 15 min and without a rounding probability. In addition, because
Simultaneous probability L is expressed as follows:

where

Because

The parameter estimation can be formulated as a constrained maximum likelihood problem that maximizes Equation 13 while satisfying Equation 14.
This study assumes the uniform distribution of the departure time, which is similar to that of Rietveld (
13
). Thus,
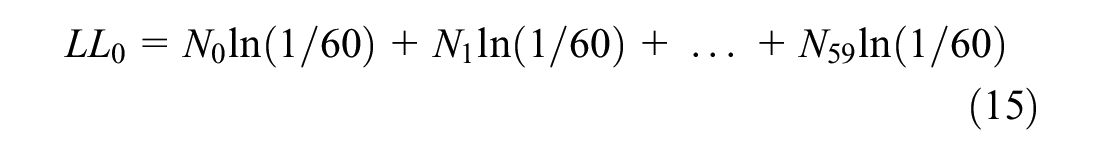
The initial log likelihood is formulated using a null hypothesis that states that “no rounding error exists and the reported time is identical to the actual time.”
Bayesian Inference of the Actual Departure Time
In this subsection, the estimation of the actual departure time from the reported time is introduced, following Rietveld (
13
). If the respondent reported a departure time of m min, the probability that the actual departure time was n min,

where
Data
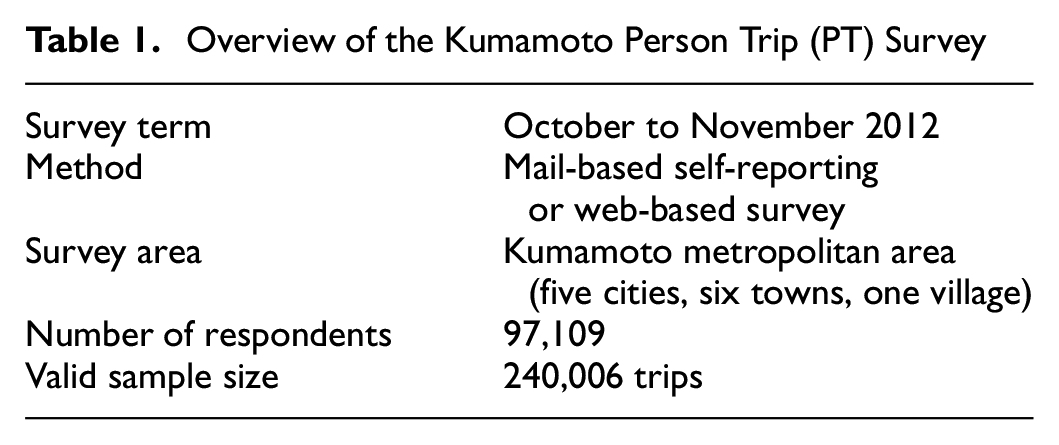
This study used the data of the 2012 Kumamoto PT survey (Table 1). The survey was conducted in the Kumamoto metropolitan area, Japan, which comprised five cities, six towns, and one village, with a population of approximately 1 million. In the Kumamoto PT survey, the data for approximately 270,000 trips were collected from 97,109 respondents. After eliminating the trips with unreported departure times, the valid sample size obtained was 240,006. In this survey, the respondents did not report their travel times, but reported the departure and arrival times for each trip.
Overview of the Kumamoto Person Trip (PT) Survey
Results and Discussion
Distribution of the Departure Time
Figure 1 shows the distribution of the reported departure times in the Kumamoto PT survey. It is observed that 00-min trips show the highest frequency, followed by 30 min, and multiples of 10, 15, and 5 min. The majority of the results are similar to those of the previous studies. However, these results for the 10- and 15-min rounding are different from those by Rietveld ( 13 ). Rietveld demonstrated that trips that started in a multiple of 15 min are dominant in the Netherlands ( 13 ). Meanwhile, trips that started in a multiple of 10 min are dominant in Kumamoto, Japan. It is noted that Kitamura reported that trips that started in a multiple of 15 min are dominant in the United States (U.S.) survey ( 27 ). These findings implied that the concept of “quarter-hour” is prevalent in western countries but not in Japan. The dominant records of the trips that started in multiples of 10 min in Kumamoto led to the extension of the Rietveld original model to include Equation 5.
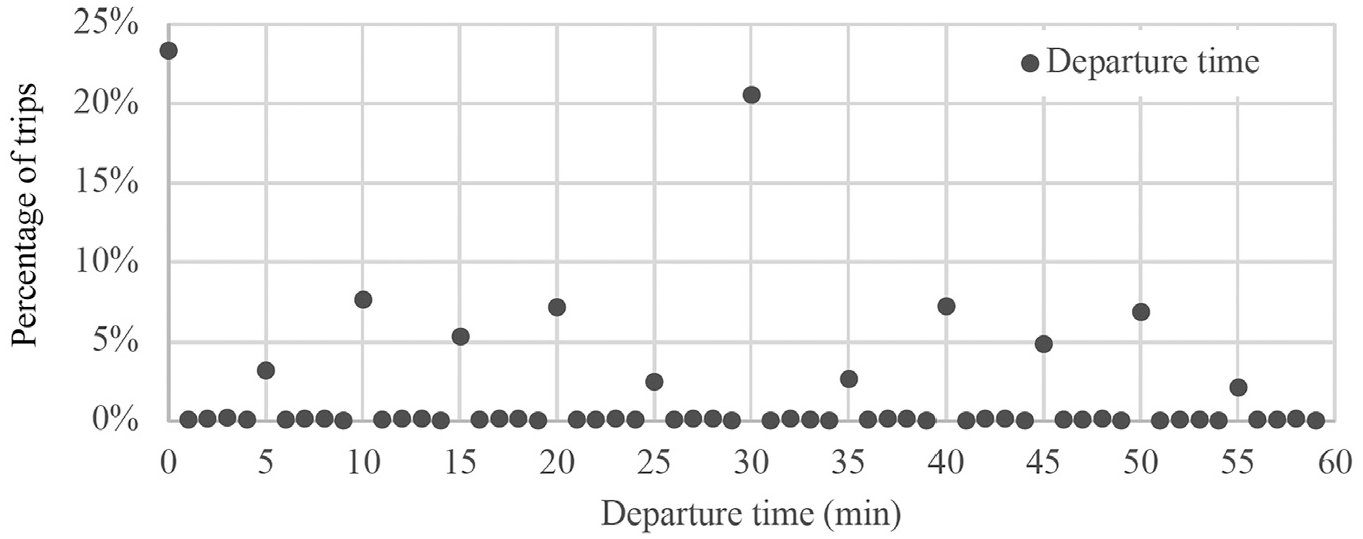
Distribution of the departure times.
Figure 2 depicts the distribution of the departure times in three time periods: morning peak (7:00–9:00), evening peak (17:00–19:00), and off-peak hours (others). The percentage of rounding in 5, 10, or 15-min steps during the morning peak hours is greater than that during the evening peak hours. Because commuting trips are dominant during the morning peak hours, they appear to be reported accurately without significant rounding (e.g., 30 or 60 min). During the off-peak hours, the percentage of rounding to 30 min is greater than that in other periods. In contrast, the percentage of rounding to 00 or 60 min during the off-peak hours is lower than in the morning and evening peak hours. These distributions indicate that the trend of rounding is different in each time period, which may be due to the effect of the travel purpose or travel mode. This effect is investigated using statistical models.
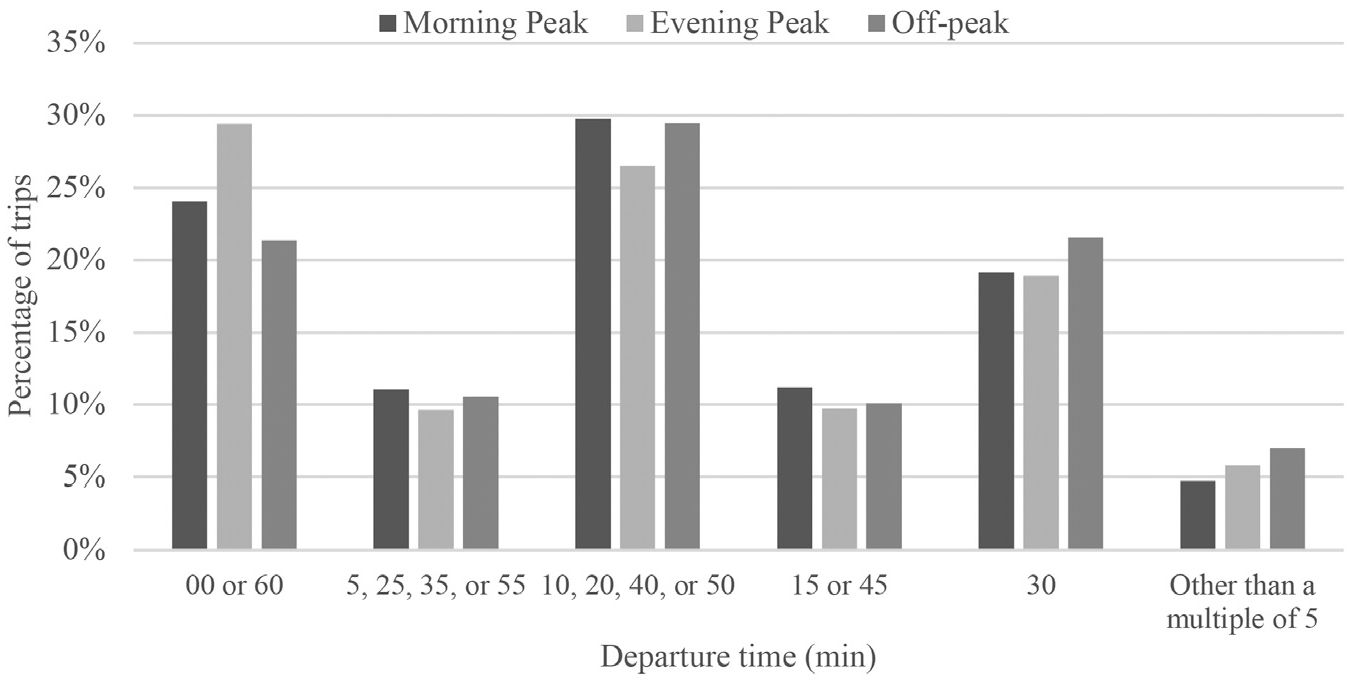
Distribution of departure times: peak versus off-peak hours.
To examine the data trend relating to Equations 1–8, Figure 3 shows the distribution of the sampled trip without rounding in the Kumamoto PT survey. Using the 5-min-step, Figure 3a shows that the distribution is V-shaped. Based on Equations 1–4, the closer the departure time is to the target time, the higher is the rounding probability. Meanwhile, a different trend was observed in the 10-min step (Figure 3b). This result indicates that the distance to the target time was unlikely to affect the rounding probability in the 10-min interval. Although the details are omitted here, similar trends were observed in the 15-, 30-, and 60-min intervals. Thus, the constant assumption of rounding probabilities to 10–60 min is adopted in the proposed model (i.e., Equations 5–8).
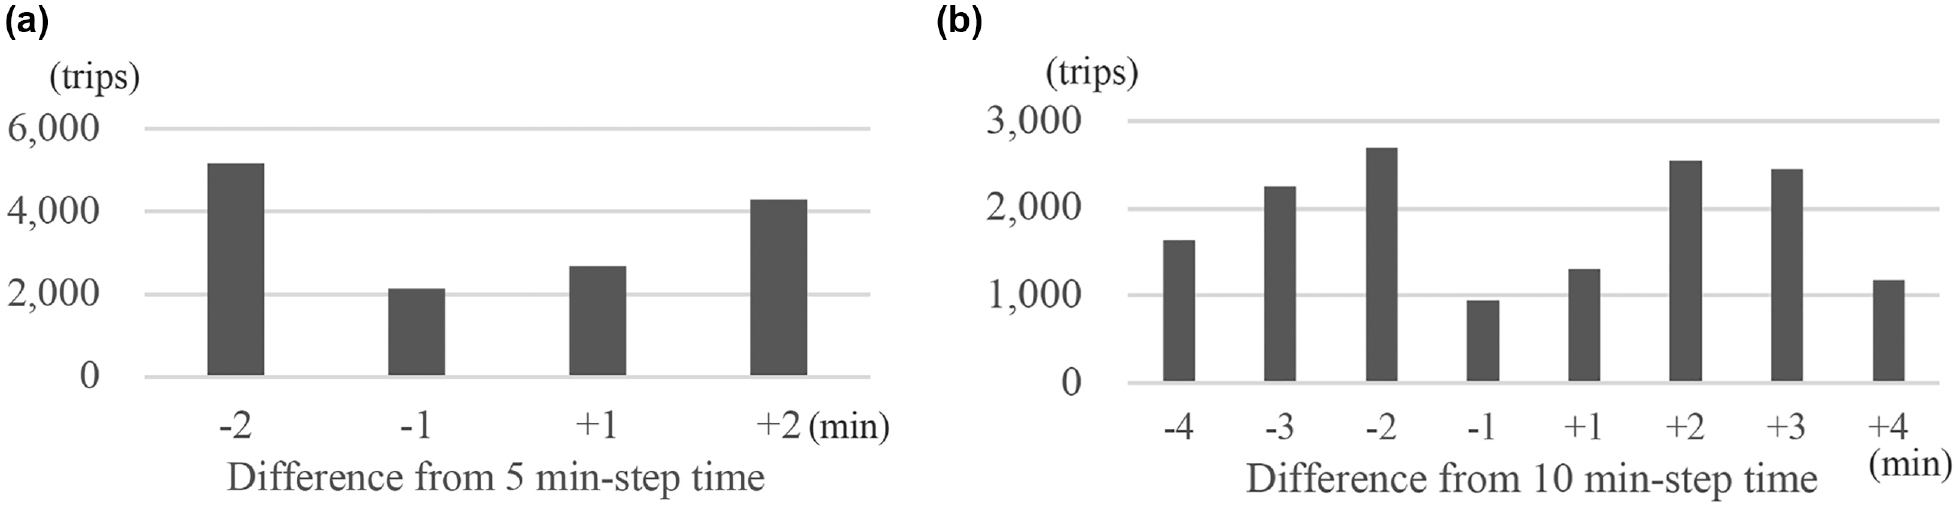
Distribution of the departure time (without rounding): (a) 5-min steps and (b) 10-min steps.
Estimation Results of the Rounding Model
Table 2 lists the three estimation results: (a) the proposed model using the Kumamoto data, (b) the original model using the Kumamoto data, and (c) the original model using the Netherlands data (
13
). The likelihood ratio test using
Estimation Result of the Rounding Model
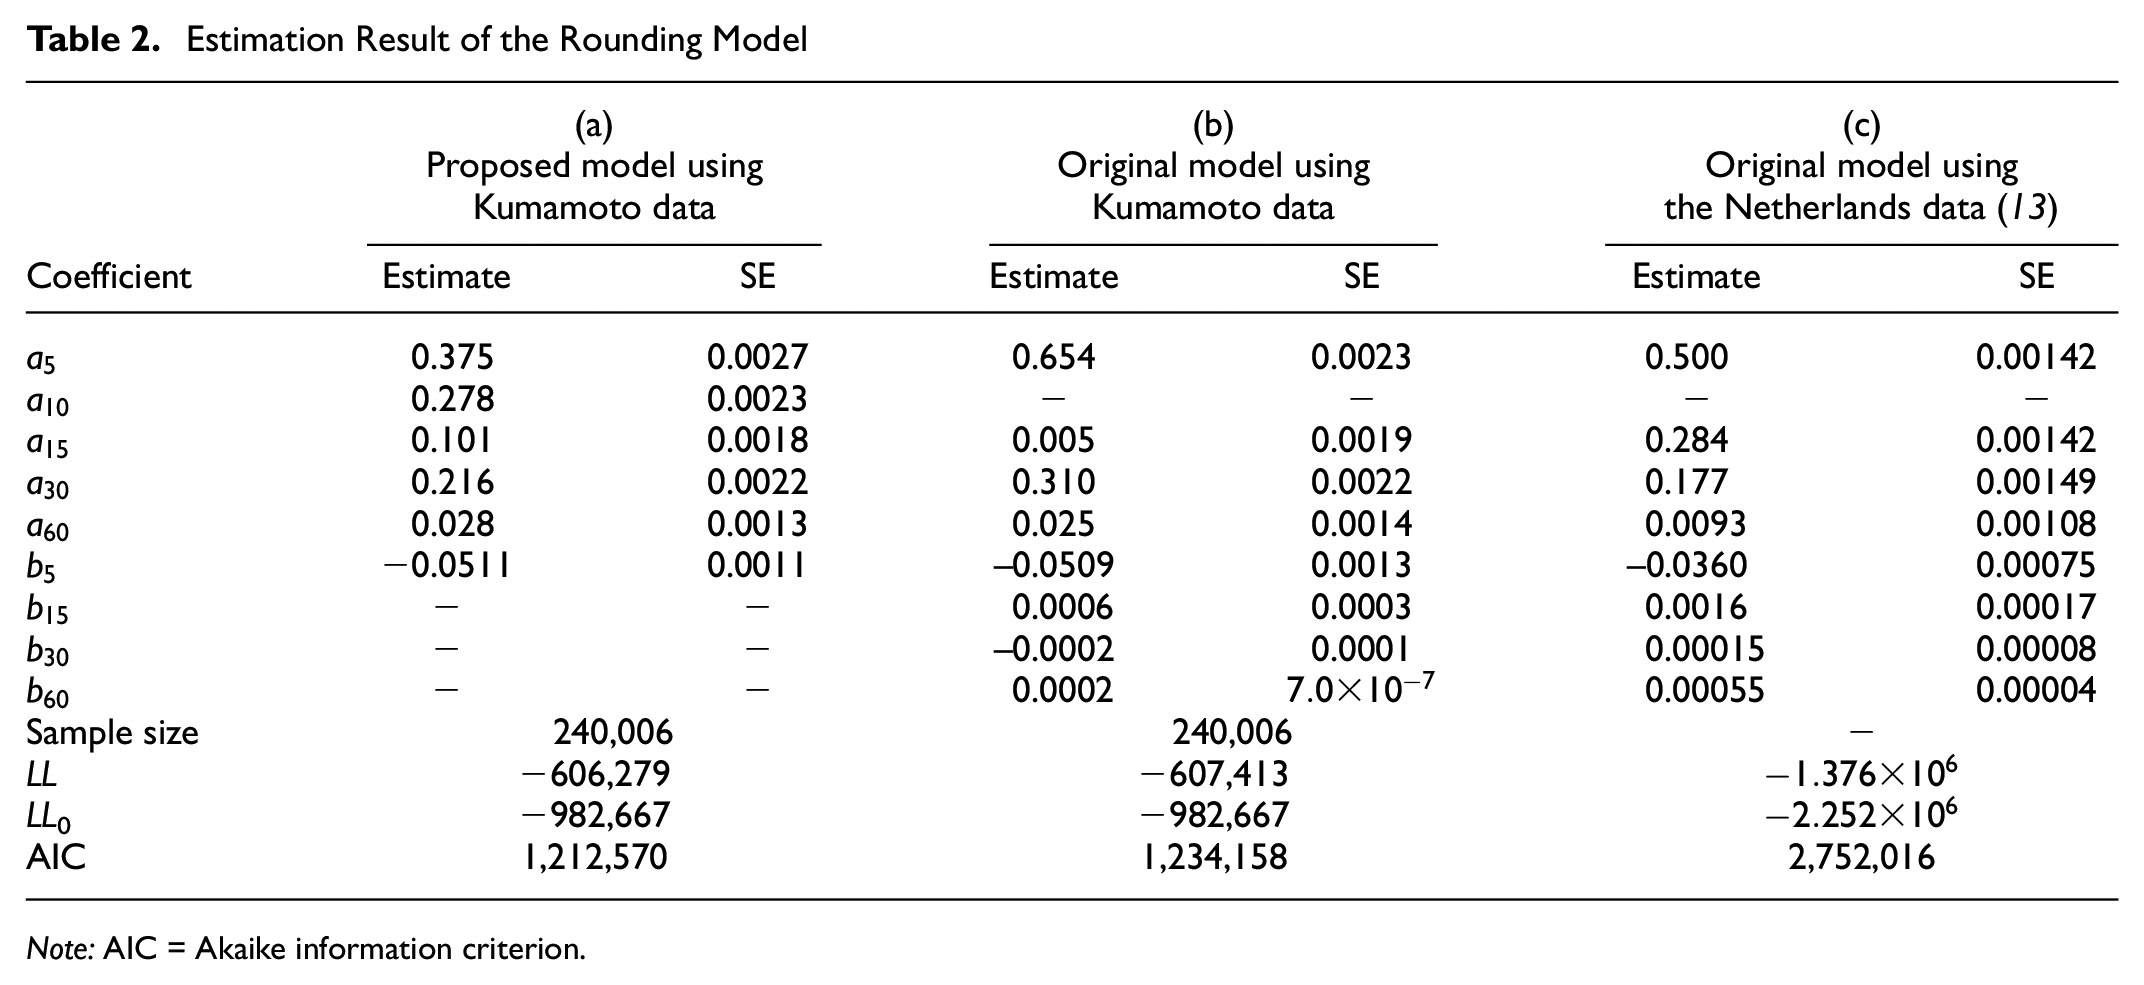
Note: AIC = Akaike information criterion.
In result (b), the estimate for
The proposed model revealed higher LL and lower AIC than the original model, which indicates that the proposed model performs better than the original model. The proposed model is simple and parsimonious in parameters, and may be more useful than the original model. Thus, the proposed model was used hereafter.
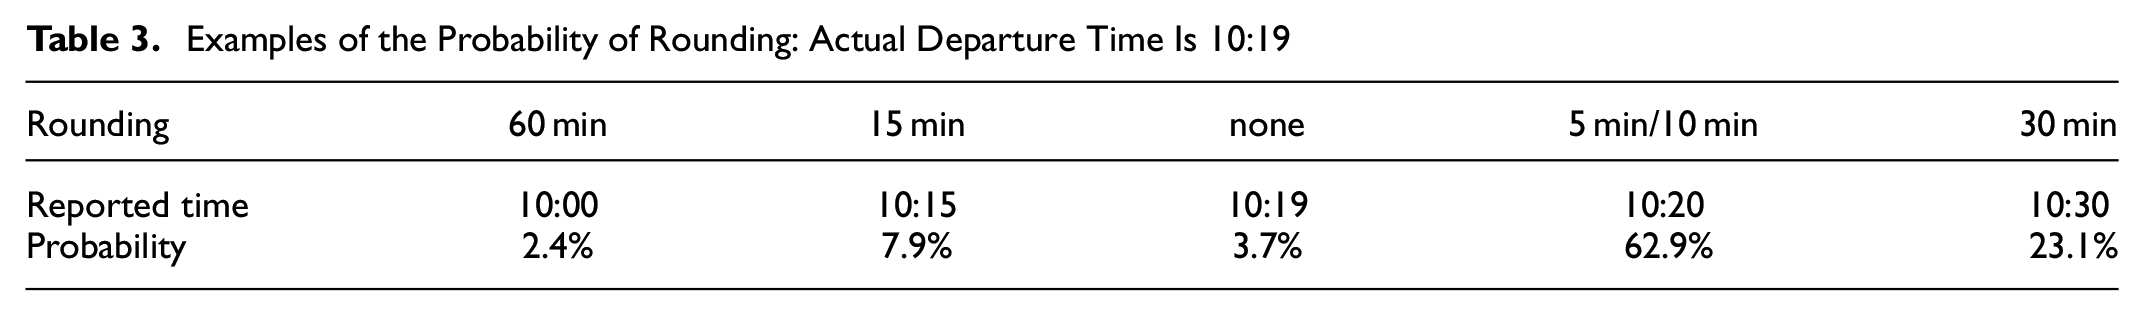
Table 3 lists the rounding probability when the actual starting time was 10:19. Rounding to 10:20 (5- or 10-min rounding) occurred with 63% probability, and the no-rounding probability was less than 4%. This result was consistent with the results shown in Figure 1 and Tables 2, which indicated that rounding errors occurred most often in the 5- and 10-min rounding.
Examples of the Probability of Rounding: Actual Departure Time Is 10:19
Inference of Actual Departure Time
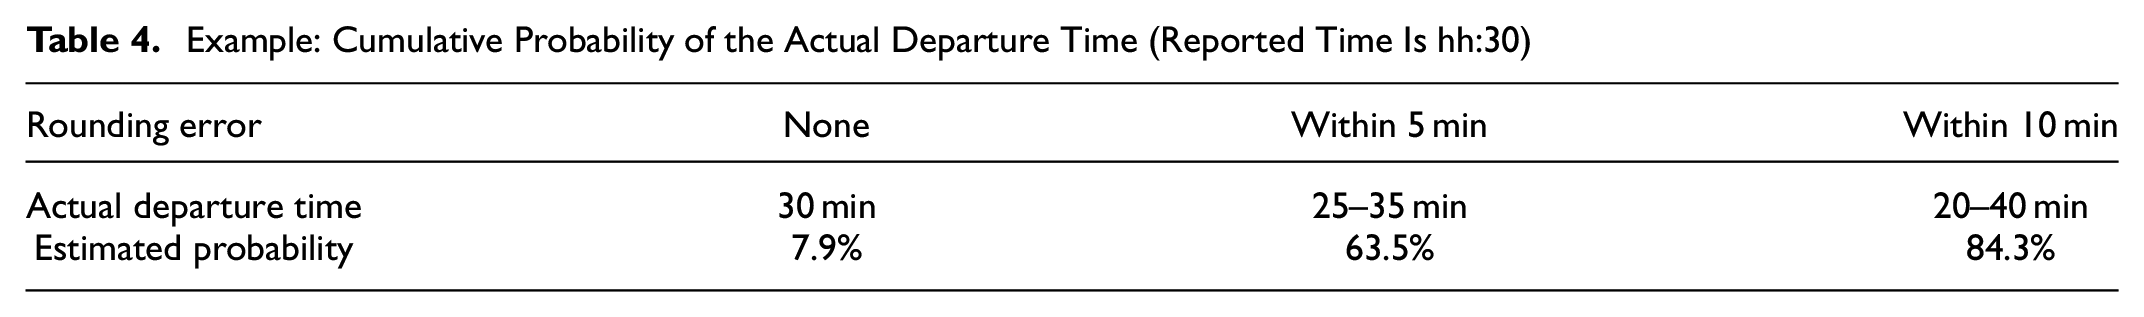
In this subsection, the attempt to estimate the actual departure time from the reported time using Equation 16 is presented. This study demonstrates the results for m = 30.
Figure 4 shows the estimated distribution of the actual departure time, and Table 4 lists its cumulative probability. When the reported departure time was 30 min, the non-rounding probability was 7.9%, indicating that more than 90% of the records were rounded. In addition, the list in Table 4 shows that when the error was within 5 min and the actual departure time was within 25–35 min, the probability was 63.5%.
Example: Cumulative Probability of the Actual Departure Time (Reported Time Is hh:30)
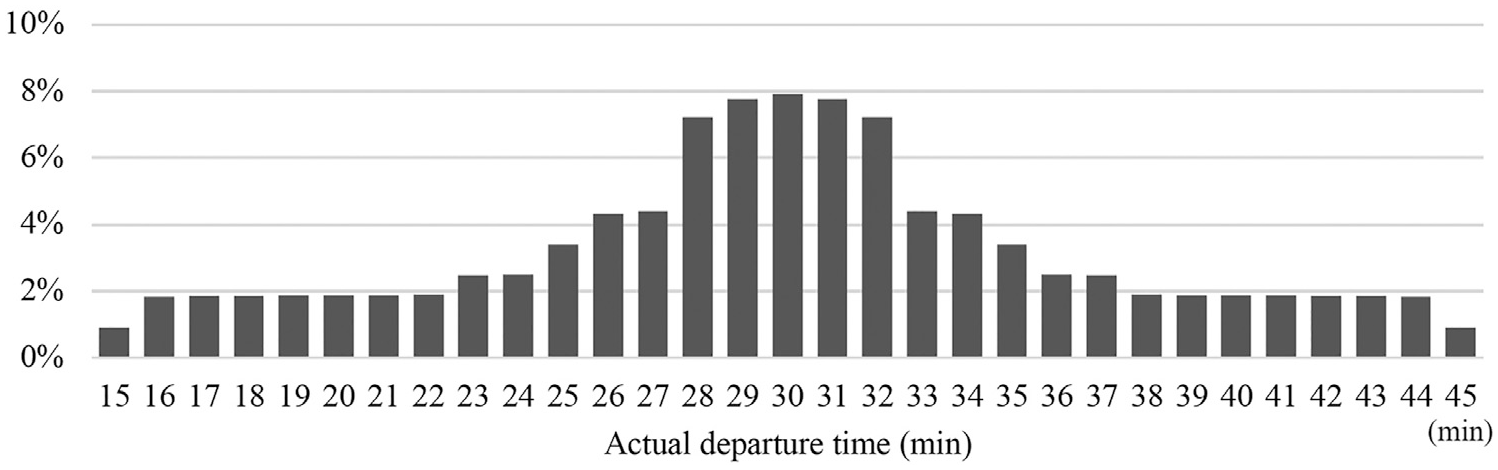
Example: Distribution of the actual departure time (reported time is hh:30).
Estimation According to the Trip Purposes
This study classified the trip purposes into five categories: “commuting (business),”“commuting (school),”“going home,”“private,” and “business.” The rounding probability in each category was estimated, and the results are listed in Table 5.
Estimation Result of the Rounding Model According to the Trip Purposes
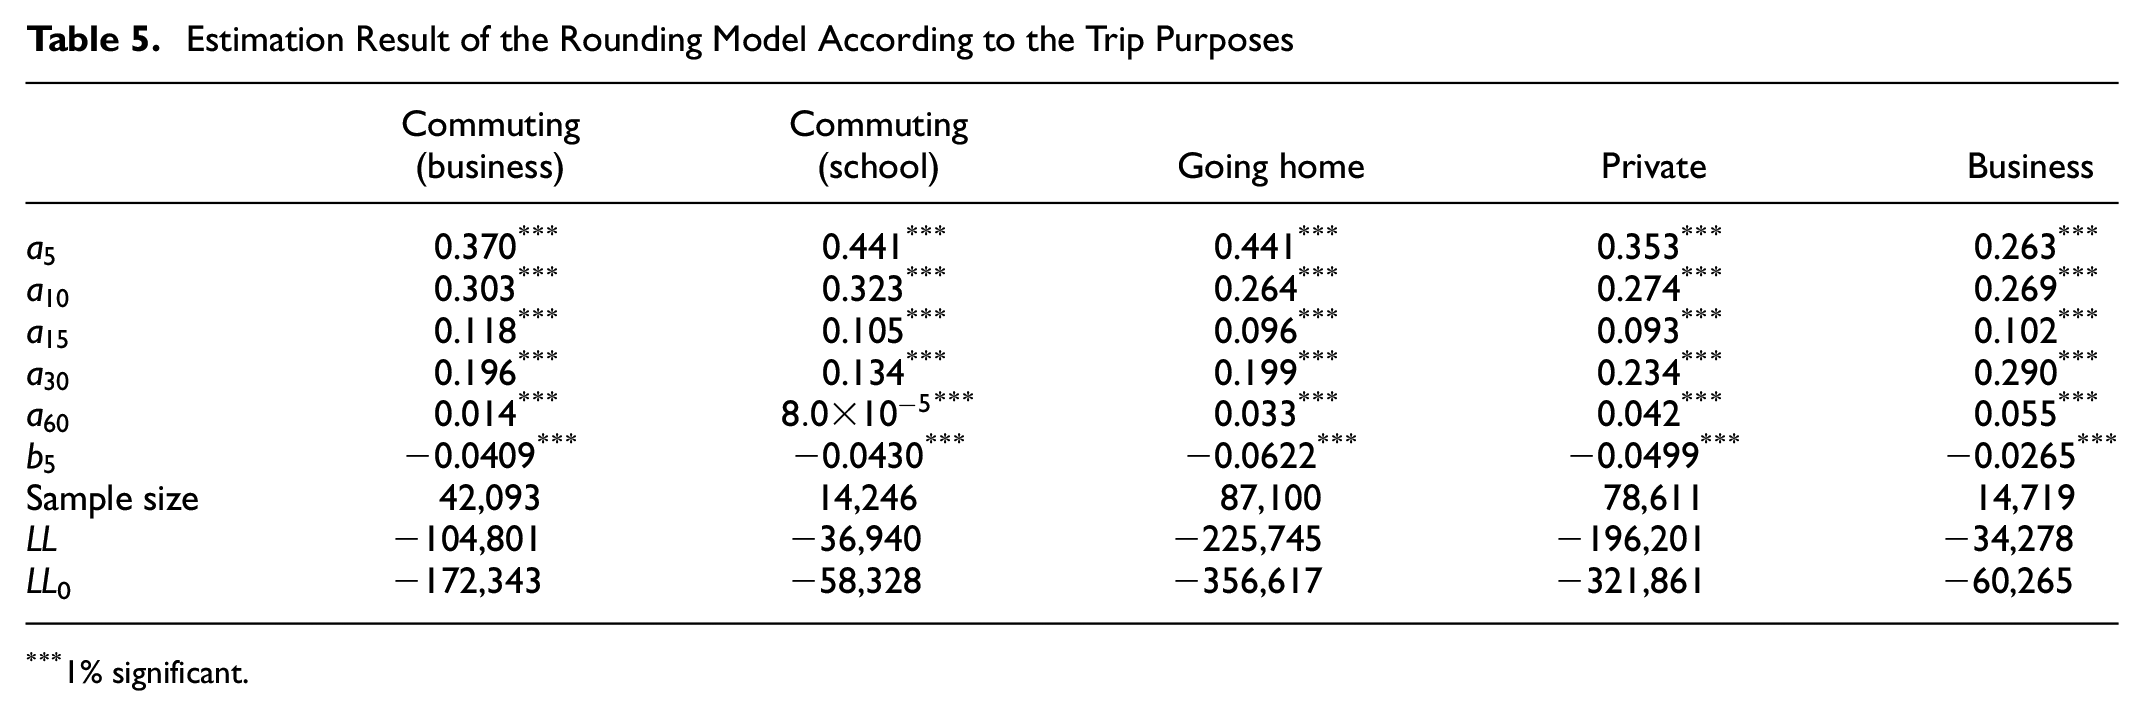
1% significant.
The estimate for
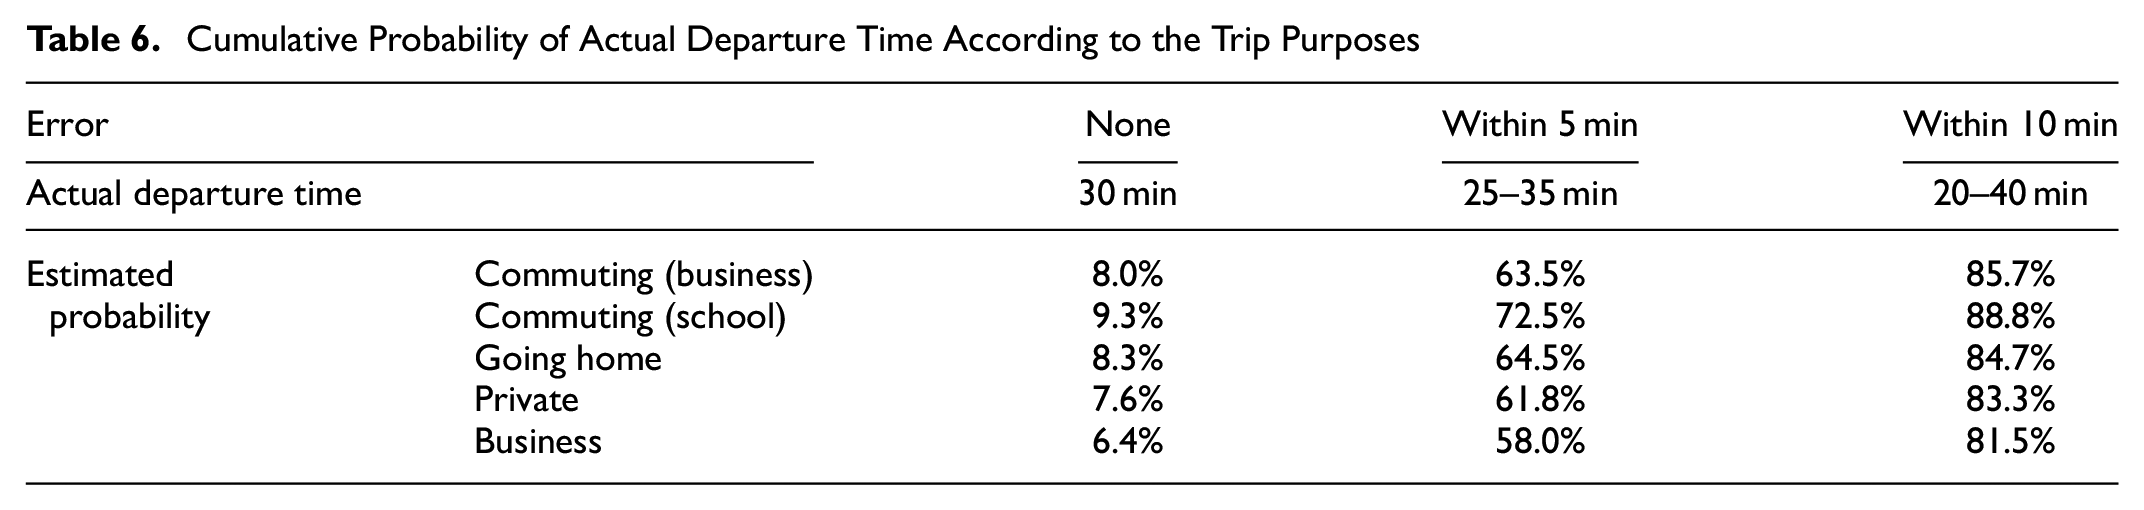
Table 6 lists the estimation results for the cumulative distribution of the actual departure time for each trip purpose. For the business trips, the probability of non-rounding and that of the actual departure time within the interval of 5–10 min were the lowest. The estimated value within the 5-min interval was approximately 5% lower than those of the other trip purposes.
Cumulative Probability of Actual Departure Time According to the Trip Purposes
Estimation According to the Travel Modes
This work classified the main travel modes of trips into 10 categories: walking, bicycle, motorcycle, private car, freight car, taxi, chartered bus, local bus, tram, and train. Other travel modes (such as super-express train, aircraft, and ship) were excluded because of the considerably small sample size. The results are listed in Tables 7 and 8. In several modes in public transportation, parameters were not significant because of the small sample size. Table 9 lists the estimation results of the actual departure time distribution of each travel mode.
Estimation Result of the Rounding Model According to the Travel Modes (Continued in Table 8)
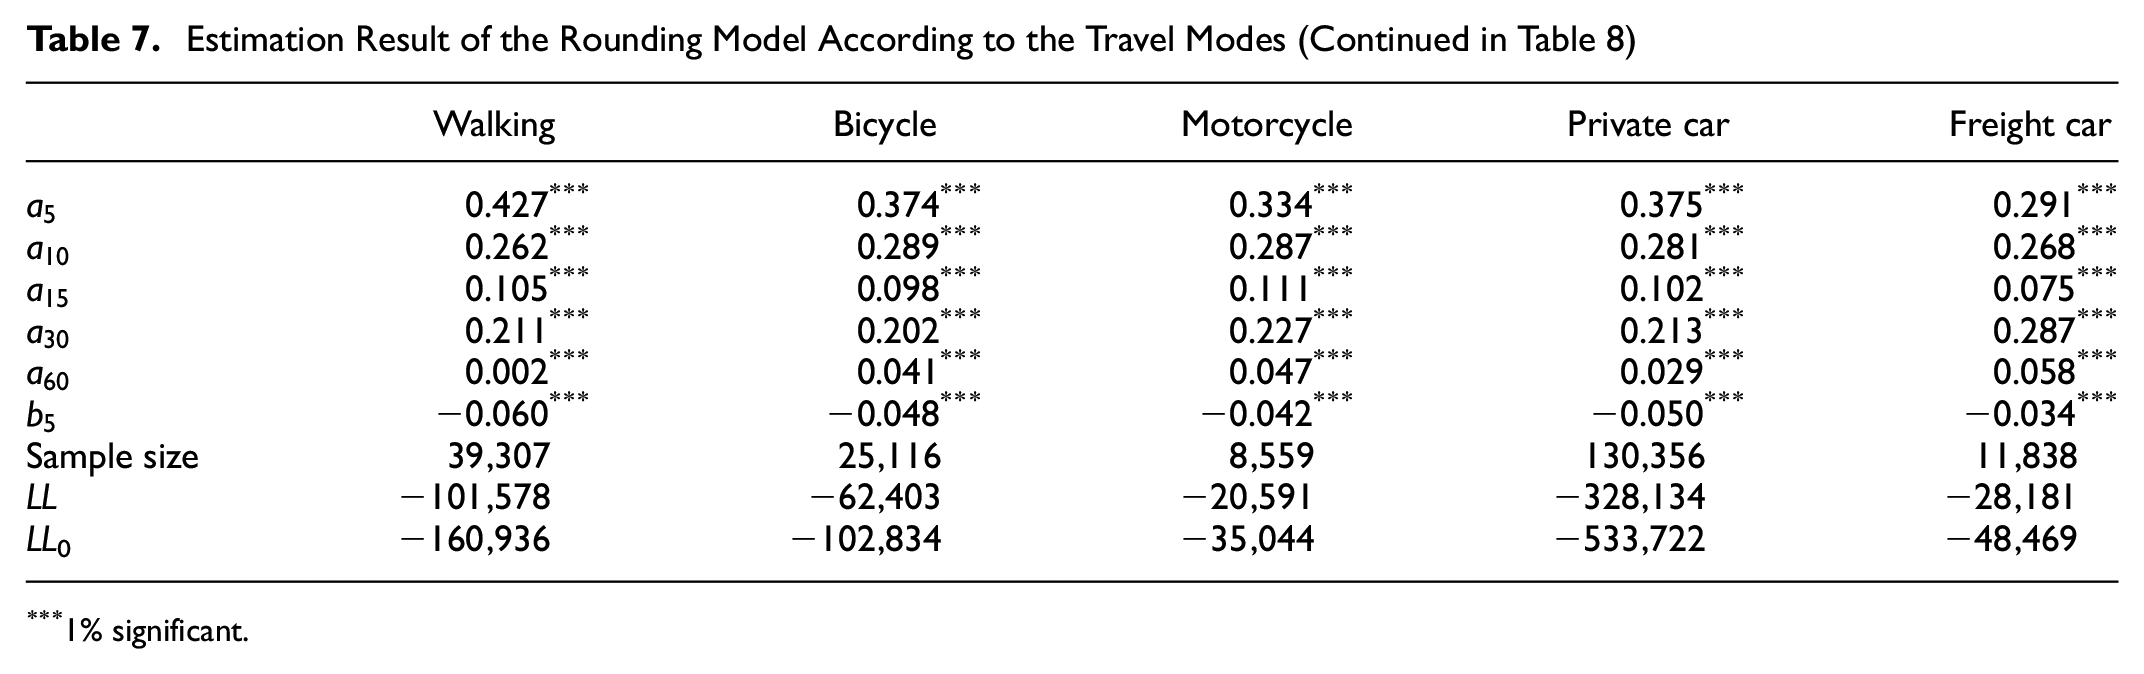
1% significant.
Estimation Result of the Rounding Model According to the Travel Modes (Continued from Table 7)
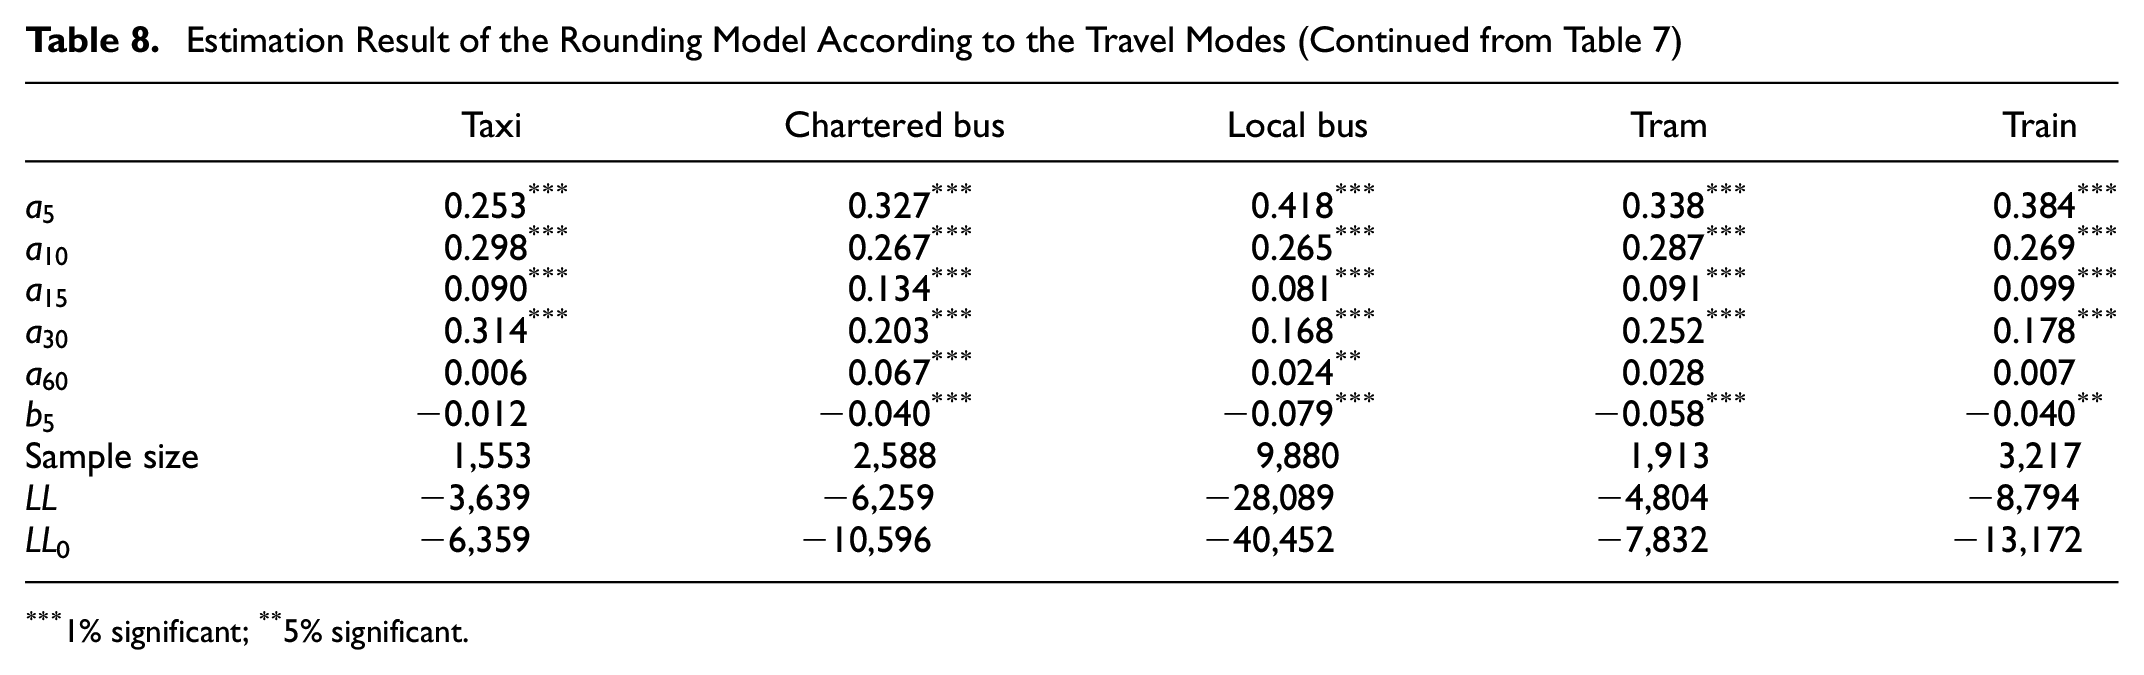
1% significant; **5% significant.
Cumulative Probability of Actual Departure Time According to the Travel Modes
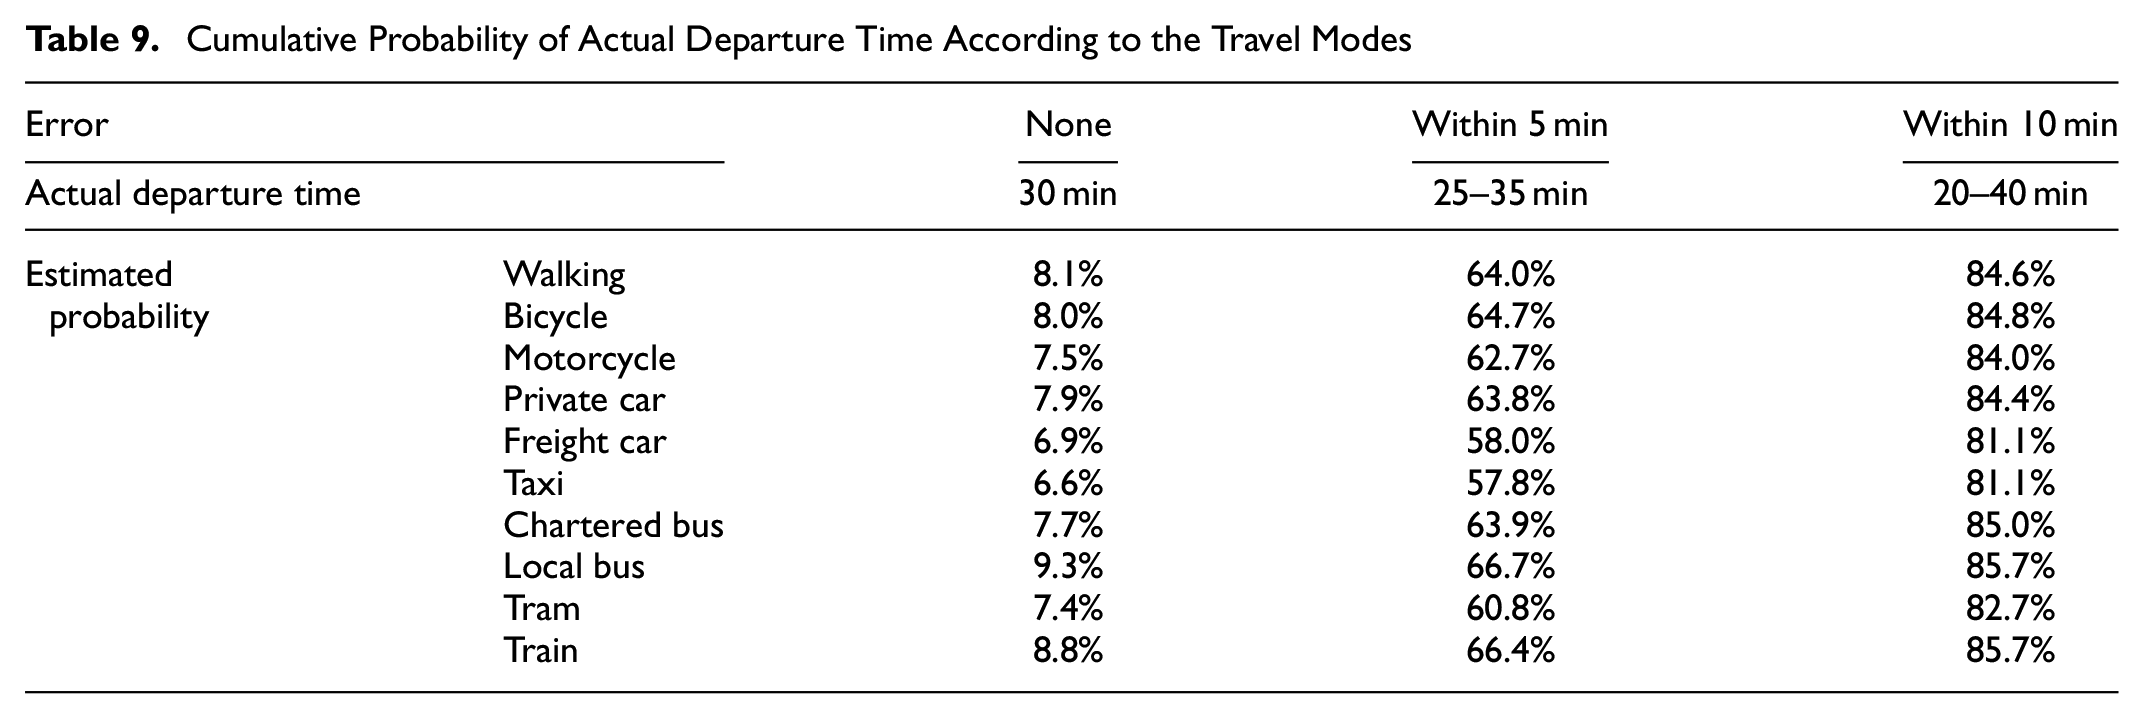
Among the walking, bicycle, and motorcycle trips, all the estimated probabilities tended to be lower for the motorcycle trips. These modes are often used for short distances or short-time trips, which may affect the estimation of departure time. The comparison between motorcycle and private car trips revealed that the trend observed in motorcycle trips was closer to that observed in private car trips. The estimated probabilities of freight car trips were less than those of private car trips. This may be attributed to the effect of trip purpose, as mentioned in the previous section.
Interesting findings can be observed in the estimated probability of public transport. Among the local bus, tram, and train trips, the local bus trips tended to exhibit the highest estimated probability, whereas the tram trips tended to exhibit the lowest. This can be attributed to the characteristics of public transportation services in the Kumamoto metropolitan area. Several bus routes exist in the Kumamoto metropolitan area. Because Kumamoto is a rural city, the bus frequency is not high, with some routes having only one or two buses per hour. Therefore, if a user misses a bus, their schedule can be significantly disrupted. Hence, bus users generally decide which bus they will board in advance. The same is applicable to train trips. In contrast, the trend observed in tram trips was slightly different. Trams are only available in the central area of Kumamoto City, but their frequency is high. Therefore, even if a user misses their target tram, they will need to wait for only approximately 10 min for the next tram. This implies that they would not have to decide which tram they are going to board in advance, which presumably led to their vague memory of the departure time.
Conclusion and Future Work
In this study, the rounding probability of the trip departure time and distribution of the rounding error were estimated using data from a household travel survey in Kumamoto, Japan. The following findings were obtained from the analysis.
The Kumamoto survey data in Japan were often rounded to 10 min, which was different from the frequent rounding to 15 min in the Netherlands and U.S.
The rounding probability varied with the difference between the target rounding and actual times when a 5-min-interval was used. However, the probability in the 10-, 15-, 30-, and 60-min rounding did not change.
The rounding error distributions were illustrated for situations where the reported time of departure was 30 min. The non-rounding probability for these situations was less than 10%.
Business trips incurred a large rounding error. The school trip exhibited many 30-min reports of departure time.
The rounding errors were small in most public transportation trips; however, tram trips tended to exhibit larger rounding errors than those of the other modes. This may be due to the high frequency of the tram service.
For researchers attempting to apply the Rietveld method, it may be advisable to extend the original model, as shown in this report; inclusion of the probability of rounding to a multiple of 10 min and constant assumption of rounding probabilities in 10–60 min.
The possible implications of the current findings for the data collection phase are that a better survey method can be selected for each travel mode. If a trip in a certain travel mode tends to have a large rounding error, conducting a GPS survey instead of a self-reporting survey may be advisable. However, the current results for each travel mode are inconclusive for proposing such a design, and future work is needed.
The authors are currently examining this subject using travel survey data in other Japanese cities and other cities in the world. The effect of city features may be observed. The effect of individual and household attributes (e.g., gender, age, and occupation), trip timing (e.g., peak or off-peak), and travel-survey mode (paper or Web) is also worthy of investigation.
Completely eliminating the rounded answers at the data collection phase is impossible and completely correcting the rounding errors is also difficult at the data analysis stage. However, the rounding error distribution estimated by this model may be useful in assessing the quality of survey data and improving the travel demand model development in practice. For example, the method may be particularly useful in estimating the dynamic origin-destination flow estimation for dynamic traffic assignment and departure time choice analysis.
To validate the estimated distribution of the difference between the reported and actual departure times depicted in Figure 4, the self-reporting travel survey data with a record of the actual times was required. The actual time can be recorded using GPS or a smartphone. The authors conducted such a survey in a previous study and the results indicate a distribution similar to that depicted in Figure 4; however, the findings are not conclusive due to the small sample size ( 26 ). Thus, validation with larger sample sizes remains to be explored in the authors’ future works.
In the current study, a trip-based model estimating parameters for each trip independently was developed. If the trips are repeated over a very short period, the order of trips may not be reserved by the trip-based rounding model. Thus, a trip-chain-based model estimating the parameters simultaneously for all trips could be another extension of this work.
Furthermore, the current framework assumes a uniform distribution of the actual departure times. However, this assumption may not be applicable in all cases. For example, consider the departure time of evacuation from a disaster, such as a tsunami. The actual departure time would naturally be just before the disaster occurrence time and the time would be unevenly distributed. In this case, a special distribution (e.g., a log-normal distribution) should be assumed, which the authors intend to investigate in a future study. In addition, the actual distribution of arrival times could be uneven, and the arrival times should be analyzed with actual recorded times in future work.
Footnotes
Acknowledgements
The comments by five anonymous reviewers were very helpful for improving the paper.
Author Contributions
The authors confirm the contribution to the study as follows: study conception and design: Y. Sato, T. Maruyama; analysis and interpretation of results: Y. Sato; draft manuscript preparation: Y. Sato, T. Maruyama. All authors reviewed the results and approved the final version of the manuscript.
Declaration of Conflicting Interests
The author(s) declared no potential conflicts of interest with respect to the research, authorship, and/or publication of this article.
Funding
The author(s) disclosed receipt of the following financial support for the research, authorship, and/or publication of this article: This work was supported in part by a grant from JSPS KAKENHI (Grant Number JP18H01561)
Data Accessibility Statement
The 2012 Kumamoto Person Trip survey data used to support the findings of this study were supplied by Kumamoto prefectural government under license and so cannot be made freely available. Requests for access to these data should be made to Kumamoto prefectural government.