
Abstract
Expanding e-commerce and delivery benefit consumers through increased flexibility and convenience. However, there is a potential impact on vehicle miles traveled (VMT) by delivery and personal vehicles, and the resulting energy consumption, air quality, and congestion. Delivery trips could replace personal vehicle trips, but, if not a replacement, could add to (or supplement) shopping-related VMT for a given household. We examined the benefits of e-commerce to consumers and the impact on personal shopping trips, and how these differed across item types, household child status, and income. We found that high-income households and households with children cared relatively more about time saving from deliveries. We found that, on average, deliveries substituted for 12% of vehicle shopping trips, but supplemented personal shopping trips for 9% of purchase deliveries. Underlying these averages were two main types of households: those for whom all deliveries substitute for trips (between 55% and 70% of households) and those for whom all deliveries supplement trips (between 20% and 35% of households). There was significant heterogeneity across households with and without children and with high or low incomes with respect to the use of delivery. Although time savings were more likely to motivate higher-income households and households with children to use delivery, this did not translate through to these households substituting for more of their trips; deliveries of prepared meals for both these categories of household were relatively more likely (15% for households with children, and 12% for higher-income households) to supplement, and not substitute for, personal trips.
E-commerce and delivery are growing quickly in the United States and across the world. Online retail sales almost doubled as a percentage of U.S. retail sales between 2012 and 2017 (1, 2). In addition, as of June 2018, more than 95 million people in the United States were paying for Amazon Prime subscriptions (through which an annual fee gains the subscriber access to benefits such as free one- or two-day shipping) ( 3 ). This is close to 40% of the U.S. adult population. This expanding home delivery is associated with societal benefits and costs.
Benefits of home delivery include time savings, increased choice of products and prices, and convenience (4–9). However, e-commerce and delivery also affect vehicle miles traveled (VMT) in the transportation system and resulting energy consumption, air quality, and congestion. Determining the extent of this impact is complex (10, 11). If a delivery trip substitutes for a personal vehicle trip, the delivery truck may be less energy efficient than the vehicle replaced, but may decrease the total energy use and VMT in the system if multiple items are delivered on a given route. However, home delivery may add to overall shopping-related VMT if deliveries supplement (add to) the number of existing personal or household trips to the store. These supplemental home delivery trips may occur for various reasons: a household may order items that they could have purchased during an existing shopping trip; some deliveries may not have been purchased in the absence of a delivery option; and e-commerce may generate new demand for trips to a store or vice versa. Delivery trips may also replace trips that otherwise would have been made by walking or biking.
Empirical research to date is mixed. Some suggest that e-commerce supplements in-store shopping, leading to an overall increase in shopping travel (9, 12–14), whereas others suggest that it substitutes, leading to a decrease (15–18). Data from the National Household Travel Survey shows that from 2009 to 2018, the percentage of person-trips per household with the purpose of shopping decreased from 21% to 18%, and the per-person VMT associated with shopping decreased from 14% to 12% ( 19 ). This decrease may be related to the concurrent increased prevalence of home delivery, or may be related to other factors.
Shopping behavior and the use of e-commerce varies based on household characteristics. For example, in both 2009 and 2017, households with children of any age averaged close to twice as many deliveries than those without children. Households with both older teens and younger children averaged the largest increase in deliveries received per month (from four to seven) between 2009 and 2017 ( 19 ). In the literature, purchasing decisions have been found to be related to family life cycle characteristics including children in the home and household income (20–23). Children in the home can be a constraint on shopping time and flexibility ( 24 ), and higher income means less constraint on expenditure, but a higher opportunity cost of time. All of these factors likely influence choice of shopping mode. Empirical evidence relating time constraint or pressure to online shopping behavior is mixed. Ferrell found a negative correlation between online shopping frequency and in-store shopping frequency, particularly for consumers with greater time constraints ( 25 ). However, Lee et al. found that those who reported being very busy or having increased time pressure were no more or less likely to shop online ( 9 ). Such heterogeneity in e-commerce use and underlying motivations suggest that the resulting impacts of delivery on household shopping trips may differ based on household characteristics that are largely defined by time and financial constraints, such as household income and the presence of children in the home. This motivated our focus in this paper.
In this paper, we examine the degree to which home delivery substitutes for or supplements household shopping trips. We consider impacts across two separate shopping trip modal categories: vehicle (personal, taxi, or ride-hailing), and nonvehicle (walking, biking, or public transit). We analyze purchases across four product categories (groceries, clothing, household items, and prepared meals). We drill down on two key household characteristics: income and the presence of children in the home. We test four hypotheses motivated largely by the roles time saving and convenience play in delivery use, and the resulting impact on shopping travel, based on income and child status.
Literature
Dating back to the 1980s researchers have grappled with the impact e-commerce would have on the transportation system and associated energy consumption or VMT (10, 11). E-commerce may complement shopping trips by generating new demand for, or supplementing, existing trips; substitute for shopping trips; modify shopping trips, such as change trip mode or timing; or have no systematic impact on shopping travel ( 26 ). Much of the current empirical evidence suggests that online shopping complements in-store shopping (9, 12, 14, 27). However, some find that online shopping has saved individual trips to the store (15–18). However, the finding of complementarity often results from an observed positive correlation between internet shopping and store shopping frequency from cross-sectional data ( 27 ), which might result from other unobserved factors and should not be taken as definitive evidence that e-commerce causes more in-store shopping. On the other hand, studies that use an experimental stated-preference approach designed to avoid spurious correlation find online shopping substitutes for, rather than complements, in-store trips, at least in the context of grocery shopping ( 18 ).
Online shopping behavior varies across the population. Some studies have found that urban shoppers tend to have a higher likelihood of shopping online (28, 29), yet others have found that different types of residence locations (urban, suburban, village, countryside) are associated with similar rates of online shopping (30, 31). Further, results suggest that rates of online shopping do not appear to be affected by built-environment features such as availability of nearby shopping opportunities, population density, shopping center accessibility, connectivity, transit accessibility, or land use (9, 32–34). Online shopping tends to be associated with younger people, those with higher incomes, and those with higher levels of education (18, 35–40).
Similarly, the impact of online shopping on shopping travel is not uniform across the population. Weltevreden and van Rietbergen, for example, found evidence of substitution in about a fifth of their respondents and complementarity in a similar proportion of other respondents ( 41 ). There is a dearth of work relating these impacts to consumer characteristics, which is one of our contributions.
Data and Analysis Methods
We used survey data collected in the Spring of 2018 as part of the WholeTraveler Transportation Behavior Study. This study was supported by the U.S. Department of Energy’s (DOE’s) Energy Efficient Mobility Systems program as part of the SMART Mobility Consortium, which strives to clarify energy implications and opportunities related to advanced mobility solutions.
Data
A sample of randomly selected addresses in the nine Bay Area California counties (Alameda, Contra Costa, Marin, Napa, San Francisco, San Mateo, Santa Clara, Solano, and Sonoma) was recruited to respond to an online survey via a mailed invitation letter followed by a reminder postcard. The household member who had most recently had a birthday and was 18 years or older was asked to respond to the survey. The survey was administered in English only, online only, and could only be completed using a desktop or laptop computer. Respondents received a $10 Amazon gift card for completing the survey.
Of the 60,000 addresses invited, 997 residents completed the entire survey and 48 completed the first portion of the survey instrument (the part used for this analysis) giving a total of 1,045 responses (1.74%). The response rate, though low, is consistent with other implementations using similar unsolicited mailings, such as the 2015–2017 California Vehicle Survey, which had a 1.5% response rate overall ( 42 ). The full WholeTraveler survey instrument can be found in the supplemental materials of Spurlock et al. ( 43 ).
Sample Biases
Owing to the design of the survey and the recruitment methodology, the sample of respondents was a selected sample, which should be taken into account when interpreting these results. Specifically, the 1,045 respondents were more highly educated than the general population, with 83% reporting a college degree or higher. In contrast, according to the American Community Survey (ACS), 45% of the Bay Area population reported a college education or higher. Median income levels tended to be commensurate with the ACS for Alameda, Contra Costa, Marin, San Mateo, Santa Clara, and Sonoma counties. However, Solano County respondents tended to have slightly lower median incomes than indicated by the ACS, and San Francisco and Napa County respondents tended to have higher median incomes. Of the ACS sampled households, 24% in the Bay Area earned more than $150,000 a year, compared with 39% in the WholeTraveler sample, indicating a bias overall in the WholeTraveler responses toward higher-income households. In addition, the Amazon gift card incentive may have attracted respondents that were more likely to be online shoppers than the general population; results should be interpreted with this in mind.
The design of our study enabled us to make several meaningful contributions. We examined impacts across multiple shopping categories, shopping trip modes, and household characteristics. We did not rely only on hypothetical stated-preference experiments, which can be divorced from reality, or only cross-sectional revealed-preference data, which can limit insights to interpretation of correlations. Instead, we used a hybrid data-elicitation approach: we asked for information about actual trip and delivery behavior and then imposed a counterfactual world where deliveries were not possible and asked for the shopping travel implications—thereby benefiting from a form of experimental manipulation, but rooting the information requested in the specific realities of the respondents. In addition, we asked participants to report their motivations for ordering delivery.
Figure 1 shows the primary questions used to generate data for this analysis. Respondents were asked to report how many times in a recent typical week they took a shopping trip via vehicle (e.g., personal vehicle, taxi, or ride-hailing) and nonvehicle (walking, biking, or public transit); and how many times they received deliveries. This was asked for each of four categories: (a) groceries (e.g., cereal, meat, produce, dairy, beans), (b) clothing, shoes, or accessories, (c) household items (e.g., paper towels, diapers, cleaning products, sunscreen), and (d) prepared meals (e.g., restaurant meals, take-out, meal delivery, cooking kit with prepared ingredients, such as Blue Apron). They were then asked to report how many additional trips they would have taken (if any) if they could not have received the deliveries they reported in the first part of the question.
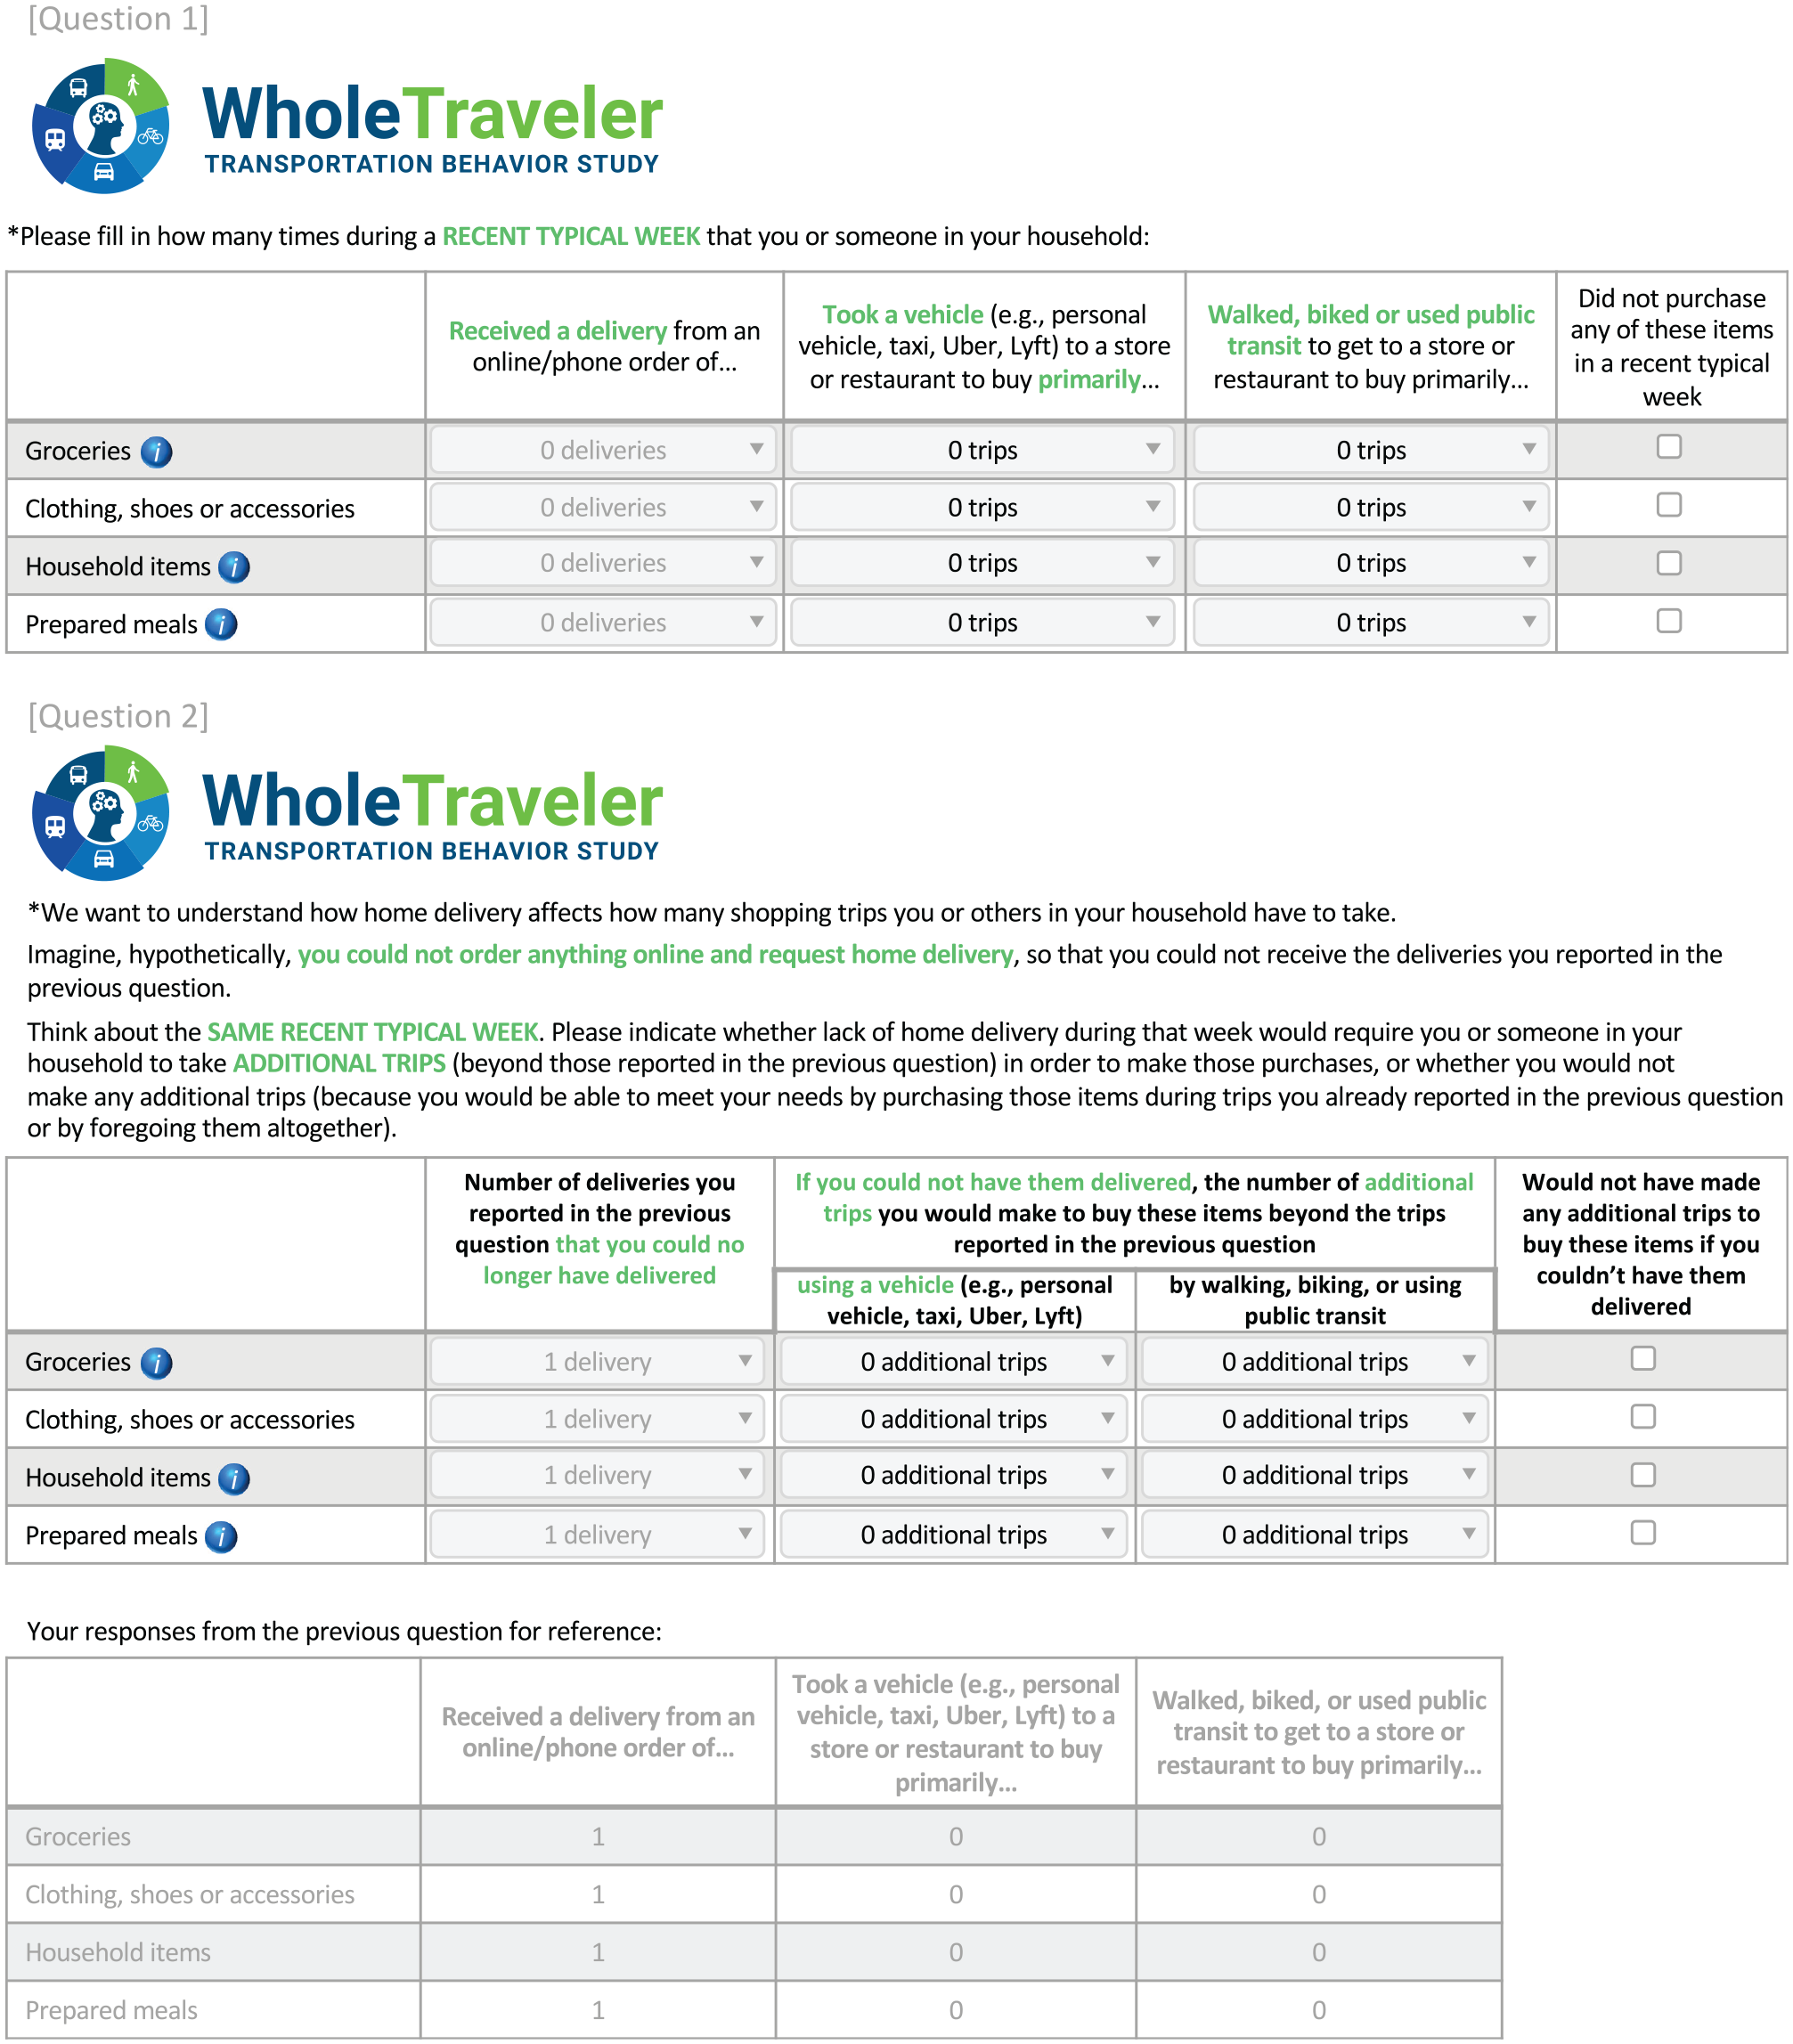
Questions from the WholeTraveler survey.
Respondents were also asked two questions to better understand their preferences and motivations behind online shopping. First, “in general, what are the three things you like MOST about making purchases online with delivery rather than making purchases in a store?” with the response options: more environmentally friendly, saves time, more convenient, more options, saves money, easier to compare options and prices, don’t have to interact with another person, less hassle, other (with an ability to specify), or not applicable. Second, “in general, what are the three things you like LEAST about making purchases online with delivery rather than making purchases in a store?” with response options: delivery charges, having to wait for delivery, less environmentally friendly, too much packaging to dispose of, harder to know what you’re getting (e.g., fit, fabric, quality, freshness), less personal (i.e., don’t get to interact with another person), having to mail back returns, harder to browse and get ideas or get exposed to new items, not supporting local businesses, other (with an ability to specify), or not applicable. We asked both of these questions to all survey participants, regardless of their reported online shopping engagement, as their opinions on what they like and do not like about delivery may have influenced whether they decided to use online shopping.
In addition, demographic and family structure information were collected and processed to generate variables used in this analysis, including age, population density of the residential census block group, a binary indicator variable delineating households at or above the median income of the sample (the income option of $100,000 to $149,999) versus those below, and an indicator for whether the household includes children 18 years old or younger.
Data Cleaning
To screen out any respondents who clicked through without reading questions or answering meaningfully, we dropped 18 responses because of response times less than 12 min. We also removed two that did not report household size, one that reported an age of 118 years, four because they were outliers with respect to number of children (six or more), one whose responses were inconsistent, and seven because they were outliers in their reported shopping behavior (more than two purchases per day on average for any single given item type). Overall, 33 respondents were dropped for the above specified reasons, leaving 1,012 remaining (97% of the original data).
Hypotheses
We used the data to test four specific hypotheses motivated largely by the roles time saving and convenience play in delivery use, and the resulting impact on shopping travel, based on income and child status.
Hypothesis 1: Both households with children and higher-income households are more likely to be motivated to order delivery by the time-saving aspects of e-commerce compared with childless or lower-income households, because households with children are more time constrained (24, 25) and higher-income households have a higher opportunity cost of their time.
Hypothesis 2: Households with lower incomes are more likely to dislike the monetary costs associated with e-commerce (such as delivery charges) compared with higher-income households.
Hypothesis 3: Households with children are relatively more likely than households without children to use delivery for household items (because of convenience and the bulkiness of items), whereas higher-income households are relatively more likely than lower-income households to use delivery for prepared meals and groceries (more luxury applications of delivery and associated convenience and time saving).
Hypothesis 4: Both households with children and higher-income households are more likely than their counterparts to have deliveries substitute for shopping trips, which would maximize the use of delivery for time savings.
Analysis Methods
Hypotheses 1 and 2 were tested using a series of pairwise t-tests. The primary analyses for Hypotheses 3 and 4 were done using multinomial logit choice models. For Hypothesis 3 we analyzed the choice of purchase mode by modeling the choice between four alternatives: 1) delivery, 2) vehicle trip, 3) nonvehicle trip, or 4) no purchase. We defined the set of potential purchase opportunities to be 56 (allowing for two purchases per day per item type during a week). This was simply a scaling factor that enabled us to interpret the resulting marginal estimates to be marginal changes in the probability of a household choosing delivery to make a purchase during the week. This is in contrast to if the choice events were limited to instances of actually purchases made, in which case the marginal effects would be on the probability of choosing delivery conditional on a purchase being made. We therefore assumed that, for each of 56 potential purchase opportunities (

where
Every household maximizes utility, therefore, the probability that household

Because we modeled this relationship using multinomial logit, the standard assumption was that the errors would be independently and identically distributed (IID) with type I extreme value distribution. In our case, because of the correlation within a household across purchase opportunities, particularly because we did not observe any attributes that varied within a household across purchase opportunities, we relaxed this assumption such that we assumed errors were IID across households, but allowed them to be correlated within a household. We did this by clustering the standard errors by household to reflect that our observations were correlated across the 56 potential purchase opportunities within a household. The probability that household

We estimated this model pooled across all four item types (groceries; clothing, shoes, or accessories; household items; and prepared meals). We then estimated it separately for each of the four item types. In the item-specific cases, we assumed 14 potential purchase opportunities per household in the modeled typical week, and household choice was modeled using the same framework as presented in Equations 1 through 3, only now observations were limited to those relevant for each item type separately.
Intuitively, our modeling approach used the framework of a discrete choice setting in which the outcome was a zero–one indicator, but the primary feature being modeled was the proportion of the 56 hypothetical purchase opportunities (or 14 in the case of the item-specific estimations) in which a household with characteristics
We tested Hypothesis 4 by taking advantage of the second part of the survey question and modeling the probability that a given reported delivery would fall under one of three alternatives: (a) supplemental to existing shopping trips, (b) substitutes for a vehicle trip, or (c) substitutes for a nonvehicle trip. The multinomial logit modeling structure was the same as that already described, only now the set of choice events for each household was the number of deliveries reported in the first survey question for that household, and the alternatives were the three described above.
Summary Statistics
In Tables 1 and 2 we present summary statistics across the analysis sample. Table 1 summarizes various ways of looking at the outcome variables for purchase channels or modes used and trips replaced or not. On average, each household made 2.9 grocery, 1.8 household item, 1.7 prepared meal, and 1.1 clothing, shoe, or accessory purchases in a recent typical week. The extent to which these purchases were delivered ranged from 50%, in the case of clothing, shoes, or accessories, to 6% in the case of groceries. Most households, if they received any deliveries in a particular category, received one delivery for that category in a typical week, with very few receiving more. Depending on the item, 50% to 61% of deliveries replaced a vehicle trip. To provide some context for the frequency of clothing, shoe, and accessory purchases Johnson cites statistics indicating that U.S. women make 30 shopping trips for clothes and an additional 15 for shoes per year ( 46 ). Taking into account that our survey question also included “accessories,” which could include a relatively large number of types of items, one per week seems reasonable.
Summary Statistics: Outcome Variables
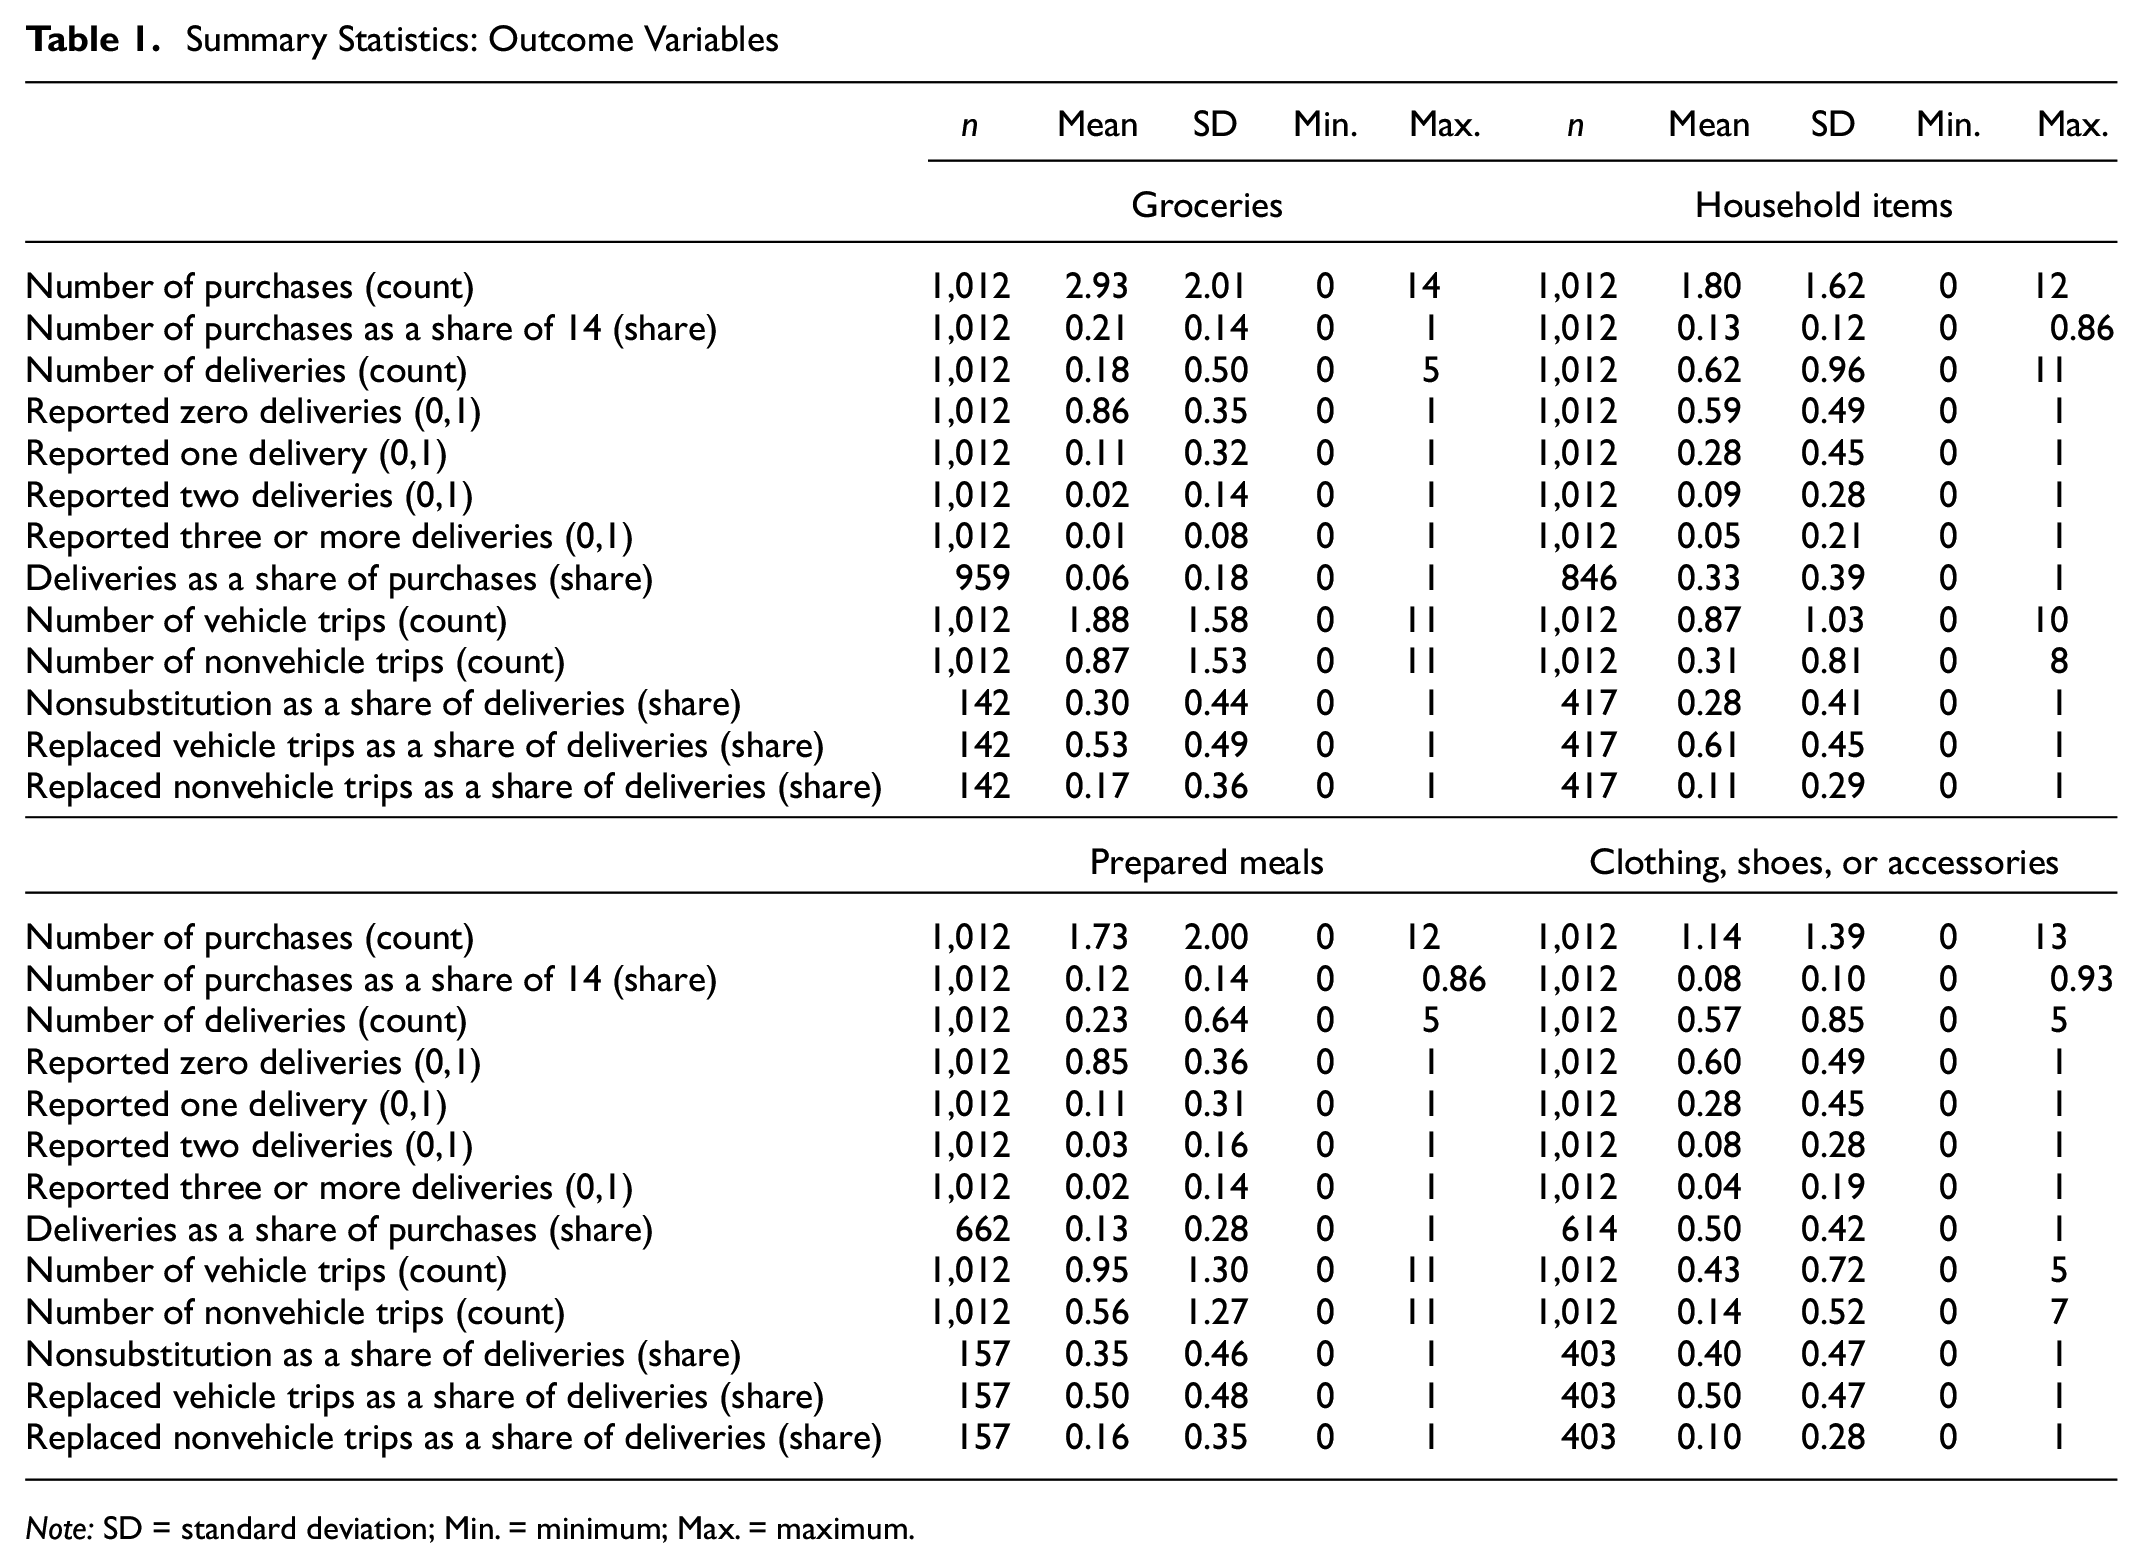
Note: SD = standard deviation; Min. = minimum; Max. = maximum.
Summary Statistics: Explanatory Variables
Note: SD = standard deviation; Min. = minimum; Max. = maximum.
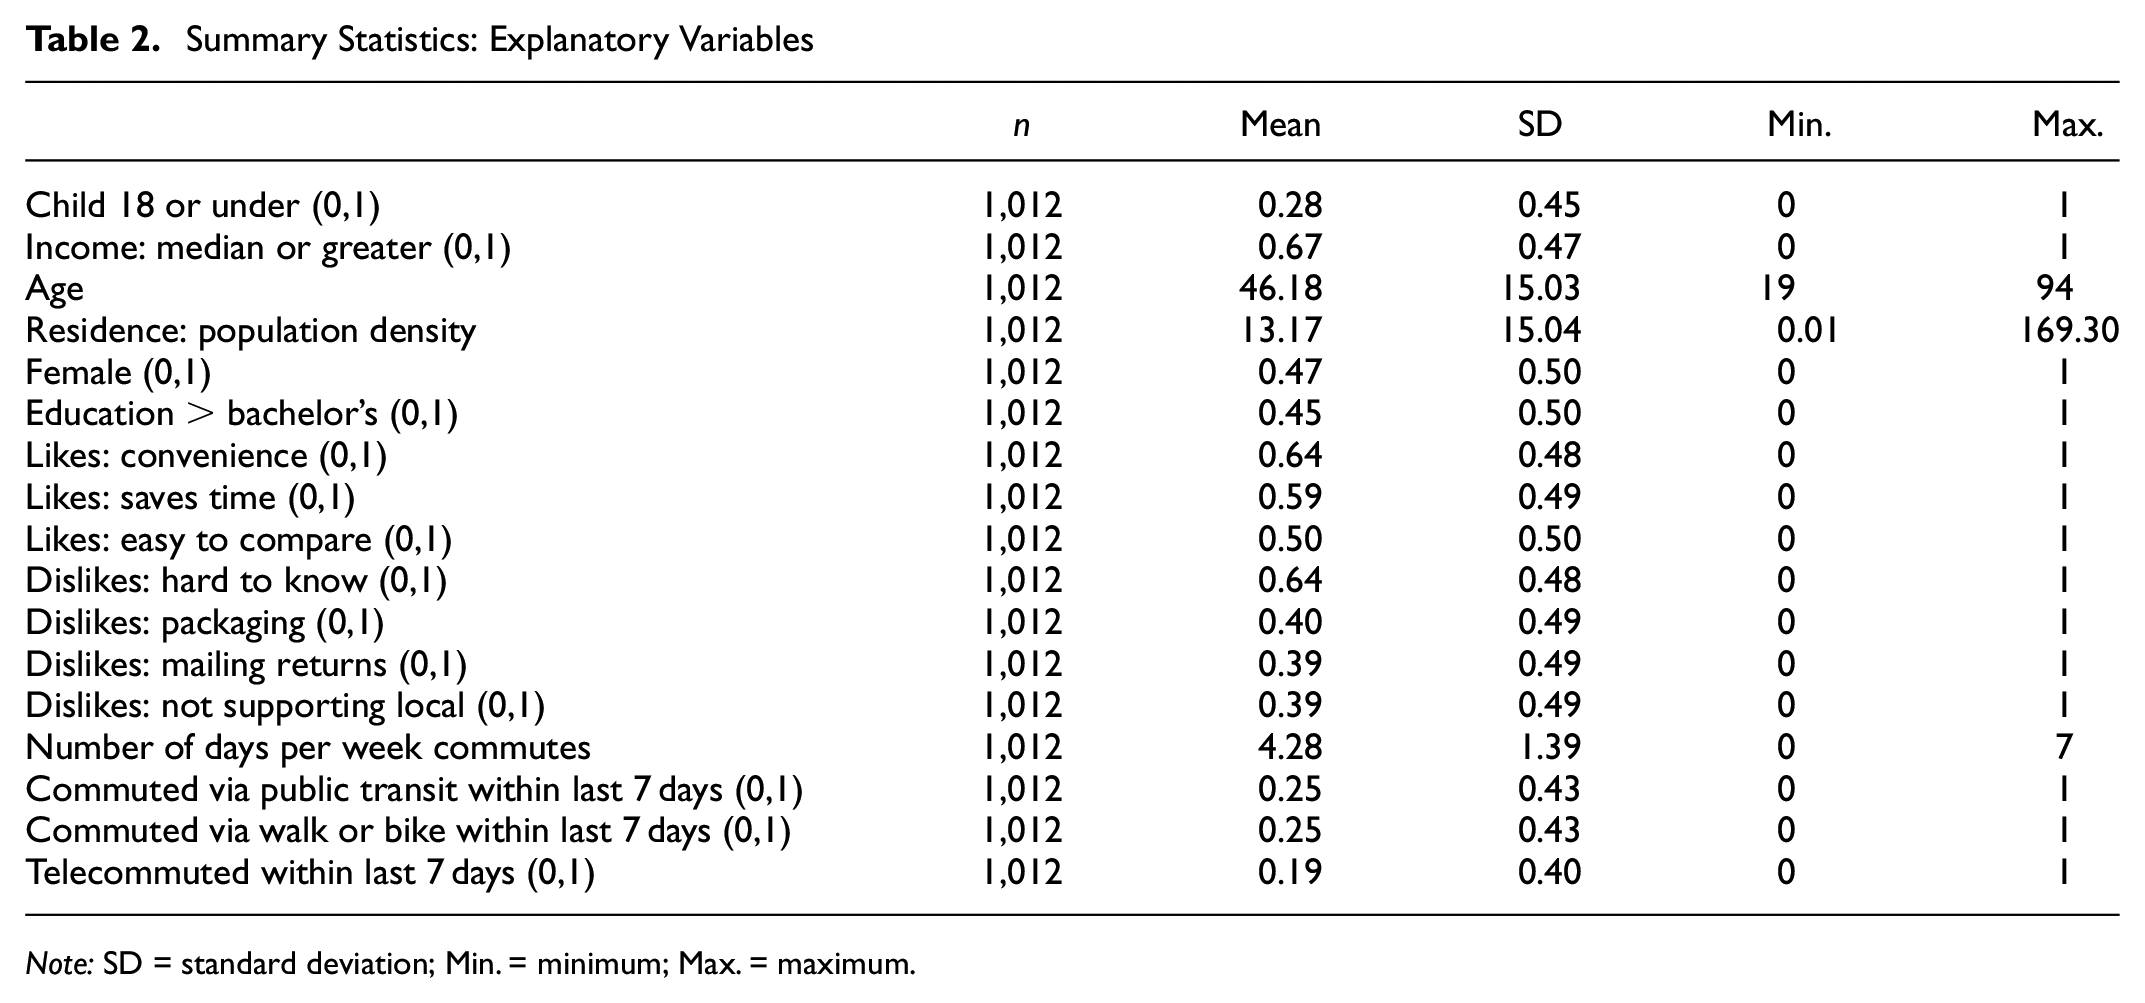
Table 2 provides summary statistics of explanatory variables. Most of these variables were used in the analysis, but some are provided simply to better describe the sample of survey respondents. Respondents were 46 years old on average. They were relatively evenly split between men and women. About 30% had children in the home and about 45% had at least a bachelor’s degree. On average they commuted about four days per week and about a quarter had done so using any or all of public transit, walking, biking in the 7 days before taking the survey. The most frequently cited things liked most about shopping online with delivery were convenience and the time-saving aspect, whereas the least liked feature of shopping online was that it was hard to know exactly what you were ordering without being able to see it in person.
A version of these summaries broken out by households with and without children, and by households above or below the sample median income is provided in the supplemental material in Appendix A.
Results
Attitudes Toward E-Commerce
As seen in Table 2, a large percentage of our sample indicated that one of the top three things they liked about online shopping is that it saves time (59%) and is convenient (64%). This is consistent with previous findings that online shopping and home delivery save time and are more convenient (4, 5, 7, 8). In addition, 50% selected ease of comparing items. Lower percentages of respondents selected saving money (32%), less hassle (34%), and enabling access to more options (29%).
For the perceived disadvantages of online shopping, by far the most frequently selected item was the difficulty of knowing what one is getting online (65%). Other dislikes included delivery charges (35%), having to wait for delivery (33%), not supporting local businesses (39%), having to mail back returns (39%), and having to deal with excessive packaging (40%). The degree to which e-commerce was perceived to hurt or help the environment was not a major driver around preferences either way.
Figure 2 compares these attitudinal factors between those with and without children and those with higher versus lower household income. The results supported Hypotheses 1 and 2. Households with children valued time savings and convenience relatively more than those without, and they additionally valued monetary savings relatively less. For high-income households, time savings, more options, and knowing what one is getting were more important than for low-income households; low hassle and delivery charges were relatively more important for lower-income households.
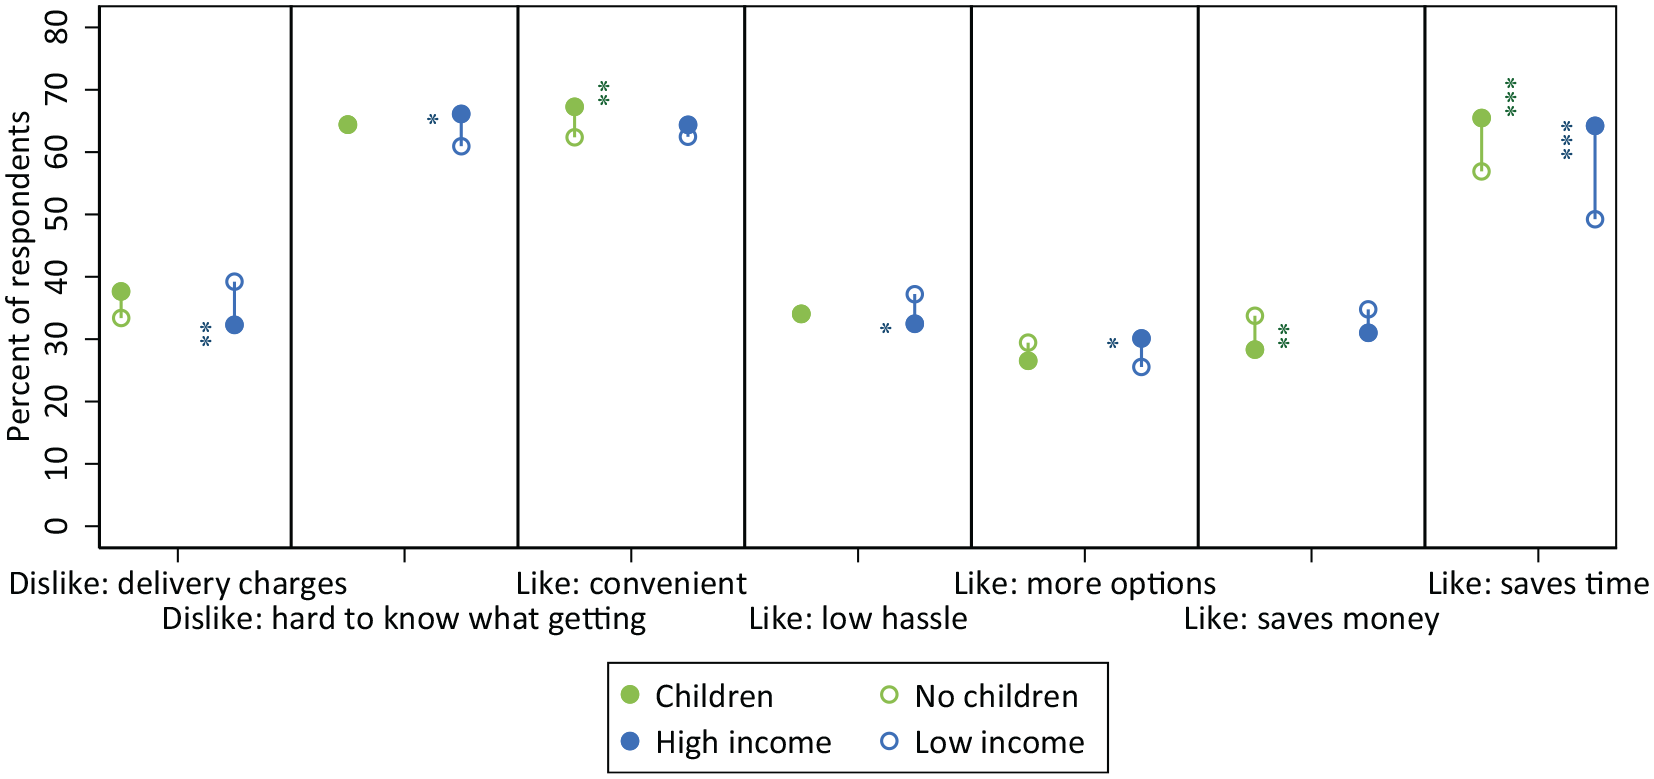
Likes and dislikes of online shopping differentiated by subpopulations.
Purchase Behavior: Modes and Magnitude
Figure 3 summarizes purchase mode (channel) use in aggregate. The data underlying all bar graphs are reported in Appendix B. Although groceries were the most frequently purchased (close to three times per household on average in a week), they were delivered the least. Conversely, clothing, shoes, or accessories and household items were delivered proportionally the most; clothing, shoes, or accessories were purchased least frequently but were more likely to be delivered than purchased via a shopping trip. Groceries and prepared meals were the most likely to be purchased via a nonvehicle shopping mode.
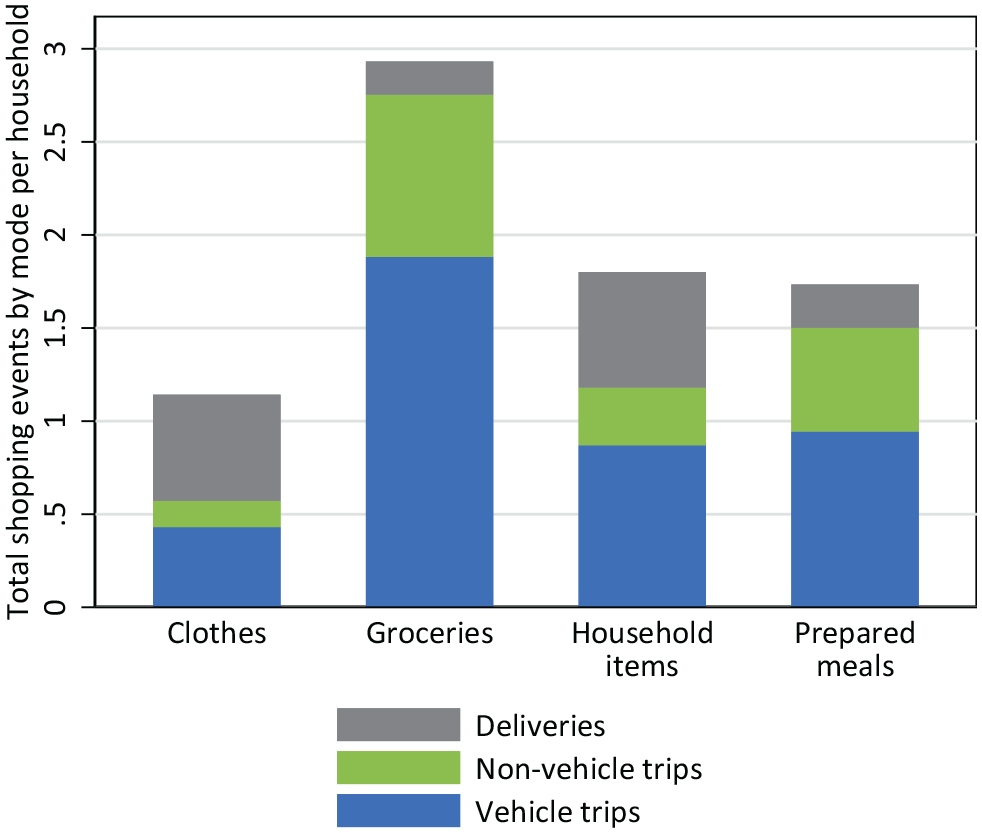
Shopping events per household in a typical week, by vehicle, nonvehicle, or delivery.
Heterogeneity in Purchase Modes and Magnitude
Figure 4 shows purchase mode patterns across households. In general a minority of households (at most about 30%) use delevery for some (as opposed to all or none) of their purchases of a given item (Figure 4a). Figure 4b shows that high-income households are significantly more likely to make all of their household item purchases via delivery, and significantly less likely to receive no deliveries across all four item types. Households with children are significantly less likely to receive no deliveries of household items compared with those without children. These results support Hypothesis 3.
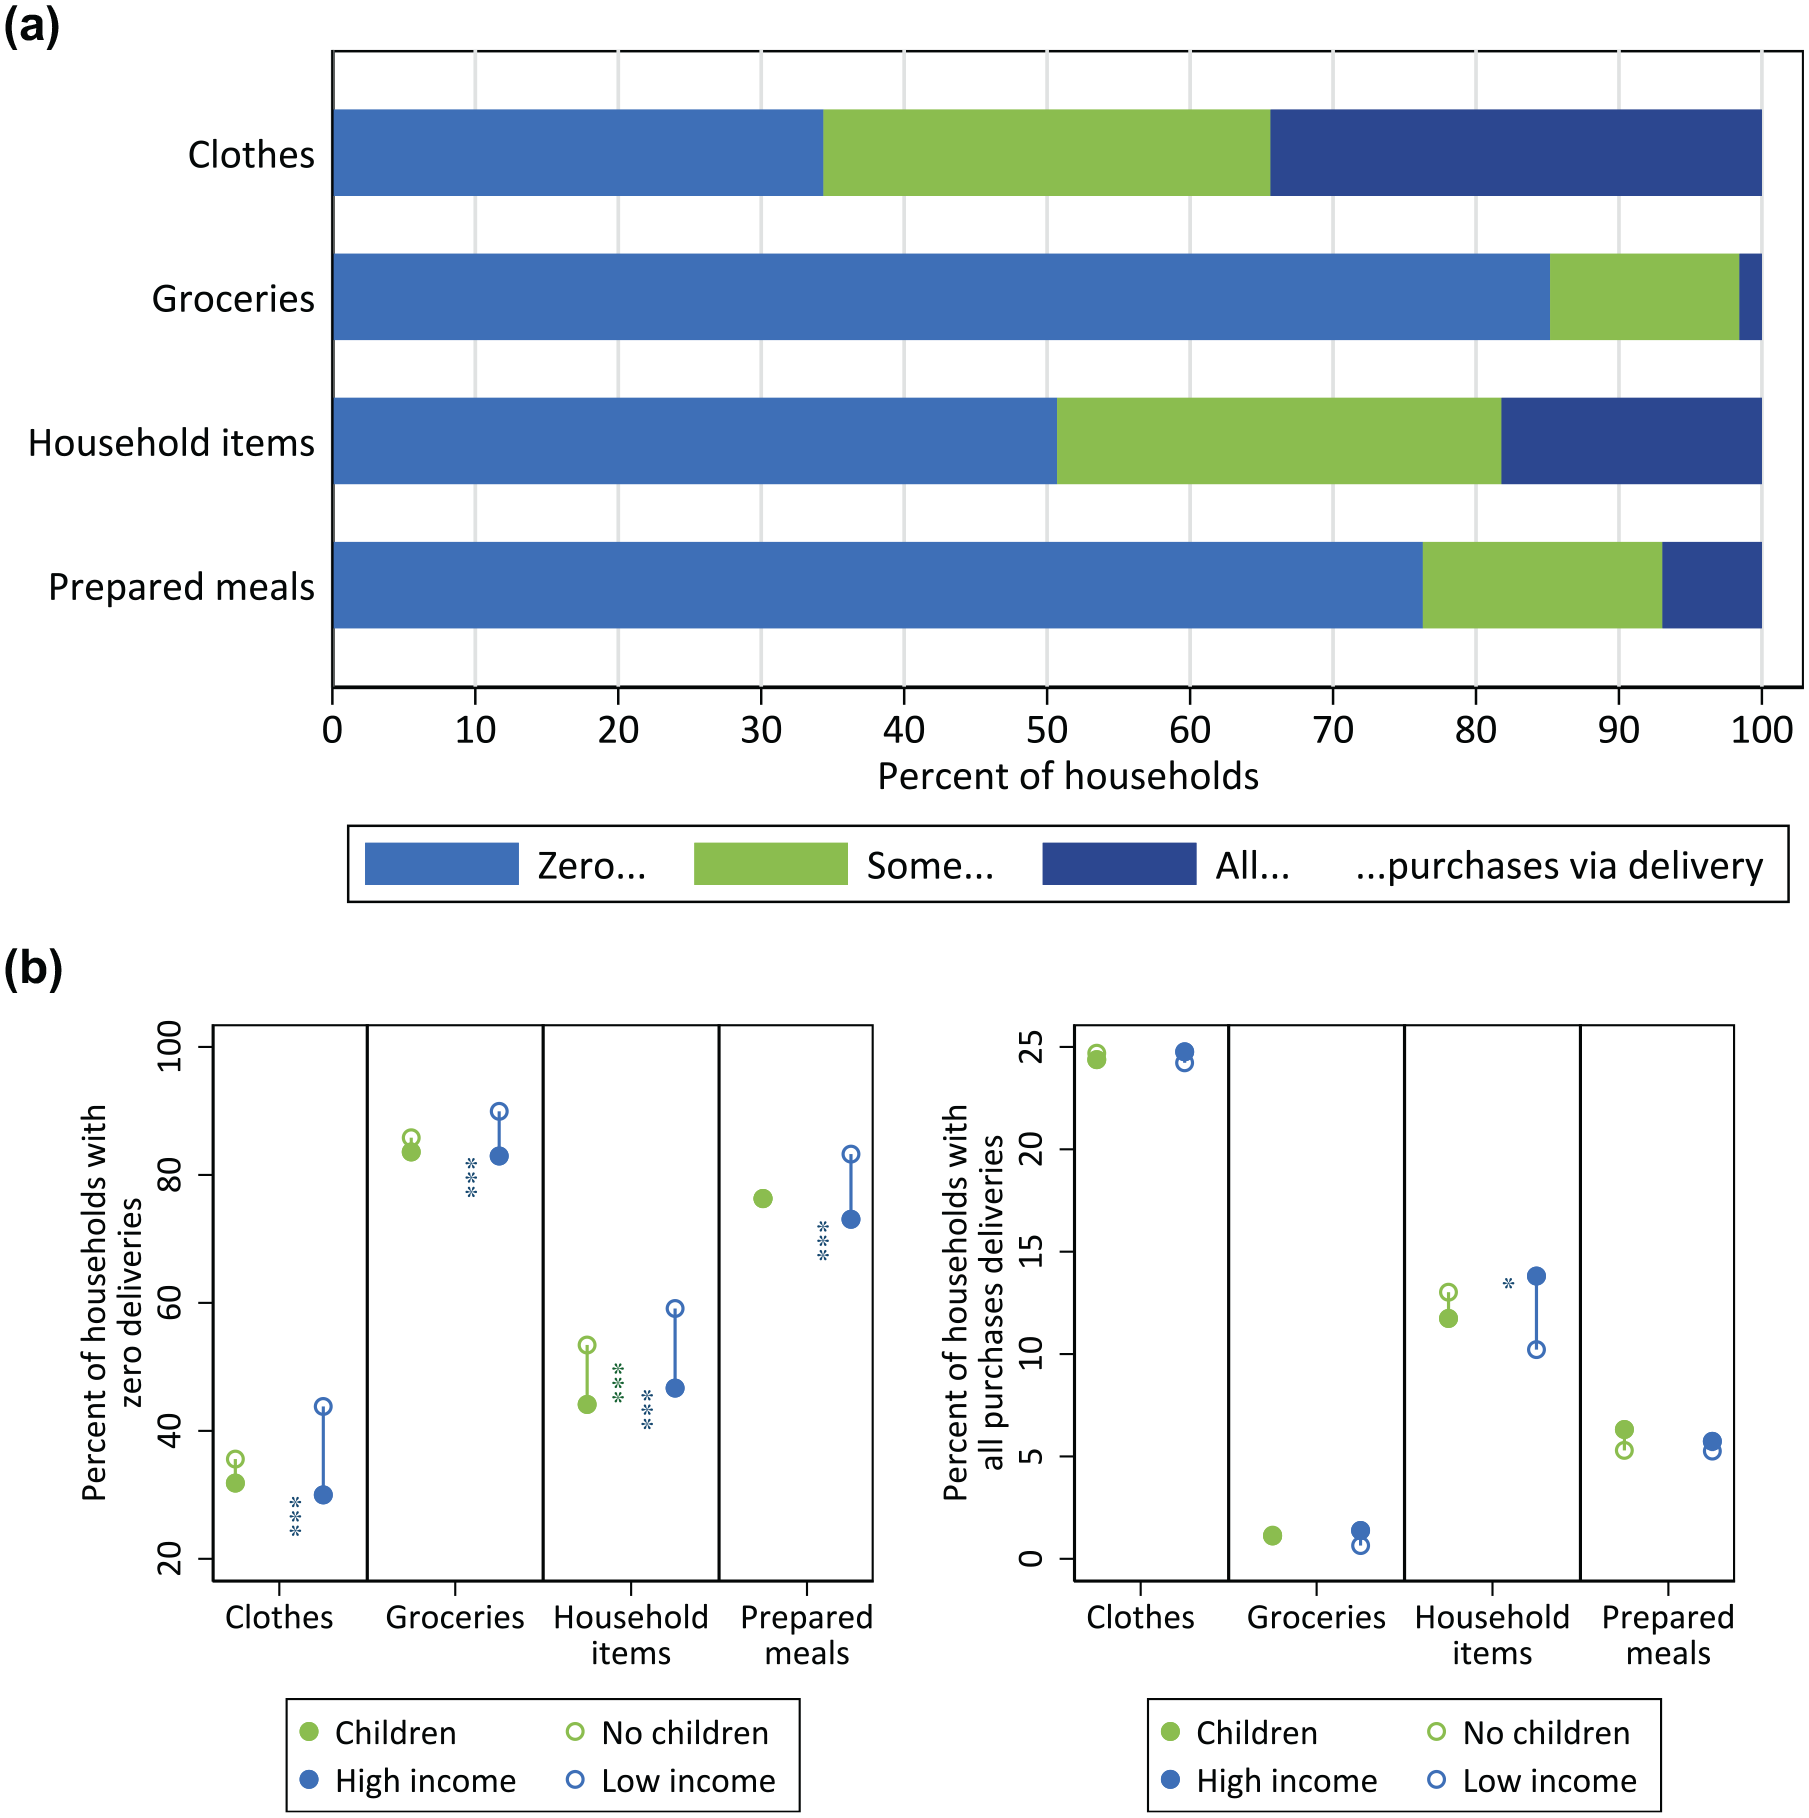
Percent of households that (a) received zero, some, or all purchases via delivery, and (b) breakdown of the prevalence of the two ends of the distribution by household characteristic.
Multinomial Logit Results Relating Purchase Channel Choice to Household Demographics
The marginal effect estimates from the multinomial logit analysis of purchase channel choice are presented in Table 3. The full model output including coefficient estimates, standard errors, confidence intervals, and extensive fit statistics can be found in Appendix C. These results show that households with children were more likely to make more frequent purchases across all item types, whereas higher-income households were only more likely to make more frequent purchases of prepared meals. Consistent with Hypothesis 3, higher-income households were more likely to receive deliveries overall, and across all item types. The results indicate that, for any one of the 56 potential purchase opportunities in a typical week, high-income households were 0.8 percentage points more likely to choose delivery relative to low-income households. This means that over the whole week (treating each purchase opportunity as independent), the probability that a high-income household had at least one delivery was 44 percentage points higher than for a low-income household. Also consistent with Hypothesis 3, households with children were more likely to make more delivery purchases, particularly for household items and clothing, shoes, or accessories, as well as more vehicle shopping trips across all item types other than prepared meals compared with households with no children. We conducted an additional analysis, the results of which are presented in Appendixes D and E, in which we separate out the effect of a household having at least one younger child (8 years or younger) from households with children all over the age of 8. That analysis showed that the tendency toward more delivery was most strongly driven by the presence of younger children. Results for respondent age and location also stood out. Age entered the model linearly, so a case in which the effect of age is negative, for example, can be interpreted as a case in which relative youth (i.e., younger people relative to older people), is associated with a lower likelihood of exhibiting that outcome. Specifically, relative youth was associated with more deliveries, particularly for prepared meals and clothing. Younger people were also relatively more likely than older people to make grocery purchases via vehicle (and make fewer grocery purchases). They also tended to purchase prepared meals more, and take nonvehicle modes more and vehicles less to make those purchases. Higher residential population density was associated with fewer purchases, lower vehicle-dependence for shopping, and more use of nonvehicle modes.
Purchase Channel Choice Multinomial Logit Marginal Effects
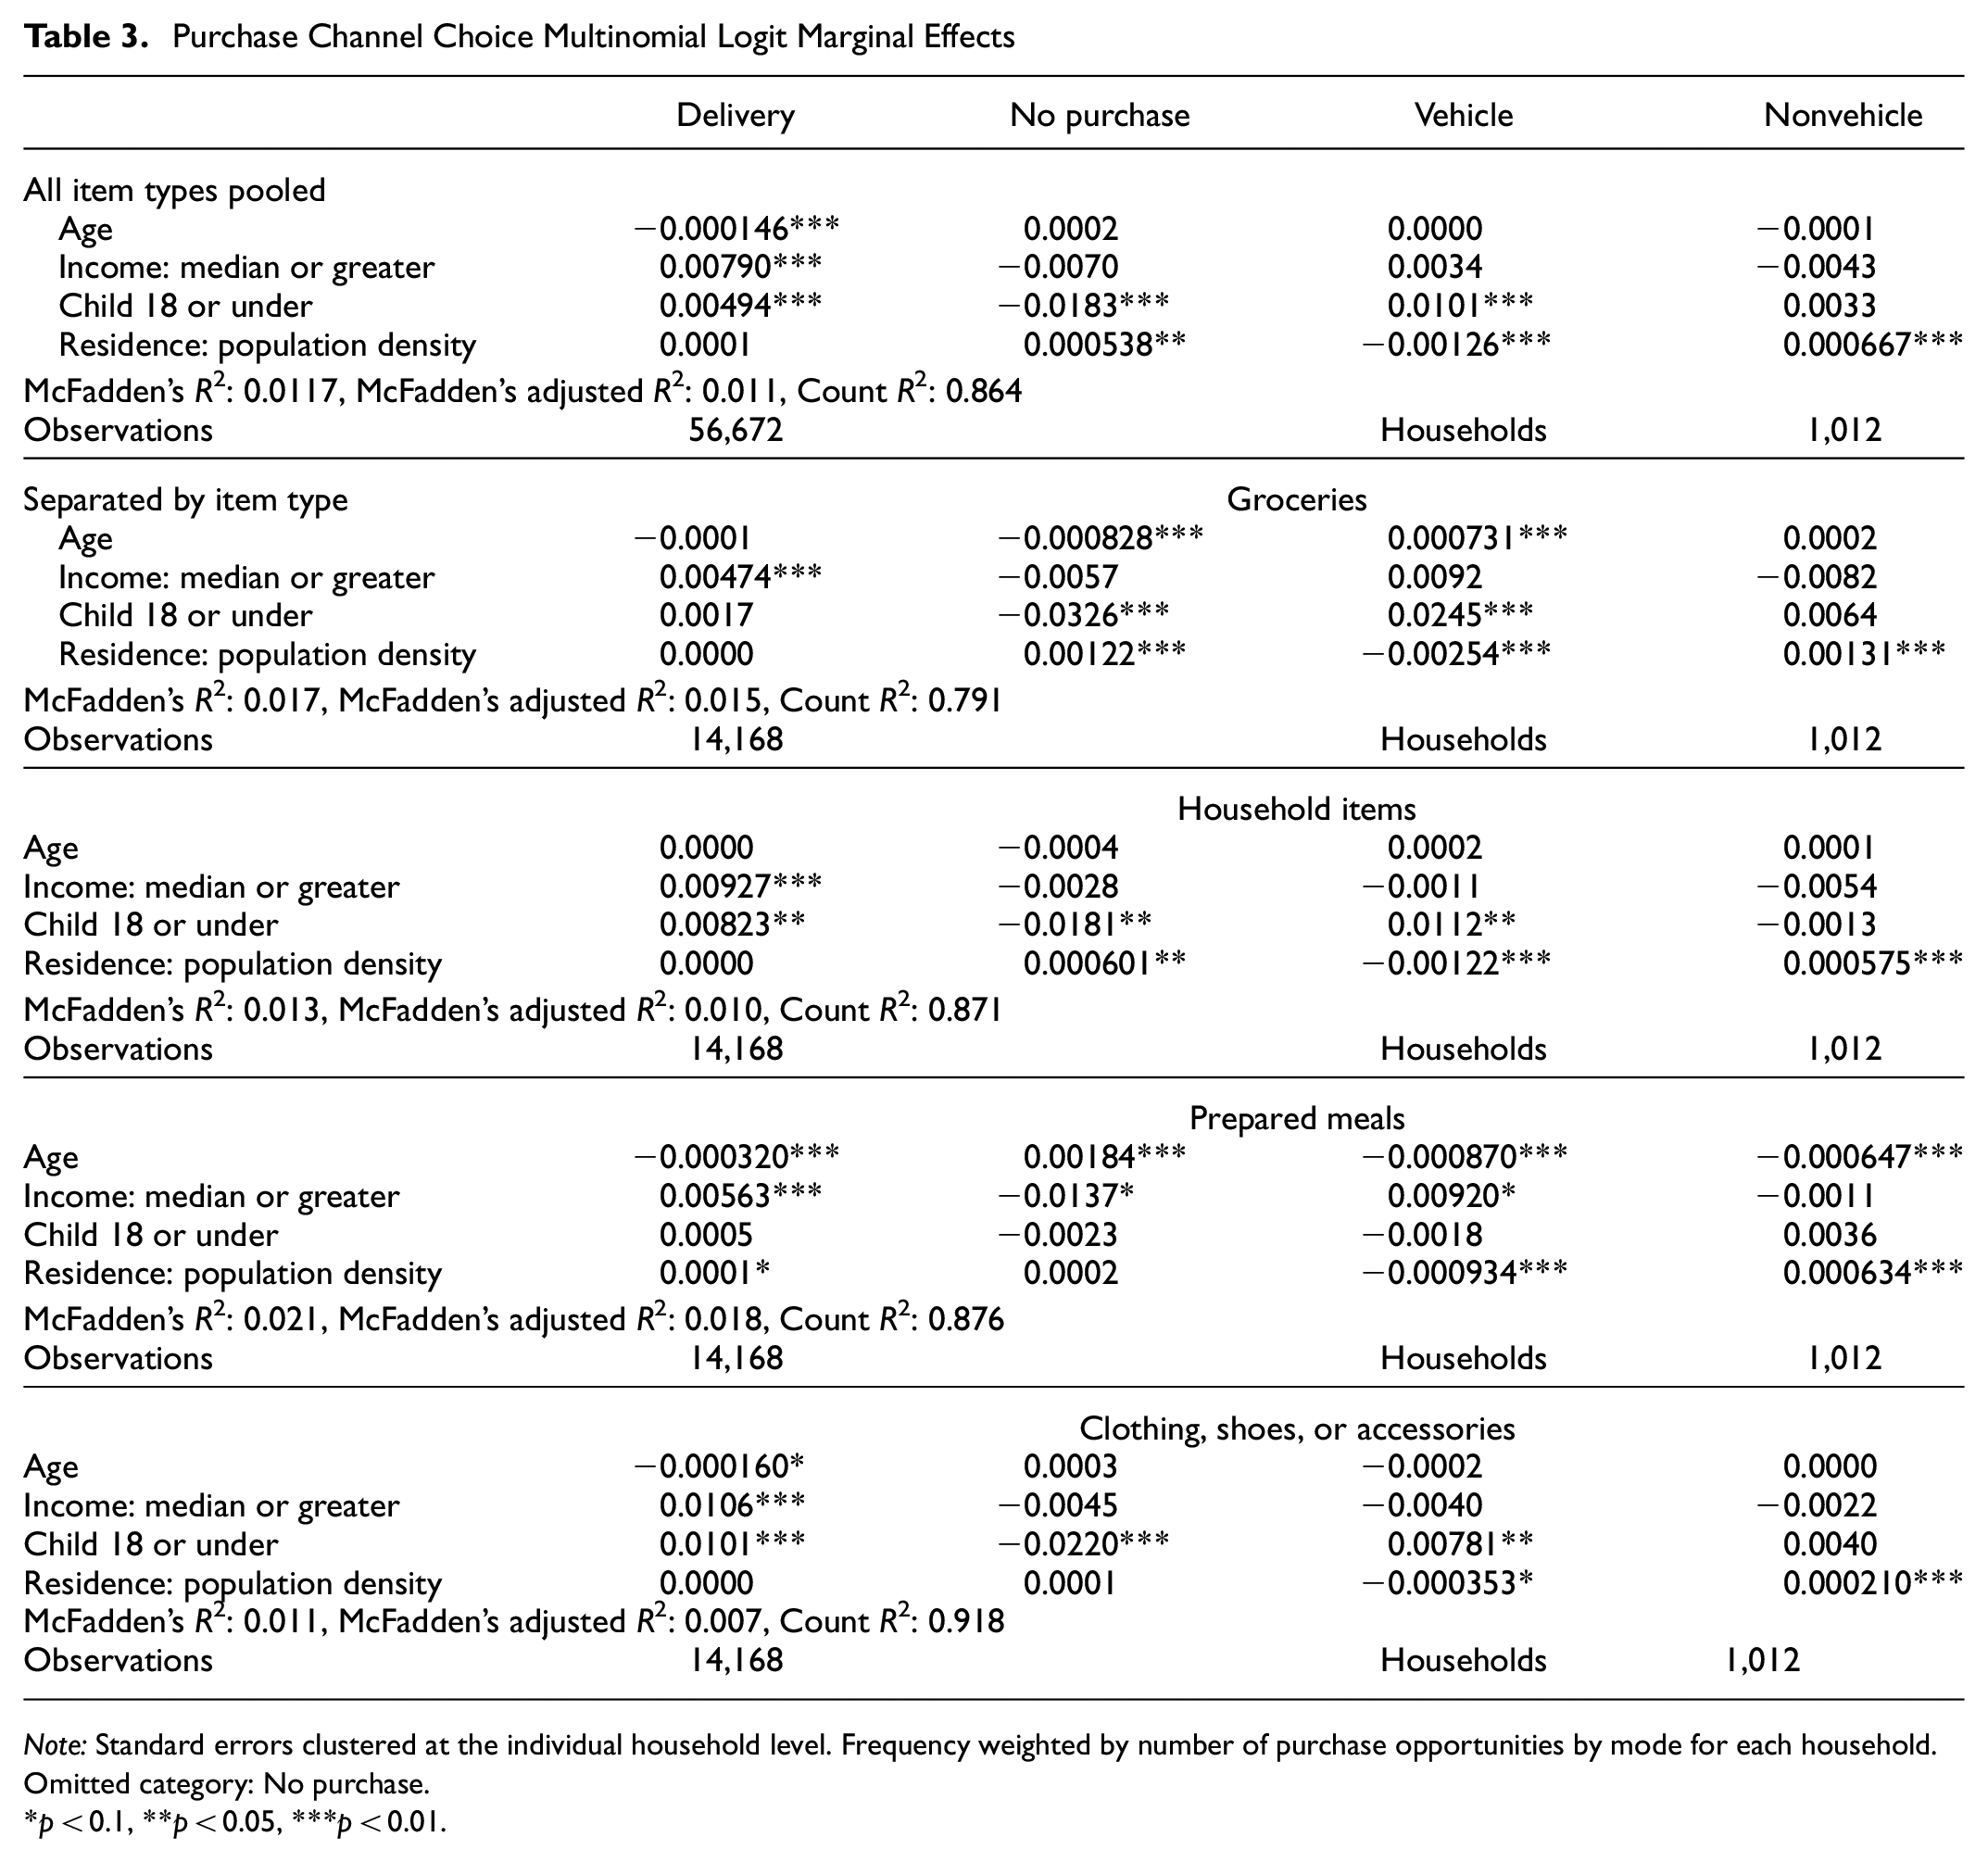
Note: Standard errors clustered at the individual household level. Frequency weighted by number of purchase opportunities by mode for each household. Omitted category: No purchase.
p < 0.1, **p < 0.05, ***p < 0.01.
Overall Degree of Supplementation and Substitution of Delivery for Shopping Trips
If users were not able to have deliveries, they would change their shopping behaviors. Figure 5 shows how purchase trips are affected by the availability of delivery. In the figure the 100% mark reflects the number of shopping trips that would be made if delivery was not available. Looking at the total changes we see that:
Delivery replaced 12 percentage points worth of vehicle trips.
Delivery replaced three percentage points worth of nonvehicle trips.
Delivery added nine percentage points worth of extra goods transportation activities (via delivery vehicle).
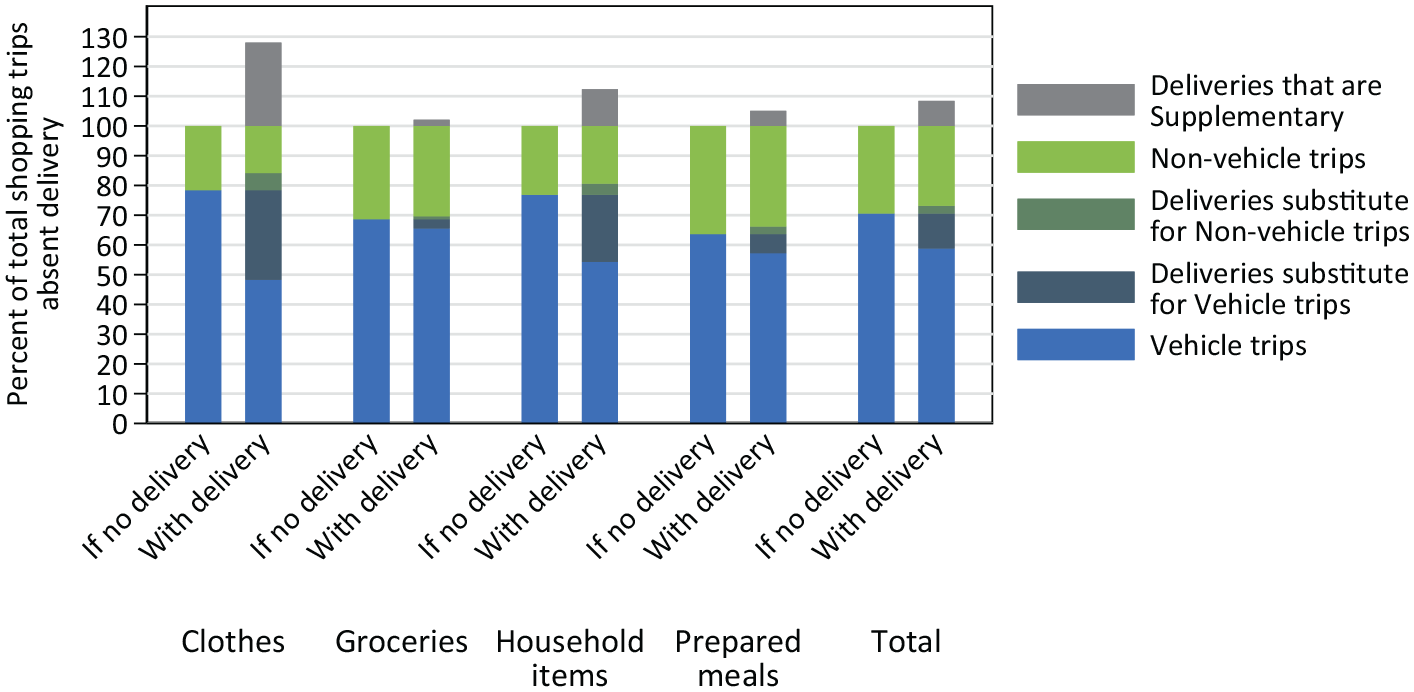
Overall degree of substitution and supplementation of delivery for household shopping trips.
Delivery affected shopping trips most for clothing and least for groceries. The proportion of deliveries that substituted for vehicle trips was similar to the proportion of deliveries that supplemented existing trips for all except household items, which tended to exhibit more substitution than supplementation.
Heterogeneity in the Degree of Supplementation and Substitution of Delivery for Shopping Trips
Similar to overall purchase patterns, the degree of supplementation or substitution was highly dichotomous across households, at least within the week-long time frame for which data were requested from respondents (Figure 6a). For about 55% to 70% of households, deliveries perfectly substituted for existing trips, whereas for 20% to 35% of households, deliveries perfectly supplemented existing trips. Clothing deliveries were more balanced across the two ends of the spectrum (55% perfect substitution, 35% perfect supplementation), whereas groceries and household items exhibited the most asymmetry (65% to 70% perfect substitution, 20% to 25% perfect supplementation).
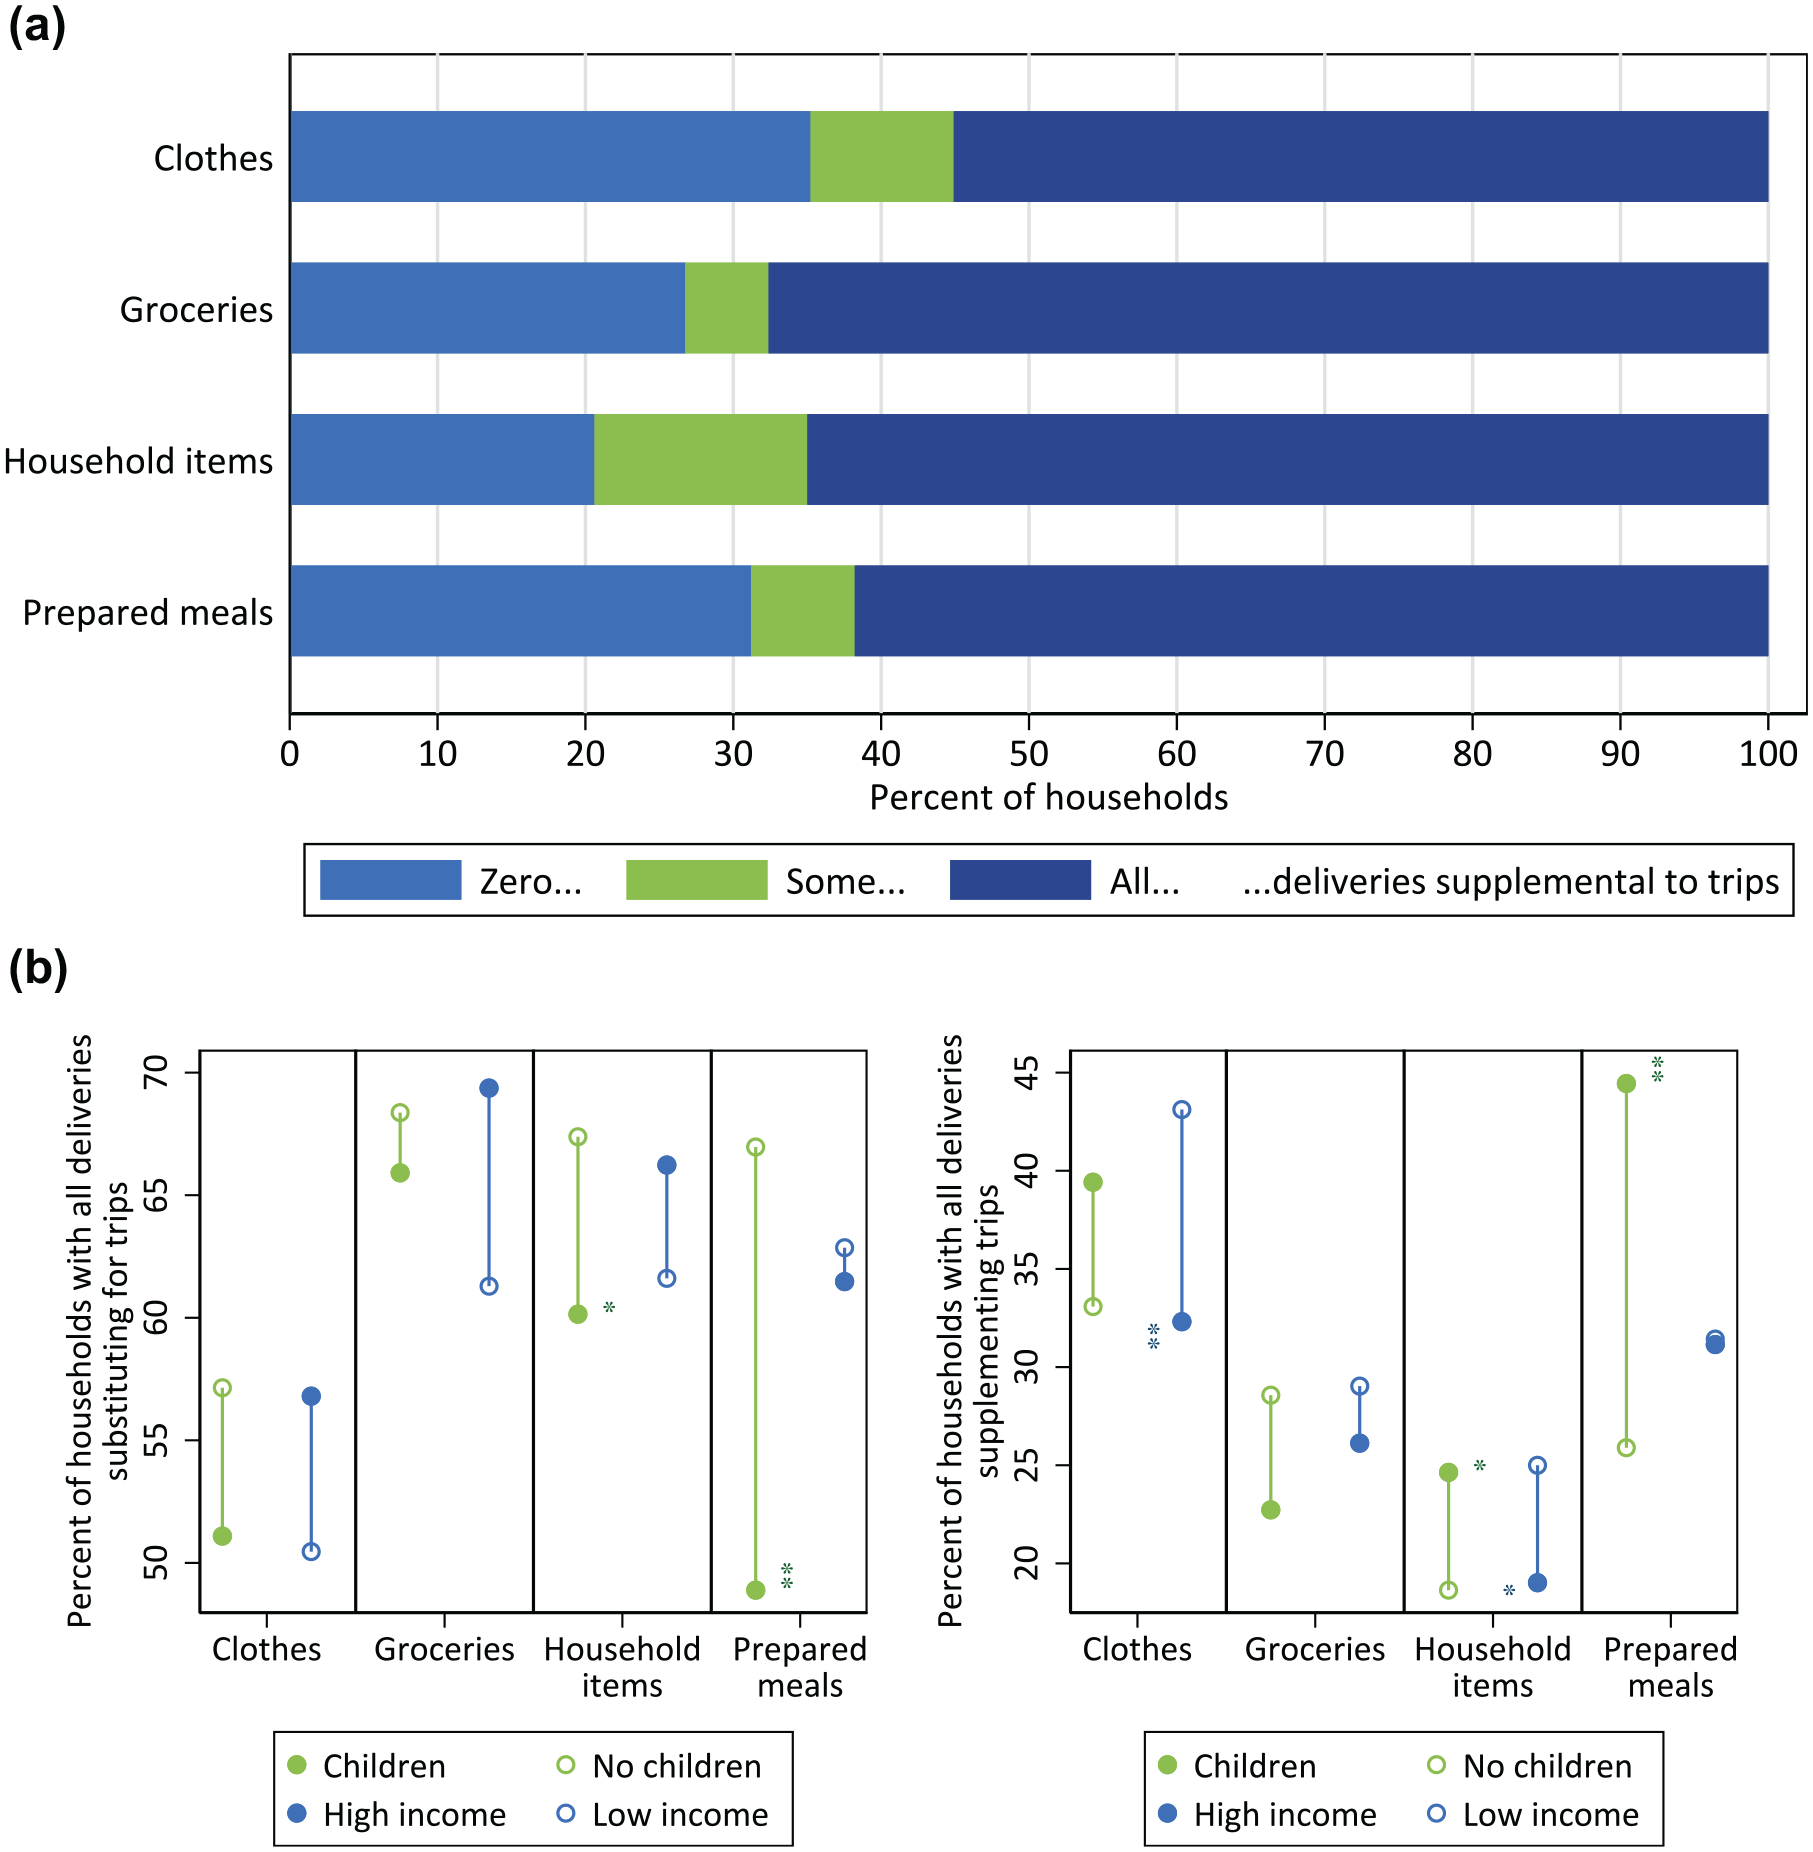
Percent of households (a) for whom zero, some, or all deliveries supplemented shopping trips, and (b) the breakdown of the two ends of the distribution by household characteristic.
As shown in Figure 6b, for household items and prepared meals, counter to Hypothesis 4, households with children were significantly less likely to have all deliveries substitute for trips and more likely to have all deliveries supplement trips. Whereas consistent with Hypothesis 4, high-income households were less likely to have all their deliveries supplement trips compared with low-income households in the case of clothing and prepared meals.
Multinomial Logit Results Relating Supplementation and Substitution of Delivery for Shopping Trips to Household Demographics
Table 4 shows the marginal effect from a multinomial regression modeling the choice that a delivery supplements trips, substitutes for a vehicle trip, or substitutes for a nonvehicle trip. The full model output including estimated coefficients, standard errors, confidence intervals, and extensive fit statistics can be found in Appendix C. Reinforcing the results shown in Figure 6, Table 4 shows that households with children were more likely to have deliveries supplement existing trips and less likely to have them substitute for vehicle trips overall; for prepared meals in particular, deliveries for these households were relatively more likely to supplement existing trips, with a marginal effect that was both large (15 percentage points) and significant. Although Figure 6 depicted higher-income households being less likely to have all their deliveries supplement trips, here we see that in contrast to Hypothesis 4, higher-income household deliveries were not systematically more or less likely than those of low-income households to either supplement or substitute trips, with one exception: in the case of prepared meals, high-income households were actually more likely to supplement shopping trips (12 percentage points), and less likely to substitute for vehicle trips (16 percentage points). Relative youth was associated with more supplementation and less substitution for vehicle trips (especially for household items and clothing, shoes, or accessories), and more substitution for nonvehicle trips (especially for prepared meals). High population density was associated with more substitution for nonvehicle trips, less supplementation (in the case of groceries), and less substitution for vehicle trips (in the case of prepared meals and clothing, shoes, or accessories). It should be noted that the model for grocery purchases alone was under-powered, lacked satisfactory fit, and provided little in the way of meaningful results, but is included for completeness, so even the one significant result about population density should be interpreted with caution.
Substitution/Supplementation Choice Multinomial Logit Marginal Effects
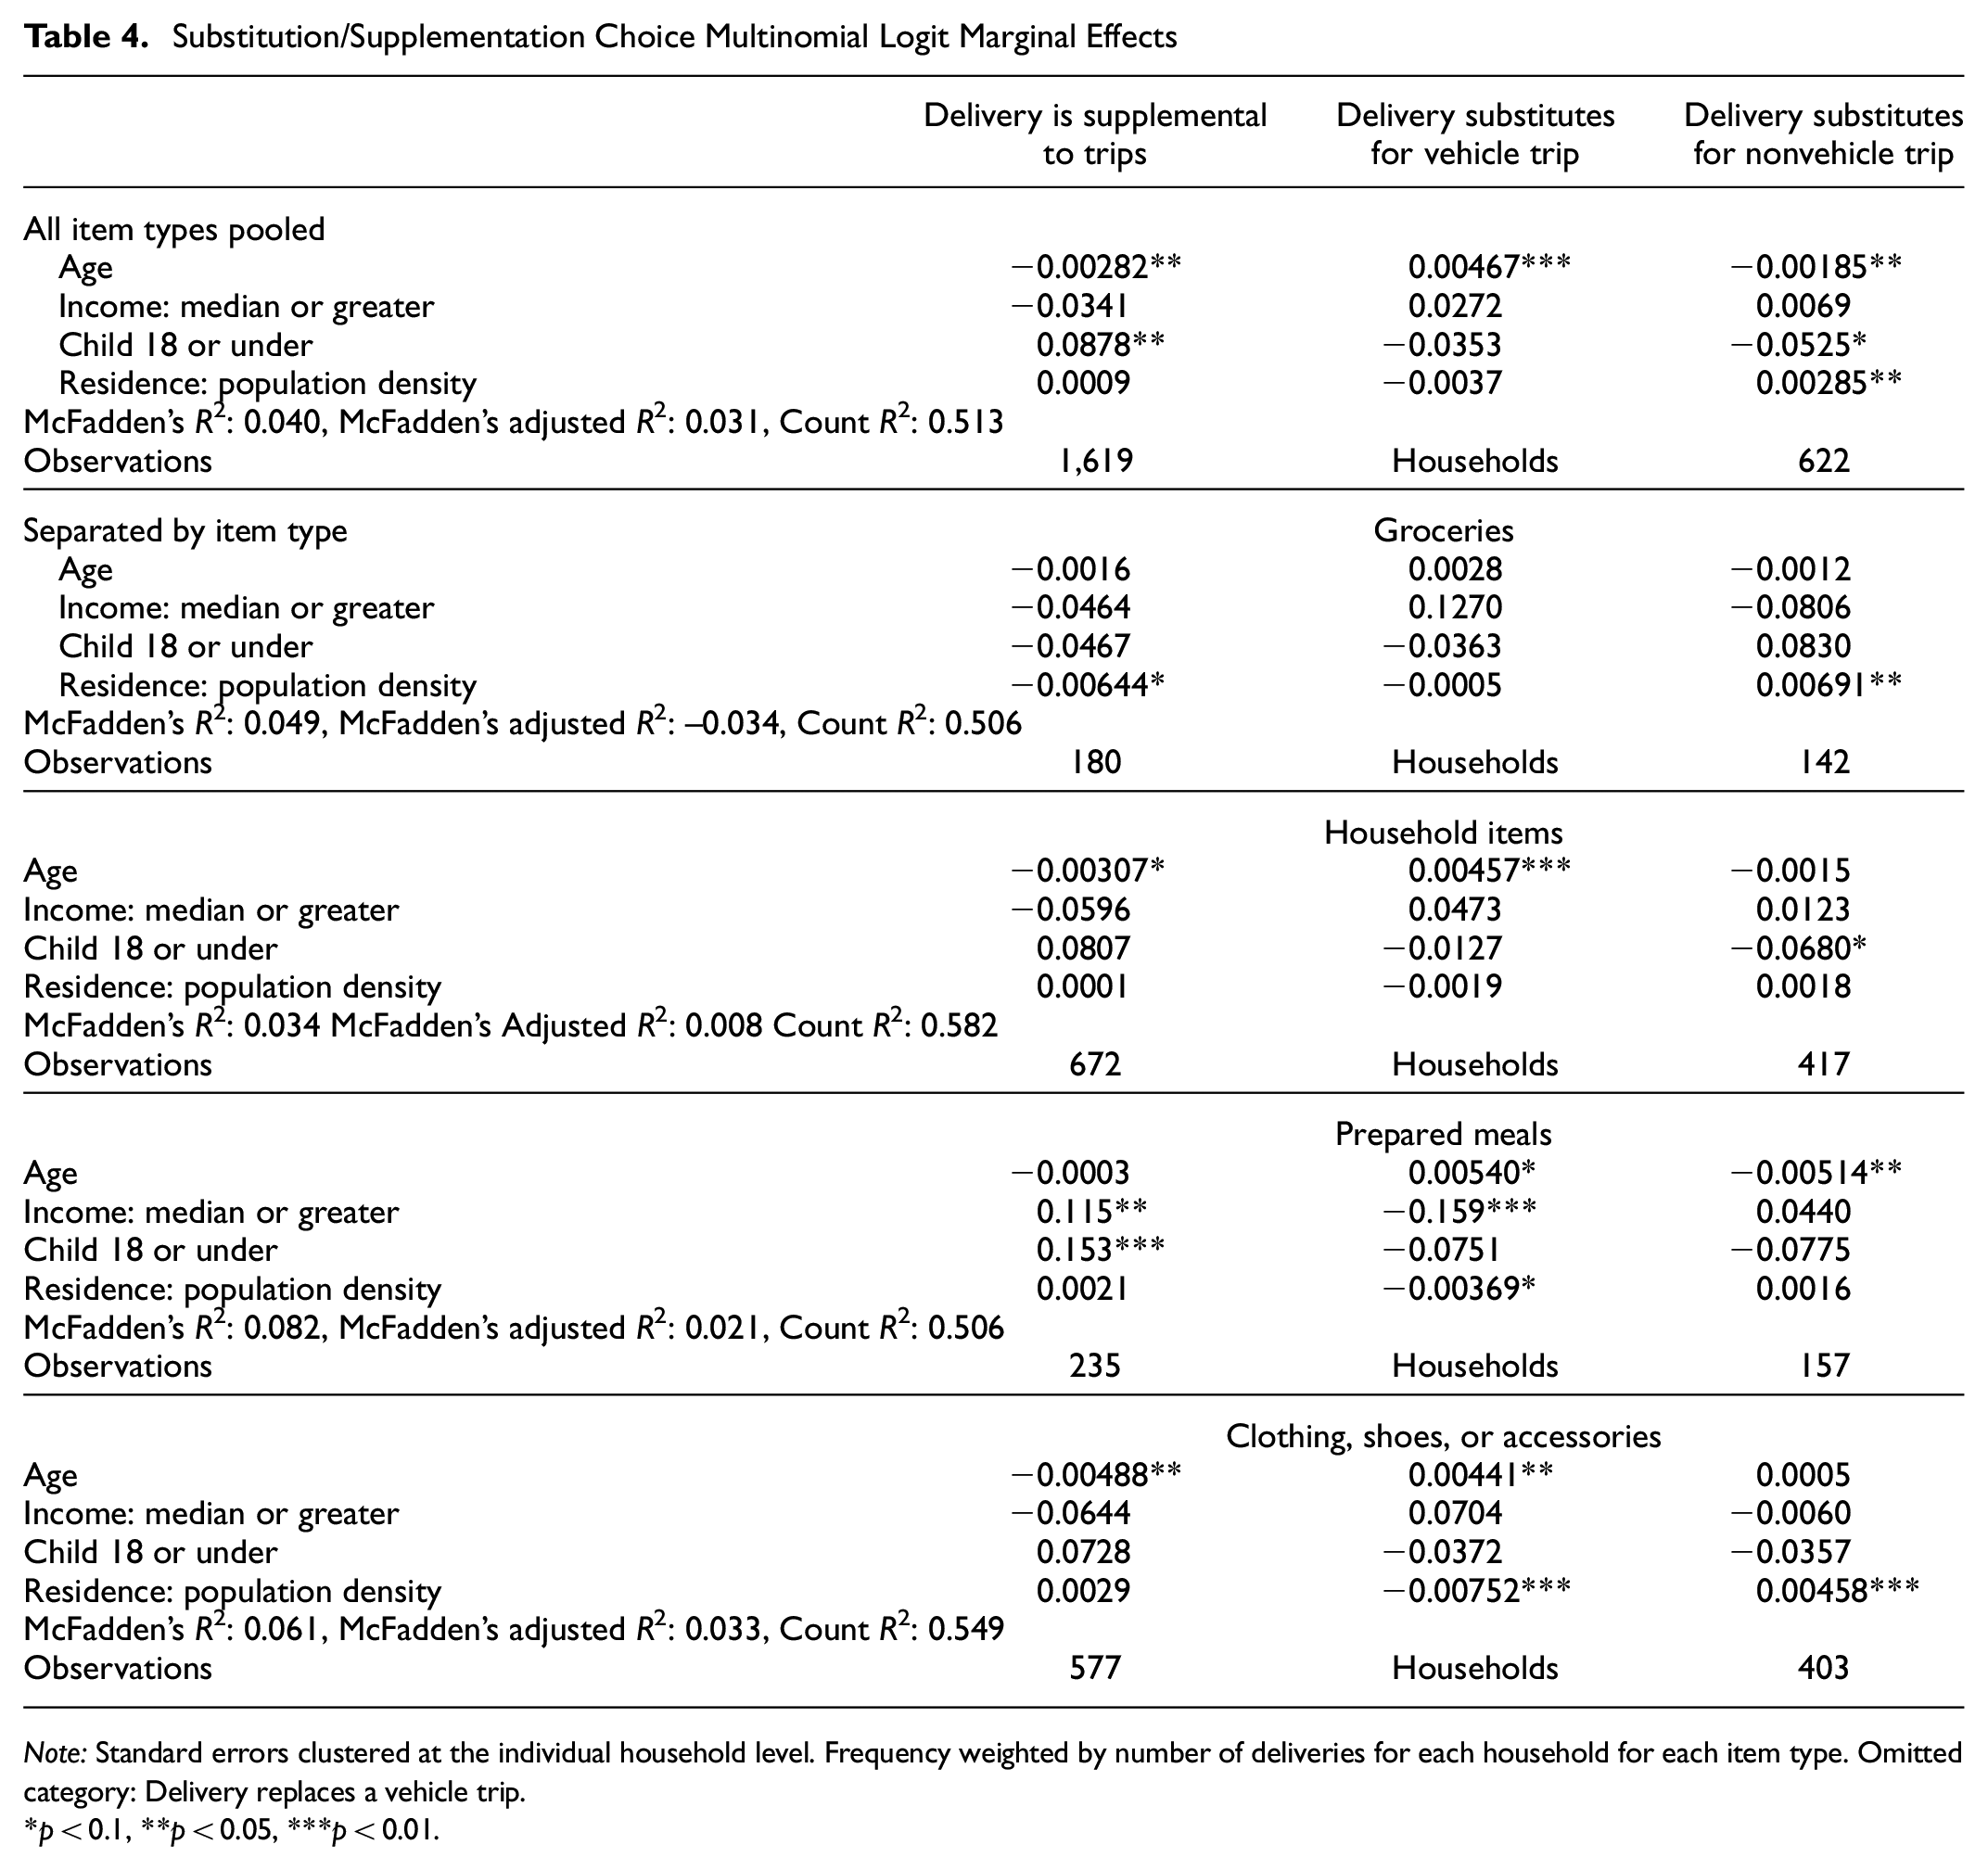
Note: Standard errors clustered at the individual household level. Frequency weighted by number of deliveries for each household for each item type. Omitted category: Delivery replaces a vehicle trip.
p < 0.1, **p < 0.05, ***p < 0.01.
Discussion and Conclusion
As a whole, we found that the question of how increased online shopping and expanded goods delivery affected household shopping trips had a nuanced and complicated answer. We found, in aggregate, evidence to support the subset of the literature (15–18) that has found more substitution for vehicle trips on net as opposed to supplementation. However, there was significant heterogeneity in shopping mode choice and in the degree to which engagement in e-commerce supplements or substitutes for shopping trips. Interestingly, consistent with Weltevreden and van Rietbergen, we found that for a large proportion of our sample deliveries either fully substituted for (55% to 70%) or fully supplemented (20% to 35%) shopping trips ( 41 ). This was in contrast to all households using deliveries to both supplement and substitute for a few of their shopping trips. This may relate to the relatively short time frame of the date requested (a single week’s worth of purchases), but stands out nonetheless.
We found evidence consistent with all of our hypotheses with one interesting exception. We found, consistent with Hypothesis 1 and previous literature (4, 5, 7, 8), that time savings and convenience, among other factors, were important to consumers when considering whether or not to make a purchase online; specifically, time saving was more of a motivating factor for higher-income households and households with children relative to their counterparts. In addition, consistent with Hypothesis 2, lower-income people were more likely to be negatively influenced by delivery charges. However, the motivation for time savings related to delivery utilization, and the degree to which these deliveries substituted and supplemented for shopping trips, was mixed. On the one hand, consistent with Hypothesis 3, higher-income households were more likely to receive deliveries overall, and across all item types. Households with children were also relatively more likely to choose delivery, particularly for household items and clothing, compared with households with no children. On the other hand, however, the time-saving motivation for these categories of households did not translate through to these deliveries being relatively more likely to substitute for shopping trips. Indeed, prepared meal purchase behavior was an interesting case demonstrating significant distinctions between high- and low-income households and households with and without children. Households with children (by 15 percentage points) and higher-income households (by 12 percentage points) were significantly more likely to have prepared meal delivery supplement trips relative to their counterparts. This speaks to how the increased convenience and time-saving aspects of meal delivery may actually substitute more for cooking at home, rather than for a trip to a restaurant. Indeed, for higher-income households, prepared meal delivery, which they were more likely to order relative to lower-income households, was actually significantly less likely (by 16 percentage points) to substitute for a vehicle trip relative to lower-income households. These results suggest that the marginal activities, or those activities most likely to be replaced by online shopping with delivery, for those that are either more time constrained or have a higher opportunity cost of time, are not necessarily shopping trips, but rather other time-consuming activities, such as preparing meals. In future research, a more comprehensive modeling of the direct relationship between time constraints and preferences for time savings across a variety of dimensions (not just shopping trips) would help to shed more light on the motivations for online shopping with delivery in different contexts.
Supplemental Material
Appendix – Supplemental material for Children, Income, and the Impact of Home Delivery on Household Shopping Trips
Supplemental material, Appendix for Children, Income, and the Impact of Home Delivery on Household Shopping Trips by C. Anna Spurlock, Annika Todd-Blick, Gabrielle Wong-Parodi and Victor Walker in Transportation Research Record
Footnotes
Acknowledgements
The following DOE Office of Energy Efficiency and Renewable Energy managers played important roles in establishing the project concept, advancing implementation, and providing ongoing guidance: David Anderson, Heather Croteau, Prasad Gupte, Rachael Nealer, and Jake Ward. The authors would also like to thank Ted Kwasnik and Scott Carmichael of the National Renewable Energy Laboratory (NREL), as well as Terry Chan and Morgan Faulkner of Lawrence Berkeley National Laboratory (LBNL) for their help with technical and administrative support and data collection; Andrew Duvall of NREL, Margaret Taylor, James Sears, Saika Belal, Ling Jin, and Anand Gopal of LBNL for contributing to the discussion surrounding the survey design and analysis plan; and Jarett Zuboy, a subcontractor to LBNL, for technical editing.
Author Contributions
The authors confirm contribution to the paper as follows: principal investigator and lead on the study concept, design, and analysis: CAS; data analysis and data visualization: AT-B; literature review and writing: GW-P, VW. All authors contributed to the writing and revision of the manuscript, reviewed the results, and approved the final version of the manuscript.
Declaration of Conflicting Interests
The author(s) declared no potential conflicts of interest with respect to the research, authorship, and/or publication of this article.
Funding
The author(s) disclosed receipt of the following financial support for the research, authorship, and/or publication of this article: This paper and the work described were sponsored by the U.S. Department of Energy (DOE) Vehicle Technologies Office (VTO) under the Systems and Modeling for Accelerated Research in Transportation (SMART) Mobility Laboratory Consortium, an initiative of the Energy Efficient Mobility Systems (EEMS) Program, under Lawrence Berkeley National Laboratory Contract No. DE-AC02- 05CH11231 and Idaho National Laboratory Contract No. DE-AC07-05ID14517.
Data Accessibility Statement
The data used in this analysis were collected as part of the WholeTraveler Transportation Behavior Study. The data from the WholeTraveler survey are not yet publicly archived, but they will be in the future. Researchers interested in the data used in this analysis should reach out to the authors, specifically C. Anna Spurlock (
Supplemental Material
Supplemental material for this article is available online.
References
Supplementary Material
Please find the following supplemental material available below.
For Open Access articles published under a Creative Commons License, all supplemental material carries the same license as the article it is associated with.
For non-Open Access articles published, all supplemental material carries a non-exclusive license, and permission requests for re-use of supplemental material or any part of supplemental material shall be sent directly to the copyright owner as specified in the copyright notice associated with the article.