
Abstract
Inspired by developments in urban planning, the concept of “shared space” has recently emerged as a way of creating a better public realm. This is achieved through a range of streetscape treatments aimed at asserting the function of streets as places by facilitating pedestrian movement and lowering vehicle traffic volumes and speeds. The characteristics of streets with elements of shared space point to the conjecture that traffic conditions and road user perceptions may be different to those on streets designed according to more conventional principles, and this is likely to have an impact on the quality of service. The aim of this paper is, therefore, to perform an analysis in relation to level of service (LOS) and to investigate how this may change as a result of the implementation of street layouts with elements of shared space. Using video data from the Exhibition Road site in London during periods before and after its conversion from a conventional dual carriageway to a layout featuring several elements of shared space, changes in relation to LOS for both vehicle traffic and pedestrians are investigated, by applying the corresponding methods from the 2010 Highway Capacity Manual. The results suggest that streets with elements of shared space provide a much improved pedestrian experience, as expressed by higher LOS ratings, but without compromising the quality of vehicle traffic flow, which, in fact, also sees slight improvements.
The concept of “shared space” has gained global traction in recent years as a novel approach to the design of urban streets, where both pedestrians and vehicles are present (Figure 1). At its core, shared space aims at asserting the function of streets as places rather than as arteries, and this entails designing layouts geared for easier pedestrian movement and lower vehicle speeds. As such, shared space contrasts with the traditional car-oriented approach, which is based on greater segregation of pedestrians and vehicles to ensure unobstructed traffic flow ( 1 ).
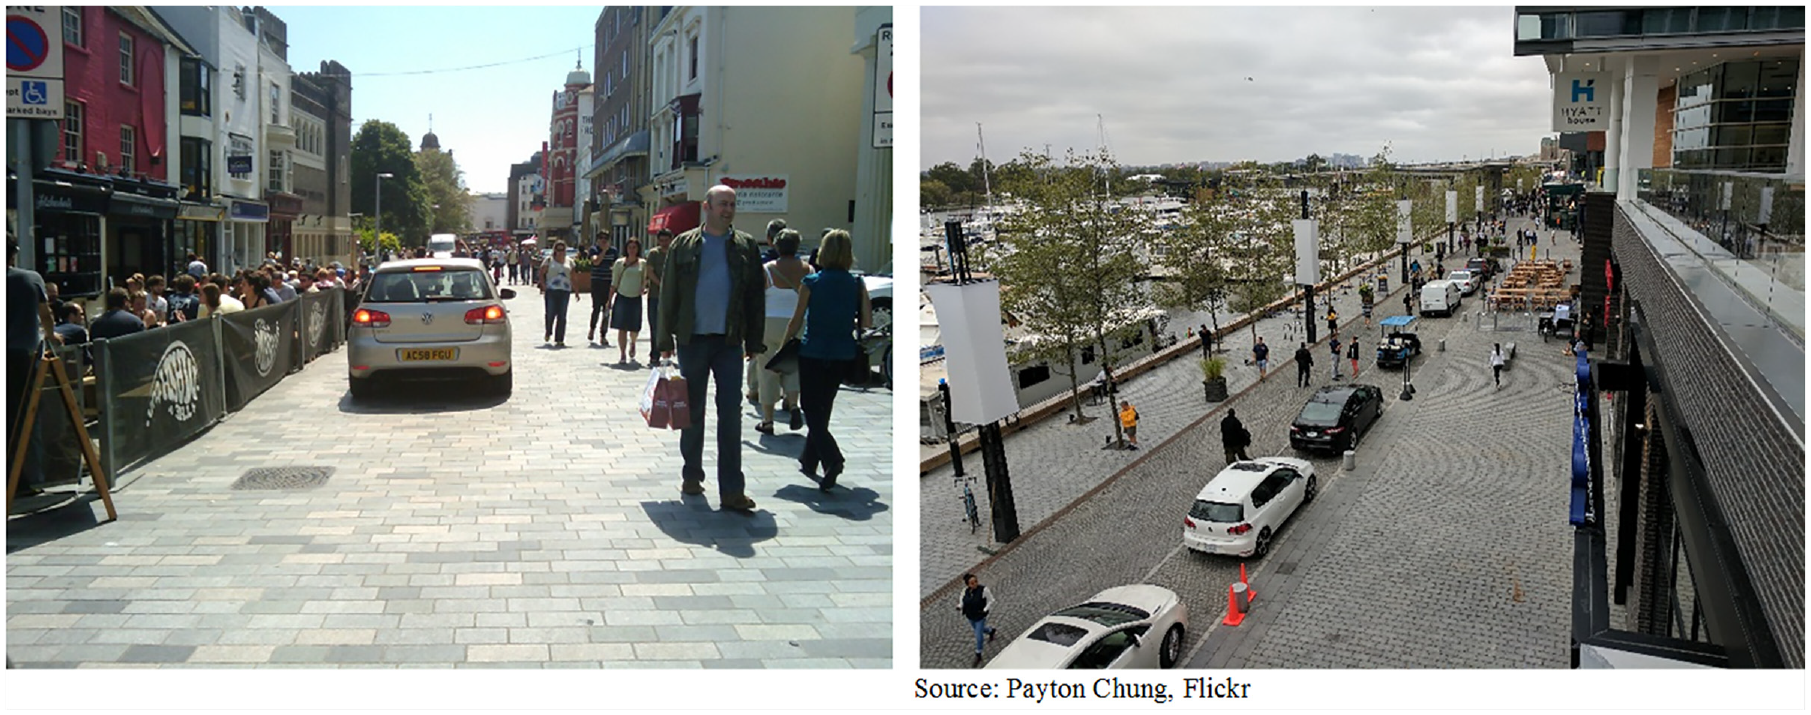
Examples of shared space: (left) New Road, Brighton, UK and (right) The Wharf, Washington, DC, U.S.A.
Elaborating more on the term “shared space,” conversely to popular belief, this is not used to characterize entire streets as “shared” or “not shared,” particularly given that streetscape design cannot be standardized and needs to be context-sensitive. Instead, shared space is used as an “umbrella” term to refer collectively to a range of streetscape treatments, aiming at creating a more pedestrian-friendly environment. These may range from the removal of guardrails and the introduction of “informal” (uncontrolled) pedestrian crossing facilities in a traditional “kerbed” street layout, through to layouts with a single surface and little delineation between pedestrian and vehicle areas (2–5). Examples of streets with varying extents of shared space elements can be found around the world and include: the concepts of “woonerf” and “home zone” in residential areas in the Netherlands and UK respectively; the “Manual for Streets” approach in the UK (6, 7); and the “Complete Streets” initiative in the U.S.A. ( 8 ).
The characteristics of streets with elements of shared space point to the conjecture that traffic conditions and road user perceptions on such streets may be different than those on streets designed according to more conventional principles. Indeed, it is aspired, through shared space designs, to encourage high levels of street sharing, which translates to enabling pedestrians to move more freely around the street and use parts of it that would otherwise be dedicated to vehicle traffic. Naturally, higher levels of sharing are likely to affect the quality of service offered, as most recently defined in the 2016 Highway Capacity Manual (HCM 2016) ( 9 ), and it can be hypothesized that significant increases in pedestrian quality of service may be accompanied by minor decreases in vehicle traffic capacity. Nevertheless, to the best of the authors’ knowledge, this hypothesis has yet to be verified, as a comprehensive assessment of the level of service (LOS) of streets designed according to the principles of shared space has not been carried out.
The aim of the present study is, therefore, to evaluate the quality of service for both vehicle traffic and pedestrians, and specifically to investigate how the respective LOS ratings may change as a result of the implementation of street layouts with elements of shared space. The analysis is carried out at the Exhibition Road site in London’s South Kensington area, with data coming from video observations during periods before and after its conversion from a conventional divided roadway to a single surface featuring several elements of shared space. The relevant vehicle LOS (VLOS) and pedestrian LOS (PLOS) methods from the Highway Capacity Manual 2010 ( 10 ) are used, as opposed to the most recent HCM 2016 ( 9 ), as much of the analysis pre-dates the publication of the latter. The work complements previous research on the topic, which assessed the behavior and perceptions of road users in street designs with elements of shared space by looking at pedestrian–vehicle traffic conflicts (11, 12) and behavioral interactions ( 13 ), willingness of pedestrians and drivers to share ( 14 ), and pedestrian gap acceptance behavior ( 15 ).
The present paper is structured as follows. The second section presents the background of the study, focussing primarily on the LOS concept and on previous research related to the capacity of shared space. The third section goes on to introduce the study site and to report on the data collection carried out. The fourth section then outlines the VLOS and PLOS methods, describes the various steps involved, and elaborates on the practical steps of the analysis. The fifth section presents the results and discusses the trends in vehicle and pedestrian quality of service in relation to elements of shared space. The final section concludes the paper and identifies areas of future research.
Background
The LOS method, according to HCM 2010 ( 10 ) and HCM 2016 ( 9 ), is designed to translate complex road performance and experience factors into a single indicator that reflects the quality of service perceived by road users. The indicator is calculated using mathematical models based on various service measures, and consists of a six-level evaluation system, with scores ranging from A (best conditions) to F (worst conditions). The LOS method is used by operational agencies to assess whether the performance of road facilities is satisfactory and also whether changes in the future would tend to be supported by the general public. It also provides guidance for transport engineers and planners to predict facility operating conditions from a planning level. Given that LOS is a simplified and straightforward indicator, it can then function as the basis of decision making for policy makers who may not necessarily have the relevant technical background.
The LOS concept was originally designed to assess the quality of service of highway and street facilities from the viewpoint of motorized traffic. The respective VLOS method was initially presented in the 2nd edition of the Highway Capacity Manual in 1965 ( 16 ) and has seen several revisions since then until the current 6th edition (HCM 2016) ( 9 ). It considers the speed, traffic density, travel time, and delays for vehicle traffic to provide an overall indicator of how drivers perceive the traffic condition and road environment. It has been extensively applied in numerous case studies in the U.S.A. and internationally, and has formed the basis of the respective manuals of many other countries (e.g., Germany [ 17 ]).
In the later versions of the HCM the LOS concept was extended to pedestrians, enabling the assessment of the quality of service provided on walkways, pedestrian crossings, and other types of pedestrian facilities, reflecting pedestrians’ perceptions of the surroundings and of the traffic conditions. The relevant PLOS method, first introduced by Fruin ( 18 ) and refined thereafter, quantifies the performance on the basis of complex factors that may influence the pedestrian movements and walking experience, and, just like VLOS, delivers a score ranging from A to F. Being a more recent addition to the HCM methods, PLOS has seen fewer applications than VLOS, with perhaps the most prominent example having been a 2006 case study in New York City ( 19 ). In that study, the criteria of the average pedestrian space, flow rate, walking speed, and volume-to-capacity ratio were applied, and the outcome was a universal standard for the evaluation of different types of pedestrian facilities, which could be applied in other cities with different characteristics and required only limited input data. Nevertheless, the application focussed predominantly on the geometrical features and pedestrian traffic conditions, and devoted little attention to the interaction of pedestrians with other road users.
Refinements of the PLOS method (e.g., 20–22) have been included in HCM 2010 and HCM 2016, and have thus provided the ability to consider the role of pedestrians in multimodal traffic and to evaluate their perception of the presence of other road users. In a recent study ( 23 ) the PLOS method was applied on a mixed lane environment and the PLOS index was related with several influencing factors by means of regression analysis. It was found that, in addition to the conditions of pedestrian movement (flow, speed, etc.), PLOS was also influenced by the levels and patterns on vehicle traffic and roadside parking. But while mixed lanes bear some similarity with shared space schemes, there are fundamental differences, in that the former essentially “force” pedestrians to share some of the space with vehicle traffic, while the latter are designed to encourage them to do so. It can be, therefore, anticipated, in line with related findings in the field so far (e.g., 24, 25) that shared space features will have a positive contribution to PLOS ratings.
The impact of shared space on VLOS, on the other hand, is less clear. On the one hand, shared space aims at improving the pedestrian environment while at the same time acting as a deterrent to vehicle traffic, and from that viewpoint VLOS ratings would be expected to worsen. On the other hand, however, shared space typically brings about lower traffic flows and speeds, which may result in less congestion, and this may mean improved VLOS scores. Indeed, there is empirical evidence of shared space features having had a positive impact on traffic efficiency, such as, for example, Laweiplein, Drachten, in the Netherlands, and Svallertorget, Norrköping, in Sweden (4, 26–28). More recent systematically obtained evidence from shared and conventionally designed junctions in five countries, including the U.S.A., has also suggested improvements in relation to both pedestrian and vehicle traffic junction delays ( 29 ). Therefore, improved VLOS performance is a potential outcome that cannot be dismissed.
The present study extends existing knowledge by investigating VLOS and PLOS changes through video observation of a street site before and after its redevelopment as a layout with elements of shared space, and the next sections outline how this is done.
Data Collection and Processing
The data collection and processing steps are outlined in this section. This includes a description of the site and is followed by an account of the data collection methods and tools employed. Then, the processing of the data collected is explained, in preparation for the reporting of the analysis methodology and results in the following sections.
Site Description
Exhibition Road is an 800 m long road located in the Royal Borough of Kensington and Chelsea (RBKC) in London and is home to several London’s most popular museums (Natural History, Science, V&A). The surrounding area of South Kensington is well known as a cultural center, including other venues, such as the Royal Albert Hall, as well as many academic institutions, such as Imperial College London. As the previous conventional divided roadway layout of Exhibition Road was crowded (a problem exacerbated by numerous pedestrian barriers) and dominated by high traffic flows and parked vehicles, the RBKC undertook an engineering scheme that included redevelopment featuring several elements of shared space (Figure 2).
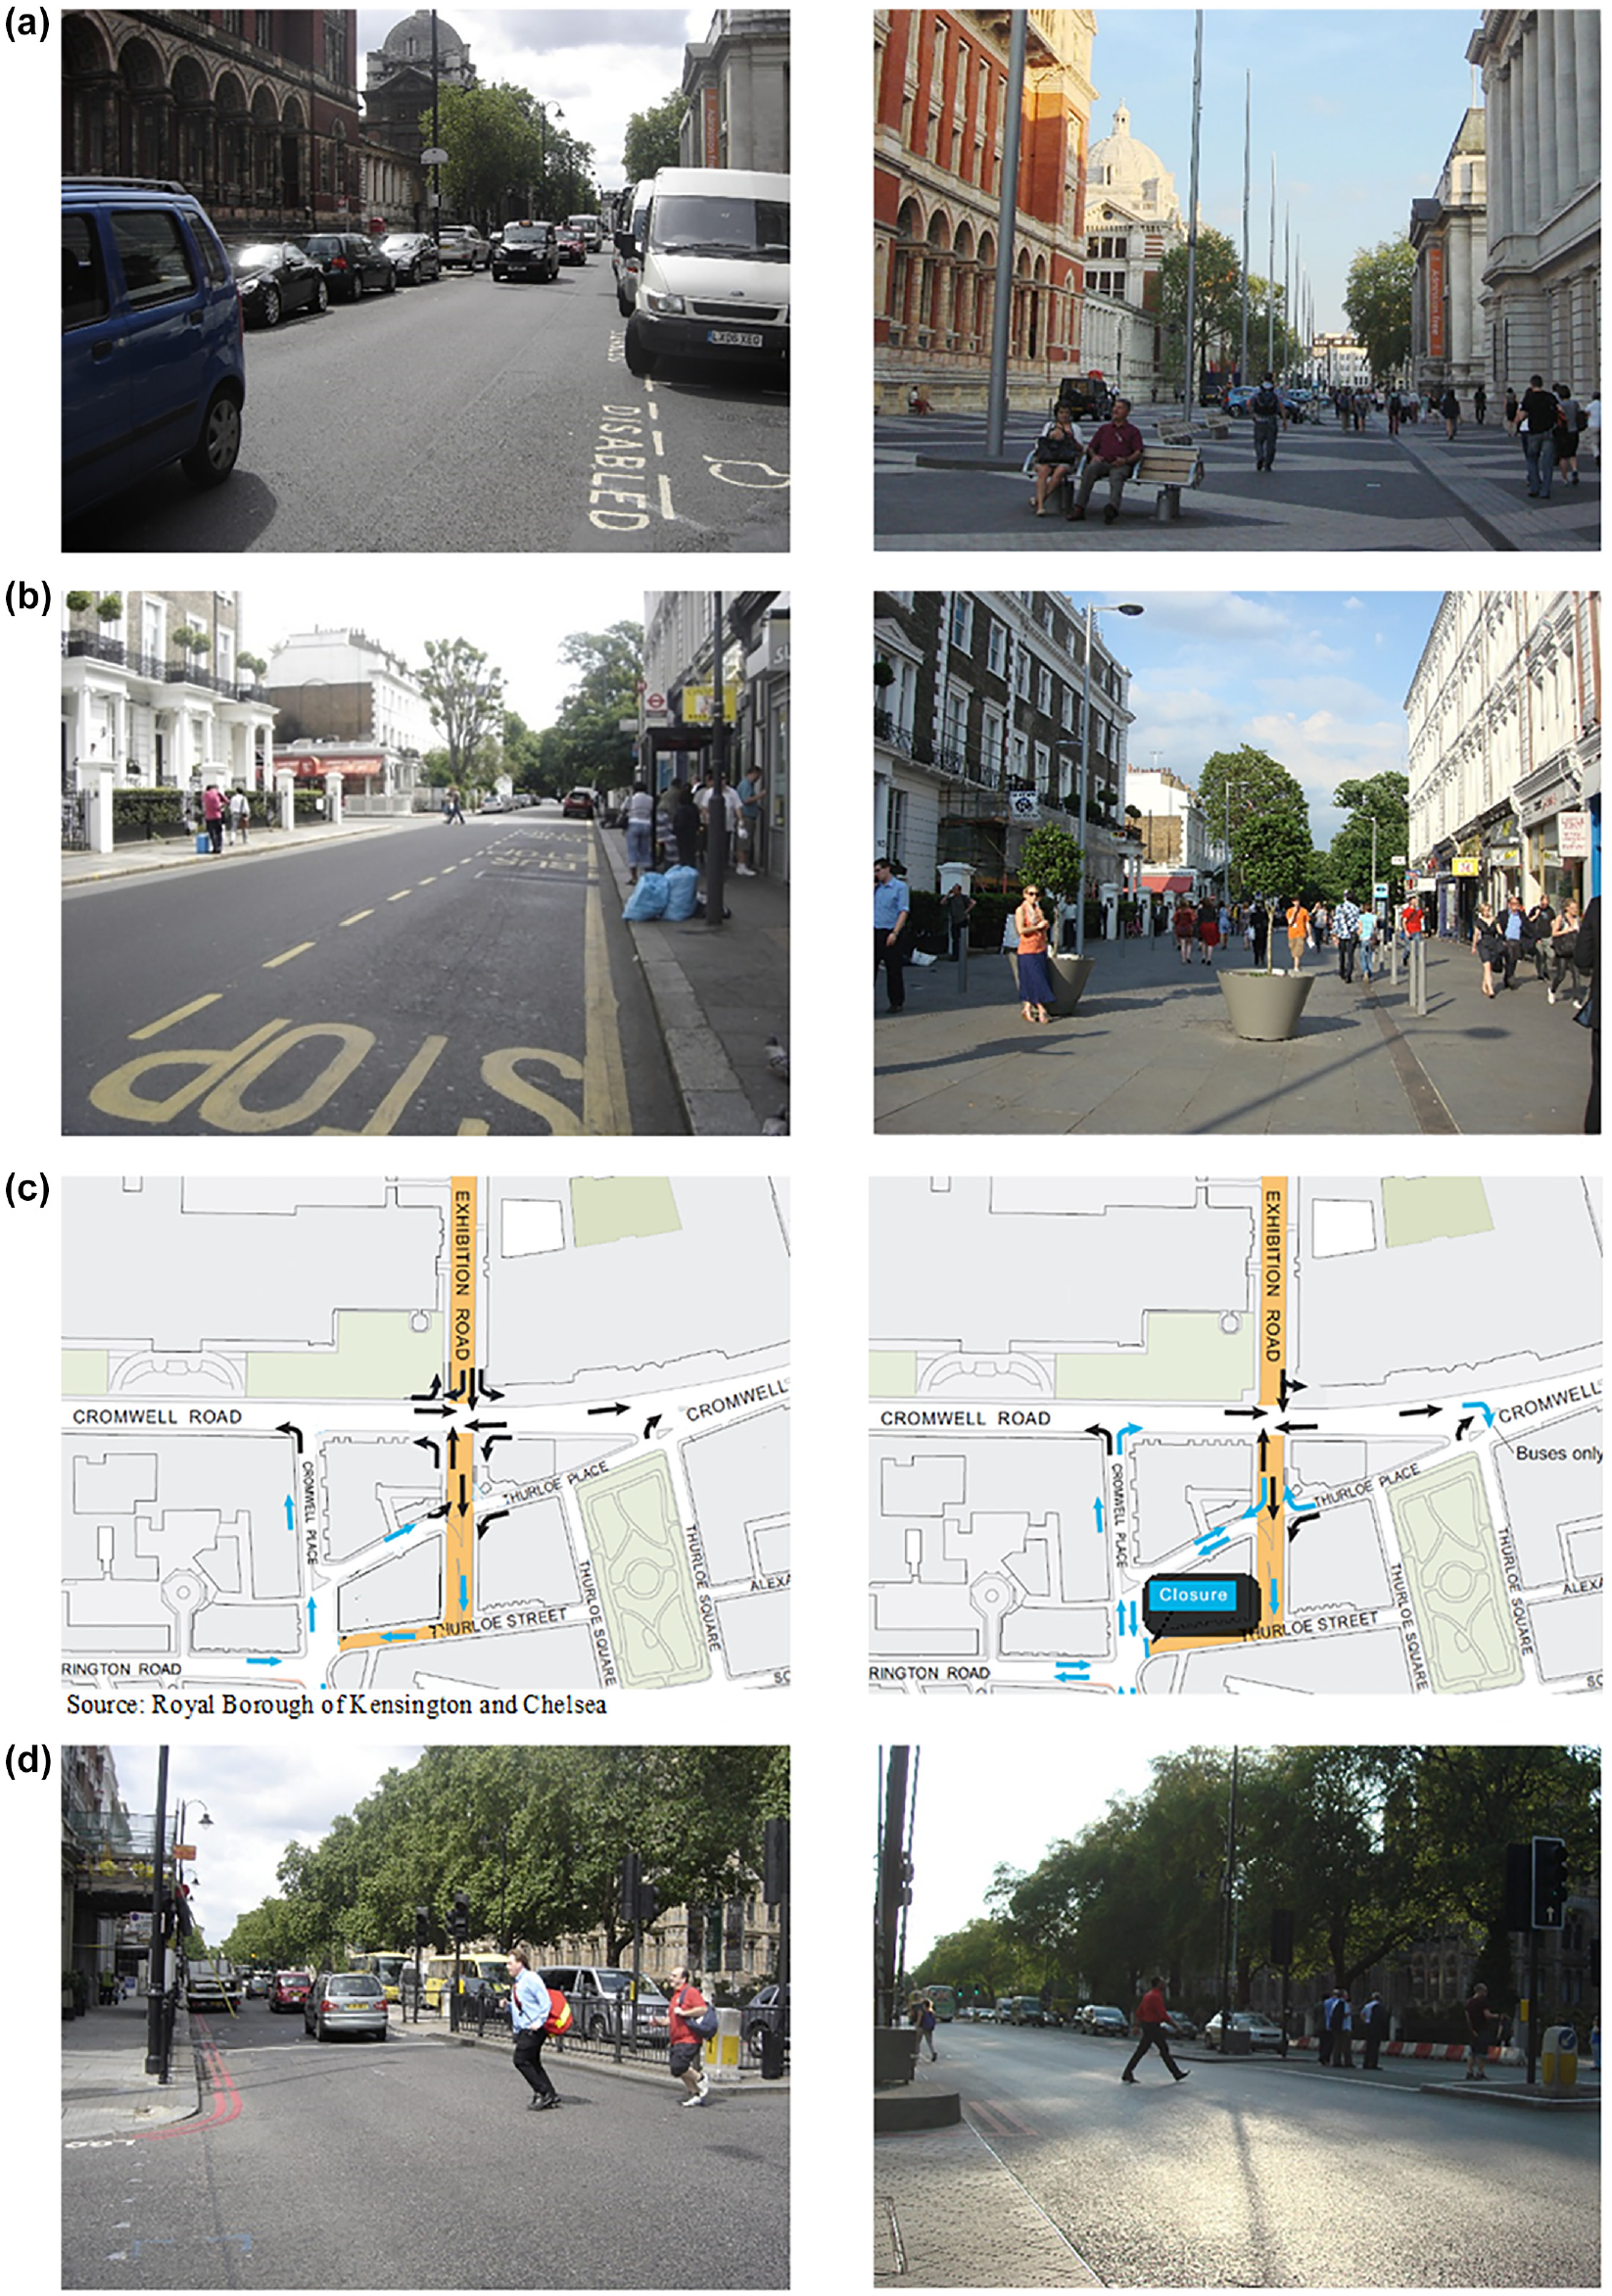
Exhibition Road (left) before and (right) after redevelopment.
The project was implemented over four years from mid-2008 to completion in late 2011. The following three main streetscape treatments were carried out:
Re-allocation of street space (Figure 2a): The previous layout of the 24 m wide Exhibition Road consisted of a 16 m wide divided roadway, accommodating one lane of traffic in each direction as well as ample excess width allocated to parked vehicles, and two 4 m wide footpaths on either side of the carriageway, accommodating pedestrians. As a result of the redevelopment, traffic was shifted to the eastern side of the road to occupy an 8 m wide two-lane road (termed the “traffic zone”), with the former western side of the divided roadway becoming a so-called “transition zone” accommodating primarily pedestrians, but also parking, cycles, and coaches stopping to drop-off or pick-up passengers. The two 4 m footpaths remained in place and formed the so-called “pedestrian zone.” The space also saw the removal of the kerbs and the implementation of an end-to-end single surface, with 800 mm tactile paving strips delineating the pedestrian zone from the traffic and transition zones respectively.
Unravelling of a one-way system (Figure 2, b and c ): In the original layout, a one-way system was in place around the South Kensington Station area, whereby the southbound traffic was led along the southern tip of Exhibition Road and along Thurloe Street, while the northbound traffic was guided along Thurloe Place. As a result of the redevelopment, Thurloe Place was converted to a two-way street, accommodating both the northbound and the southbound traffic, while Thurloe Street was converted to an access-only street.
Re-design of pedestrian crossing facilities (Figure 2d): At the intersection of Exhibition Road with Cromwell Road, the original design included a staggered north–south pedestrian crossing on the western side of the site, which, however was not following the desire-lines and required pedestrians to cross in two stages, thus resulting in a high number of jaywalkers. The redevelopment removed the staggered crossing and replaced it with a wide (12 m) straight-across crossing, allowing pedestrians to complete their crossing in a single phase. The scheme also included the removal of pedestrian guardrails and other street clutter to further facilitate pedestrian movement.
Data Collection
Video footage has been collected through high-mast cameras for periods before and after the redevelopment as part of recent studies analyzing traffic conflicts, behavioral interactions, and gap acceptance in the area (11–13, 15). This has also been complemented by vehicle traffic and pedestrian counts. In this study, the data collected is used to assess the impact of the new design of Exhibition Road on the quality of service, as expressed by VLOS and PLOS ratings. In the before case, the data refers to August 2008, before the start of the redevelopment works, and has been collected from several key locations around the site. For the after situation, the video footage comes from the same locations in October 2011, following the completion of the scheme.
The locations are the following (Figure 3):
L1: Exhibition Road main body (Before: Cameras A & B—After: Cameras 4, 5, 6 & 7):
In the original layout, pedestrians were confined in the two 4 m wide sidewalks on either side of the divided roadway layout. These, however, were often crowded by queuing visitors waiting to enter the various museums, thus acting as a barrier to pedestrian movement. At the same time, vehicle traffic was often interrupted by buses stopping in front of the museums. These issues have been addressed in the new layout through the provision of more pedestrian space, but also through the establishment of the transition zone, in which buses can now stop for passengers to board or alight.
L2: Cromwell Road junction (Before: Cameras C & D—After: Cameras E, F, G & H):
In the original layout, the facilities provided to pedestrians wishing to cross Cromwell Road to continue walking on either the eastern or the western sidewalks of Exhibition Road were two staggered pelican crossings, which required a detour and often long waiting times for a “green man” signal. As a result, the vast majority of the pedestrians used “shortcuts,” bypassing the staggered crossings and jaywalking, thus coming into conflict with right-turning southbound traffic from Exhibition Road in the case of the western crossing, or with left-turning southbound traffic in the case of the eastern crossing. The western crossing has been replaced by a wide straight-across crossing in the new layout, while the eastern one has been retained but redesigned.
L3: Thurloe Street (Before: Camera F—After: Cameras 1 & 2):
Pedestrians using this location in the original layout were faced with two problems: the lack of adequate pedestrian crossing facilities, and the insufficient space for pedestrians on the southern sidewalk of the road. In the new layout, this location has been redesigned as “access-only,” giving more space to pedestrians.
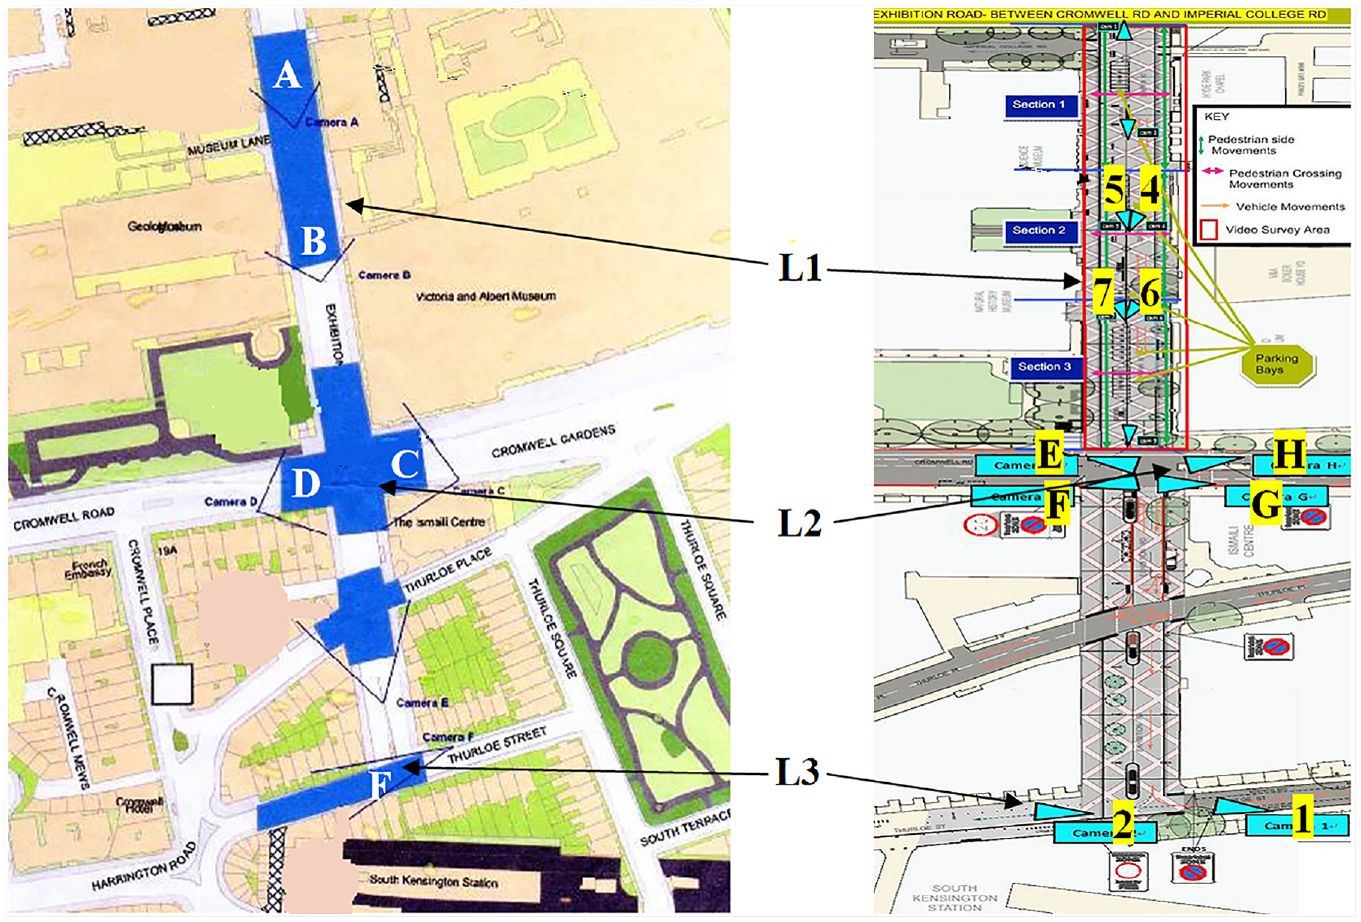
Camera locations at the Exhibition Road site in the (left) before and (right) after monitoring.
Data Processing
The performance of a road facility can be varying at different days and times of the day, depending on the changes in vehicle traffic and pedestrian volumes. For example, a street may perform satisfactorily (LOS D or greater) during low-volume periods, but the quality of service may drop to unsatisfactory levels (LOS E or F) during times of high traffic volumes. Clearly, the latter is a more critical condition, as it is these periods of under-performance that any design aims to address.
In this study, periods of weekday peak vehicle traffic and pedestrian flows are chosen for the analysis, and this results in 3 h of analysis per location for the before and after cases. These are:
08:00–09:00 (morning peak hour, with high vehicle traffic flows);
12:00–13:00 (midday, when many tourists enter and exit the museums); and
17:00–18:00 (evening peak hour, with tourists and workers leaving the area, and locals returning).
For the before case, the analysis concentrates on Thursday, August 27, 2008, while for the after case it focuses on Thursday, October 27, 2011. Therefore, a total of 18 h of video footage are processed by a single observer with respect to quality of service evaluation following the HCM. For each of the locations, VLOS and PLOS levels are calculated for both the before and the aftercase, so each hour of footage is analyzed twice, bringing the total number of analysis hours to 36. As, however, pedestrian flows are lower in the morning peak hour, PLOS is only analyzed for the midday and evening periods. Also, as Thurloe Street (L3) has become an “access-only” street post-redevelopment and no longer accommodates through vehicle traffic, only PLOS is considered at that location and so the relevant footage is only analyzed once. As such, the total number of hours analyzed is 24 (L1 VLOS and PLOS, L2 VLOS and PLOS, L3 PLOS only). The analysis follows the methodology outlined in the next section.
Analysis Methodology
The methodology adopted includes the processes involved in the assessment of the quality of service offered by a street layout with respect to vehicle traffic (VLOS) and pedestrians (PLOS). It is noted that the relevant methods from HCM 2010 ( 10 ) are used, as opposed to HCM 2016 ( 9 ), as large parts of the analysis were carried out before the publication of the latter.
Quality of Service for Vehicle Traffic (VLOS)
Following HCM 2010 ( 10 ), VLOS in the present study is evaluated at the segment and the intersection levels. A segment refers to the combination of a link and one or more of its boundary intersections, and segment-based VLOS is calculated separately for the different directions of traffic. VLOS is evaluated according to the combined performance of the link and of its downstream boundary intersection. As such, based on the availability of the videos from the entire site, one segment is considered, and this is the southbound traffic on the main body of Exhibition Road (L1) leading into the junction with Cromwell Road (L2). In addition, the VLOS evaluation also covers the intersection of Exhibition Road and Cromwell Road itself (L2).
The segment and intersection analyzed are shown in Figure 4, and the process of the determination of the relevant VLOS ratings is outlined in Table 1.
Intersection and Segment VLOS Calculation Process, Adapted from HCM 2010 ( 10 )
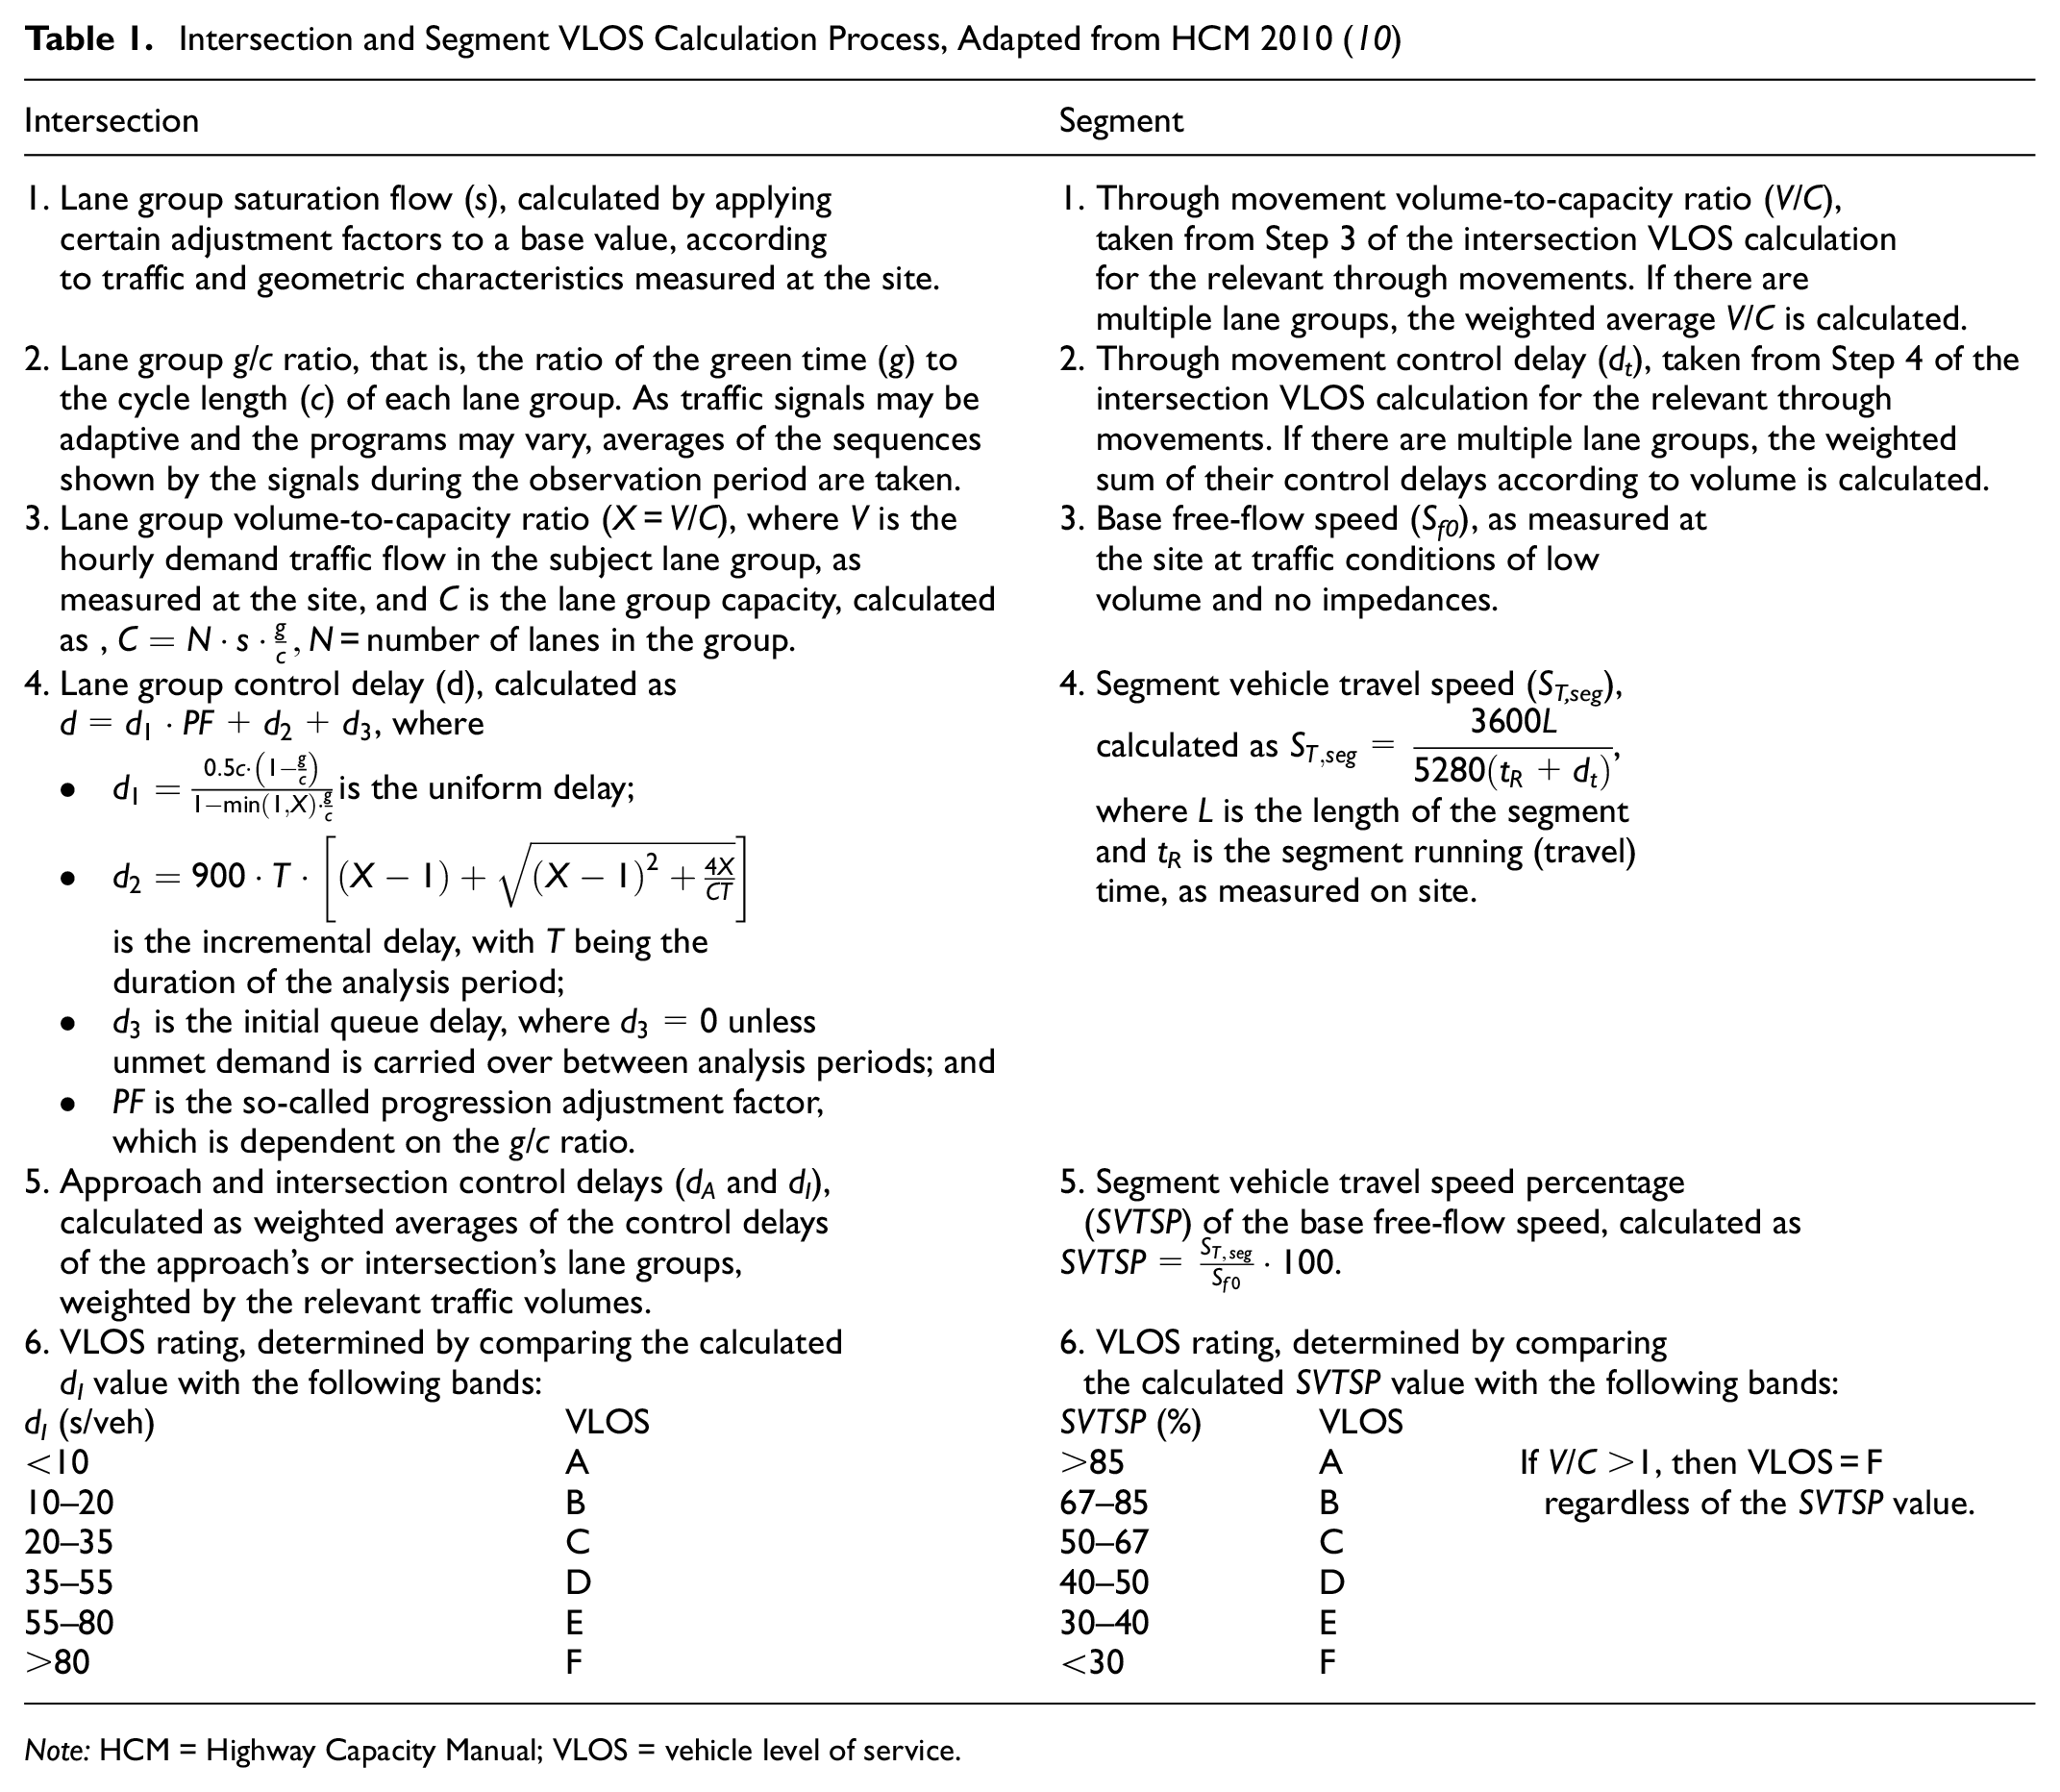
Note: HCM = Highway Capacity Manual; VLOS = vehicle level of service.
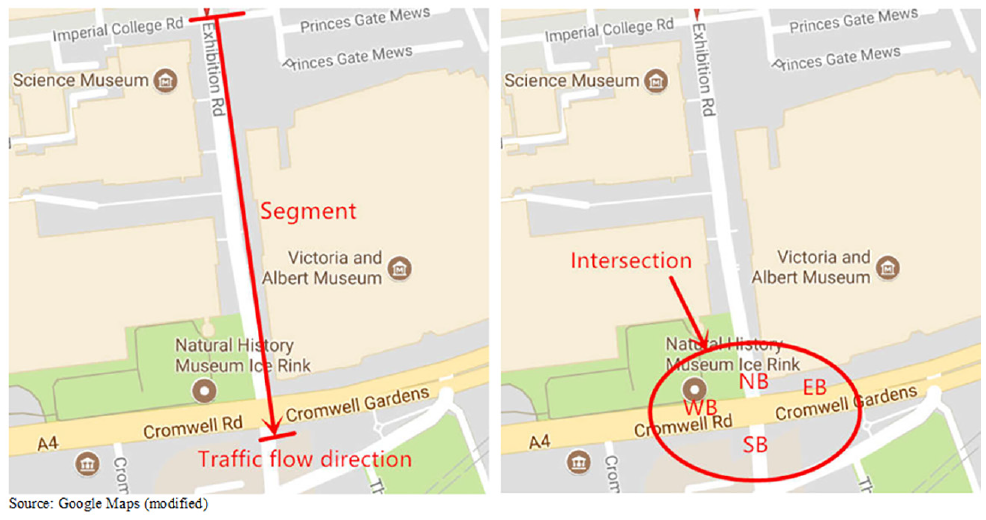
(Left) The segment and (right) intersection considered in the VLOS evaluation of Exhibition Road.
Starting from the intersection, this is signal controlled, and according to HCM 2010, the VLOS rating is determined according to the control delay. This is calculated as the average of the average delay per vehicle in each of the lane groups in all of the intersection’s approaches, weighted by the relevant traffic volumes. The resulting value is then compared with the control delay threshold bands provided in HCM 2010 to assign a VLOS rating. Lane groups are, therefore, the basic unit of analysis of the intersection VLOS evaluation. In the before case, there are nine lane groups, of which three are exclusive through traffic (one two-lane and two single-lane), five are shared through traffic and left turn, and one is exclusive right turn (all single-lane). In the after case, and following several turn bans and other traffic management changes (see Figure 2c), there are only four lane groups, three of which are exclusive through traffic (two two-lane and one single-lane) and one is shared through traffic and left turn (single-lane). It should be noted that all turning movements are operated in a “permitted” mode, which means that the turning vehicles must yield to any semi-compatible/conflicting traffic and pedestrian streams.
For the segment VLOS evaluation, two decision variables come into play: the volume-to-capacity ratio and the segment vehicle travel speed percentage. The former is calculated as part of the VLOS evaluation of the downstream boundary intersection and reflects the ability of the segment to serve the traffic using it: if the ratio is larger than 1 (i.e., if demand exceeds capacity), then a VLOS rating of F applies by default. The latter variable, on the other hand, expresses the travel speed of vehicles on the segment, as measured on site, expressed as a percentage of the free-flow speed. It is estimated on the basis of the observed travel time and of the relevant control delay obtained from the downstream intersection VLOS calculation, and the resulting value is then compared with the respective threshold bands provided to assign a VLOS rating.
Quality of Service for Pedestrians (PLOS)
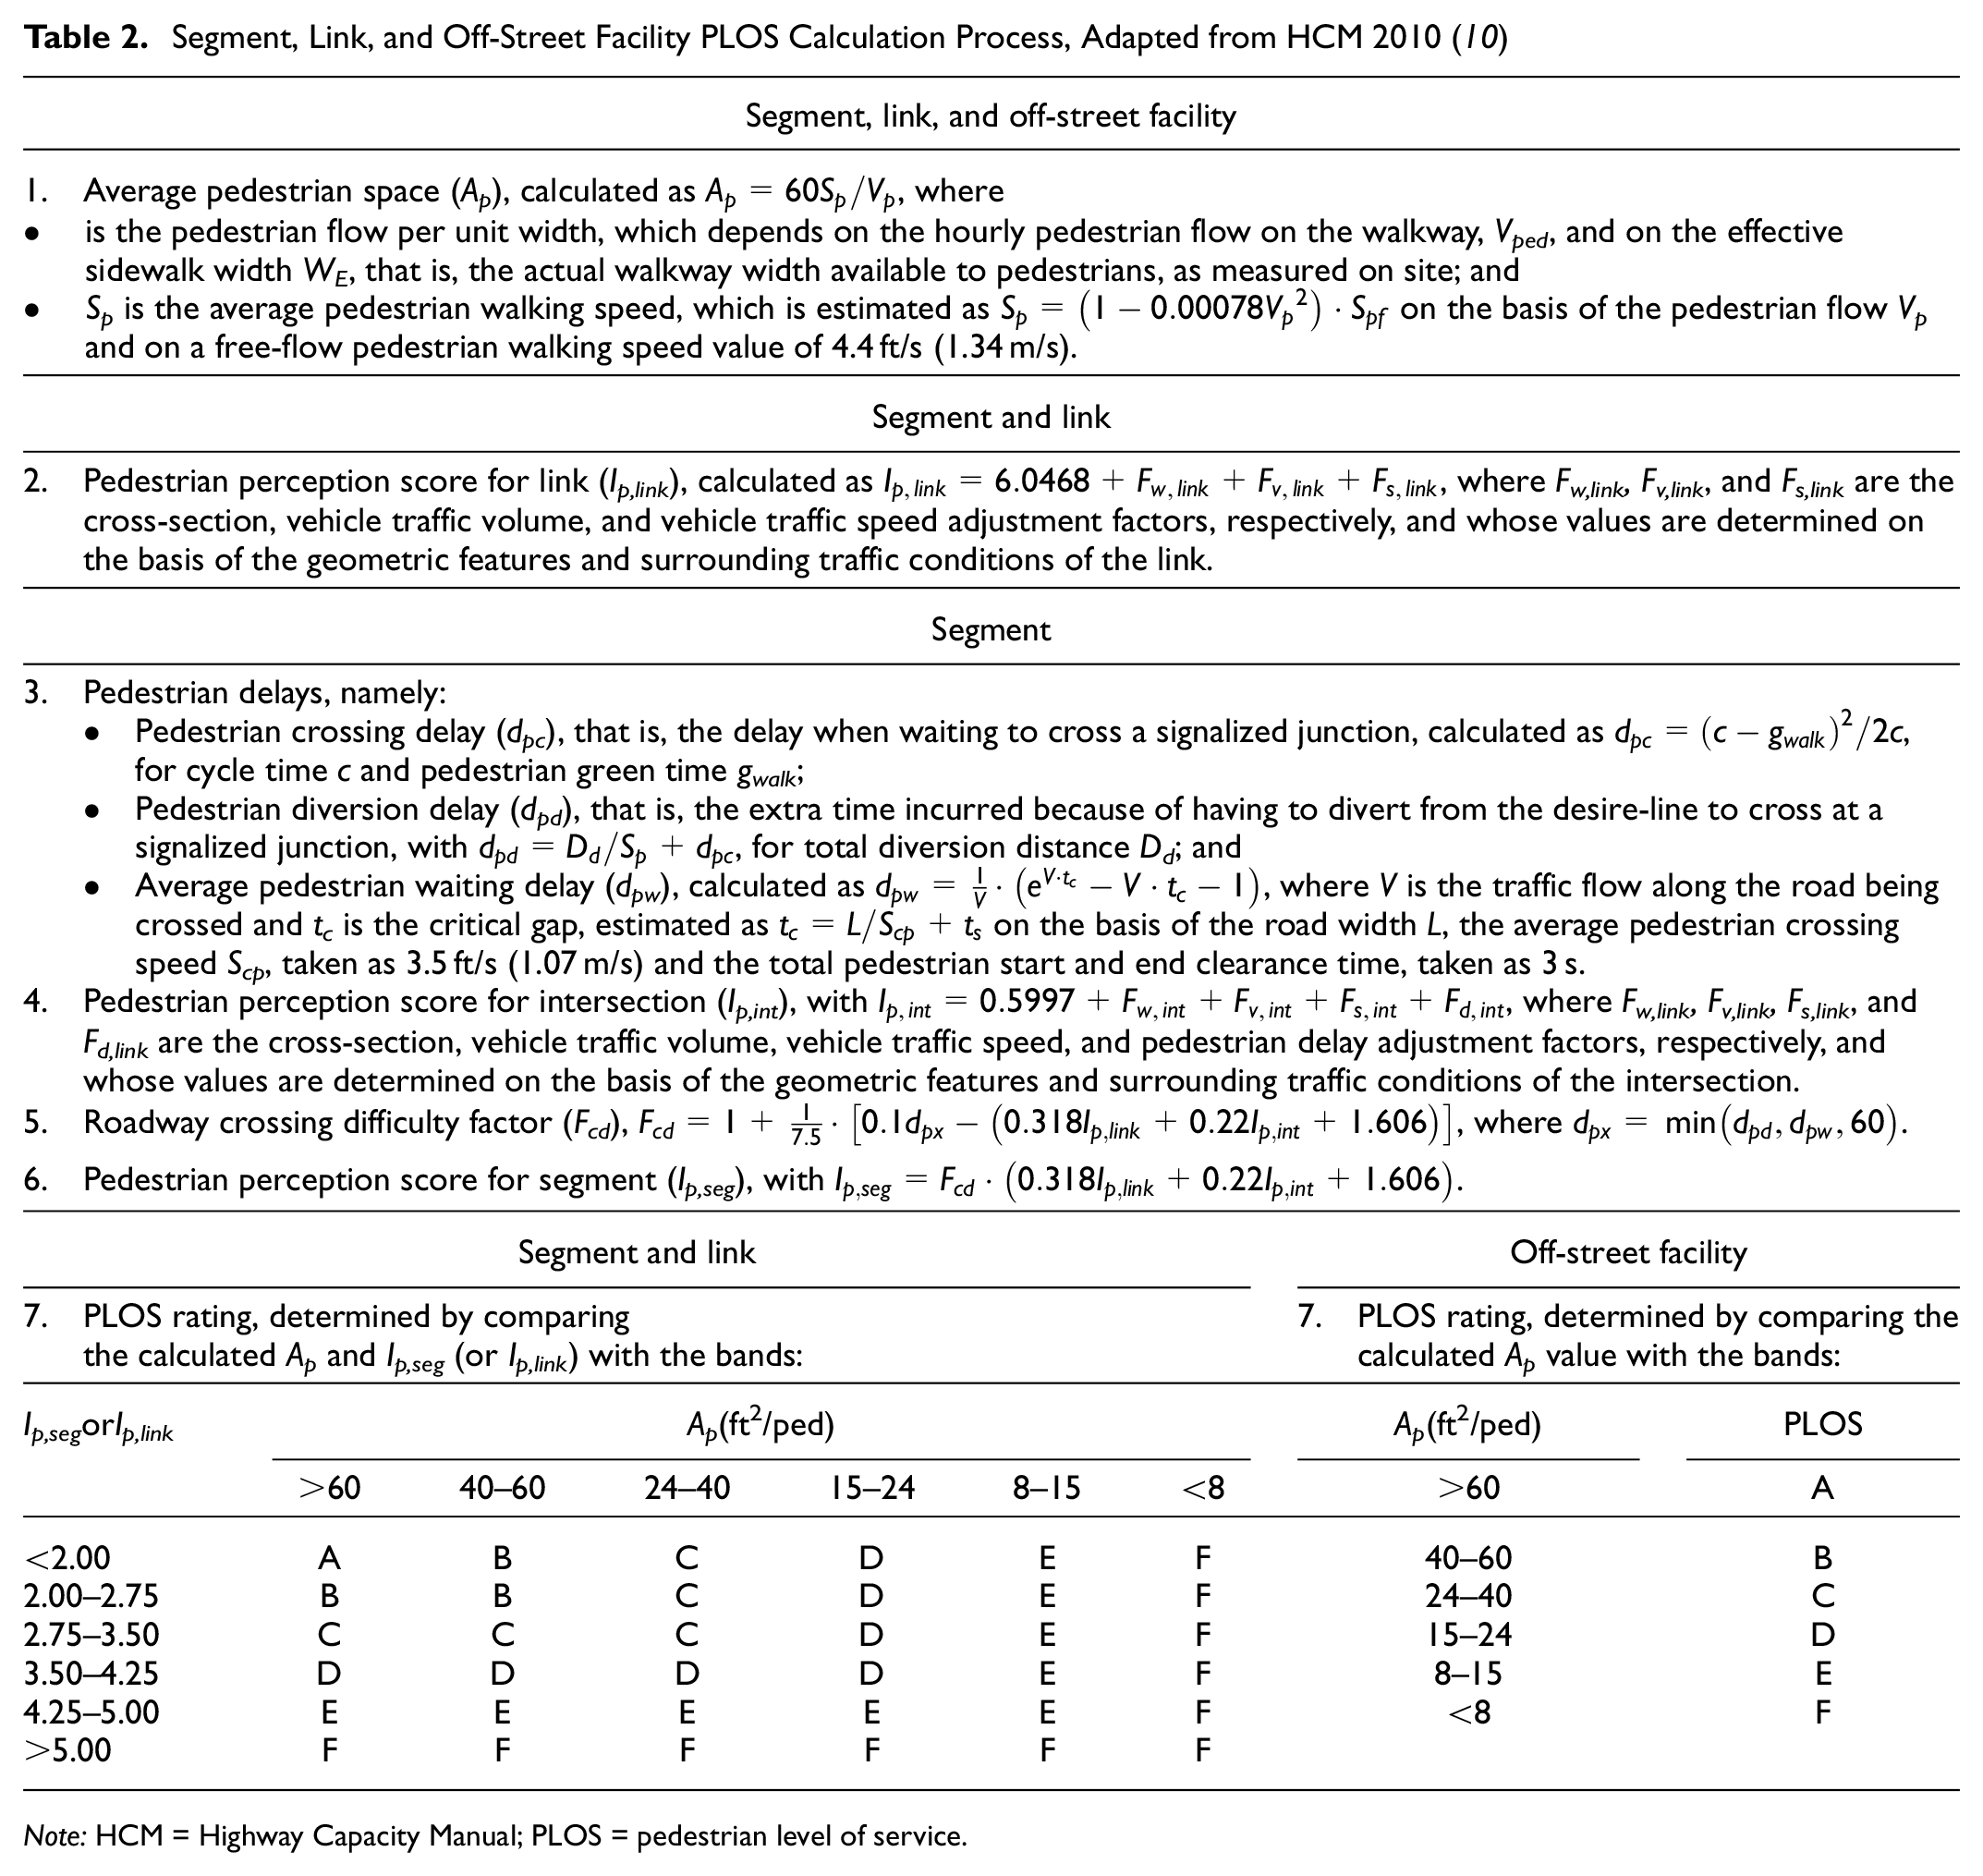
The PLOS evaluation in the present study concentrates on four walkways around the Exhibition Road site, and specifically both sidewalks of the main body of Exhibition Road (L1), including the crossings to Cromwell Road (L2), and both sidewalks of Thurloe Street (L3). The Exhibition Road sidewalks are assessed at the segment level, where each segment consists of a link and a crossing, while the two Thurloe Street sidewalks are evaluated at the link level for the before case. In the after case, as Thurloe Street has been re-developed to an access-only street, it is assessed as an off-street facility. The PLOS rating determination process is outlined in Table 2, and the walkways analyzed are shown in Figure 5.
Segment, Link, and Off-Street Facility PLOS Calculation Process, Adapted from HCM 2010 ( 10 )
Note: HCM = Highway Capacity Manual; PLOS = pedestrian level of service.
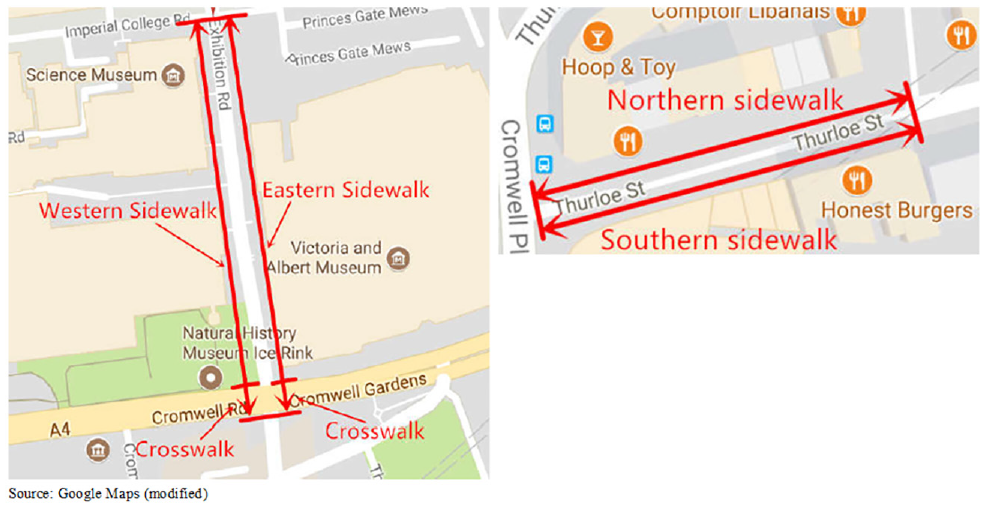
The segments considered in the PLOS evaluation of Exhibition Road.
According to HCM 2010, the PLOS rating on a segment is determined on the basis of two decision variables: the average pedestrian space and the pedestrian perception score. With respect to the former, this reflects the average amount of road space, as measured on site, that is available per pedestrian in relation to their ability to continue to walk along their desired path without altering their pace or course. As concerns the latter, this is an aggregate measure combining many different factors reflecting the pedestrian’s perception of the walking experience. It is estimated on the basis of the geometric characteristics, the various delays experienced by pedestrians and the difficulty of crossing the roadway. The resulting values are then compared with the average pedestrian space and perception score threshold bands provided in HCM 2010 to assign a PLOS rating.
When it comes to the evaluation of off-street pedestrian facilities, and given the absence of interaction with vehicle traffic, PLOS is determined based on the average pedestrian space measure only.
Results
The video data collected are processed and analyzed using the method described in Section 4, and the results are presented in this section.
VLOS Assessment
The results of the VLOS evaluation in the Exhibition Road site before and after redevelopment to a design with elements of shared space are shown in Table 3, in which part (a) reports the evaluation of the intersection and part (b) that of the segment.
VLOS Evaluation Results in the Exhibition Road Site before and after Redevelopment
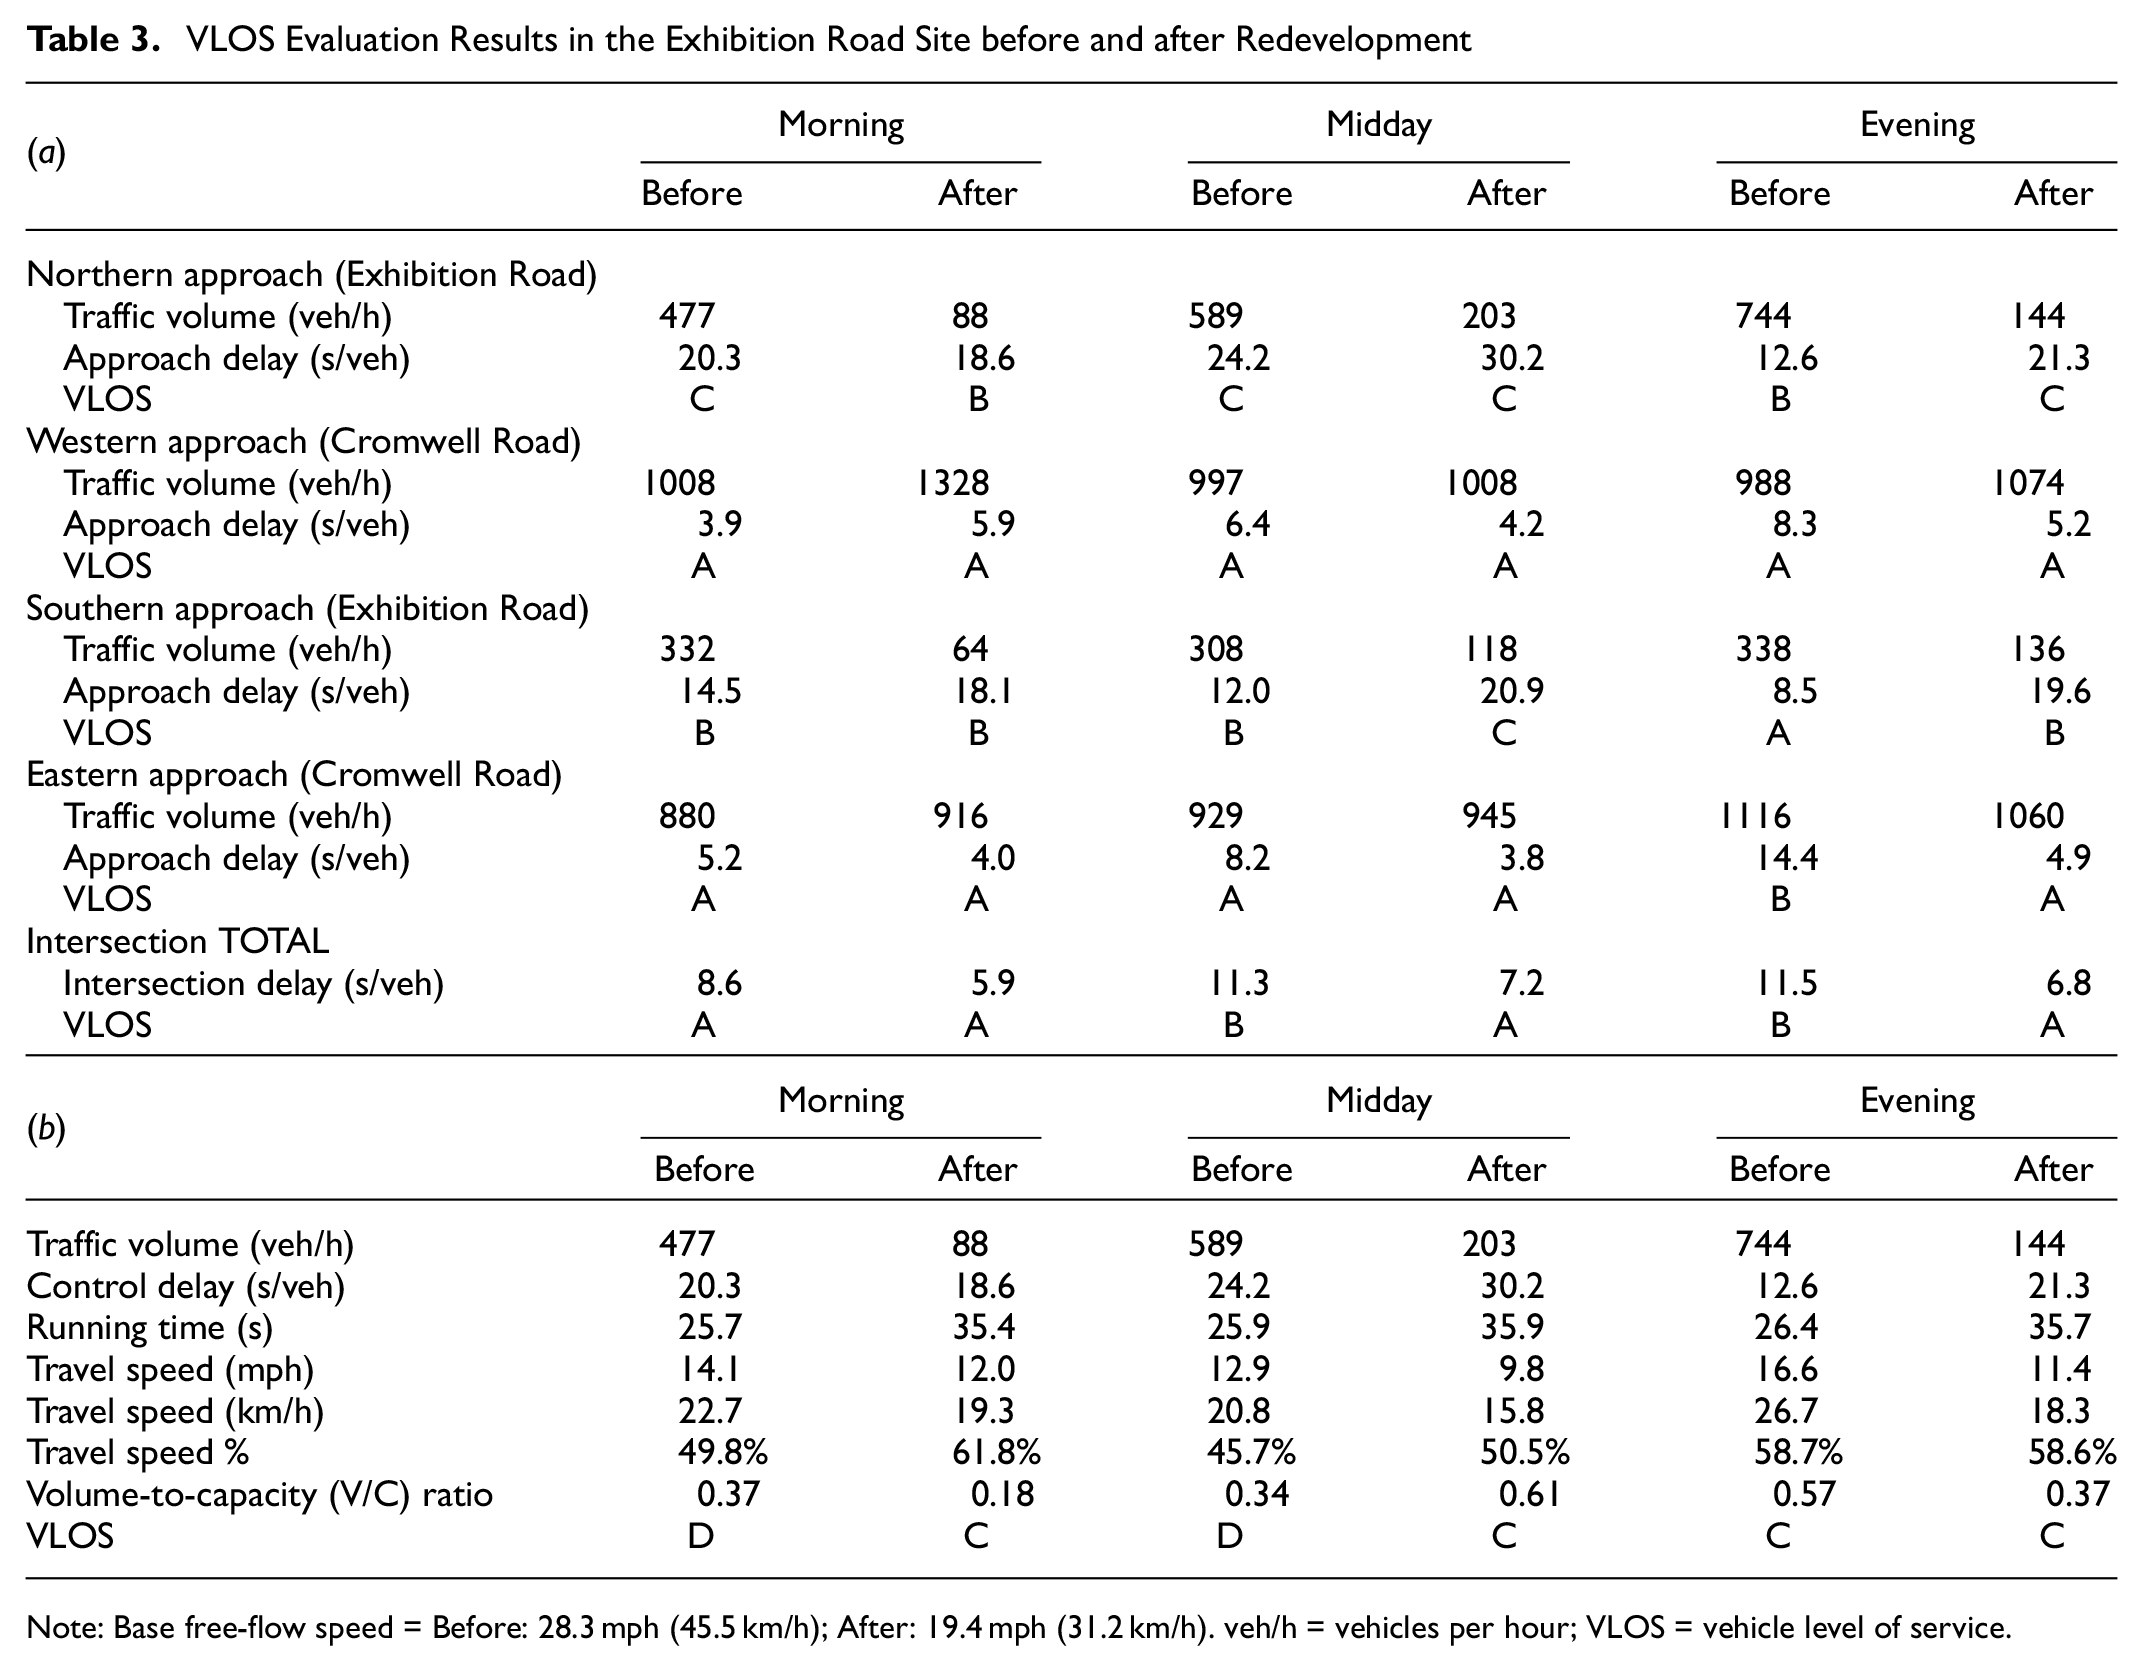
Note: Base free-flow speed = Before: 28.3 mph (45.5 km/h); After: 19.4 mph (31.2 km/h). veh/h = vehicles per hour; VLOS = vehicle level of service.
Looking at part (a) of Table 3, it can be observed that the quality of service for vehicle traffic at the junction of Exhibition Road with Cromwell Road pre-redevelopment for each of the morning, midday, and evening observation periods had VLOS ratings of A, B, and B, respectively, and that post-redevelopment this has improved to A in all three periods, with intersection control delays dropping to well below 10 s. With respect to the individual junction arms, VLOS on the two Cromwell Road approaches appears to be largely unaffected by the junction re-design (and in the case of the eastern approach during the evening peak, even slightly improved), with the measured control delays remaining at the same low values as before the redevelopment and affecting traffic flows of similar or slightly higher levels. At the same time, vehicle traffic on the Exhibition Road approaches appears to experience slightly longer control delays overall, but these affect significantly lower traffic flows.
Elaborating on the reasons behind these effects, a key determining factor of the quality of service of the junction is the traffic signal program. Being adaptive, it has responded to the changes in traffic volumes post-redevelopment through longer cycle times and green time allocations to the Cromwell Road approaches than the Exhibition Road ones, and this results in overall longer waiting times for drivers on the latter. However, the ban of all right and most left “permitted” turns at the junction (with relevant flows having been re-routed elsewhere) appears to compensate for these effects and ensure that individual cycle failures (which occurred occasionally for the southbound right-turning traffic before the redevelopment) no longer occur, despite the more pedestrian-oriented, and therefore more constrained, road layout (fewer lanes, narrower roadway, etc.). This results in slightly inferior, but still satisfactory (B or C), VLOS scores post-redevelopment for the Exhibition Road approaches.
Considering the VLOS segment evaluation results in part (b) of Table 3, it can be observed that the quality of service of vehicle traffic pre-redevelopment had a rating of D in the morning and midday periods, and that post-redevelopment this has improved to C; in the evening period, the VLOS rating was C before, and has remained the same after. This is despite the increases in both control delay (resulting from the junction changes) and segment running time (as a result of the more pedestrian-friendly layout), which have resulted in lower calculated average travel speeds, as these have been accompanied with a reduction in the estimated base free-flow speed. As such, the travel speed percentages have remained the same, or have even increased post-redevelopment. This finding confirms the hypothesis that shared space may bring about traffic efficiency benefits, as even though the new layout may act as a deterrent to vehicle traffic and may result in lower volumes and speeds, the drivers that do use the segment benefit from less congestion and therefore improved conditions.
PLOS Assessment
The results of the PLOS evaluation in the Exhibition Road site pre- and post-redevelopment are shown in Table 4.
PLOS Evaluation Results in the Exhibition Road Site before and after Redevelopment
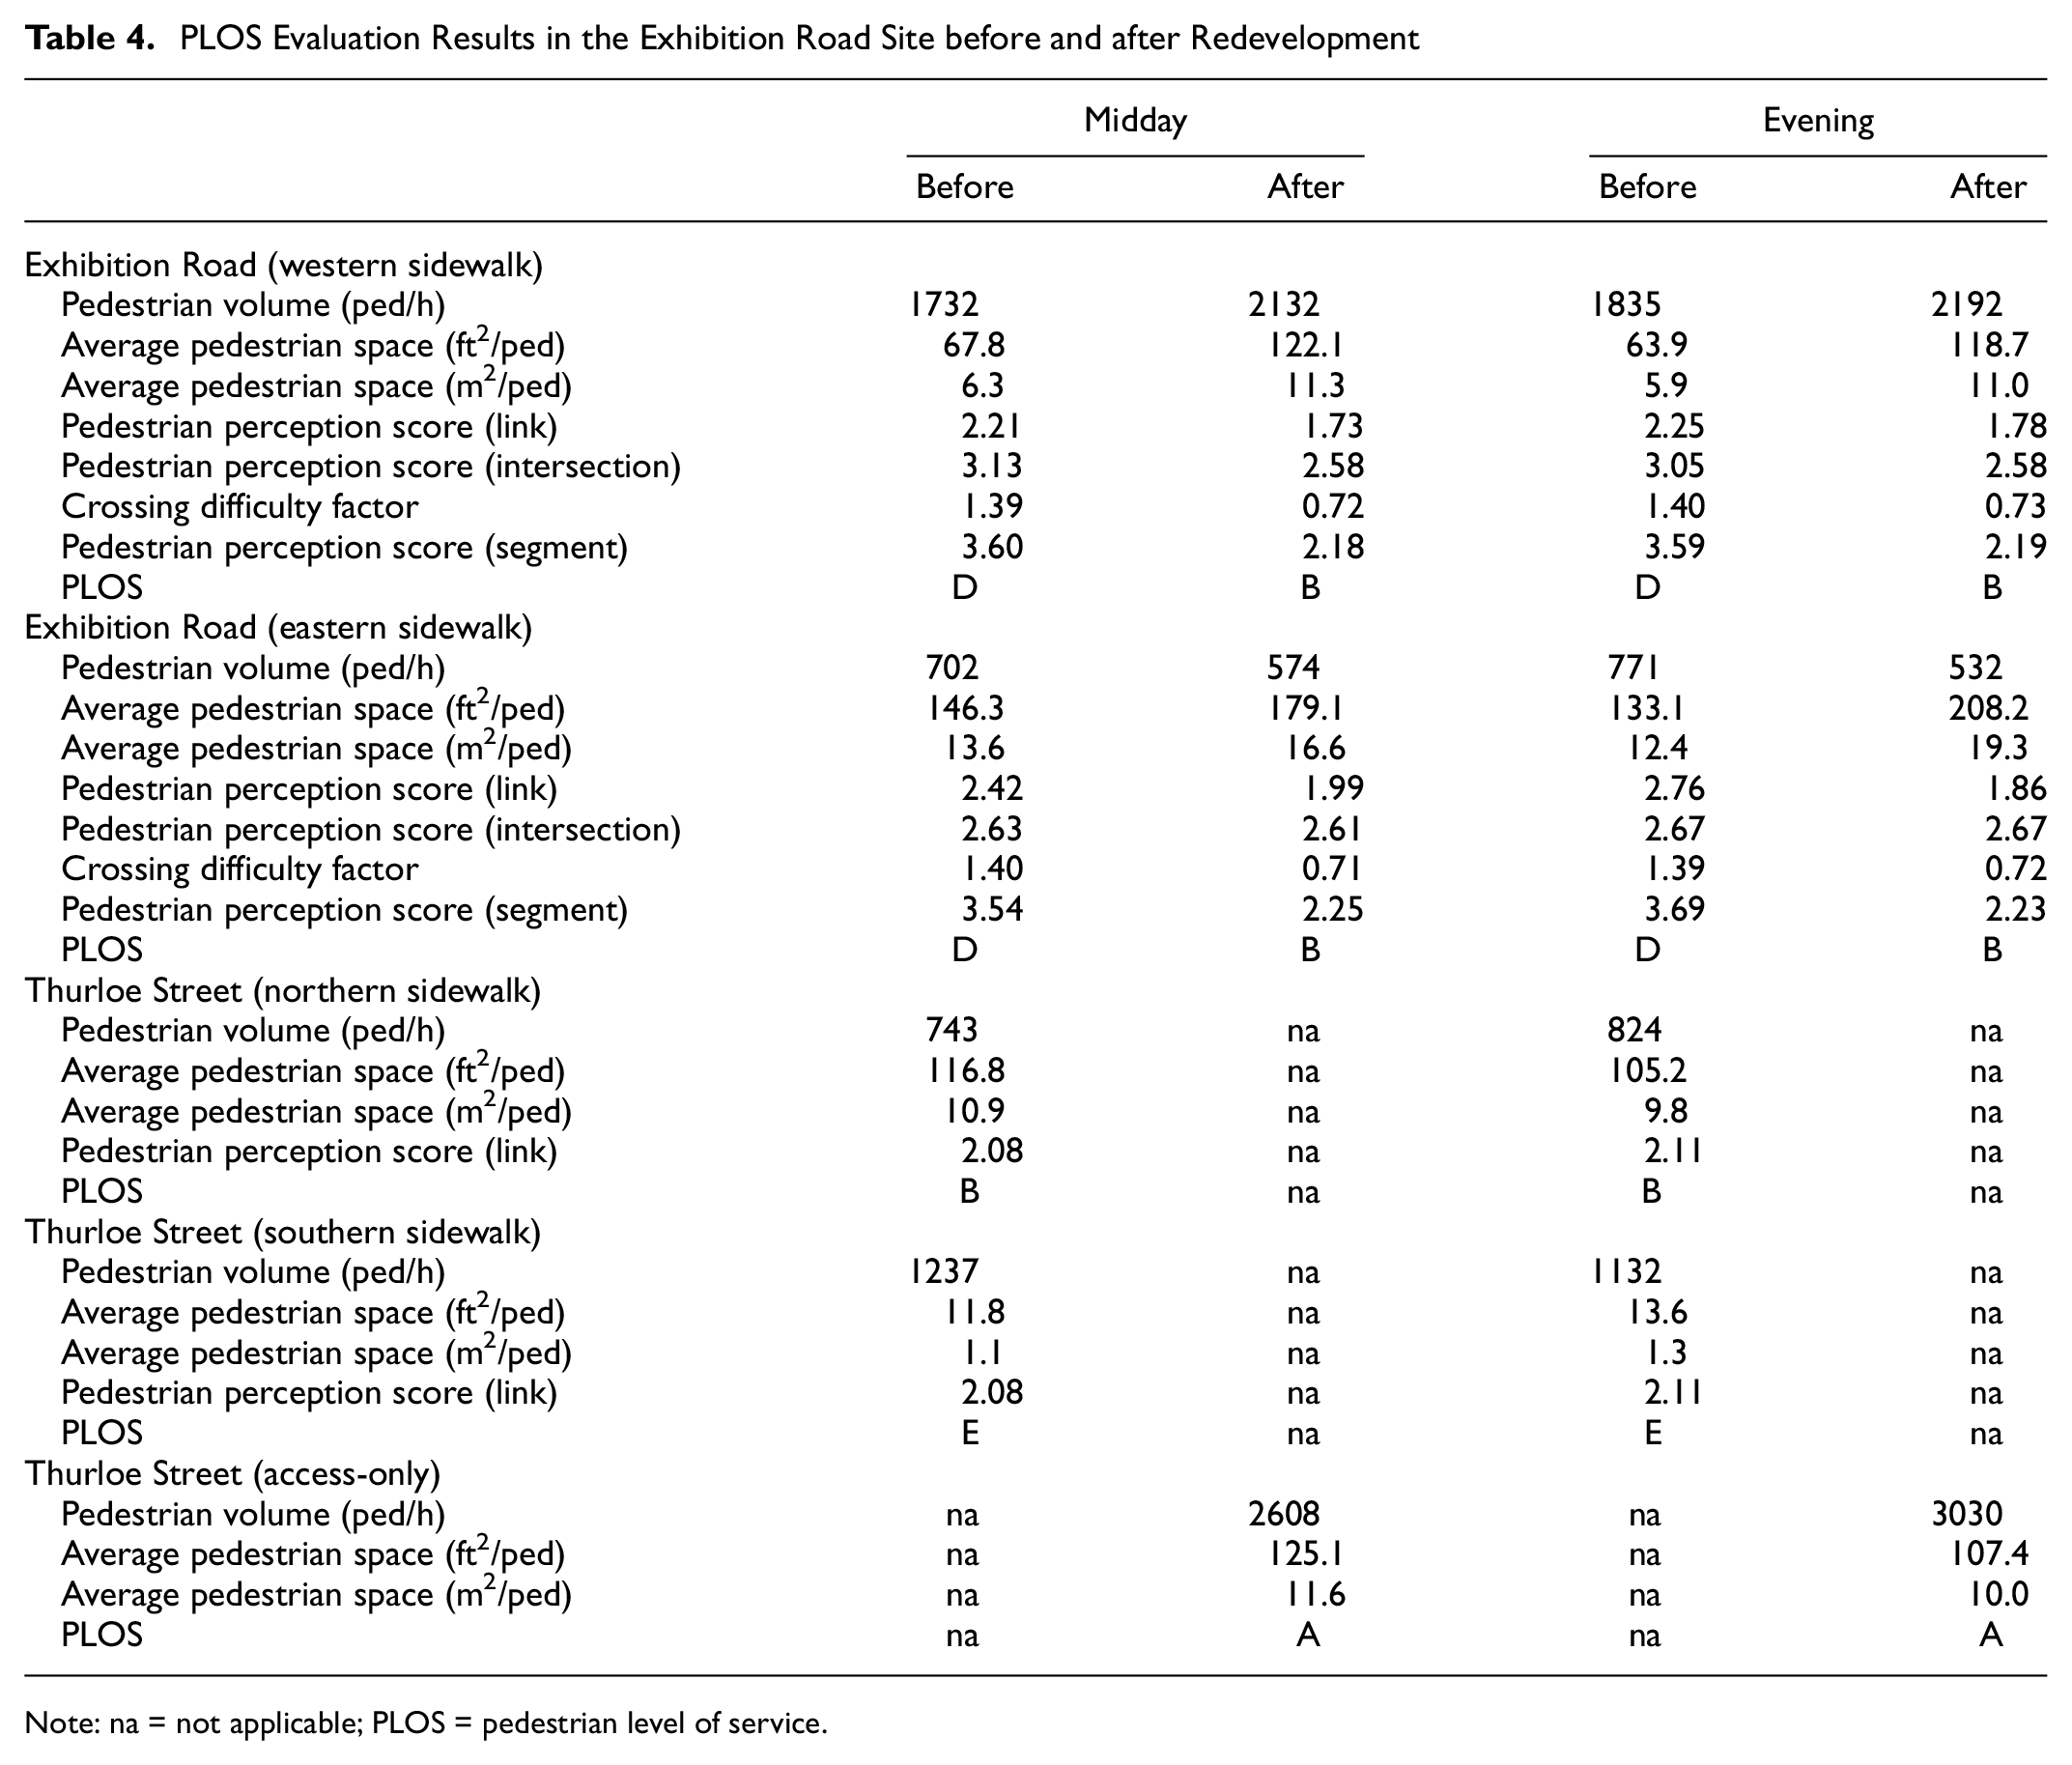
Note: na = not applicable; PLOS = pedestrian level of service.
Looking at the western and eastern sidewalks of the Exhibition Road main body, it can be observed that in both walkways and for the two observation periods analyzed the quality of service is rated as D pre-redevelopment. This may indicate that pedestrians receive a borderline satisfactory quality of service and are likely to have negative experiences about some elements when walking along the segment, such as long delays at the intersection and lack of adequately long gaps for crossing at mid-segment locations. This is reflected in the negative (high) pedestrian perception scores for the intersection, especially in the western sidewalk, as well as in the high values of the crossing difficulty factor.
Following the redevelopment, however, it can be seen that the quality of service has improved significantly, with the relevant PLOS rating rising to level B in both walkways. In the western sidewalk this can be attributed to the reduction in vehicle traffic volume and speed, to the re-design of the relevant Cromwell Road crossing from staggered to straight-across (resulting in improved link and intersection perception scores), but also to the greater ease in crossing provided by the new layout, as expressed by the reduction of the crossing difficulty factor. A similar trend is observed in the eastern sidewalk, even though the eastern Cromwell Road staggered crossing has been retained, resulting in roughly unchanged intersection perception scores. It should additionally be noted that both walkways have also seen a significant increase in average pedestrian space, which, being above the threshold of 60 ft2 (5.6 m2) per pedestrian may not directly affect the PLOS ratings, but may still have an indirect influence through the perception scores.
Considering the evaluation results of Thurloe Street, whose two sidewalks are assessed at the link level in the before case, it can be observed that the adequate pedestrian space, together with a good link perception score, result in a PLOS rating of B for the northern sidewalk. For the southern sidewalk, however, despite the link perception score (which depends on geometry and vehicle traffic characteristics) being the same, the average pedestrian space is considerably smaller (as low as 11.8 ft2 or 1.1 m2 per pedestrian) because of the relatively narrow footpath, combined with the presence of bus shelters, rubbish bins, and other obstructions, as well as of high pedestrian volumes entering and exiting the adjacent South Kensington Underground station. Consequently, a PLOS rating of E is assigned to the southern sidewalk, which means that the quality of service is unsatisfactory.
Post-redevelopment, on the other hand, Thurloe Street has become an access-only street with much of the vehicle traffic and most of the previously cluttering street furniture and other objects having been removed. This has considerably increased the average pedestrian space, and given that this is the only criterion in the evaluation of off-street pedestrian facilities, PLOS has improved to the maximum rating of A, which means that pedestrians are able to move in their desired path without needing to alter their pace or course to avoid conflicts with other road users.
All in all, the results of the PLOS evaluation of the Exhibition Road site pre- and post-redevelopment appear to support the logical hypothesis that the implementation of such features improves the quality of service provided to pedestrians.
Conclusion
In light of the shift in focus in urban street design, this paper has examined the under-explored topic of how the quality of service changes as a result of the implementation of street layouts with elements of shared space. Using video data from the Exhibition Road site in London during periods before and after its conversion from a conventional divided roadway to a single surface, featuring several elements of shared space, changes in relation to LOS for both vehicle traffic and pedestrians have been investigated.
The results suggest that the redevelopment has considerably improved the quality of service offered to pedestrians, with relevant PLOS ratings having increased from D to B and from E to A respectively at the two locations evaluated. This is an expected finding, given that shared space features are intended to improve the pedestrian environment. What is also interesting, however, is that vehicle traffic quality of service appears not to have been compromised and has, in several locations, even improved. In fact, VLOS ratings have overall increased from B to A and from D to C at the intersection and segment examined, respectively.
Naturally, these results cannot be treated in isolation from other related impacts of shared space design, and in particular safety-related ones. For instance, previous research on the Exhibition Road site found that there has been a change in vehicle–pedestrian traffic conflict patterns, with more slight and fewer severe occurrences post-redevelopment (11, 12). This suggests potentially safer conduct of vehicle drivers and pedestrians, but also implies fewer obstructions to the movement of vehicles and pedestrians, which would explain the quality of service improvements found by the present study. This is an encouraging finding from the point of view of shared space design.
While this study has thrown some light on the topic of quality of service in street layouts with elements of shared space, there are several future research directions that remain to be explored next. For instance, a limitation of the present study is that a decisive contributing factor of the estimated VLOS and PLOS improvements has been the reduction in traffic flows at the case study site. Given that these flows have been diverted elsewhere, it would be important also to investigate potential VLOS and PLOS impacts at the network level, in addition to the site-level analysis carried out. This could be complemented by corresponding safety analyses to explore potential safety impacts of the introduction of streetscape schemes with elements of shared space, not just at the site itself, but also in different (and perhaps not so obvious) network areas.
Furthermore, a limitation of the present study has been that, because of the timing of the analysis, the HCM version before the latest one was used, that is, the 5th edition (HCM 2010) ( 10 ). This means that the analysis could not be conducted using the improved LOS evaluation methodologies included in the latest HCM 6th edition (HCM 2016) ( 9 ). It would be useful in future research to perform an analysis using HCM 2016 instead and to compare the results with the findings of this study. Some discrepancy could be expected, in particular with respect to the VLOS results, as the VLOS evaluation methodology for urban streets has changed from the previous version.
Moreover, the research has been constrained to the case study in question, and the findings may therefore be biased by its specific characteristics. The further evaluation of other street sites with varying levels of implementation of elements of shared space and in different cities and countries would be a very useful next step toward obtaining more generic conclusions. Also, a further limitation of the present study has been that the video data were analyzed manually and by a single observer. It would be of value to perform some additional analysis using multiple observers and technological tools (e.g., detectors and imaging software), complemented by relevant on-site observations, to further assert the validity of the results and to improve on their accuracy.
In addition, future work could concentrate on evaluating the quality of service experienced by other road users in shared space environments, such as bicyclists (e.g., using the corresponding LOS method in HCM), which could deliver much different conclusions. Finally, the results obtained could be complemented by road user surveys, from which it will be possible to investigate more systematically the views and perceptions of pedestrians and drivers with respect to the quality of service of streets with elements of shared space.
Footnotes
Acknowledgements
The authors would like to thank the Royal Borough of Kensington and Chelsea for supporting this work by providing data and guidance.
Author Contributions
The authors confirm contribution to the paper as follows: study conception and design: I. Kaparias, R. Wang; data collection: R. Wang; analysis and interpretation of results: I. Kaparias, R. Wang; manuscript preparation: I. Kaparias. All authors reviewed the results and approved the final version of the manuscript.
Declaration of Conflicting Interests
The author(s) declared no potential conflicts of interest with respect to the research, authorship, and/or publication of this article.
Funding
The author(s) received no financial support for the research, authorship, and/or publication of this article.