
Abstract
Lane-changing models are essential components for microscopic simulation. Although the literature recognizes that different classes of vehicles have different ways of performing lane-change maneuvers, lane change behavior of truck drivers is an overlooked research area. We propose that truck drivers are heterogeneous in their lane change behavior too and that inter-driver differences within truck drivers exist. We explore lane changing behavior of truck drivers using a trajectory data set collected around motorway bottlenecks in the Netherlands which include on-ramp, off-ramp, and weaving sections. Finite mixture models are used to categorize truck drivers with respect to their merging and diverging maneuvers. Indicator variables include spatial, temporal, kinematic, and gap acceptance characteristics of lane-changing maneuvers. The results suggest that truck drivers can be categorized into two and three categories with respect to their merging and diverging behaviors, respectively. The majority of truck drivers show a tendency to merge or diverge at the earliest possible opportunity; this type of behavior leads to most of the lane change activity at the beginning of motorway bottlenecks, thus contributing to the raised level of turbulence. By incorporating heterogeneity within the lane-changing component, the accuracy and realism of existing microscopic simulation packages can be improved for traffic and safety-related assessments.
Driving behavior is generally captured using a combination of longitudinal and lateral behavior models. Whereas the longitudinal model is used to capture inter-vehicle interactions such as car-following at a lane level, the lateral model governs switching between lanes and all the tasks associated with it (e.g., assessing gaps, deciding for or against one and executing this decision). Previous research has shown that significant differences exist between the lane-changing characteristics of different classes of vehicles such as passenger cars and trucks (1, 2). However, driver behavior, especially for lane changing, for trucks is an overlooked research area compared to passenger cars (2, 3). Even within a single class of vehicles, Ossen et al. reported that inter-driver differences exist that can not be captured alone by adjusting driver behavior parameters in existing models ( 4 ). The heterogeneity these authors found in car following encompasses the differences in driving styles that can best be described by a (dynamic) distribution of car-following models with a distribution of parameters. Clearly, with such heterogeneity in the car-following behavior, there is also large heterogeneity in the lane-changing behavior. A deeper understanding of this heterogeneity in the lane-changing behavior (of multiple road user-classes) is essential to better capture real-world phenomena.
Motorway bottlenecks such as ramps, weaving sections, or lane drops present significant obstacles to vehicles and are a major source of travel delays ( 5 ). For truck-dominated motorways, the bottlenecks can cause unreliable traffic operations, thus introducing uncertainty in the logistics system. As a result, freight tour planning and terminal operations can also be affected. In the vicinity of these bottlenecks, the lane-changing behavior is shown to affect traffic throughput, safety, and turbulence (6–12). A limited body of research has shown that heterogeneity exists within the merging and diverging behaviors of drivers (13–15). However, they do not take into account the behavior of truck drivers who are a significant part of traffic on truck-dominated motorways.
Consequently, the main objective of this paper is to identify heterogeneity in the merging and diverging behavior of truck drivers. Using recent data collection efforts by van Beinum, we have a detailed trajectory dataset for motorway ramps and weaving sections, located in the Netherlands, which we have used in this paper to explore and cluster heterogeneity in the lane-changing behavior of trucks ( 16 ). The contributions of this paper are two-fold. First, this paper categorizes truck drivers in accordance with their merging and diverging behavior using the trajectory dataset. Second, this paper analyzes and presents the contributions of truck drivers to the turbulence in the vicinity of motorway bottlenecks.
This paper is structured as follows. First, we present a literature review on the heterogeneity of drivers with respect to their lane-changing maneuvers and inefficiencies caused owing to lane-changing phenomena. Next, we describe the trajectory dataset and present descriptive data statistics related to the merging and diverging maneuvers of truck drivers. Afterward, we present finite mixture modeling to categorize the merging and diverging strategies of truck drivers. Lastly, we conclude the paper by discussing the role of truck drivers’ merging and diverging strategies in causing turbulence at motorway bottlenecks.
Literature Review
This section presents a literature review on identifying drivers’ heterogeneity with respect to their lane-changing maneuvers and highlighting the role of lane-changing in causing inefficiencies around motorway bottlenecks.
Drivers’ Heterogeneity with Respect to Their Lane Change Maneuvers
Sun and Elefteriadou conducted a focus group study with 21 participants to identify four types of drivers using clustering for urban streets and developed a utility-based lane change model ( 17 ). Later, Sun and Elefteriadou conducted a test-drive with an instrumented vehicle for 40 participants ( 18 ). Their results show that the drivers’ lane change behavior can be classified into three to four clusters, and the clusters are consistent between drivers’ background-based and driver’s behavior-based analysis. Although the studies focus on an urban setting, the results emphasize drivers’ heterogeneity in their lane-changing decisions.
Keyvan-Ekbatani et al. looked at the lane-change decision process as an integrated task which also involves car-following or longitudinal actions ( 13 ). They conducted both interviews and field tests on 10 participants. They reported that drivers use several strategies for merging and diverging maneuvers. However, the sample was too small to draw any statistical inferences. Li and Sun analyzed 370 merging maneuvers from the NGSIM dataset and reported four categories based on clustering: early merging drivers at high speed, early merging drivers at low speed, late merging drivers at low speed and late merging drivers at high speed ( 14 ). However, they do not consider gap selection in the decision process. Li classified the merging maneuvers of 374 vehicles into two classes based on finite mixtures of logistic regression: risk-rejecting (who try to merge as soon as possible and will accept a larger gap) and risk-taking (who are less sensitive to the gap size and pay more attention to the surrounding traffic conditions to save travel time) drivers ( 15 ).
The aforementioned studies have shown that motivations and reasoning for lane-changing vary between drivers. However, therea gap exists in our understanding of heterogeneity with respect to the lane change phenomena of truck drivers.
Inefficiencies Owing to Lane-Changing
At motorway bottlenecks, local phenomena such as lane changes, speed, and headway variabilities affect traffic throughput and safety (8–12, 19, 20). van Beinum et al. showed that lane change maneuvers in the vicinity of motorway ramps and weaving sections are primary contributors to the turbulence ( 6 ). It has also been suggested that the concentration of lane changes at the beginning of a weaving section decreases the overall capacity of the bottleneck (21, 22). The behavior of trucks might have serious effects on the surrounding traffic owing to their lane change maneuvers, especially under heavy traffic conditions ( 23 ). Although previous studies have identified inefficiencies owing to the lane-change process, these works have not explicitly examined the role of truck drivers’ lane change characteristics in causing turbulence at motorway bottlenecks.
Data and Methods
This section first describes the trajectory dataset. Then, we present a method to identify the lane change maneuvers of truck drivers from this dataset. Our hypothesis is that merging and diverging maneuvers relate to the behavioral characteristics of truck drivers, and these behavioral characteristics can be grouped to capture the underlying heterogeneity among truck drivers. To this, we present a theoretical background of the finite mixture modeling approach to test our hypothesis. Lastly, we present descriptive statistics of the data collected for finite mixture modeling. The relevant MATLAB and R codes used in this paper can be accessed at https://github.com/salilrsharma/truck_trajectory.
Trajectory Dataset
This paper utilizes trajectory dataset from four locations in the Netherlands as shown in Figure 1 ( 16 ).
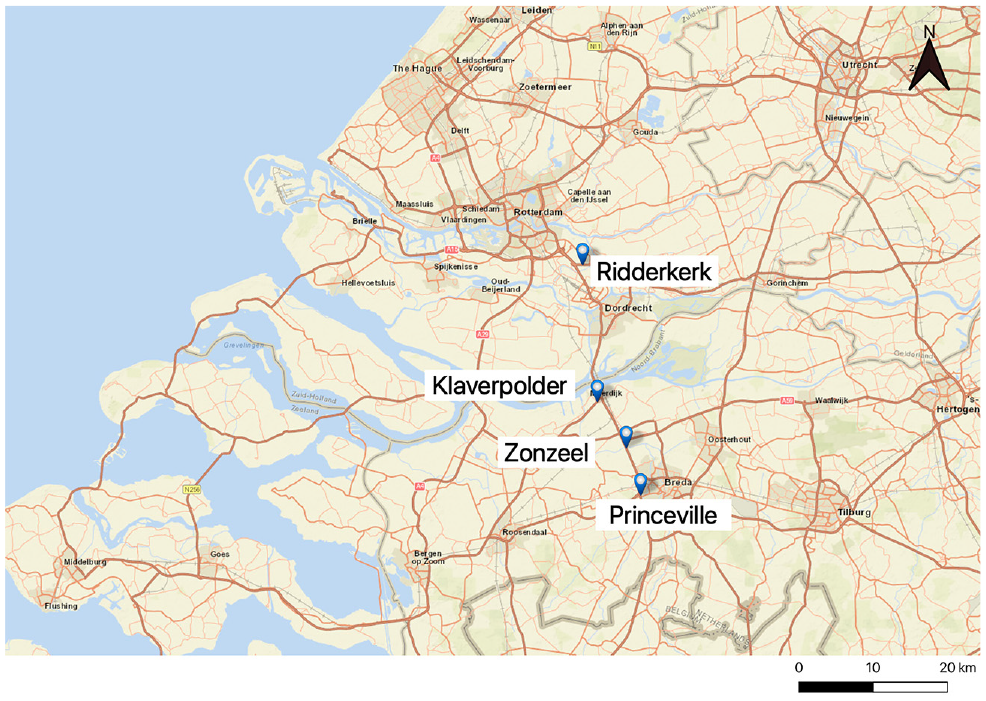
Locations of motorway ramps and weaving sections considered for collecting trajectory data in the Netherlands.
Overall, we consider one on-ramp, one off-ramp, and five weaving sections. Each location comprises two bottleneck sites on each side of a bi-directional motorway. We considered the following bottleneck sites to have a sufficient number of lane changes performed by truck drivers in this paper. In parentheses, we denote the ramp or weaving segment length of each bottleneck site.
Zonzeel-north: On-ramp (340 m)
Zonzeel-south: Off-ramp (230 m)
Klaverpolder-north: Weaving (610 m)
Klaverpolder-south: Weaving (530 m)
Ridderkerk-north: Weaving (740 m)
Princeville-east: Weaving (1000 m)
Princeville-west: Weaving (1130 m)
The above sites have a three-lane mainline carriageway and one auxiliary lane except for the Klaverpolder site which has a two-lane mainline carriageway and one auxiliary lane. This dataset was collected using a high-resolution camera attached to a hovering helicopter. The sites represent isolated discontinuities and their lengths are at most 1100 m meaning that the trajectories can be captured using the helicopter method. For each site, 30 min of the video feed was collected at the onset of evening congestion, that is, between 14:00 and 17:00 h. For further information about the data collection, the reader may refer to van Beinum et al. ( 6 ). The processed empirical trajectory dataset, in the form of MATLAB files and video feed, is available online ( 16 ). This trajectory dataset contains the position of every vehicle at every time step. Every vehicle is tagged along with the length and width of the vehicle. To infer trucks from the empirical trajectory dataset, we used the vehicle length as the primary criterion. Vehicles longer than 12 m in length are labeled as trucks.
Identifying Truck Driver’s Merging and Diverging Maneuvers from Trajectory Data
The lane-changing process for a vehicle begins when it starts to drift laterally and ends when it stabilizes its lateral position after changing to a neighboring lane. The time instances are marked as lane change initiation and lane change completion, respectively. Figure 2 shows an example of a truck driver performing a merging maneuver in which a relative increase in the lateral position of a vehicle with respect to time is marked as the initiation and the time instant after which the lateral position stabilizes as completion. Lane change duration can be defined as the time difference between the lane change completion and lane change initiation process.
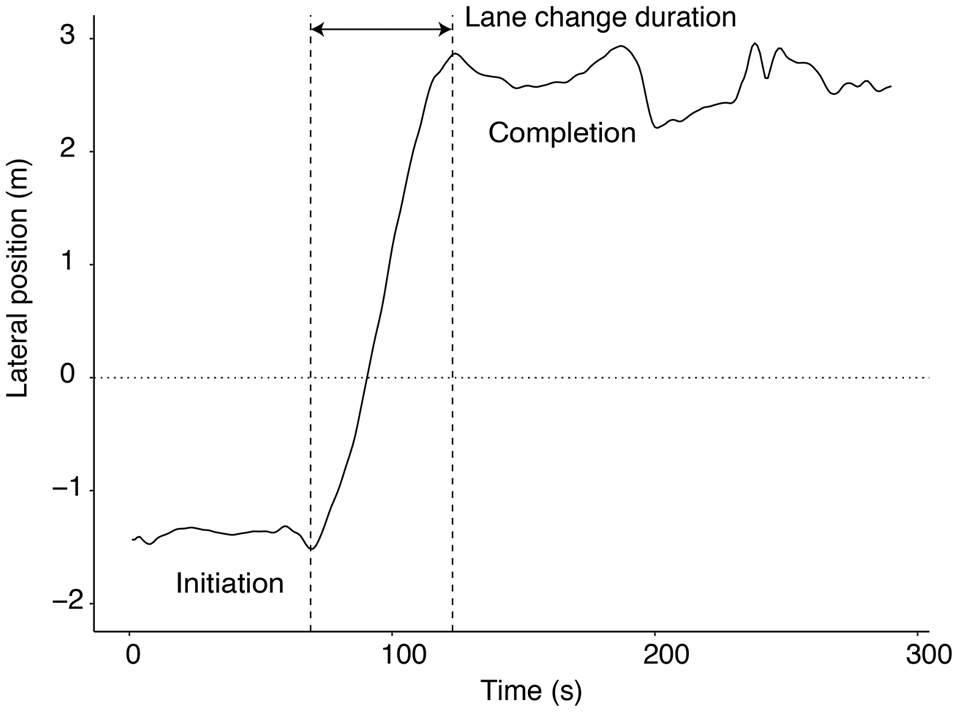
Lateral movement of a truck driver during the merging process.
Finite Mixture Modeling
We assume that the overall population heterogeneity results from the underlying two or more distinct homogeneous subgroups or latent classes of individuals. The components in these models are not directly observed and lie latent for some or all of the individuals in the population. Therefore, the mixture models express the overall population distribution as a finite mixture of some fixed number of components ( 24 ). In these models, there are two main types of variables: latent variables (e.g., a latent class variable which is not directly observed) and manifest or indicator variables (e.g., observable response variables). The observed values of indicator variables refer to imperfect indications of an individual’s true underlying latent class membership. For a finite mixture model, there are two parts: the measurement model and the structural model. The measurement model specifies the relationship between the underlying latent variable and the corresponding manifest or indicator variable. Whereas the structural model specifies the distribution of the latent variable in the population ( 24 ).
For model selection, we used the Bayesian information criterion (BIC). The BIC value has been derived by Schwarz, and mathematically it can be defined in Equation 1 ( 25 ).

In which
Data Preparation for Finite Mixture Modeling
We assumed that the topology or the type of bottleneck affects the mandatory lane-changing maneuvers of truck drivers; therefore, we grouped sites into three categories.
On/off-ramp
Short weaving section
Long weaving section
For weaving sections, 1000–1100 m long sections are classified as long weaving and 500–700 m long sections as short weaving. In one case (short weaving with merging maneuver), we grouped two similar sites so we could increase the data available for modeling. Next, we present indicator variables for categorizing merging and diverging maneuvers.
Indicator Variables
We considered the spatio-temporal and gap-acceptance characteristics of the lane-changing process. Figure 3 illustrates the vehicles involved in the lane-changing process and presents the related indicator variables.
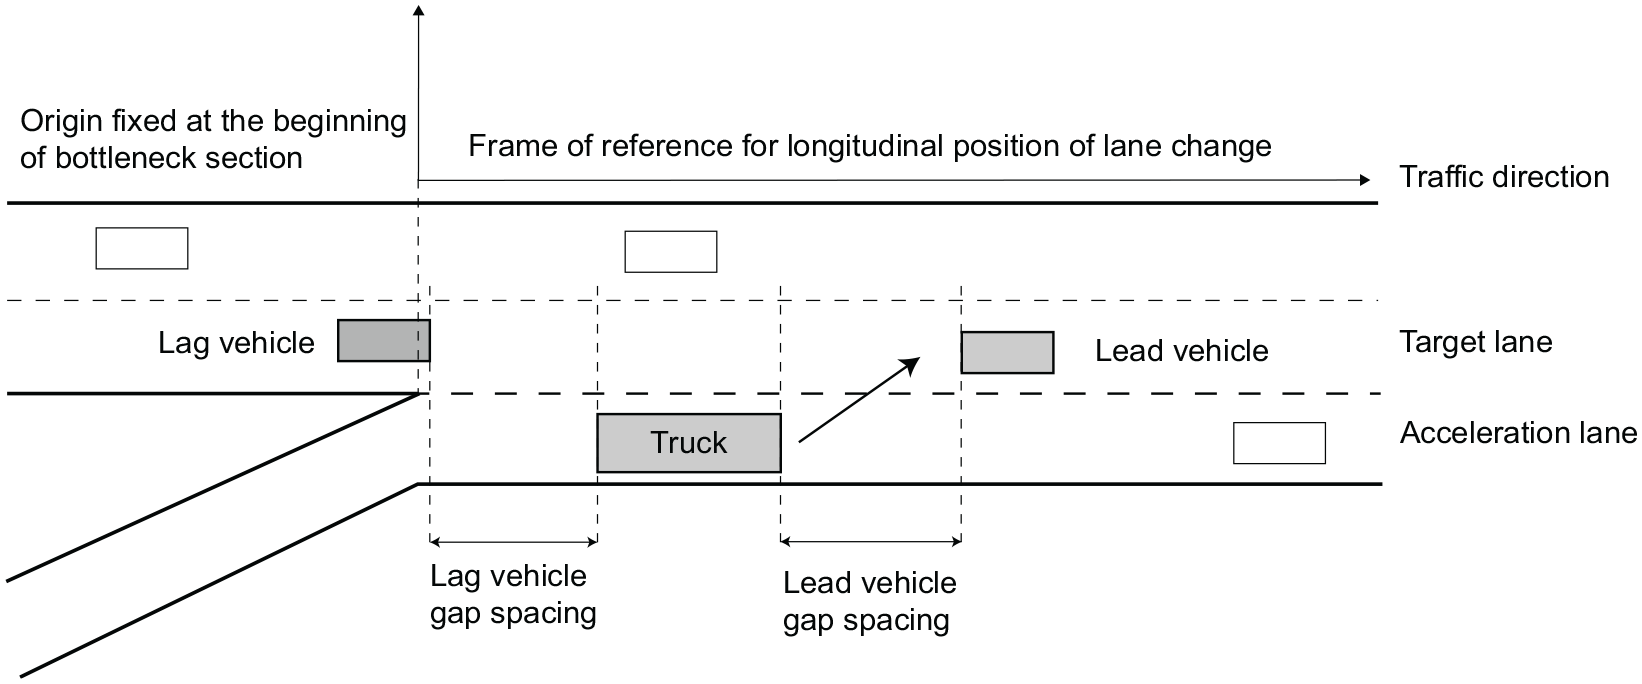
Vehicles involved in a lane change process and related indicator variables.
Spatio-temporal aspects of lane change
We consider location as where a truck driver initiates the lane change maneuver and duration to complete that maneuver. We fixed the origin at the beginning of a bottleneck section and the location variable increases in the driving direction. For merging maneuvers, a relative value is used with respect to the total length of the bottleneck so that we can combine similar sites. Whereas, for a diverging maneuver, an absolute value of longitudinal position is used.
Kinematic behavior during lane change
We consider the instantaneous speed of truck driver as the point he/she initiates the lane change maneuver as a representation of vehicle kinematics.
Gap acceptance behavior
We consider the interactions of a lane-changing vehicle using the lead (predecessor) and lag (follower) vehicles in the target lane. Therefore, we use accepted lead and lag gap spacing as indicators. We use a default value of 250 m for the lag and lead gap spacing in case no vehicle (lag or lead vehicle) is in sight when a truck driver initiates a lane change maneuver. A higher value such as 250 m also suggests that a lane-changing vehicle is not affected by a leader or follower in the target lane. During the data collection, the camera captures more of the area than just the bottleneck section; therefore, 250 m is a justified assumption in this respect.
- We consider categorical variables to indicate whether a truck driver has accepted largest available lead or lag gap spacing. We first store all the available lead/lag gaps for a truck driver in a list until the time of lane change initiation. We compare the chosen lead/lag gap with the maximum available lead/lag gap. For the comparison, we assume that truck drivers are indifferent toward small gains and choose a threshold of 10 m. If the chosen gap and maximum available gap differ more than the threshold, we say that a truck driver has intentionally chosen a smaller gap. We ensure that the categorical variable will take a value of 1 in this case and 0 in all other cases.
Next, we present descriptive statistics of data collected for merging and diverging maneuvers.
Descriptive Statistics of Merging Maneuvers
In Table 1, we present descriptive statistics of the merging maneuvers of truck drivers. Aside from the categorical gap acceptance indicator, all other indicators are assumed to be a mixture of Gaussian distribution. Relative location of lane change initiation can be converted to a censored Gaussian distribution as lane changes will only initiate from the beginning of the bottleneck section.
Descriptive Statistics of Data Collected for Merging Maneuvers
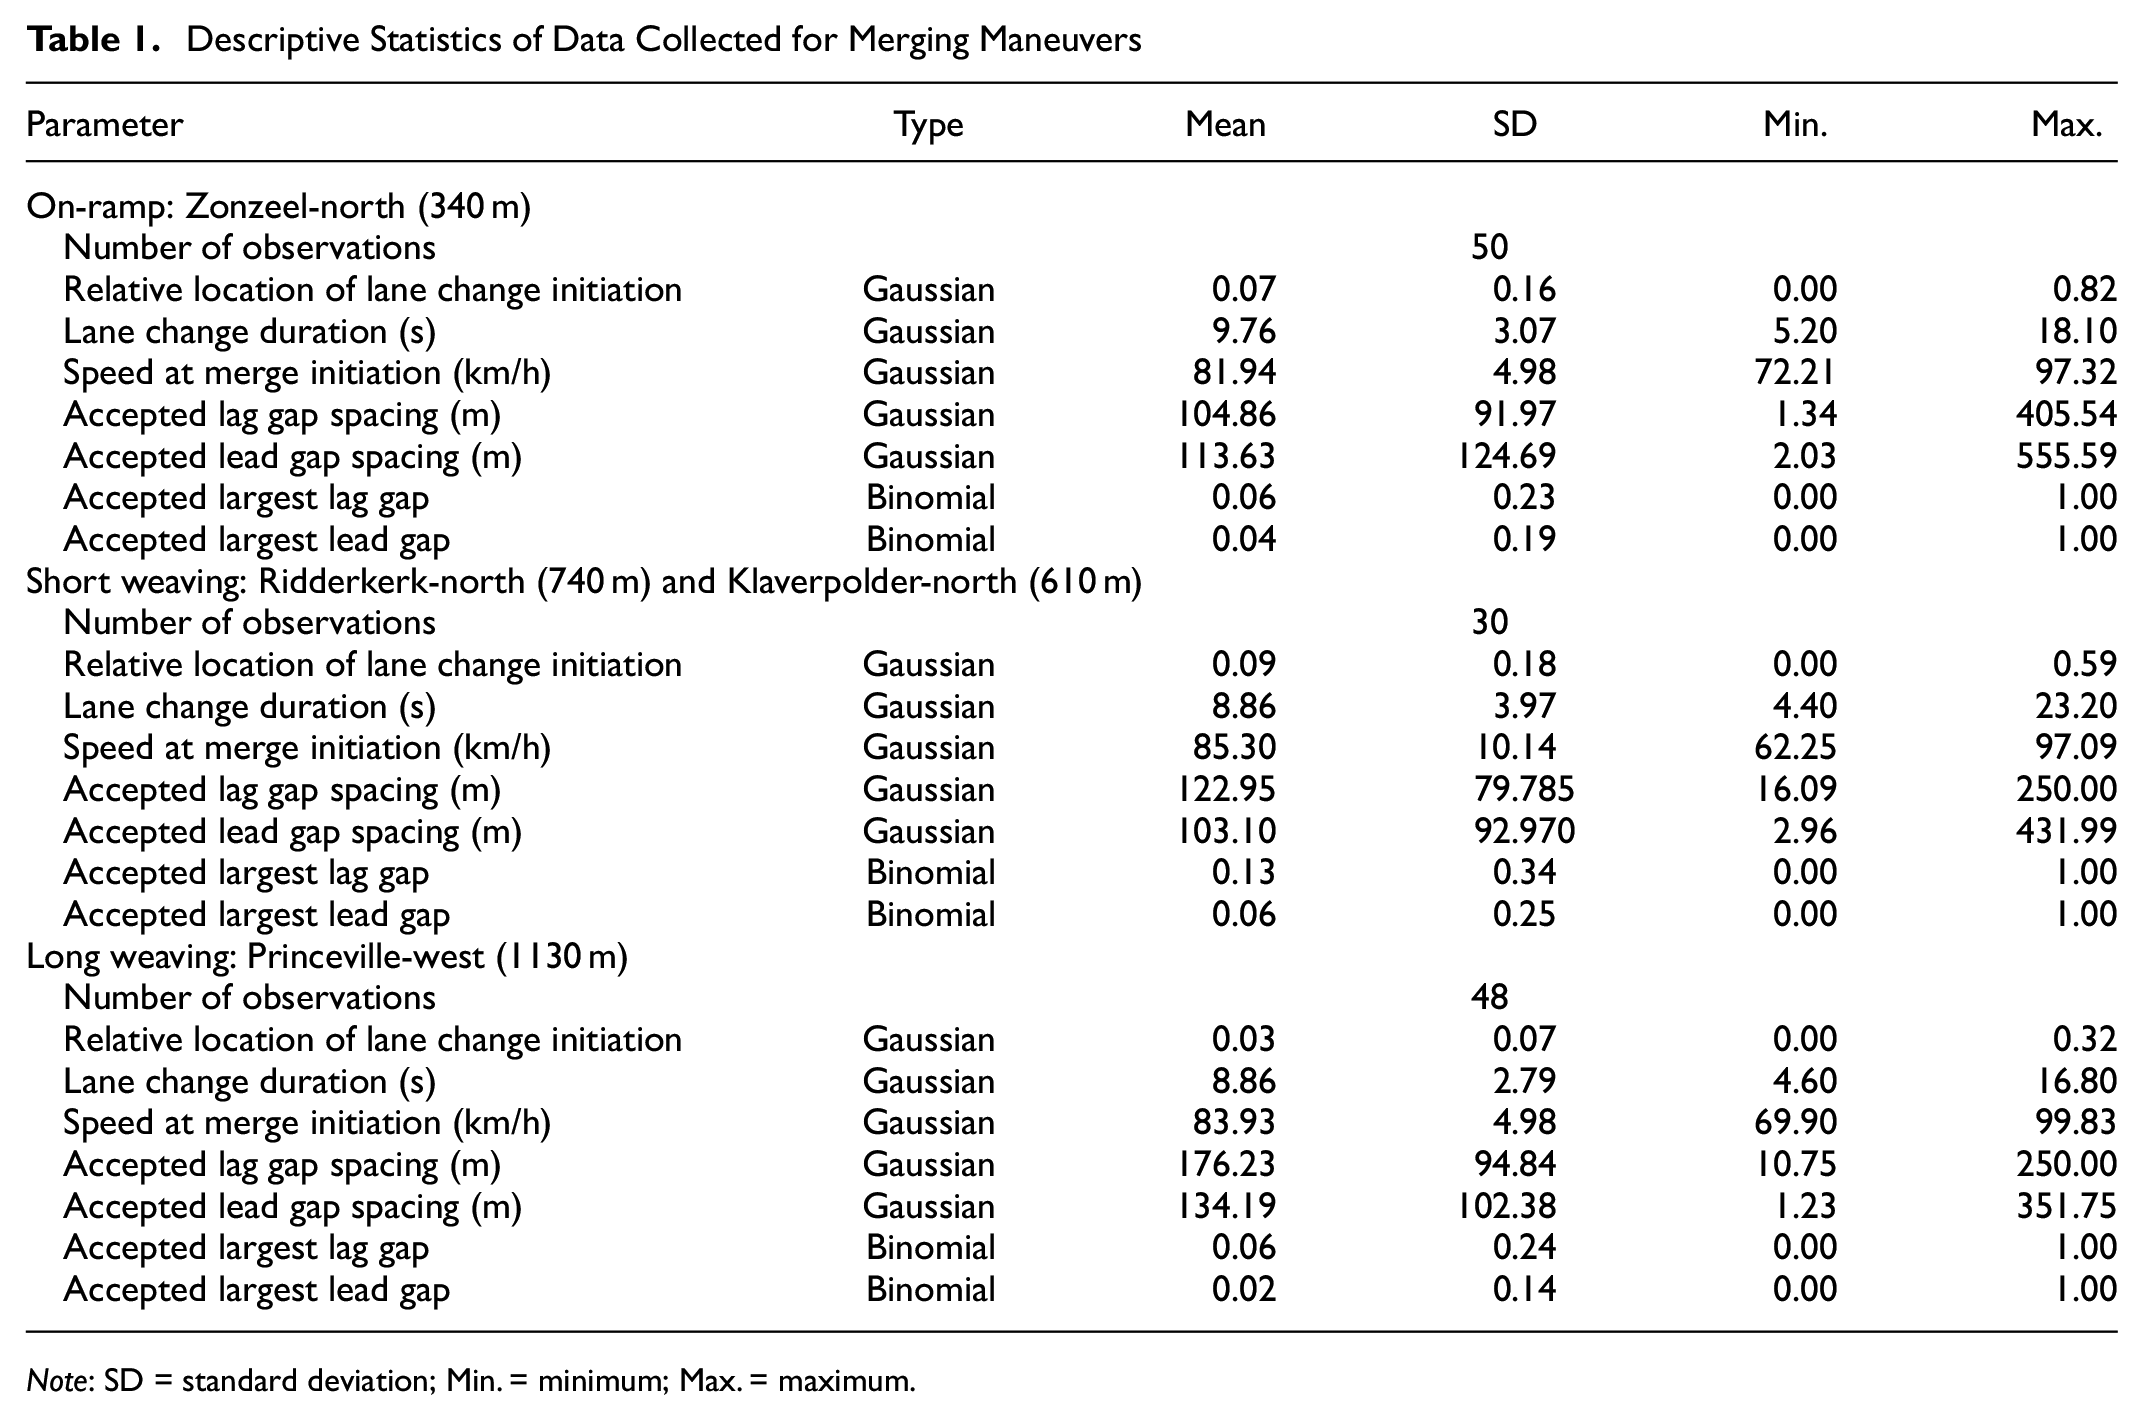
Note: SD = standard deviation; Min. = minimum; Max. = maximum.
Descriptive Statistics of Diverging Maneuvers
In Table 2, we present descriptive statistics for the data related to the diverging maneuvers of truck drivers. We observe that the bottleneck sites do not feature a real conflict for diverging truck drivers as the mean value of the accepted lag/lead gap spacing is more than 190 m. It also signifies that the initiation of diverging maneuvers is unaffected by the presence of a lag/lead vehicle in the target lane. Therefore, we did not consider indicator variables related to gap acceptance behavior for finite mixture modeling to categorize diverging maneuvers. In the next section, we discuss the results of finite mixture modeling to categorize the lane-changing maneuvers of truck drivers.
Descriptive Statistics of Data Collected for Diverging Maneuvers
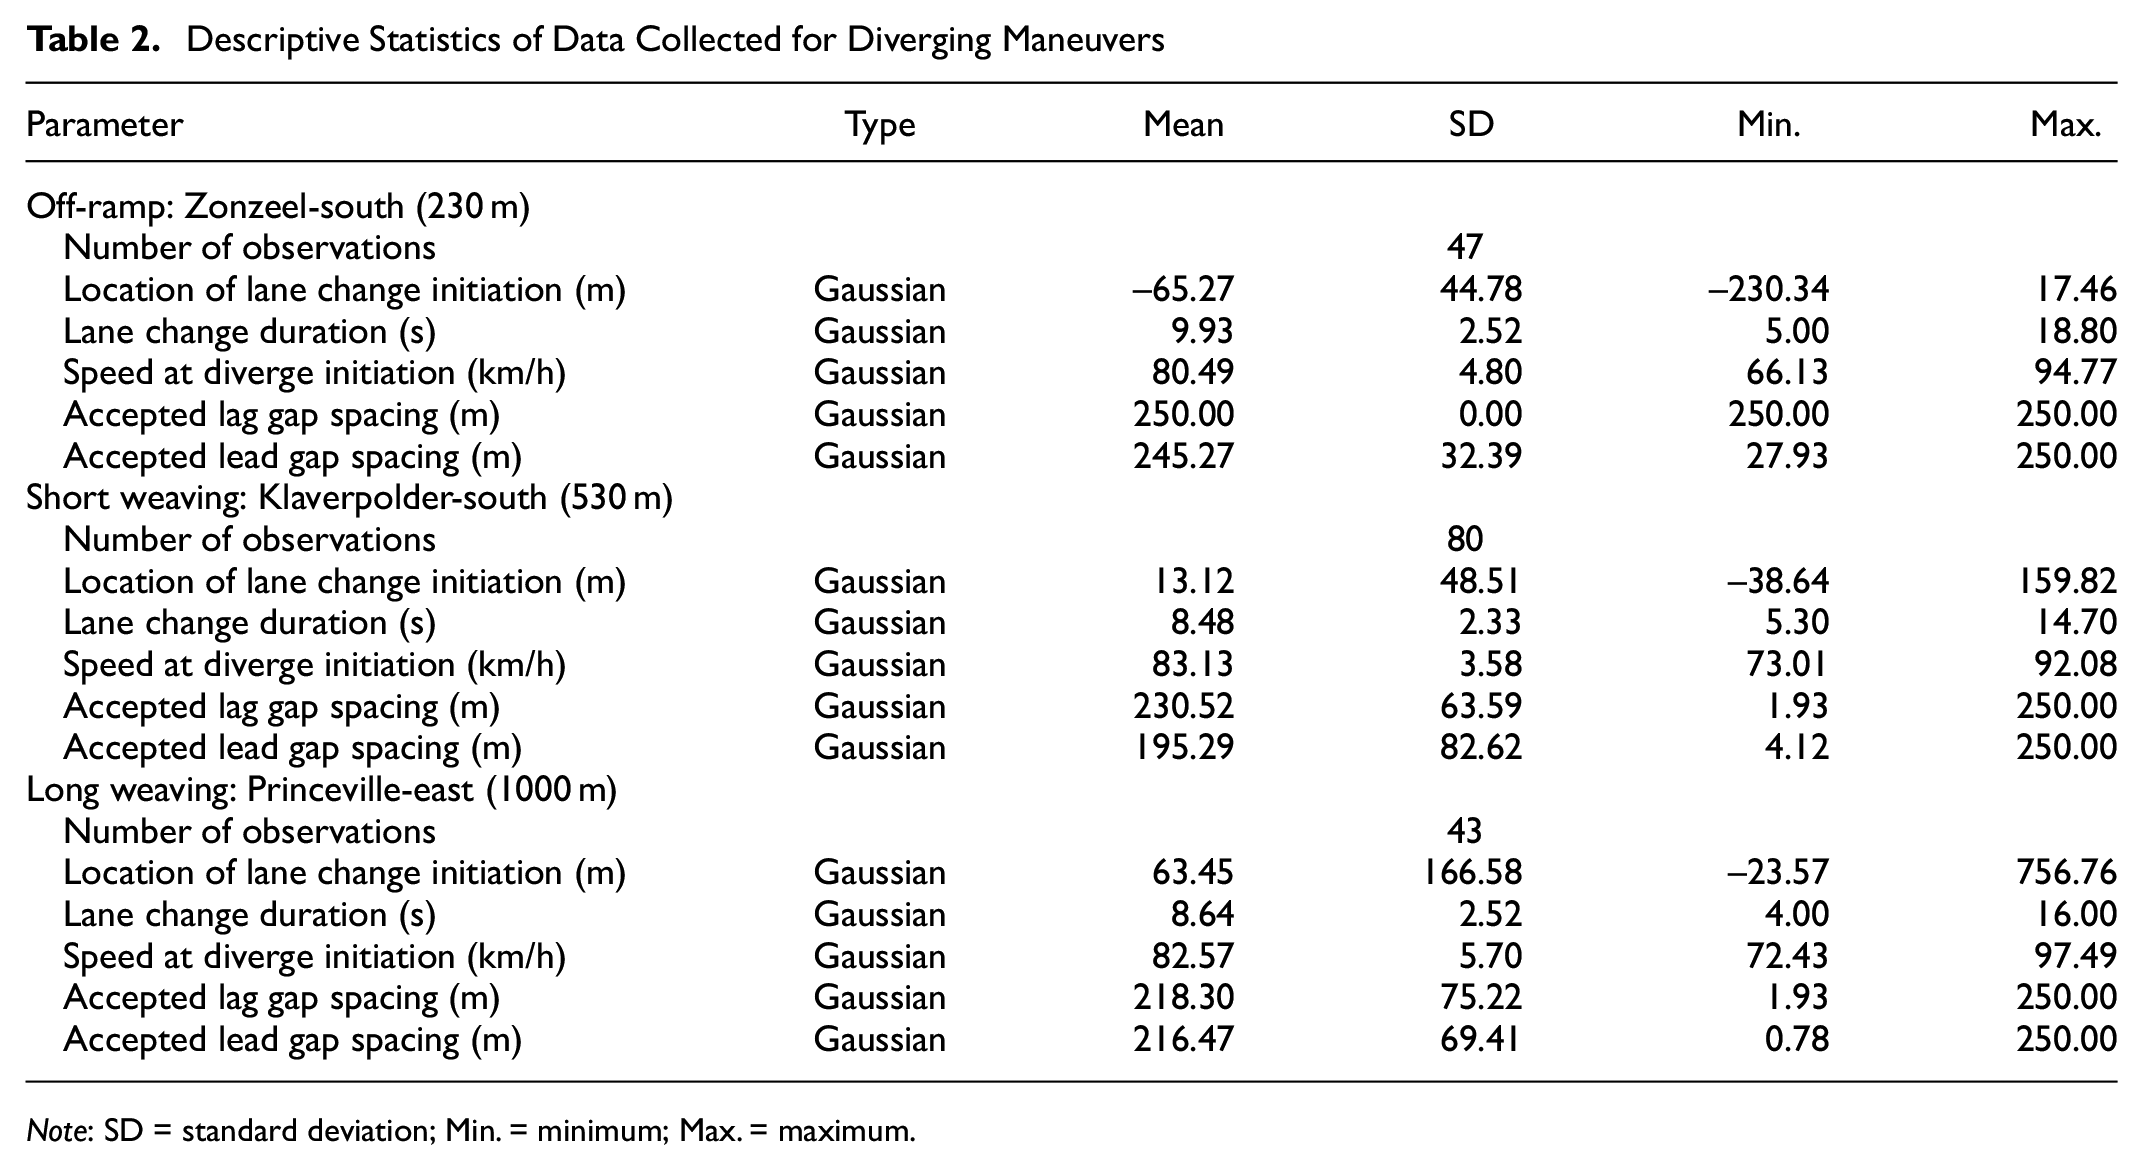
Note: SD = standard deviation; Min. = minimum; Max. = maximum.
Results
The finite mixture models are estimated using the depmixS4 package in R (
27
). To avoid locally optimal solutions, the models are estimated 500 times for each class and then the model with the lowest value of BIC is selected for that class. The proportion of truck drivers

Next, we present the categories of truck drivers with respect to their merging and diverging maneuvers.
Merging Strategies of Truck Drivers
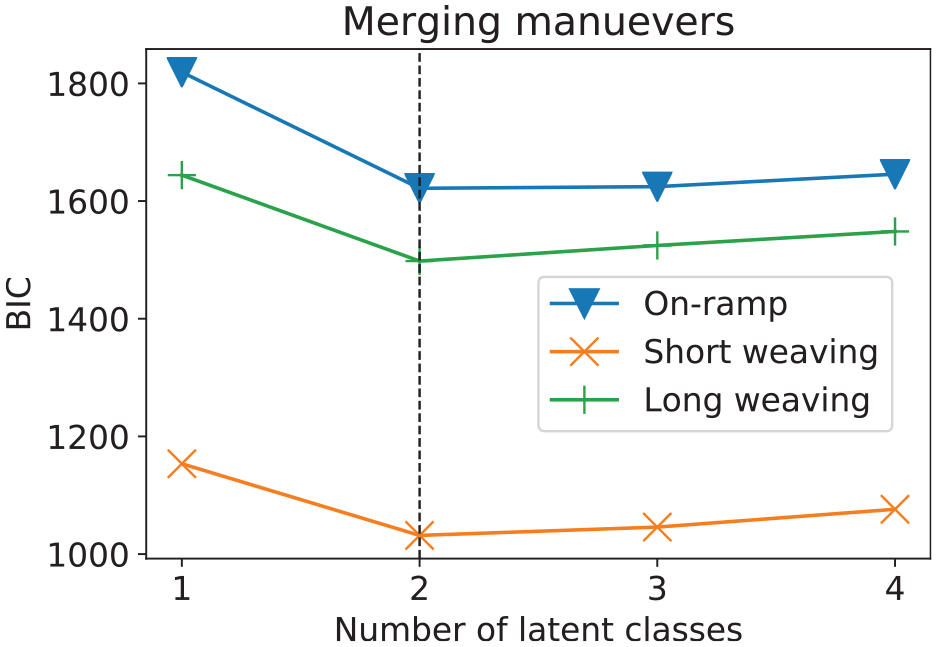
Figure 4 presents the fit of finite mixture models with respect to the BIC statistic. Based on the BIC statistic (being lowest in the 2-component finite mixture model), two latent classes of truck drivers are considered with respect to their merging maneuvers over different topologies. Table 3 presents the profile of two-classes of truck drivers.
Categorizing the merging maneuvers of truck drivers.
Profile of Two Latent Class Model for Truck Drivers’ Merging Maneuvers
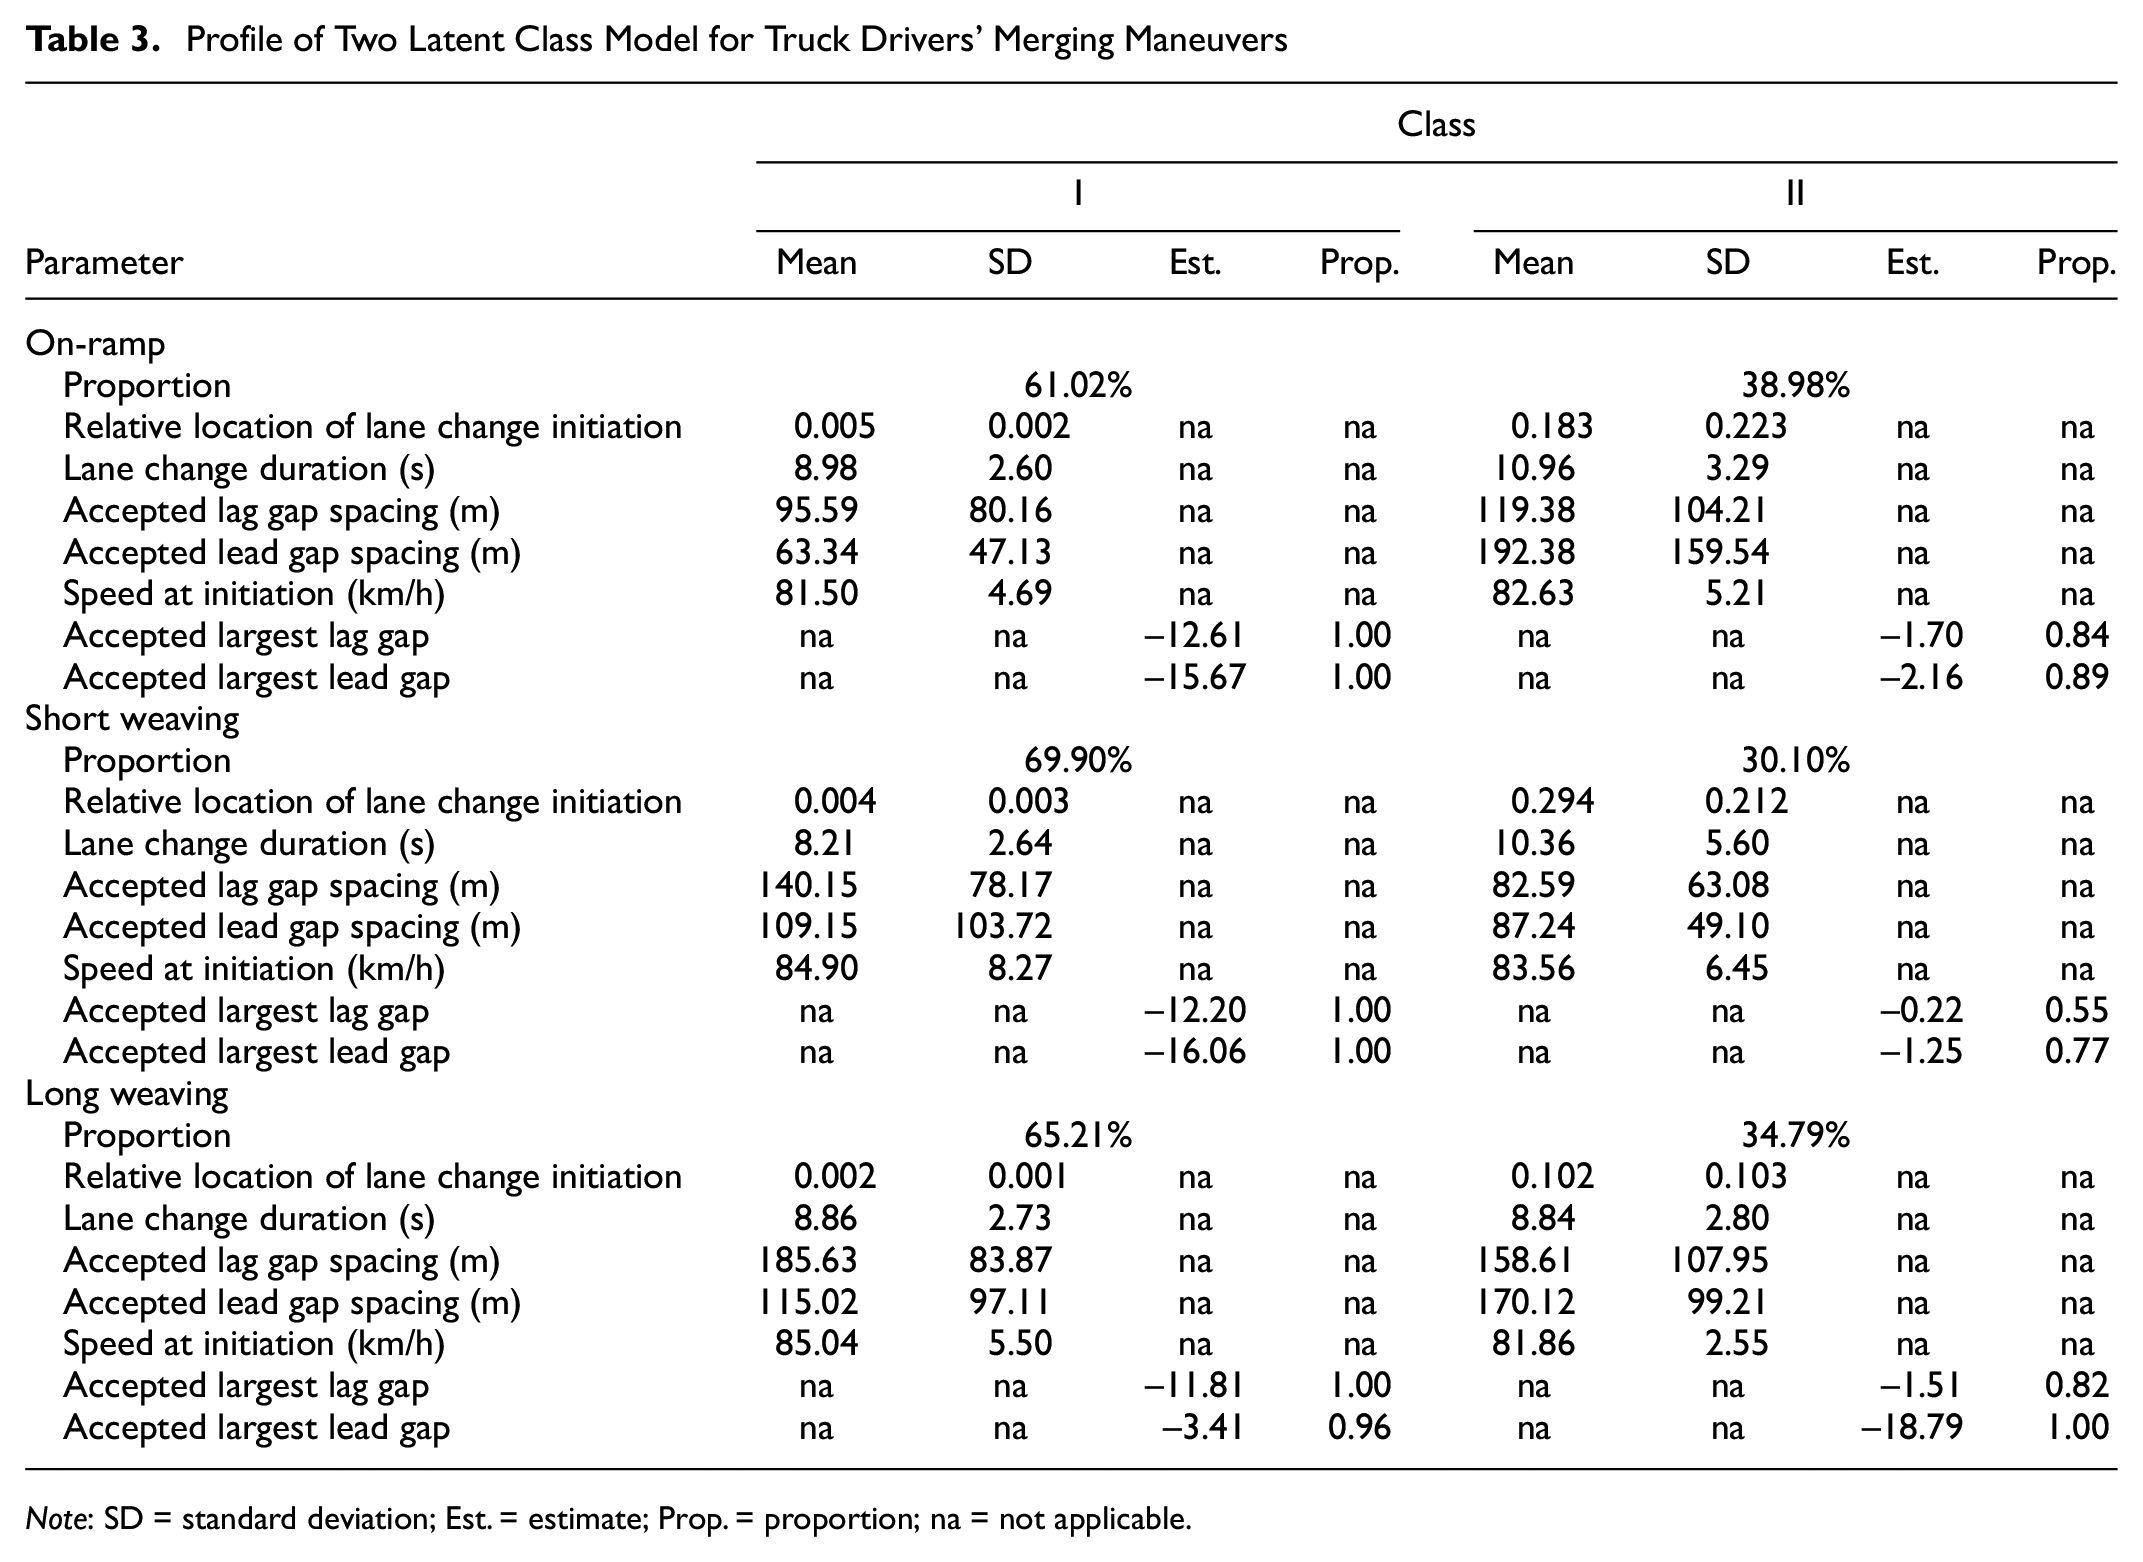
Note: SD = standard deviation; Est. = estimate; Prop. = proportion; na = not applicable.
Class I is the largest class and is characterized by a truck driver’s affinity to initiate merging maneuvers as early as possible after reaching the acceleration lane. The proportion of truck drivers belonging to class I is 61.02%, 69.90%, and 65.21% for the on-ramp, short weaving, and long weaving section, respectively. Truck drivers initiate the merging process at a mean longitudinal position of 1.7 m, 2.8 m, and 2.26 m after the beginning of on-ramp, short weaving, and long weaving sections, respectively. Truck drivers belonging to this class show a tendency to accept a gap from a set of the initial few gaps available to them. The urge to merge at the earliest possible opportunity prompts a truck driver to accept the largest gap spacing from that initial set of available gaps.
Class II is the smallest class and comprises truck drivers who either could not find a suitable gap earlier, or intentionally accept a smaller gap later on. The proportion of truck drivers belonging to class II is 38.98%, 30.10%, and 34.79% for the on-ramp, short weaving, and long weaving section, respectively. Truck drivers in class II initiate the merging process within a mean longitudinal position of 75.82 m, 205.80 m, and 115.26 m after the beginning of the on-ramp, short weaving, and long weaving sections, respectively. The proportion of truck drivers belonging to class II who reject the largest available lag gap and accept a smaller one is 16%, 45%, and 18% for the on-ramp, short weaving and long weaving sections, respectively. Although 11% and 23% of truck drivers belonging to class II reject the largest available lead gap spacing for on-ramp and short weaving sections, respectively.
Diverging Strategies of Truck Drivers
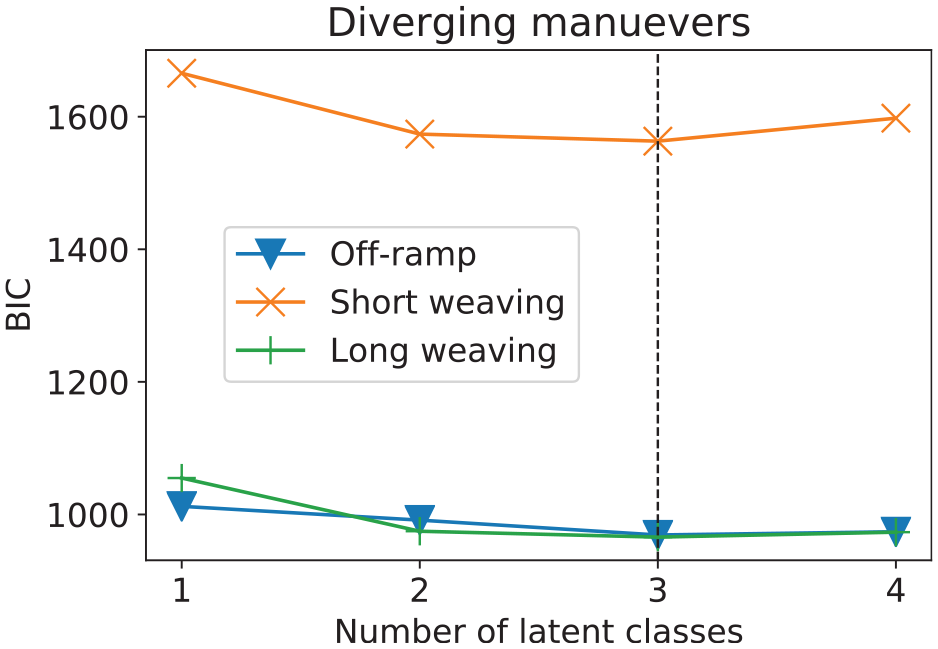
Figure 5 presents the fit of finite mixture models with respect to the BIC statistic. Based on the BIC statistic (being lowest in the 3-component finite mixture model), three latent classes of truck drivers are considered with respect to their diverging maneuvers over different topologies.
Categorizing the diverging maneuvers of truck drivers.
Table 4 presents the profile of three-classes of truck drivers. The classes are characterized by the location of lane change initiation, instantaneous speed of a truck, and lane change duration. For an off-ramp, the proportion of truck drivers belonging to class I, II, and III is 19.30%, 46.85%, and 33.85%, respectively. Truck drivers belonging to class I start the diverging maneuver 136.09 m before the beginning of the bottleneck and some of them might utilize the hard shoulder, which is also confirmed by the video feed ( 16 ). Whereas truck drivers belonging to class II and III start their diverging maneuvers 64.79 m and 25.56 m before the beginning of a bottleneck, respectively. The closer to the beginning of a bottleneck a truck driver starts diverging, the shorter will be the lane change duration; truck drivers belonging to class III have 7.57 s of mean lane change duration.
Profile of Three Latent Class Model for Truck Drivers’ Diverging Maneuvers
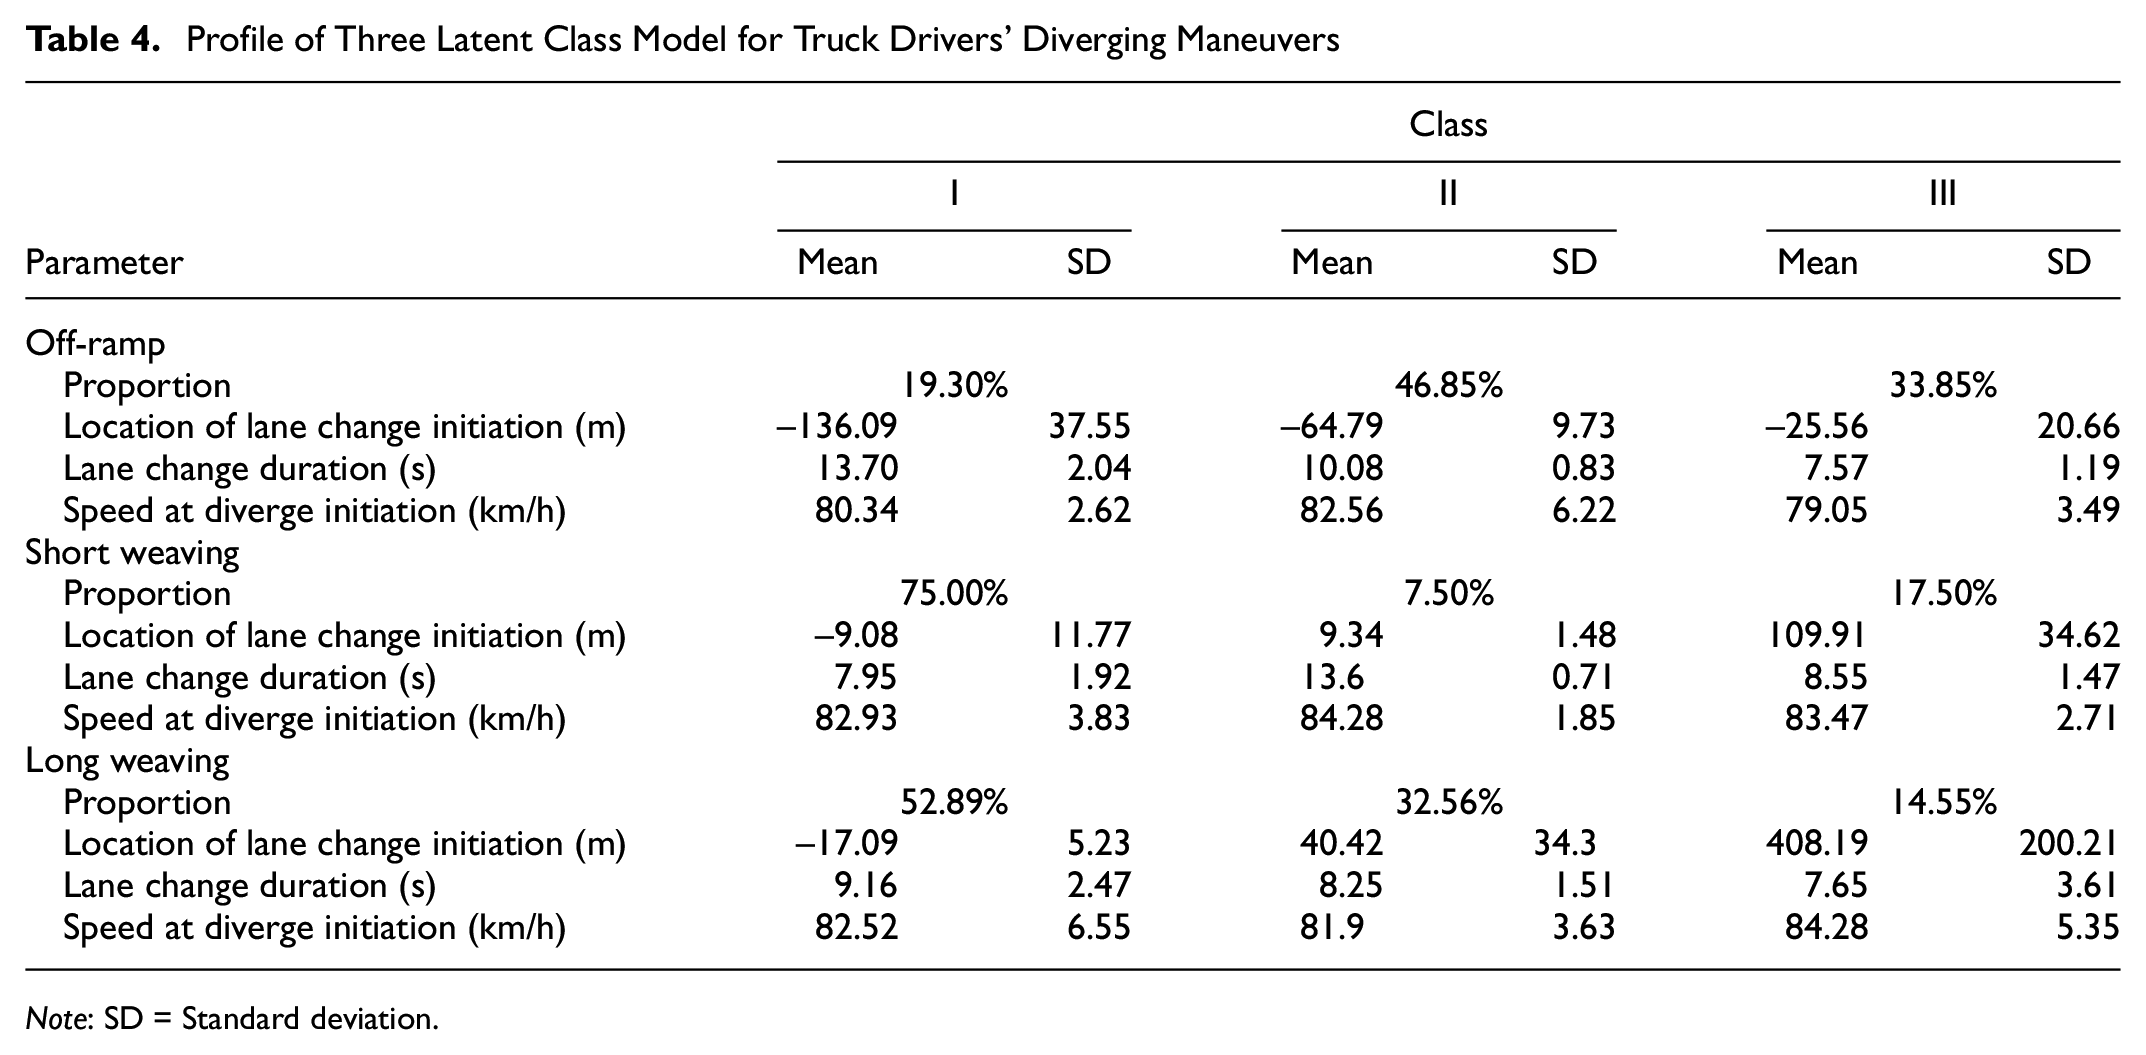
Note: SD = Standard deviation.
For a short weaving section, the proportion of truck drivers belonging to class I, II, and III is 75.00%, 7.50%, and 17.50%, respectively. Class I truck drivers, being the largest group, start the diverging maneuver 9.08 m before the beginning of a bottleneck. However, truck drivers belonging to class II and III start their diverging maneuvers 9.34 m and 109.91 m after the beginning of the bottleneck, respectively.
For a long weaving section, the proportion of truck drivers belonging to class I, II, and III is 52.89%, 32.56%, and 14.55%, respectively. Similar to the short-weaving section, class I truck drivers, being the largest group, start the diverging maneuver 17.09 m before the beginning of the bottleneck. Truck drivers belonging to class II and III start their diverging maneuvers 40.42 m and 408.91 m after the beginning of the bottleneck, respectively.
The mean speed of truck drivers at lane change initiation is around 80 km/h in all cases. In Table 2, descriptive data statistics show that the presence of a lead or lag vehicle in the target lane does not affect the diverging maneuver. Therefore, class III truck drivers over short and long weaving sections have a preference to diverge later than the majority of truck drivers belonging to class I and II. Next, we discuss the contribution of truck drivers’ lane change behavior in the vicinity of a bottleneck to the turbulence.
Contribution of Truck Driver’s Lane-Changing Behavior to Turbulence
Lane-change maneuvers in the vicinity of motorway ramps and weaving sections are primary contributors to turbulence ( 6 ). To identify the contributions of truck drivers to turbulence, we considered the following six sites with significant truck-related merging or diverging maneuvers. We excluded Ridderkerk-north from this analysis as only eight trucks merged onto the mainline motorway at this site.
Zonzeel-north: On-ramp (merging)
Klaverpolder-north: Short weaving section (merging)
Princevile-west: Long weaving section (merging)
Zonzeel-south: Off-ramp (diverging)
Klaverpolder-south:Short weaving section (diverging)
Princeville-east: Long weaving section (diverging)
In addition to trucks, we also considered other vehicles present in the traffic. The vehicles are further categorized based on their lengths.
Category 1: Vehicle’s length smaller than 5.6 m (e.g., passenger cars)
Category 2: Vehicle’s length in between 5.6 and 12 m (e.g., busses, vans, etc.)
Category 3: Vehicle’s length longer than 12 m (e.g., trucks)
In Figures 6 and 7, we show a comparison of spatial distribution of lane changes performed by different categories of vehicles. For these figures, the longitudinal position of the lane-changing maneuver refers to the one in which a vehicle crosses the lane boundary. It can be observed that at least 50% of lane changes occur within the initial 25% of the ramp or weaving segment length.
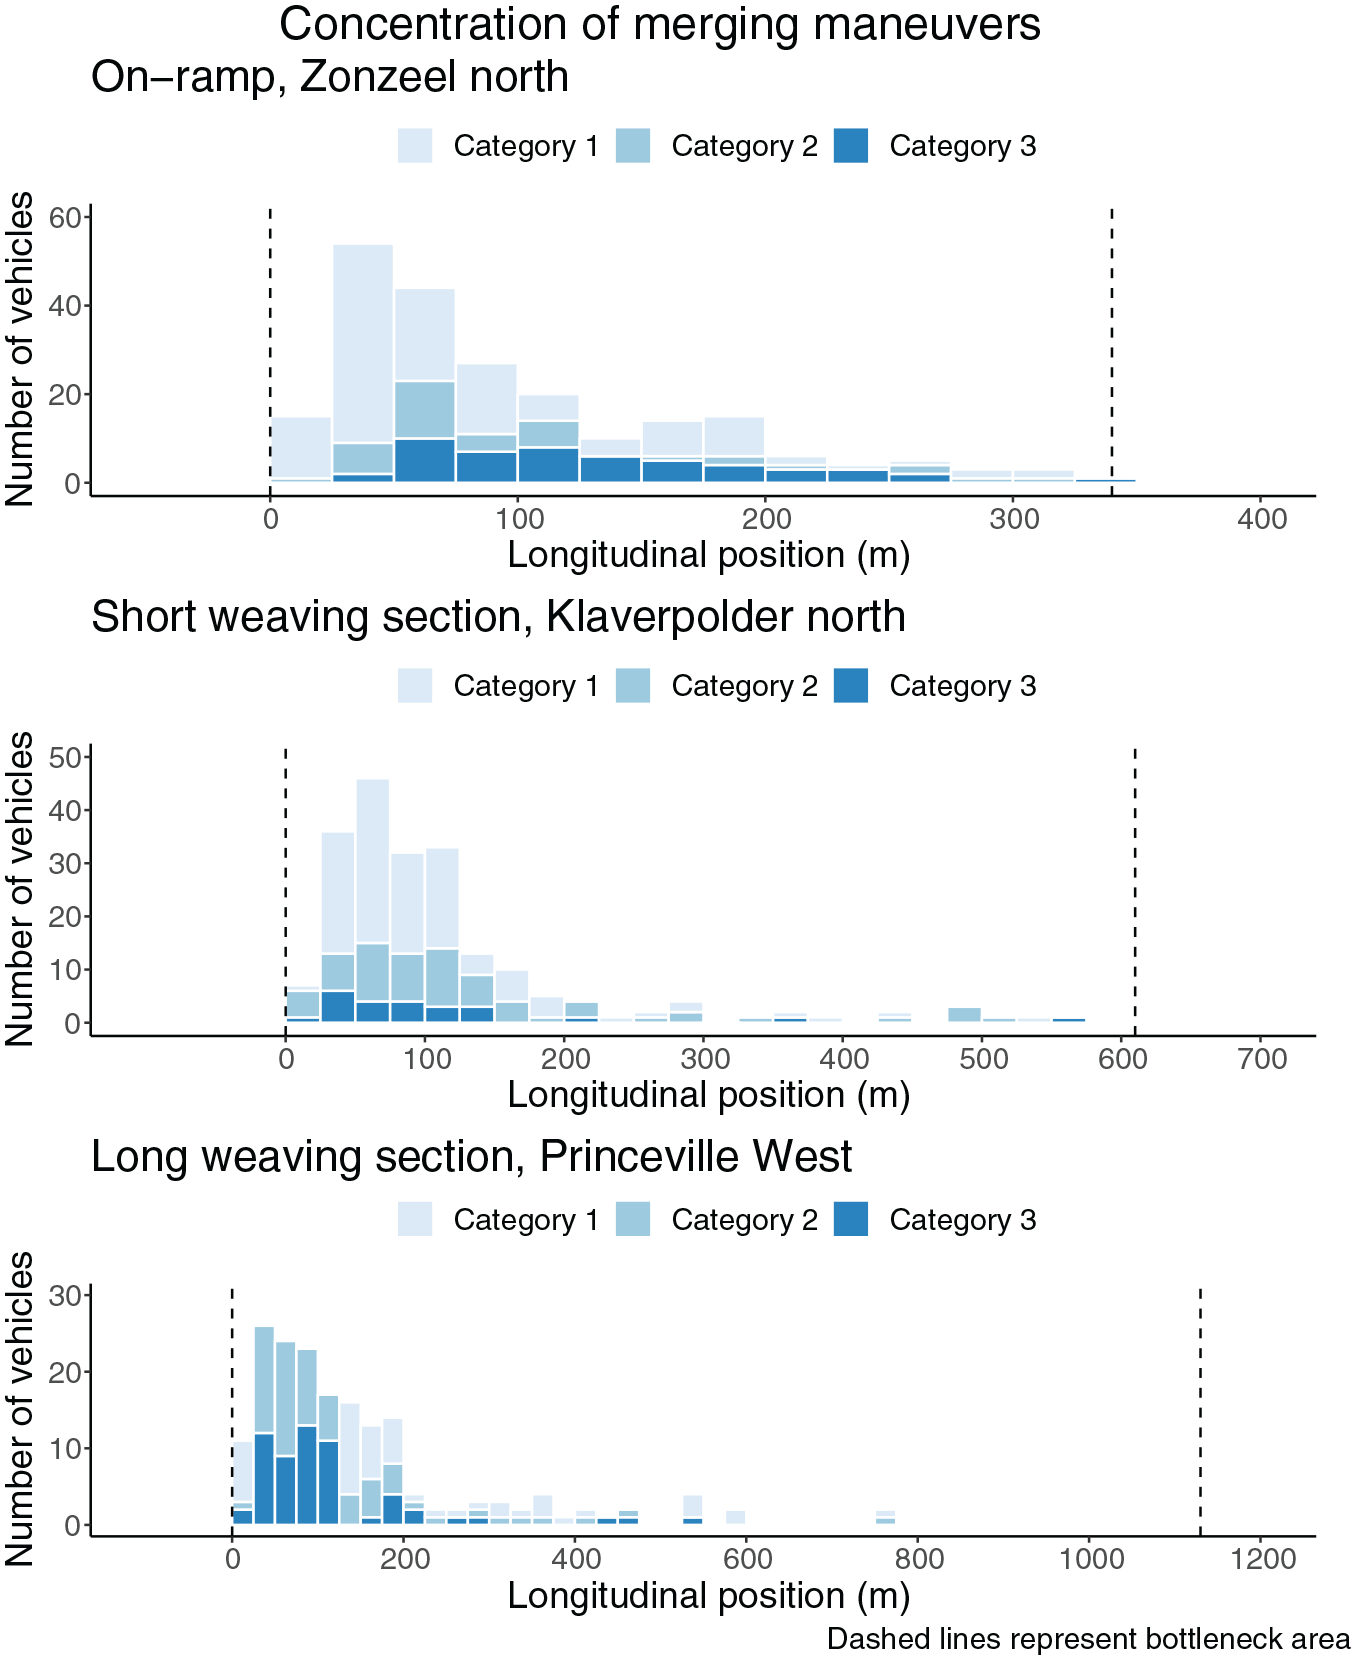
Concentration of merging maneuvers at on-ramp, short weaving and long weaving sections.
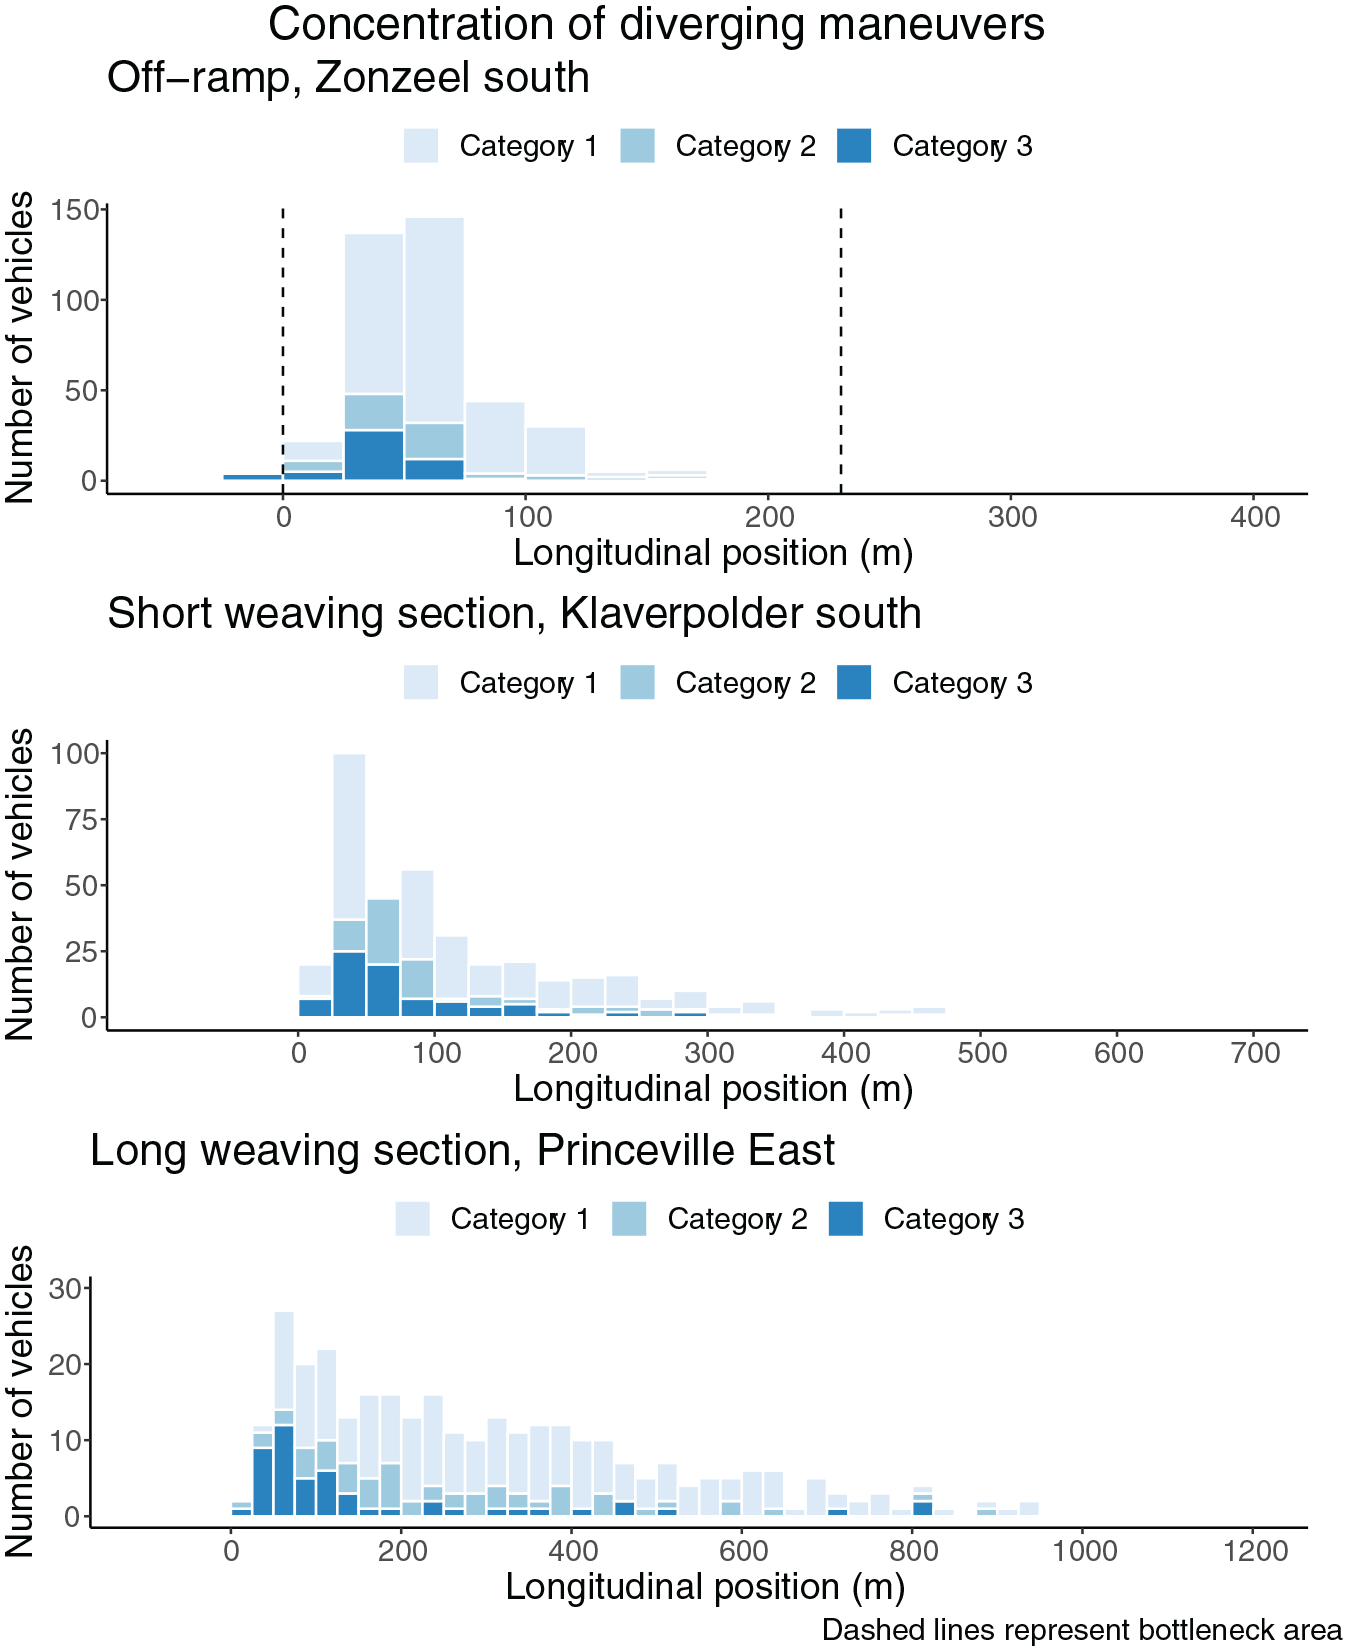
Concentration of diverging maneuvers at off-ramp, short weaving and long weaving sections.
Within the initial 25% of the ramp or weaving segment length, the proportion of truck drivers performing merging maneuvers is 25.49%, 87.50%, and 94.91% for the on-ramp, short weaving and long weaving sections, respectively. Furthermore, 76.47% of truck drivers can merge at the on-ramp (Zonzeel-north site) within the initial 50% of the ramp length. It can be inferred that truck drivers require a certain minimum distance on the acceleration lane (i.e., around 150 m) to change lanes.
Similarly, within the initial 25% of the ramp or weaving segment length, the proportion of truck drivers performing diverging maneuvers is 80.39%, 80.00%, and 78.43% for the on-ramp, short weaving and long weaving sections, respectively. The findings indicate that a high proportion of truck drivers change lanes within the initial 25% of the ramp or weaving segment length; these actions lead to turbulence at the beginning of a motorway bottleneck.
Discussion
Discussion of Findings
Our main finding is that truck drivers can be categorized with respect to their merging and diverging strategies into two and three categories, respectively. Previously, similar results have been reported for the driver population as a whole in previous research focused on lane-changing (14, 15, 17, 18). The number of categories with respect to either merging/diverging is consistent over different topologies. We also found that the lane change locations of truck drivers are heavily right-skewed. Similar to our findings, a strongly right-skewed distribution of lane-changing positions has previously been reported for weaving sections by Menendez and He ( 28 ). However, they have not considered individual vehicle categories. In that respect, our findings can be used in multi-class models in which distributions related to lane-changing characteristics of truck drivers (e.g., lane-change position, lane-change duration, etc.) can be supplied as exogenous inputs to such models.
The right-skewed distribution of lane-changing positions also explains the contribution of truck drivers to the turbulence we usually observe in the vicinity of infrastructural bottlenecks. Similar findings are reported in van Beinum et al., but they did not look at the spatial distribution of lane changes for different categories of vehicles ( 6 ). Truck drivers who make use of longer distances are the ones who either select a suitable gap or intentionally accept a smaller gap to merge onto the mainline carriageway. Whereas gap acceptance does not seem to be a primary factor in the diverging strategies of truck drivers, still, around 15% of truck drivers are observed to take an exit at a longer distance over weaving sections. The findings seem to suggest that truck drivers do not fully utilize the available ramp and weaving segment length. Near the beginning of these areas, a raised level of turbulence has serious implications for traffic efficiency and safety. Our findings indicate that motorway design guidelines should give due attention to the multi-class nature of traffic. For instance, motorways with a high percentage of trucks require longer acceleration and deceleration lanes.
Limitations
The internal preferences which truck drivers may have in their mind while performing their mandatory lane-changing maneuvers and their socio-economic characteristics cannot be observed from the trajectory dataset. Stated-preference surveys or driving simulator experiments can be used to gain insights into those internal mechanisms.
The findings presented in this paper are valid for truck drivers operating in the Netherlands. We expect that these findings may apply to other European countries with similar driving regulations. For other countries, similar studies should be performed so that findings related to merging and diverging strategies of international truck drivers can be compared. A comparison of this scale would allow us to design tools to not only improve current models, but also perform improved traffic and safety assessments.
Conclusions and Future Work
This paper uses a trajectory dataset, collected for ramps and weaving sections located in the Netherlands, to identify heterogeneity within truck drivers with respect to their merging and diverging strategies. We use finite mixture models to categorize truck drivers using their spatial, temporal, kinematic, and gap acceptance attributes of lane changing. The results indicate that we can group truck drivers into two with respect to their merging strategies and into three with respect to their diverging strategies. The findings of this paper can be implemented into microscopic simulation packages to better replicate the lane-changing behavior of truck drivers at motorway ramps and weaving sections. The categorization helps us to infer the spatial distribution of lane changes performed by truck drivers. For both merging and diverging, the majority of truck drivers show an affinity to initiate the lane change process at the earliest opportunity which is characterized by a right-skewed distribution. This behavior leads to a higher number of lane changes being performed at the beginning of a motorway bottleneck section. In this respect, the effect on traffic efficiency and safety near these areas owing to different merging and diverging strategies adopted by truck drivers should be evaluated. For future work, control strategies can be designed to reduce the effect of lane changes in the vicinity of motorway bottlenecks. A promising direction could be to optimize the spatial distribution of mandatory lane changes for multiple user classes of motorway traffic.
Footnotes
Author Contributions
The authors confirm contribution to the paper as follows: study conception and design: Salil Sharma, Maaike Snelder, Lóránt Tavasszy, Hans van Lint; data collection: Salil Sharma; analysis and interpretation of results: Salil Sharma, Maaike Snelder, Lóránt Tavasszy, Hans van Lint; draft manuscript preparation: Salil Sharma, Maaike Snelder, Lóránt Tavasszy, Hans van Lint. All authors reviewed the results and approved the final version of the manuscript.
Declaration of Conflicting Interests
The author(s) declared no potential conflicts of interest with respect to the research, authorship, and/or publication of this article.
Funding
The author(s) disclosed receipt of the following financial support for the research, authorship, and/or publication of this article: The research presented in this paper is a part of the project “ToGRIP-Grip on Freight Trips” supported by the Netherlands Organization for Scientific Research (NWO), TKI Dinalog, Commit2data, Port of Rotterdam, SmartPort, Portbase, TLN, Deltalinqs, Rijkswaterstaat, and TNO.