




Abstract
Road freight transport is believed by many to be the first transport domain in which driverless (DL) vehicles will have a significant impact. However, in current literature almost no attention has been given to how the diffusion of DL trucks might occur and how it might affect the transport system. To make predictions on the market uptake and to model impacts of DL truck deployment, valid cost estimates of DL truck operations are crucial. In this paper, an analysis of costs and cost structures for DL truck operations, including indicative numerical cost estimates, is presented. The total cost of ownership for DL trucks compared with that for manually driven (MD) trucks has been analyzed for four different truck types (16-, 24-, 40-, and 64-ton trucks), for three scenarios reflecting pessimistic, intermediate, and optimistic assumptions on economic impacts of driving automation based on current literature. The results indicate that DL trucks may enable substantial cost savings compared with the MD truck baseline. In the base (intermediate) scenario, costs per 1,000 ton-kilometer decrease by 45%, 37%, 33%, and 29% for 16-, 24-, 40-, and 60-ton trucks, respectively. The findings confirm the established view in the literature that freight transport is a highly attractive area for DL vehicles because of the potential economic benefits.
There are several reasons why the road freight transport sector might foresee a strong influence of driverless (DL) vehicles. First, the adoption of new technologies in the freight transport sector is mainly driven by potential cost advantages ( 1 , 2 ). Driver costs constitute large parts of transport costs in road freight—around 40% of truck operating costs in a high-wage country ( 3 )—and could be substantially reduced by driving automation ( 4 ). Second, there is an expected shortage of truck drivers, with an estimated lack of 800,000 drivers in 2030 in the European Union and the United States ( 5 ). Third, experts from the industry foresee benefits in prioritized areas such as traffic safety and truck productivity ( 2 ). Several commercial initiatives in the area are established and large investments in the development of DL trucks are being made showing that the market is pursuing to realize these benefits ( 6 – 9 ).
To make predictions on the market uptake and to model impacts of DL truck deployment, valid cost estimates on DL truck operations are crucial. It is expected that DL trucks will enable massive cost reductions compared with manually driven (MD) trucks ( 1 , 5 , 10 ). The potential impact of DL trucks is an emerging research area and focus has so far mostly been on labor market impacts ( 5 , 11 ) and the effects on freight transport system actors and regulations ( 12 ). Although speculations on economic benefits and costs are common in gray literature ( 4 , 13 ), systematically and transparently derived cost estimates are rare. One of few examples is the study by Wadud ( 14 ) that analyzes total cost of ownership (TCO) for three types of DL trucks and indicates that TCO may decrease by 15%–20%. However, Wadud ( 14 ) covers a limited set of potential economic impacts and does not consider aspects such as the potential to increase truck utilization ( 15 ), remote operations ( 16 ), or potential savings related to new truck designs ( 1 ).
The purpose of this paper is to estimate the potential economic impact of driving automation on truck operations by:
reviewing potential cost impacts on truck operations as a result of the introduction of DL trucks, and providing indicative cost estimates for DL truck operations relative to MD trucks.
In this paper, the term “DL truck” represents a road freight transport vehicle at SAE automation Level 4 or 5 (17) that does not carry a human driver to perform the driving task. Level 4 DL trucks require assistance from an operator or other support systems outside of the vehicle to perform the driving task when outside the operational design domain. Focus is on DL truck applications on public roads for long-distance and regional freight movements, that is, not local transport or first- and last-mile transport within urban areas (see Reference ( 18 ) for an evaluation of automated sidewalk delivery robots). The main reason is that DL vehicles are assumed to be feasible in long-distance settings well before in urban areas ( 1 , 5 , 11 , 19 ). Also, the operations of first- and last-mile transport face different challenges that require separate analysis. Platooning, in this paper, is treated as a tactical driving mode that may be utilized by both DL and MD trucks with platooning-enabled automation systems. The literature ( 11 ) describes automation use cases with trucks without drivers capable of following an MD truck leader in a platoon but without automation capabilities to drive autonomously without an MD truck leader. A large-scale introduction of platooning-enabled driving automation use cases could potentially be closer in time than DL trucks ( 20 ) and could be a technological development step toward the deployment of DL trucks. However, such trucks do not fall into the above-mentioned definition of DL trucks and this type of use cases is not in the scope of the analysis in this paper. Electrification is not considered because the intention is to isolate effects of driving automation. Potential costs for new infrastructure required to enable DL vehicles is not included in the cost calculations, as it is uncertain if such infrastructure is required and what exact specifications and costs should be used. Furthermore, it is uncertain whether, and under what model, such costs would be covered by the vehicle owner.
Following this introduction, the method and details of the truck cost model are presented along with the assumptions and costs for the MD truck baseline in the “Method” section. In the third section, the assumptions for the analysis of DL truck costs are presented and discussed. Next, the results of the cost calculation for DL trucks are presented, followed by a discussion of the wider implications of the economic impacts of DL trucks. Finally, the paper is concluded in the last section.
Method
To analyze economic impacts of DL trucks, a TCO approach is applied. The TCO of a vehicle is basically all costs for the vehicle owner during the time of vehicle ownership ( 14 ). This means that externalities such as potential infrastructure costs that have not been internalized by taxes or other fees are not included. Four different truck types, segregated by total maximum weight of the truck rig, are considered: 16-, 24-, 40-, and 60-ton rigs. As different truck types have different investment periods and utilization ( 21 ), this analysis is based on TCO per ton-kilometer instead of lifetime TCO or annualized TCO. The calculations are performed for an average operated ton-kilometer during the lifetime of a truck. Therefore, the non-uniform distribution of some types of costs over the truck lifetime (e.g., maintenance costs may be higher during later stages of the truck lifetime) is not treated as time-dependent but as average over the truck lifetime.
The cost calculation is made using a truck cost model incorporating key factors affecting truck operating economy from a transport operator perspective. The model is based on the structure in the cost calculation tools SÅCalc (a tool for road haulers by the Swedish Road Transport Association) and ASEK (the official guidelines for cost calculations and forecast used by the Swedish Transport Administration) ( 21 ). Costs estimates for DL trucks are derived by adjusting existing MD truck cost estimates to reflect potential effects of driving automation discussed in previous academic and gray literature. Also, interviews with the DL truck industry by Björkman and Joelsson ( 22 ) have provided insights.
As there are significant uncertainties about many potential economic impacts of DL trucks, the analysis is performed for three different scenarios—a base scenario, a pessimistic scenario, and an optimistic scenario—that are presented in the “Definition of Scenarios” section.
The Truck Cost Model
Costs related to driving trucks (transport costs) and costs related to loading and unloading goods to and from trucks (node costs) are separated. All cost components and the metric used for analysis are presented in the following sections. Variables will be introduced in the text only when they are first used (also see Table 1). The following subscripts are used:
Data for the MD Truck Baseline

Note: MD = manually driven; NA = not available; tkm = ton-kilometer. The costs for MD trucks (per 1,000 tkm) are summarized in Figure 1. The average costs across the truck types is $326. This is 12% higher than what was estimated in the EU project COMPETE in which the average cost for 1,000 tkm for all trucks heavier than 12 tons was estimated to $291 for 2005 (in 2014 USD) (27). The cost discrepancy is regarded acceptable because the cost model is highly sensitive to assumptions on fill rate and other parameters.
i separates variables by vehicle type (e.g., 16MD for a 16-ton MD truck, xMD for all MD trucks and xDL for all DL trucks).
j = {y, d, t, tkm} separates variables by cost type: y = fixed cost (USD/year), d = distance-dependent cost (USD/km), t = time-dependent cost (USD/hour), tkm = ton-kilometer cost (USD/1,000 tkm).
k = {dry, liq, gc} separates variables by commodity type: dry = dry bulk, liq = liquid, gc = general cargo.
Transport Costs
Transport costs are composed of fixed, time-dependent, and distance-dependent costs, but fixed costs are ultimately allocated as time- or distance-dependent costs.
Fixed Annual Costs
Fixed annual costs recur on a yearly basis and are activated regardless of whether and to what extent a truck is used.
Eiy, Equation 1, is the depreciation cost representing the aging effect and is assumed to be 30% of the total depreciation, in line with current Swedish appraisal practices (
21
). The aging effect is unrelated to truck usage and is instead a cost for the truck becoming outdated. Ai is the acquisition cost, Zi is the residual value and Yi is the ownership period.

Ciy, Equation 2, is the average annual cost of capital binding where X is the discount rate and 
The fixed annual costs are allocated as distance- or time-dependent costs by dividing by yearly operating distance or operating time.
Vehicle Utilization Variables
Distance-Dependent Costs
Sid, Equation 3, is the total distance-dependent cost, that is, the average cost for operating a truck of type i for 1 km.
Fid, Equation 4, is the cost for fuel and additives. FPrice is the price for 1 L of fuel and FConsi is the average fuel consumption in liters per kilometer.
Eid, Equation 5, is the depreciation resulting from capital wear resulting from driving the truck.


Time-Dependent Costs
Sit, Equation 6, is the total time-dependent cost, that is, the cost for operating a truck of type i for an average operating hour.
Rit, Equation 7, is a cost for remote operations of DL trucks. γ1
i
is the relative cost of an hour of remote operations compared with the driver cost. γ2
i
is the number of operators per DL truck on average.
Cit, Equation 8, is capital cost per hour.
Eit, Equation 9, is fixed depreciation cost per hour.
Git, Equation 10, is tax cost per hour.
Iit, Equation 11, is insurance cost per hour.
Oit, Equation 12, is other costs per hour.






Node Costs
Node costs are costs for loading and unloading trucks and consist of one volume-related component (bulk cost) and a time-related component. Node costs are specified for three types of commodities: dry bulk, liquid, and general cargo. Bulk costs and loading time differ between commodities. It is assumed that 16-ton trucks can carry dry bulk and general cargo; the 24-, 40-, and 60-ton trucks can carry all commodities. The loading time is assumed to be independent to the loaded volume of goods.
It is assumed that there are no differences in human labor required to load/unload a DL truck compared with an MD truck. However, there is no driver in the DL truck who may assist during loading and unloading of the vehicle, which is often the case for MD trucks (
23
). Instead, these tasks are assumed to be performed by staff at the terminal. Therefore, for DL trucks the cost for an average driver-hour is added to the time-dependent node cost component. For a DL truck, the total node cost for one loading/unloading process of commodity k for a DL truck is Nik, Equation 13. Pik is the bulk cost, Capi is the truck loading capacity, Filli is the average fill rate, and Qik is the loading/unloading time.

The average cost across all commodities for one loading/unloading is Ni, Equation 14, where Kik is the share of trips with commodity type k.

Analysis Metric
As different truck types typically operate different types of transport missions (i.e., different trip lengths and commodities) and have different utilization rates, it is not suitable to analyze annualized TCO or TCO per trip. Also, the utilization rate may change between MD and DL trucks because of driving automation. Instead, the evaluation metric TCO per 1,000 tkm, 

MD Truck Baseline
The MD truck baseline input (Table 1) is based on 2014 data from the Swedish Transport Administration ( 21 ), with the exception for the variables discussed in the next paragraph. All values are converted to U.S. dollars by using the exchange rate 8.69 Swedish crowns per U.S. dollar ( 24 ). For all truck types the fuel price, FPrice, is 1.21 $/L and the discount rate, X, is 5%.
The average trip length, Tripi, varies between truck types and is estimated based on Swedish statistics for truck trips between counties separated by total truck weight for 2018 received from the Swedish government agency for transport policy analysis (Transport Analysis). The share of trips with the different commodities and the average fill rates are estimated by using simulated data from the Swedish national freight transport model Samgods ( 25 ). The share of operating time in node (i.e., in terminal for loading/unloading), Nodei, is estimated based on the number of loadings/unloadings per year (nNiy) and the average loading/unloading time for each truck type. The costs for MD trucks (per 1,000 tkm) are summarized in Figure 1. The average costs across the truck types is $326. This is 12% higher than what was estimated in the EU project COMPETE in which the average cost for 1,000 tkm for all trucks heavier than 12 tons was estimated to $291 for 2005 (in 2014 USD) ( 26 ). The cost discrepancy is regarded acceptable because the cost model is highly sensitive to assumptions on fill rate and other parameters.
Assumptions for DL Truck Costs
Definition of Scenarios
Three DL truck scenarios are selected to cover the main uncertainties on costs and benefits of driving automation, to include potential synergistic effects (e.g., increased utilization and reduced fixed annual costs), and to illustrate the span of potential outcomes.
Base scenario: DL trucks are designed without a driver’s cabin and with Level 4 automation. The economic benefits and costs of DL trucks are intended to represent intermediate estimates available in the literature. Pessimistic scenario: DL trucks are designed by adding driving automation technology on top of conventional truck designs; that is, DL trucks also have a driver’s cabin. DL trucks have Level 4 automation. The assumptions on costs and benefits represent conservative estimates from the literature. Optimistic scenario: DL trucks are based on new vehicle designs and have Level 5 automation. Optimistic estimates on economic impacts from the literature are used and the scenario represents the upper limit of driving automation benefits.
All scenarios take place in an envisioned future in which DL truck technology is mature and widely available. ERTRAC ( 20 ) estimate that DL trucks might become available for hub–hub transport and public roads around 2025–2030 in Europe. Therefore, relative benefits and costs of DL trucks should be assessed according to the capabilities of future MD trucks. For example, it may be that some MD trucks have platooning-enabled automation systems. Also, changes in the relationship of different cost components in the TCO model need to be considered, that is, changes in real costs. However, as there are uncertainties associated with real cost changes, it is assumed that the relationship between the cost components for MD truck operations are unchanged.
DL trucks might influence how road freight transport is organized (
19
). To make the analysis feasible given the vast uncertainties, the following assumptions are made for all scenarios:
Truck trips are modeled as a direct transport chain between one origin and one destination. The analyzed transport chain include three activities: (
1
) loading the truck at the origin (a node cost), (
2
) driving the truck from origin to destination (a transport cost), and (
3
) unloading the truck at the destination (a node cost). The organization of the road freight transport system is assumed to be equal for the MD truck baseline and the scenarios; that is, DL trucks replace MD trucks without alterations of the transport or logistical processes. Thus, the average trip distance, Tripi, the average share of cargo, Kik, the fill rate, Filli, the share of operating time in node, Nodei, and all node cost variables are assumed as unchanged from the MD truck baseline. The economic impacts of driving automation are assumed to have the same relative impacts on all DL truck types.
In the following sections, the assumptions for DL truck impacts for the scenarios are presented and discussed. See Table 2 for a summary.
Assumptions on Variable Values Relative to the MD Truck Baseline Used for the Scenarios

Note: MD = manually driven.
Truck Utilization and Ownership Period
Currently, truck operations are limited by legislation and physiological capabilities of drivers ( 4 ). Long-haulage trucks might be idle during large portions of the day while the driver is not allowed to drive ( 5 ) and manually driven trucks are typically used less than 60% of the time ( 15 ).
With DL trucks, operations are not constrained by driver regulations or the need to return the driver home at the end of the day. However, there are several factors, such as more frequent maintenance because of more intensive driving, limiting the potential to increase utilization ( 4 ). Numerical estimates on increased utilization are only found in gray literature, ranging from 30% ( 4 ), via 80% ( 15 ) to 100% increase ( 11 ).
In the MD baseline (see Table 1), 16- and 24-ton trucks operate 2,000 hours per year (23% of all hours) and 40- and 60-ton trucks operate 3,500 hours per year (40% of all hours). In the base scenario it is assumed that the operating hours will increase by 50%, resulting in a utilization rate of 60% for the 40- and 60-ton DL trucks. This is somewhat lower than the average of the estimates in the literature. In the pessimistic scenario, a 20% increase in utilization is used, slightly lower than the 30% increase shown by Morgan Stanley Research ( 4 ). For the optimistic scenario, it is assumed that DL trucks will double utilization, as suggested by Viscelli (11).
For the base and pessimistic scenarios, it is assumed that the ownership period is determined by the total distance driven by the truck. Therefore, the ownership period is shortened for DL trucks proportionally to the increase in truck utilization. In the optimistic scenario, it is assumed that the ownership period is unchanged between MD and DL trucks.
Truck Acquisition Costs
The design requirements of DL trucks will differ from those of MD trucks. Driver’s cabins are one of the most complex components to produce, typically accounting for roughly one-third of truck costs ( 19 ). Without a driver, the need for safety features is minimal, making roll cages, air bags, and so forth unnecessary ( 1 ). Thus, removing the driver’s cabin would reduce truck design and manufacturing costs ( 22 ).
The technology for driving automation will add costs and, ceteris paribus, increase the truck cost. How costly driving automation systems will be when the technology is mature is uncertain. Wadud ( 14 ) uses the range $16,685–$26,696 as a realistic range for driving automation costs for a 38-ton DL truck in 2020. This represents a 20%–32% increase of the truck cost. Roland Berger ( 13 ) estimates technology costs for Level 5 DL trucks to $23,400.
For the base scenario the acquisition cost is assumed as unchanged, whereas for the pessimistic scenario a 25% cost increase is assumed and in the optimistic scenario a 25% cost decrease is assumed.
Driver and Remote Operations Costs
In Europe and the United States, driver costs constitute 35%–45% of MD truck costs ( 3 , 5 ). Automating the driving task does not eliminate all driver costs. Drivers typically handle other tasks such as loading/unloading, inspection, route planning, documentation, and so forth ( 4 , 23 ). Such tasks need to be automated/digitalized or carried out by other personnel ( 27 ). Therefore, the driver cost is added to the node cost time component for DL trucks in all scenarios.
It is likely that remote operations will be required for DL trucks during a transition period, but potentially also permanently ( 5 , 11 , 16 ). The literature does not present cost estimates, but remote operations may be costly because costs for new technology, communication networks, and skilled operators are required ( 5 ). It has been suggested by the industry that one operator per 10–30 trucks might be realistic given current technologies ( 7 , 22 ).
As DL trucks do not have a driver on-board, the driver cost is eliminated in all scenarios. It is assumed that DL trucks require remote operations, although to a varying extent between the scenarios. The hourly cost for remote operations is assumed to be twice the cost of a driver-hour because it needs to include costs for remote operations technology, communication, and network infrastructure. Also, remote operators are assumed to require longer training and thus higher wages than truck drivers. For the base scenario, it is assumed that one remote operator handles 20 trucks on average. For the pessimistic scenario, one operator is assumed to handle 5 trucks on average. For the optimistic scenario, it is assumed that one remote operator handles 40 trucks on average, assuming Level 5 trucks only require sporadic remote monitoring.
Fuel Costs
Potential DL truck fuel-saving mechanisms occur both at a vehicle level (e.g., fuel-efficient driving) and at a network level (e.g., platooning) ( 14 ).
Driving automation systems are expected to drive more fuel efficient than human drivers. Such fuel savings reported in the literature range between 15%–30% ( 1 ), 0%–20% ( 14 ), and 4%–10% ( 5 ). Gray literature provides estimates within the same range ( 13 , 28 , 29 ).
Typical estimates of fuel savings during platooning are in the range of 10%–15% ( 1 , 23 , 28 , 29 ). However, to realize cost savings, platoons need to be formed that require a certain density of platooning-enabled trucks in time and space. The upper bound for average fuel savings when considering platoon formation in the United States is estimated to be 4% ( 30 ).
It is speculated that the lower time-dependent costs could lead to DL trucks driving much slower than the speed limits to save fuel ( 2 ). DL trucks could be redesigned to be lighter and more aerodynamic without a driver’s cabin ( 1 ), and less focus on vehicle performance could further reduce weight ( 14 ). Also, eco-routing might be more feasible for DL trucks ( 14 ).
Driving automation systems consume energy for computation and data transfer and by added weight and increased drag. For DL cars, the increase in energy consumption is estimated at around 4% for an automation system with few sensors and minor aerodynamic alteration of the vehicle, and up to 19% when a larger automation system is used ( 31 ). However, the relative increase in energy use is smaller for trucks than for cars owing to higher total energy usage.
The many potential mechanisms for DL truck fuel consumption impacts make it difficult to estimate net effects. For the base scenario, it is assumed that eco-driving has a significant effect enabling a 10% reduction of fuel consumption. In the pessimistic scenario, eco-driving benefits are small and fully offset by added energy consumption from driving automation systems. In the optimistic scenario, eco-driving, lighter truck designs, and network level effects, such as high platooning rates, are achieved and driving automation systems consume little energy yielding a net decrease of 20%.
Insurance Costs
The potential to improve road safety is a key promise of driving automation ( 32 ). A reduced accident likelihood for DL trucks may decrease insurance costs ( 5 ) and litigation and legal costs. On the other hand, cyber security threats pose new challenges that might increase costs ( 2 ). Wadud ( 14 ) reasons that higher truck costs could offset safety benefits, keeping insurance costs unchanged. For passenger vehicles, it has been reasoned that insurance costs can be reduced around 50% for DL vehicles ( 33 ). Another relevant factor is related to the risk of theft or vandalism of cargo. For some type of cargo, truck drivers often keep the goods under surveillance, and this function needs to be managed in other ways for DL truck if not to increase the risk of theft ( 2 ). However, if truck utilization increases, standstill and opportunities for theft and vandalism may be reduced.
For the base scenario, it is assumed that there is a decrease in insurance cost of 10% as safety benefits are more significant than cyber security issues. In the pessimistic scenario the increased acquisition cost offset the benefits to a net zero change, whereas in the optimistic scenario costs are reduced by 20%.
Maintenance Costs
Maintenance costs typically constitute a small portion of the TCO for trucks but is important for the operating economy as maintenance is linked to truck profitability ( 34 ). It is speculated that smoother driving for DL trucks might reduce maintenance needs, but also that the new, complex technology might increase maintenance costs ( 14 ). Bösch et al. ( 33 ) reason the same way for passenger vehicles and assume maintenance costs for passenger vehicles to be unchanged in relation to MD vehicles. Also, if the average accident rate for DL trucks decrease relative to MD trucks, so does vehicle repair costs as fewer accidents occur ( 1 ).
It is likely that driving automation will affect maintenance costs, although the uncertainties on the net effect are large and there is little guidance in the literature. In the base scenario, a net zero effect on maintenance costs per kilometer is assumed based on reduced accident rates being offset by new costs for driving automation technology maintenance. A 20% increase in costs for the pessimistic scenario and a 20% decrease in costs for the optimistic scenario are assumed.
Tires and Tax Costs
There are no clear indications in the literature on how costs for tires or tax might be influenced by driving automation. Because of the uncertainties and lack of guidance in the literature it is assumed that tire costs per kilometer and annual tax costs are unchanged for all scenarios.
Other Costs
Truck cleaning is the most significant component and may increase proportionally to truck utilization. With higher utilization rates, trucks are likely parked for a shorter amount of time, which for fleets could mean a reduction in total garage costs. The need for cell phones for drivers is not relevant for DL trucks. These factors are not addressed in the literature.
The assumption for the base scenario is that annual other costs are unchanged; in the pessimistic scenario there is a 20% cost increase and in the optimistic scenario a 20% reduction.
Results
In this section, the results of the cost calculation for the four DL truck types in the three scenarios are presented.
Changes in Truck Operations Costs
In the base scenario, there are significant cost savings for DL trucks compared with the MD truck baseline, as shown in Figure 2. The cost decrease per 1,000 tkm is $292 for the 16-ton truck, $128 for the 24-ton truck, $58 for the 40-ton truck, and $37 for the 60-ton truck. Expressed as change in costs for DL trucks to operate the same number of ton-kilometers as an MD truck does during in 1 year, the annual savings are $56,691 for 16-ton trucks, $57,380 for 24-ton trucks, $100,861 for 40-ton trucks, and $109,024 for 60-ton trucks.

Costs per 1,000 tkm for the MD truck baseline.

Breakdown of costs per 1,000 tkm for MD trucks and DL trucks in the base scenario.
Figure 3 presents the costs for the different scenarios in relation to the MD truck baseline. In the pessimistic scenario, the costs are 24%–39% higher than in the base scenario. In the optimistic scenario, the costs are 20%–25% lower than in the base scenario. Although the costs for DL truck operations vary between the scenarios, all scenarios result in significant cost savings compared with the MD truck baseline. This indicates that even if the magnitude of cost savings for DL trucks is uncertain, it is most likely that DL trucks will enable a net decrease in costs compared with the MD truck baseline.
Costs per 1,000 tkm for the different scenarios.
Figure 4 presents a breakdown of the change of costs for the 40-ton DL truck compared with the MD truck baseline for the scenarios. The pattern is very similar for the other truck types. The cost savings are mainly driven by the reduction of driver costs. The minor reduction in node costs in the base and optimistic scenario is a result of the decreased (non-driver related) time-dependent costs for DL trucks that affect the node cost. The new cost component for remote operations is the dominant cost increase and is particularly significant in the pessimistic scenario. The increased acquisition costs in the pessimistic scenario lead to increased depreciation and capital costs. However, the benefits of the reduced driver costs by far outweigh the added costs for driving automation technology and remote operations. An estimation of the payback time for the added cost of driving automation technology in the pessimistic scenario (i.e., the 25% increase in truck acquisition cost; see Table 2) indicates that the payback time is roughly 9 months for 16-ton trucks, 17 months for 24-ton trucks, and 16 months for 40-ton and 60-ton trucks.
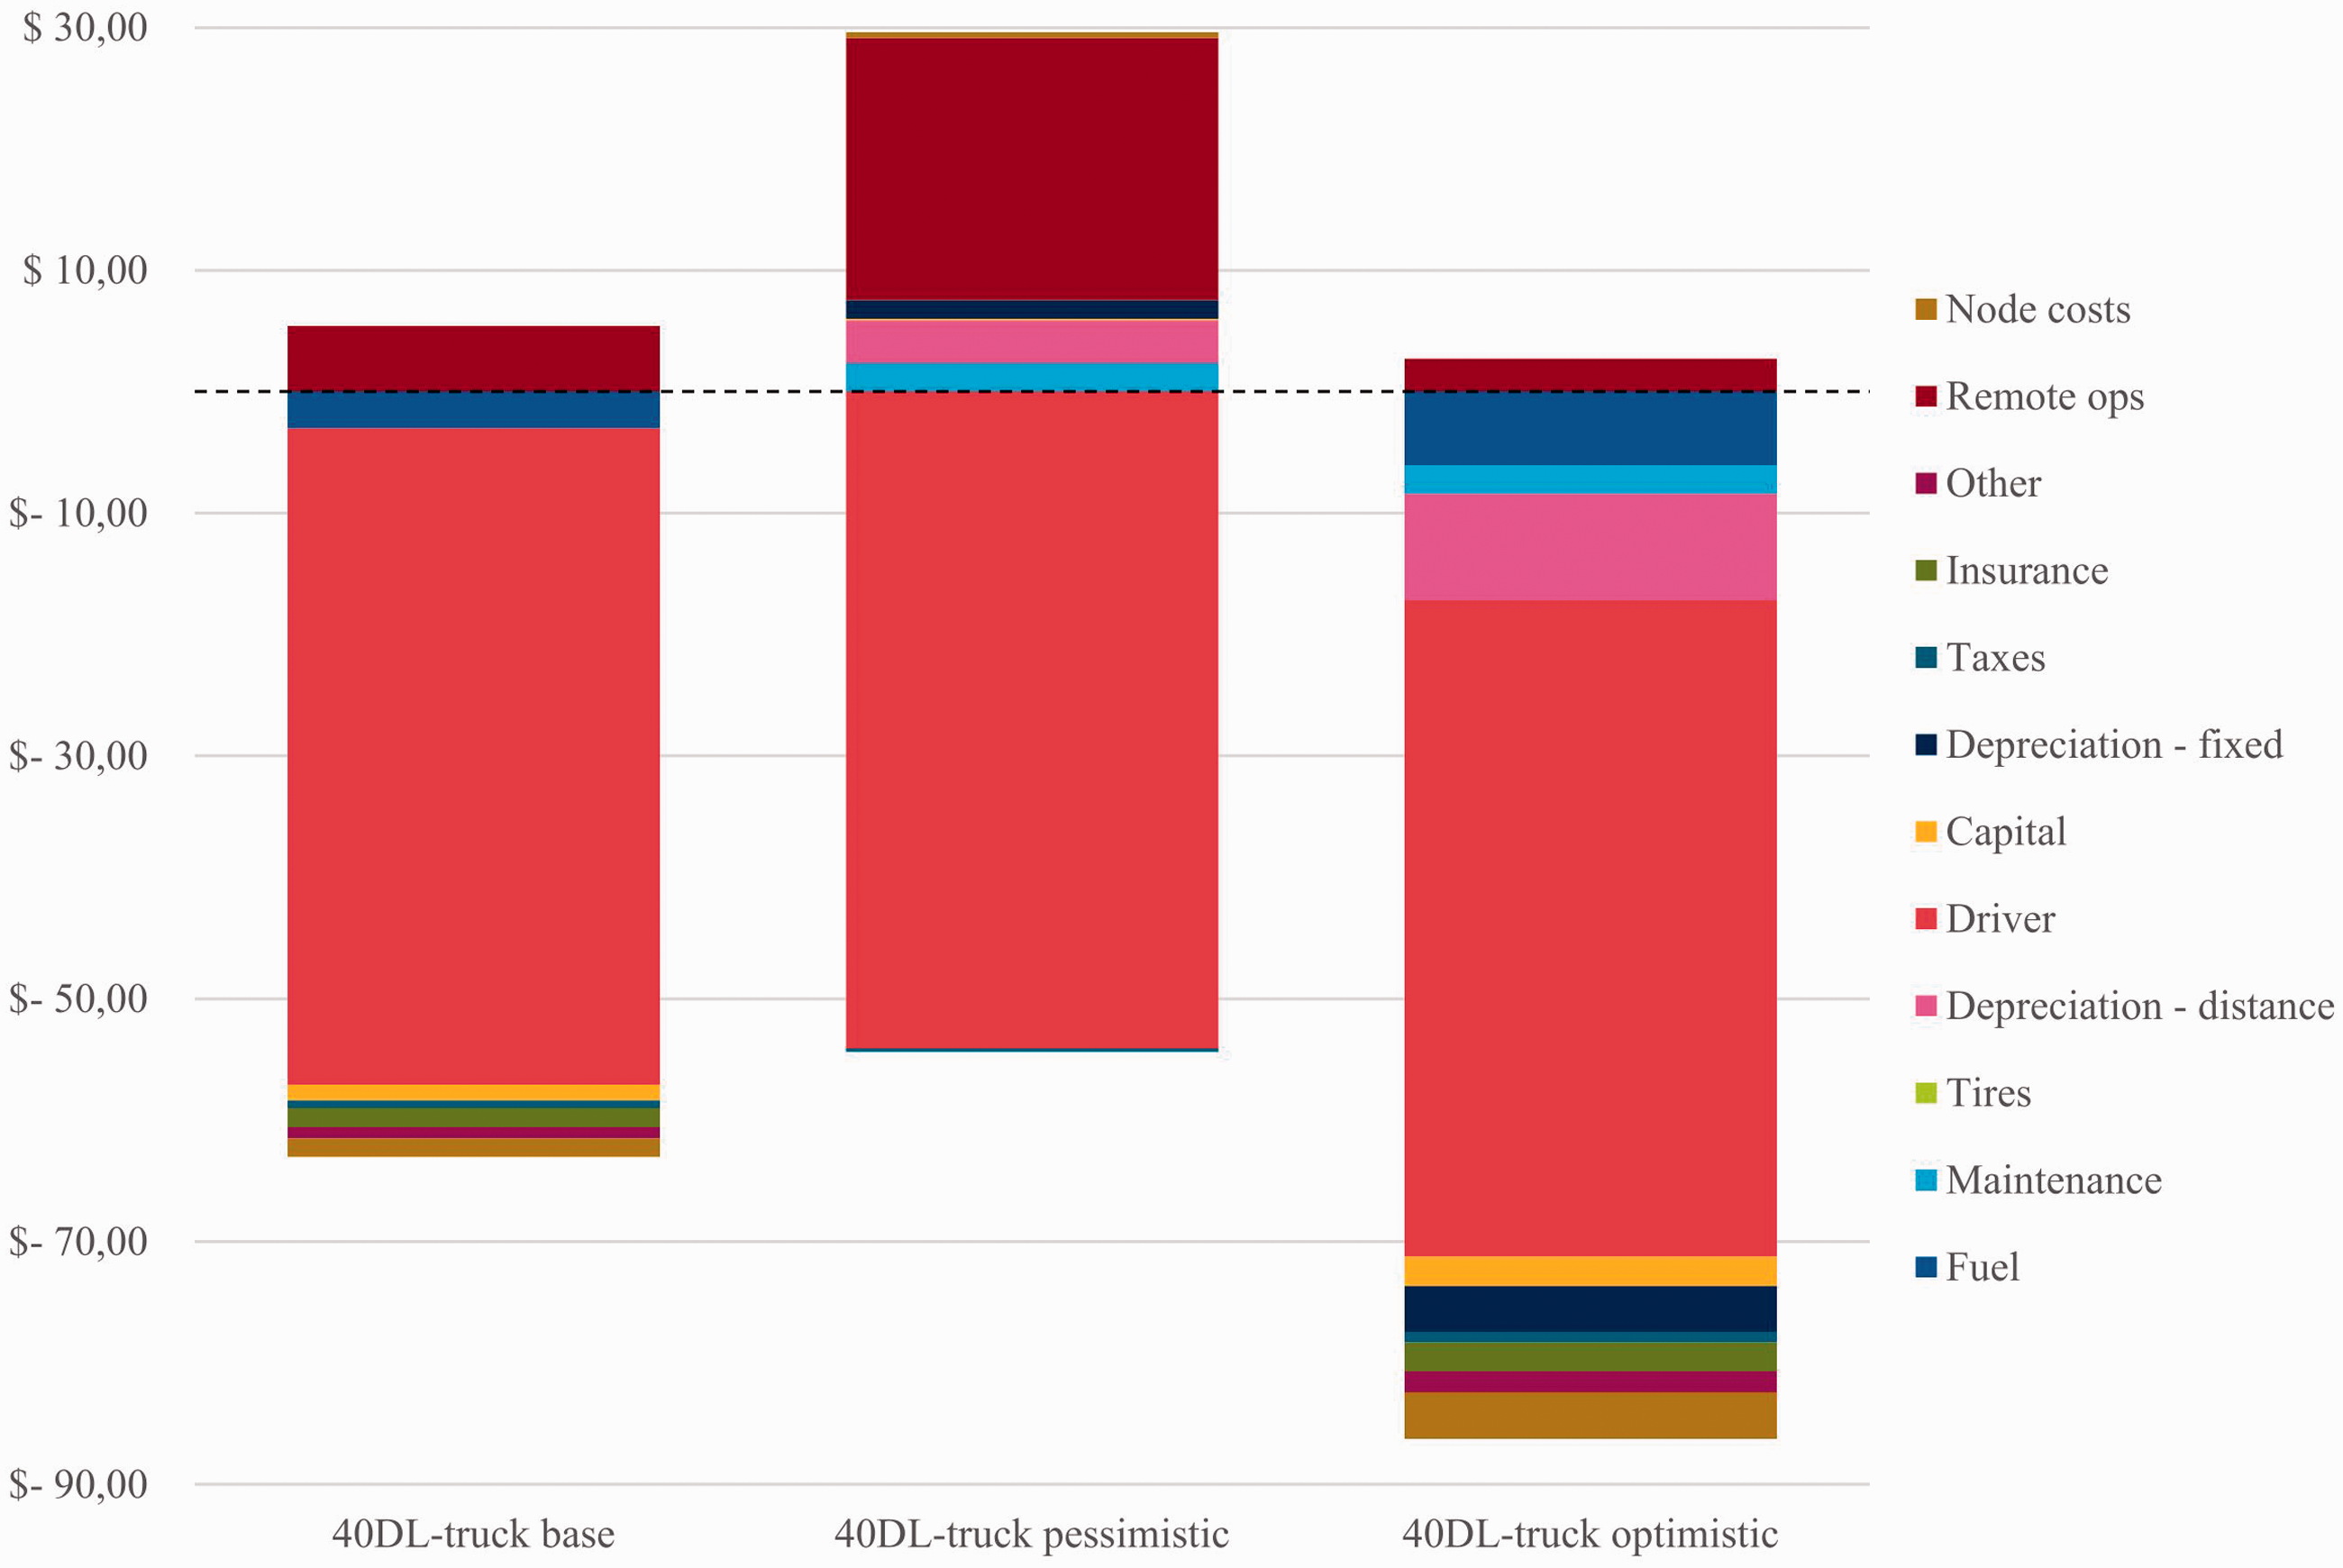
Breakdown of the cost changes for the 40-ton truck in the three scenarios.
Cost Structures
Driving automation has significant impacts on the cost structure of truck operations. In Figure 5, the cost structures for the MD truck baseline and the scenarios are illustrated. As driver costs are eliminated, other transport cost components constitute larger shares of the total costs for DL trucks. The new cost for remote operations constitutes around 5% of the total costs for DL trucks in the base scenario. However, the uncertainties around the costs for remote operations are significant and the more costly remote operations in the pessimistic scenario constitute more than 15% of the total costs. For DL trucks, fuel costs become an even more important cost component than for MD trucks, especially for larger truck types. Also, the relative importance of depreciation costs and capital costs is increased for DL trucks.
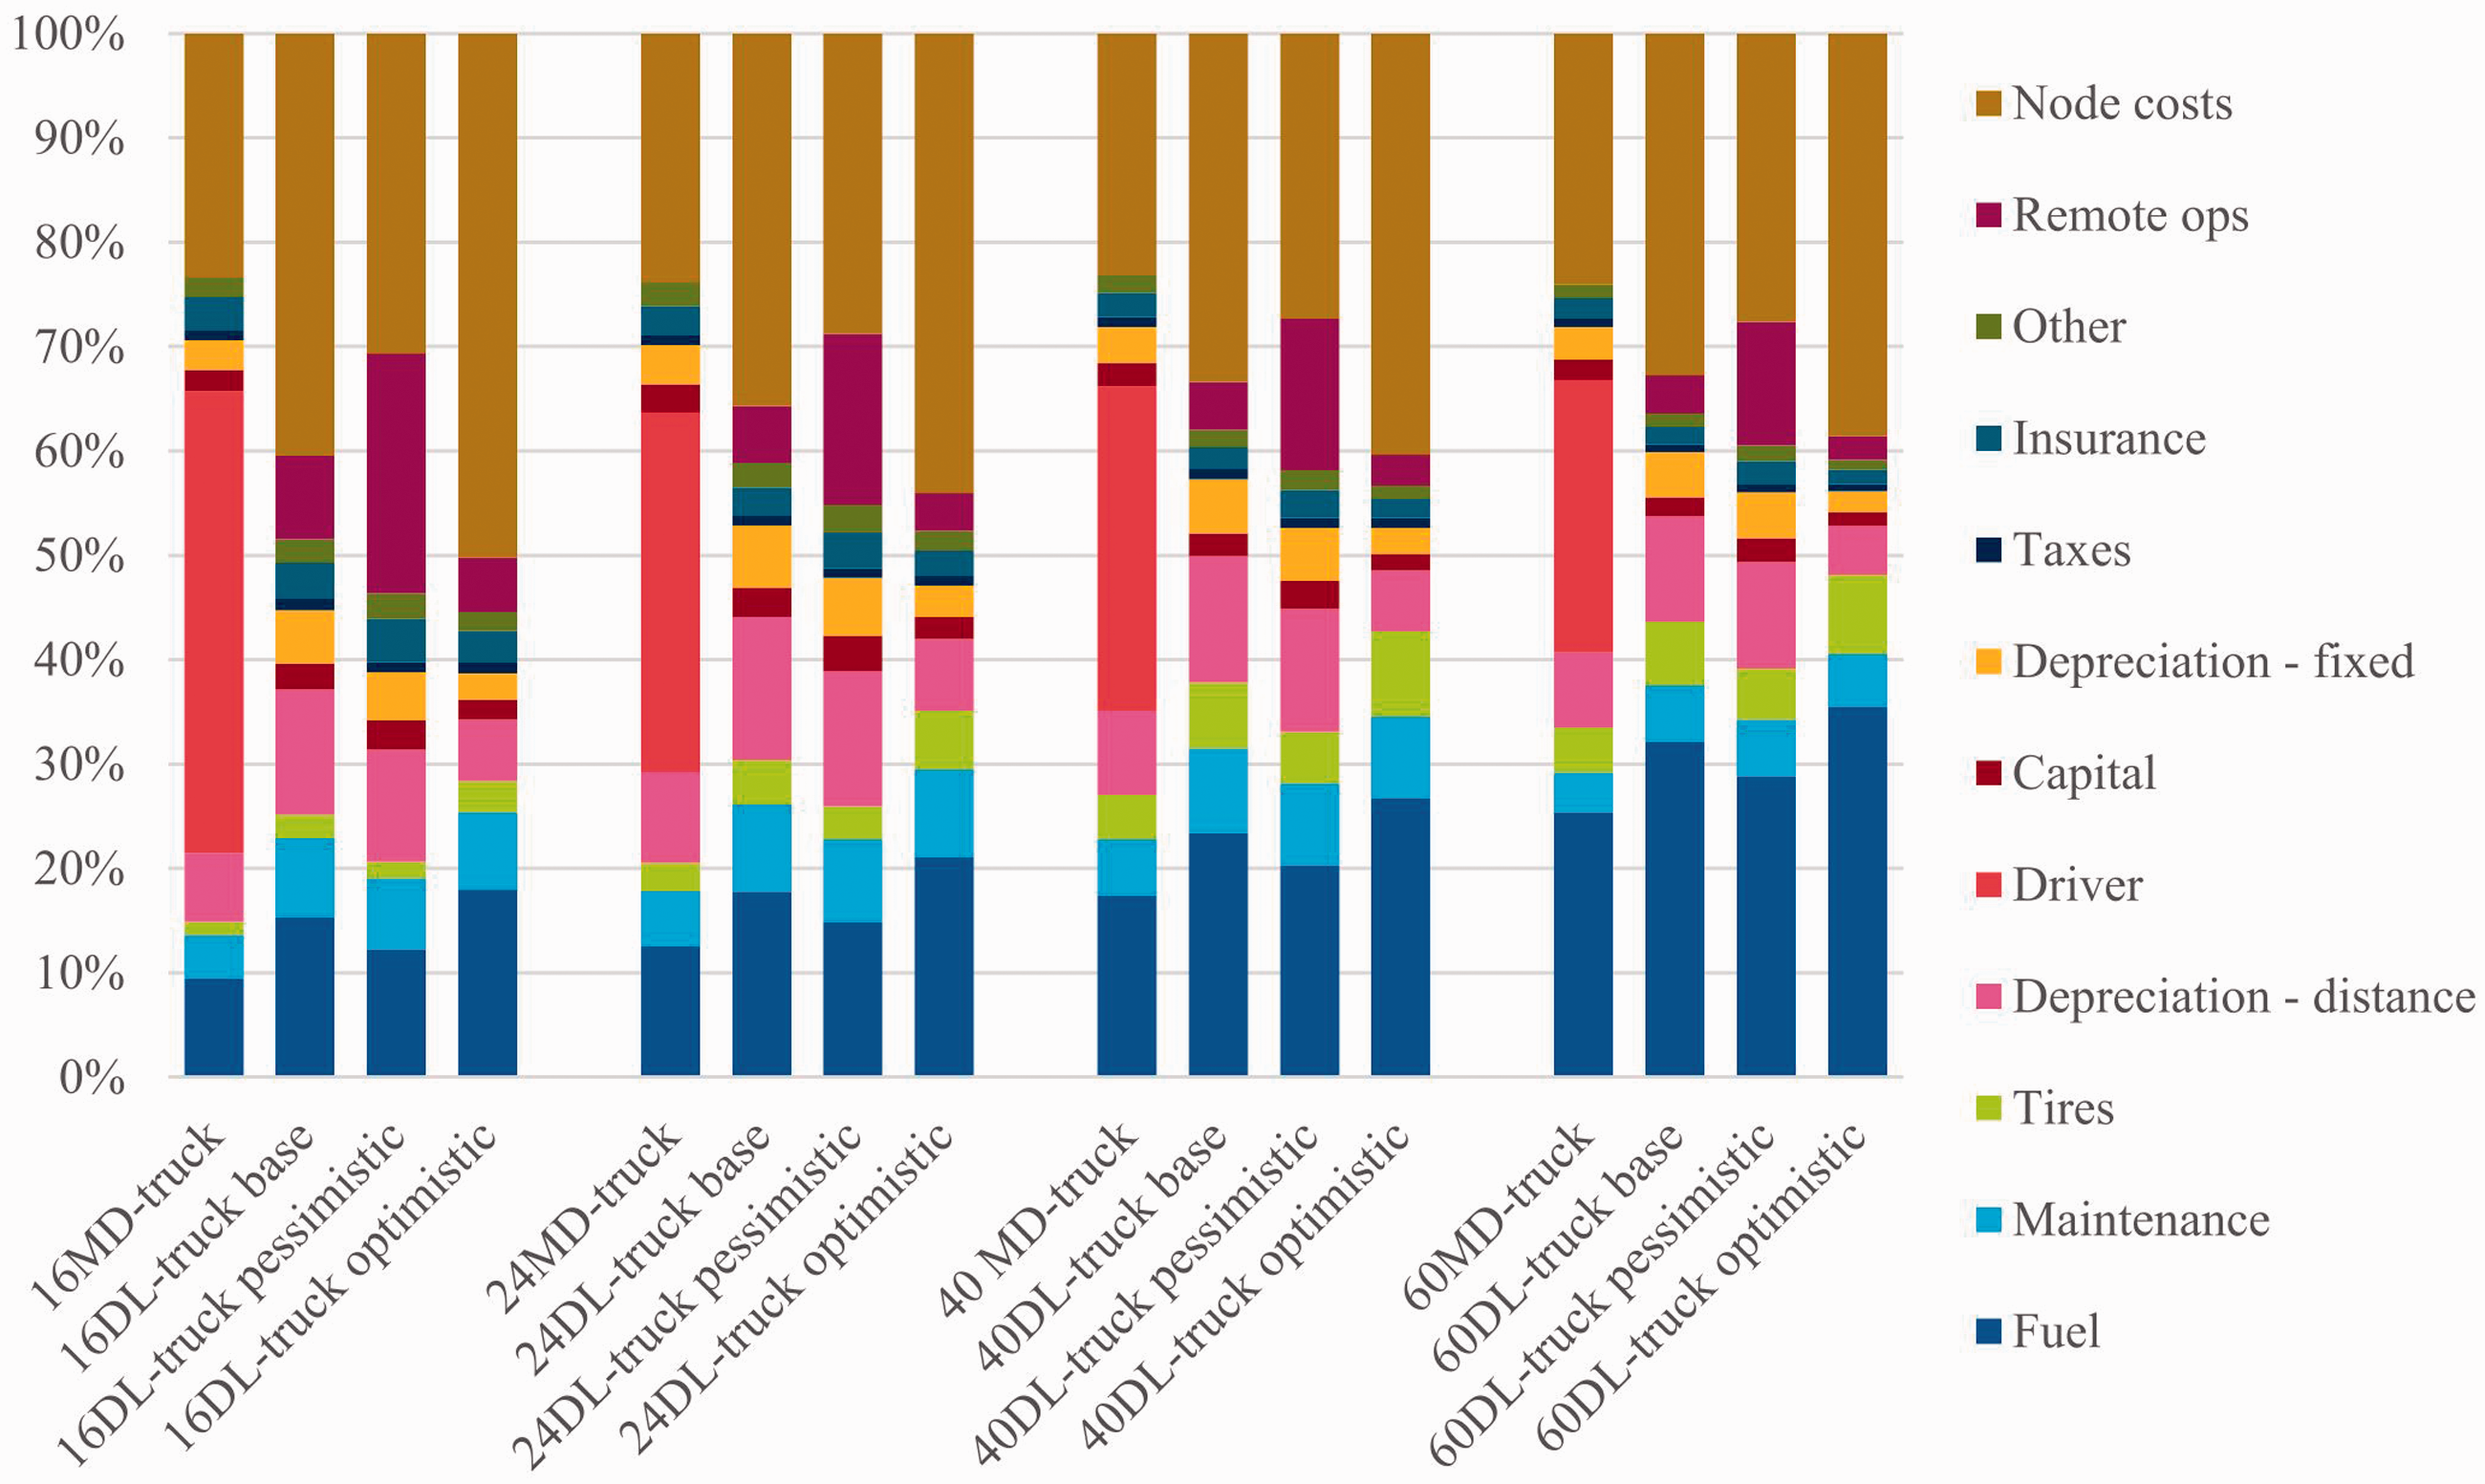
Cost structures for the MD truck baseline and DL trucks in the scenarios.
One distinct effect is that node costs become more significant and the dominating cost component for DL trucks. Assuming that loading times are constant for MD trucks and DL trucks, the share of operating time in node (see Table 1) remains unchanged between the MD baseline and DL truck scenarios. As the economic benefits of driving automation mainly affect transport costs, the node costs remain at similar absolute levels and, thus, become relatively more important with increasing benefits from driving automation. In the base scenario, node costs constitute around 30%–40% of total costs for DL trucks whereas they constitute roughly 25% of total costs for MD trucks.
Discussion
Major Change in Cost Structure of Truck Operations
Node costs, remote operations, and fuel costs will all become more important when driver costs are reduced by driving automation. Node costs constitute a higher share of the total costs for DL trucks than for MD trucks. To further increase the cost performance of DL trucks, focus should be on improving loading/unloading and other logistical processes. Since DL trucks may be deployed under new operational models requiring additional vehicle transfers ( 11 ), node costs for DL trucks could increase also in absolute terms. One case is when Level 4 DL trucks operate only on highways. To provide end-to-end transport, the goods may first be transported with an MD truck to some sort of transfer point near the highway on/off-ramp where the goods is loaded on a DL truck ( 11 ). However, the development of DL trucks may go hand-in-hand with automation of logistics operations in terminals, making loadings/unloadings in general more efficient and less costly ( 19 ).
The potential use of remote operations for DL trucks is uncertain about purposes and to what extent it will be used. Remote operations could be used only for fleet management, backup driving, and remote driving to expand the operational domain for Level 4 DL trucks ( 16 ). This makes the uncertainties about costs for remote operations high. There are examples of ongoing projects with early-stage DL trucks operating on public roads with remote driving support ( 7 ), but it is not clear to what extent remote driving support will be required for Level 4 DL trucks once technology maturity is reached.
One implication of the relative increase of fuel costs for DL trucks is that it indicates that DL battery electric trucks may be attractive since the fuel/energy costs will be reduced ( 35 ). Thus, the combination of electrified and DL trucks targets two major transport cost components of MD truck operations: driver and fuel costs.
Potential System-Level and Infrastructure Implications
The economic potential for DL trucks is clear, but, as the literature stress, before widespread DL truck implementation is feasible, many challenges need to be solved ( 2 ). Some challenges require minor alterations of operations and practices (e.g., “Who should unload the vehicle when there is no driver?”) whereas others are critical issues that may hinder any implementation beyond pilots (e.g., adjusting legislation and ensuring technology maturity). Furthermore, the actor dynamic of the road freight transport system might be significantly affected as many critical capabilities for actors differ between MD and DL truck operations ( 22 ).
The improved cost competitiveness of road transport compared with other modes may result in mode shifts to road transport. A 40% cost saving in road freight operations because of DL trucks could result in a 20%–45% shift of rail freight transport volumes to road in the United States ( 10 ). Increasing the attractiveness of fossil fuel-based road freight transport is not desirable from a sustainability perspective. As an example, the total road transport CO2 emissions in Sweden increased slightly during 2018 as a result of growing heavy truck traffic volumes despite net emission reductions for other vehicle types ( 36 ). An increase in attractiveness of road freight transport of the magnitude that DL trucks enables thus requires to be accompanied with fossil-free fuels and associated policies if transport climate targets should remain within reach. There is a need for more research to better understand the implications on road freight transport demand and the associated negative externalities resulting from DL trucks.
The need for potential infrastructure investments for DL trucks and other DL vehicles is uncertain. For remote operations and other vehicle-to-vehicle and vehicle-to-infrastructure functions, high performance cellular networks (e.g., 5G) may be required ( 37 ). However, it is not clear to what extent 5G investments, and thus the cost mass that needs to be covered, need to be done specifically to facilitate driving automation functionality in addition to 5G network development for other applications. The potential cost reductions of driving automation for truck operators, and ultimately transport buyers, are significant and more substantial than other societal benefits ( 37 ). This suggests that a large-scale introduction of DL trucks may leave room for user-financed DL truck infrastructure.
Comparison with Previous Studies
To the authors’ knowledge, there is only one directly comparable publication, Wadud ( 14 ), in which the estimated cost savings for an 18-ton DL truck is estimated to be 19.5% and the cost savings for a 38-ton DL truck is estimated to be 15% in the United Kingdom. This is in line with the cost savings of the pessimistic scenario (see Figure 3). In the base and optimistic scenarios, the savings are higher. The variations in results may be explained by the different markets and truck types assessed, slight differences in assumptions, or that Wadud ( 14 ) does not consider increased productivity for DL trucks, the potential to reduce acquisition costs by removing driver-related features, and does not explicitly model remote operations or node costs, instead keeping 40% of the driver costs to compensate for the need of human labor. Estimated cost savings in gray literature is in line with the optimistic scenario. For instance, Chottani et al. ( 15 ) and Nowak et al. ( 19 ) claim that DL trucks may reduce costs of truck transport by around 45%.
Conclusions
The costs of operating DL trucks compared with MD trucks have been analyzed for four different truck types and three scenarios representing pessimistic, intermediate, and optimistic assumptions on economic impacts of driving automation based on the current literature.
The results indicate that DL trucks may enable substantial cost savings compared with the MD truck baseline. In the base scenario, the total costs decrease by 45%, 37%, 33%, and 29% for 16-, 24-, 40-, and 60-ton trucks, respectively. In the pessimistic scenario the DL truck costs are 12%–23% lower than the MD truck baseline, and in the optimistic scenario they are 43%–58% lower.
DL trucks have different cost structures from MD trucks. Remote operations may become an important cost (∼15% of total costs in the pessimistic scenario) and is a topic that is almost unexplored in academic research. The cost share of node costs and fuel costs increases for DL trucks compared with MD trucks. This indicates that in a DL future, advancements in automation and digitalization for more efficient logistics will remain important. New technologies that decrease fuel/energy-related costs, such as electrification, combined with driving automation bear a strong potential to even further decrease truck operation costs.
Although the direct economic impacts of driving automation will reduce transport costs, it may also increase road freight transport volumes and associated negative externalities. This is problematic from a climate perspective and requires more analysis and research.
Finally, the findings presented in this paper confirm the established view in the literature that road freight transport is a highly attractive area for driving automation owing to the potential for substantial economic benefits. The cost estimates provided in this paper may serve as input to future research on the impacts of DL trucks on the transport system.
Footnotes
Acknowledgments
The authors thank Magnus Johansson at the Swedish National Road and Transport Research Institute (VTI) for providing feedback on how to estimate average truck trip distances and the personnel at the Swedish government agency for transport policy analysis (Transport Analysis) for help to access truck trip data.
Author Contributions
The authors confirm contribution to the paper as follows: study conception and design: A. Engholm, A. Pernestål, I. Kristoffersson; data collection: A. Engholm; analysis and interpretation of results: A. Engholm, A. Pernestål, I. Kristoffersson; draft manuscript preparation: A. Engholm, A. Pernestål, I. Kristoffersson. All authors reviewed the results and approved the final version of the manuscript.
Declaration of Conflicting Interests
The author(s) declared no potential conflicts of interest with respect to the research, authorship, and/or publication of this article.
Funding
The authors disclosed receipt of the following financial support for the research, authorship, and/or publication of this article: This work was supported by the Swedish Transport Administration (TRV 2017/22806).
Data Accessibility Statement
For the majority of data used in the article, data sharing is not applicable as the data are presented in the cited literature (see references) and from official statistics (see references). Other data are presented within the article.