
Abstract
Governments worldwide are aiming to increase sustainable mode use to increase sustainability, livability, and accessibility. Integration of bicycle and transit can increase catchment areas of transit compared with walking and thus provide better competition to non-sustainable modes. To achieve this, effective measures have to be designed that require a better understanding of the factors influencing access mode and station choice. At the national/regional level this has been thoroughly studied, but there is a knowledge gap at the urban level. This study aims to investigate which factors influence the joint decision for tram access mode and tram station choice. The joint investigation can identify trade-offs between the access and transit journeys. Furthermore, the effect of each factor on the bicycle catchment area is investigated. Using data from tram travelers in The Hague, Netherlands, a joint simultaneous discrete choice model is estimated. Generally, walking is preferred to cycling. The findings of this study suggest that access distance is one of the main factors for explaining the choice, where walking distance is weighted 2.1 times cycling distance. Frequent cyclists are more likely also to cycle to the tram station, whereas frequent tram users are less inclined to cycle. Bicycle parking facilities increase the cycling catchment area by 234 m. The transit journey time has the largest impact on the catchment area of cyclists. Improvements to the system, such as fewer stops, higher frequency (like light rail transit), or both, therefore would result in a much longer accepted cycling distance.
Governments worldwide are aiming to increase sustainable mode use, that is, transit, walking, and cycling ( 1 ). When trips with these modes replace car trips, they can reduce emissions and congestion and have a positive impact on health. Integration of bicycle and transit can increase catchment areas of transit compared with walking ( 2 , 3 ). The mass capacity of transit can be supplemented by the flexibility and efficient space-use of bicycles. This integration could provide better competition to the car and with that increase the sustainability, livability, and accessibility of urban areas. Effective measures, that improve the integration, need to be implemented to increase the use of the bicycle-transit combination. Two key questions arise when investigating the bicycle-transit combination: (i) which station do individuals use for entering the transit system? and (ii) when do they cycle to access the station? Understanding which factors influence the station and access mode choice in relation to the bicycle-transit combination can serve as valuable input for these measures.
Increasingly studies investigate these questions, where several classes of factors influencing the access mode, station choice, or both, are identified ( 4 , 5 ). Individual variables, such as age, gender, and income have been found to influence the access mode choice. Characteristics of the station, such as service quality, parking facilities, and geographical location, as well as characteristics of the access journey are found to influence both choice dimensions. Finally, characteristics of the transit journey have been found to influence station choice.
Most studies have investigated either access mode ( 6 – 9 ) or station choice ( 10 , 11 ). However, studying the combination of these choice dimensions could shed light on important trade-offs that cannot be captured otherwise. Several studies have investigated this combination ( 12 – 17 ), where a variety of access modes has been investigated, such as walking, cycling, transit, and car (driver or passenger). These studies all cover train stations, which is a transit mode generally used at the regional/national level. At the urban level, the combination has not yet been studied, even though the modal share of the bicycle is known to be lower ( 18 , 19 ). Furthermore, the access distance of the bicycle to the train is found to be significantly higher than to urban transit systems ( 19 , 20 ). Therefore, the question rises which factors influence the combined choice at the urban level and how does this differ from the national/regional level.
The objective of this study is to identify the factors influencing access mode and station choice at the urban level. By accommodating both choice dimensions, the trade-offs between the access and transit journey can be investigated. Travel behavior data was collected in the city of The Hague, Netherlands, one of the major cities in the country, which is characterized by a fairly dense tram line network. Using discrete choice models, this study investigates which factors are relevant for the combined choice of access mode and tram station, accounting for socio-economic, station, tram journey, and access journey characteristics. In this study the destination is treated as given, to focus on the trade-offs between access journey and transit journey. The station choice set, that serves as input for the choice model, is defined for each individual, by first identifying all stations within a certain radius from their home and then applying elimination-by-aspects to reduce the choice set to the consideration choice set. The access mode choice set is limited to the most common access modes at the urban level in the Netherlands (i.e., walking and cycling) ( 21 ).
This study contributes to the state-of-the-art by investigating, for the first time, the joint access mode-transit station combination at the urban level. It presents trade-offs between access journey and transit journey for each access mode and discusses the willingness to cycle to a station further away. The results of this research provide insights into the behavior of transit passengers at the urban level, which may be used to design measures aiming to increase the use of bicycle as access mode to stations. Furthermore, this research provides input for planning and design of urban transit stops.
The remainder of the paper is organized as follows. The second section details the methodology for identifying the choice set and modeling the joint access mode and tram station choice. In the third section, the data collection and preparation is described. The results of the choice set generation and discrete choice models are reported and discussed in the fourth section. A final section concludes the paper.
Methodology
In line with previous studies ( 12 – 17 ), this study employs discrete choice models to investigate the joint access mode and tram station choice. First, the set of alternatives considered by individuals needs to be defined. Choice set identification is an important step, especially where the number of feasible options is considerable, as is the case with station alternatives in urban transit networks. The set of access modes for urban transit is limited (i.e., walking and cycling). In the choice set identification phase, the two choice dimensions are treated separately. The focus in this section is first on identifying the subset of access stations that are in individuals’ consideration sets. The approach toward modeling the joint access mode and station choice is then discussed.
Identifying the Tram Station Choice Set
Whenever the number of alternatives is large, it is hypothesized that individuals are likely to apply simple heuristic decision rules to form their consideration set first before performing a comprehensive evaluation to arrive at their final choice ( 22 ). Such rules are typically non-compensatory, wherein constraints are applied on individual attributes of alternatives rather than accounting for trade-offs between attributes. Common non-compensatory decision models include disjunctive/conjunctive, lexicographic, and elimination-by-aspects (EBA).
Previous studies on modeling choice of access station have typically applied choice set identification methods that fall under one of the following three categories ( 5 ): (i) consider the n closest stations to the origin as the choice set; (ii) fix a catchment radius for stations and thereby assign station alternatives to the choice set of a given origin; or (iii) consider the n stations most frequently selected by travelers from a given origin as that origin’s choice set. The first two categories are both essentially conjunctive decision rules that rely exclusively on access distance as the attribute forming the consideration set; that is, if the distance threshold criterion is met, the alternative is included in the consideration set. However, as argued by Debrezion et al. ( 12 ), distance to stations alone may not be appropriate for analysis of station choice. Furthermore, all of these methods strongly depend on the values of n or catchment radius selected by the researcher. The direct identification method proposed in the third category is also inherently unable to explain why certain alternatives were not considered in the dataset ( 23 ) and may suffer from endogeneity issues. Moreover, this method requires many observations per origin, which is typically not possible at the individual level and is thus usually applied at an aggregate level ( 5 ). Therefore, in this study we apply an EBA-based methodology that: (i) considers more attributes than just access distance and (ii) is calibrated from the data itself.
EBA models combine parts of the disjunctive/conjunctive and lexicographic models and use both attribute ranking and threshold specification. Starting with the most important attribute, all alternatives not satisfying its threshold are eliminated and this is repeated until all attributes are exhausted. Although originally proposed as a probabilistic model ( 24 ), most choice set generation applications apply EBA as a deterministic model ( 22 ). This study uses the calibration methodology proposed by Shelat et al. ( 23 ) (although slightly adjusted) to avoid having to assume behavioral parameters—that is, attribute ranking and thresholds—of the EBA model.
This study applies EBA such that the parameters remain constant over time and across different individuals, and the model does not require assumptions in relation to the choice set size. A threshold is estimated that identifies the maximum value of each attribute in the final choice set (
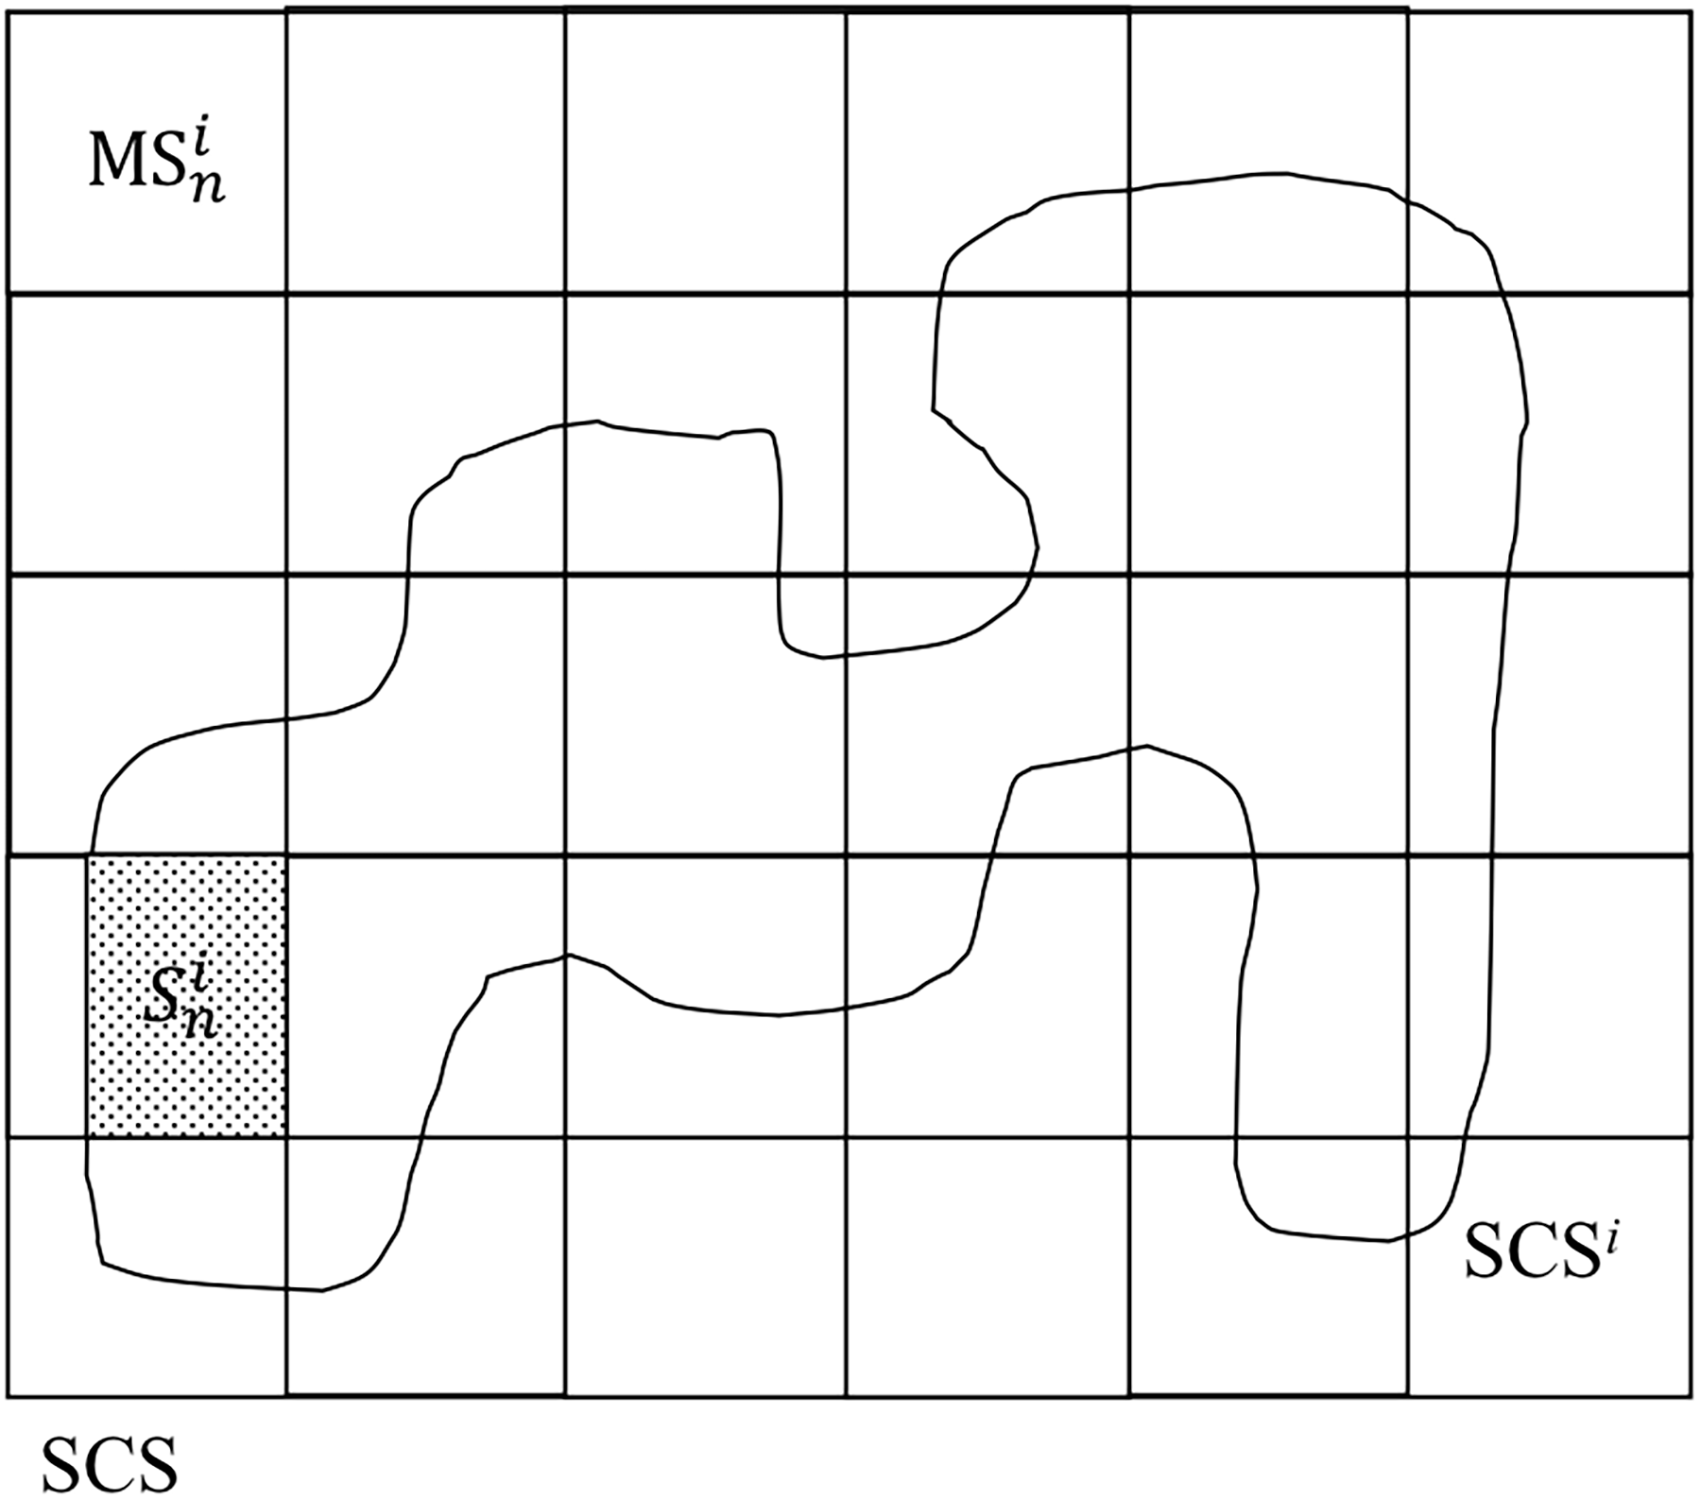
Visualization of the different choice sets.
Thus, to identify
Trip Attributes
For the choice set generation methodology, only network-dependent attributes (e.g., access distance, travel time) are considered. The assumption is that network-independent attributes such as trip purpose would not preclude a traveler from considering an alternative station. Instead, such attributes would play a role when finally choosing an access station from the consideration set. Attributes input to the EBA model can be from different parts of the journey, because are all likely to be important for station choice. The following attributes are used for choice set identification: (i) Euclidian access distance, and (ii) total transit travel time and (iii) number of transfers associated with the transit trip. While the above attributes are important for consideration set formation, there are likely to be other attributes that are relevant in the final evaluation. Therefore, alternatives dominated for these three attributes are not removed to avoid placing extra behavioral restrictions on the choice analysis.
For the transit trip attributes, the general transit feed specification (GTFS) data associated with the network is used to generate different routes between stations using the same procedure as in Shelat et al. ( 23 ). Individuals are allowed an egress trip of less than 200 m between the destination station of the main trip and the observed destination station. The best routes between each pair of stations are selected as those that perform best on the total transit time and number of transfers; the main trip attributes are obtained from these best routes.
EBA Calibration
Combining the
As mentioned above, the EBA calibration involves optimizing the balance between two indicators, (i) coverage—the proportion of observed choices in the SCS
i
, and (ii) efficiency—the proportion of unobserved but feasible alternatives excluded from the SCS
i
. When the SCS
i
is the same as the SCS, coverage is one while efficiency is zero. Depending on the data, the desired balance between these indicators may be different; this is controlled by the multiplier variable in the following indicator, which is minimized:

The calibration uses a straightforward brute force optimization algorithm that tries all possible attribute ranking permutations and attribute thresholds from a pre-defined search space (
23
). For each permutation, the first ranked (i.e., most important) attribute is selected, the threshold minimizing
Joint Choice Model Specification
The joint choice is modeled using discrete choice analysis. An alternative consists of an access mode and a station, given destination station


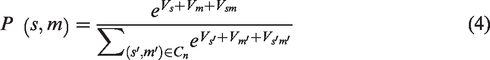
Each of the systematic utility components consists of observed characteristics related to (a combination of) the individual, aspects of the trip, and the tram station. The systematic utility function related to the access mode (


Data Collection and Preparation
The Hague is the third-largest city of the Netherlands. The modal split of trips within the municipality of The Hague is as follows: 36% car, 13% transit, 21% bicycle, and 30% walking ( 27 ). The municipality states that it is committed to a growth in the number of bicycle trips by 25% in 2030 and by 50% in 2040 (28). More space will be accommodated for the bicycle and better transfer options with transit are created, including bicycle facilities at stops ( 29 ). Furthermore, transit use is expected to increase further in the coming years. With the system running almost at its maximum capacity, other options to expand are being investigated. Increasing the capacity of transit will come at high costs, while better integration with cycling serves as a sustainable and (cost-)efficient alternative.
In this section, the data collection method and final sample are discussed. The tram station and access mode characteristics identified for the joint model are then presented.
Data Collection and Sample Characteristics
Data of the travel behavior of tram users is collected through a revealed preference survey, which was executed on-board trams in The Hague ( 2 ). Different tram lines were targeted to ensure varying spatial and population characteristics. Respondents were asked to fill out a questionnaire containing questions about their current journey from origin to destination (including first station, last station and transfer points), general use of tram and bicycle, and individual characteristics. The questionnaires were distributed in April 2018. During the data collection period no extreme weather, tram disruptions, or other major disturbances were encountered.
Nowadays, bicycles are available at both the home and the activity ends of a trip, with the increasing presence of shared bicycle systems. However, during the data collection period these systems were not yet available in The Hague, therefore we focus on the home end of the trip only, where the bicycle is considered available. The majority of the Dutch citizens own one or more bicycles, therefore this seems a valid assumption ( 30 ). A total of three filtering criteria were applied to the dataset of ( 2 ), being (i) the respondent has to live in The Hague region, (ii) the access mode used is walking or cycling, and (iii) the information provided at the home end needs to be reliable.
In total 353 usable responses were collected for this research, which was reduced to 307 respondents by applying the EBA methodology. The characteristics of the final sample are shown in Table 1, including the comparison with the total population of public transport travelers in The Hague region ( 31 ). The national survey, measuring travel satisfaction with public transport in the Netherlands, is considered to be representative. A sample of at least 1,000 travelers spread over 100 rides is measured yearly and leveled up in several steps to be representative. The distribution of the ages of the respondents is representative for tram travelers in The Hague, as is the distribution of trip purposes. In relation to the frequency of tram use, individuals who traveled on 4–7 days per week were overrepresented in the sample ( 21 ). Finally, the share of the population living outside The Hague (i.e., in Delft, Zoetermeer, or Rijswijk) was slightly overrepresented because of the tram lines that were targeted ( 2 ).
Characteristics of the Sample, Journeys Made, Access Modes Used, and Tram Stations
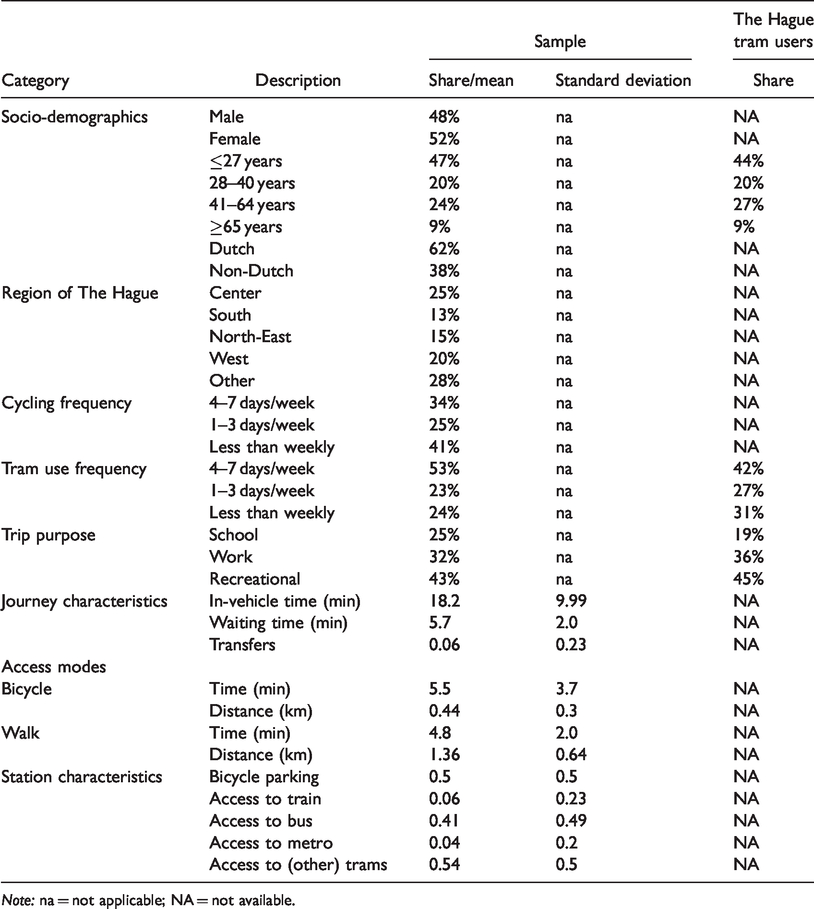
Note: na = not applicable; NA = not available.
Description of Explanatory Variables
The journey characteristics of all alternatives were extracted using GTFS data (see above). The in-vehicle time for the observed trips is on average 18.2 min (Table 1), with 5.7 min of waiting time and a very limited number of transfers (maximum one). A total of 91.2% of the individuals walked to the tram station, the other 8.8% cycled. This means that the number of cyclists in the sample is higher than the 5.8% in general ( 21 ). Using the Google Directions API, the travel time and distance from the home location to the chosen and alternative tram stations was calculated, which differs per mode. The average travel times to the chosen station are comparable for walking and cycling, the average distances are rather different. This confirms that the bicycle has a larger catchment area compared with walking ( 2 , 3 ).
The station characteristics comprise of the presence of bicycle parking and the different multimodal hubs (train/metro/bus/tram). Bicycle parking is present at half of the 254 tram stations. Half of the stations have bicycle parking facilities, usually bicycle hoops. A few stations are multimodal hubs, mostly bus/tram or tram/tram hubs (with other tram lines).
Results and Discussion
The results of the choice set generation are described in the following subsection. Access mode and station are considered separately in the choice set generation. Walking and cycling are considered available to each individual, whereas the EBA model is used to generate station choice sets. The merged choice sets are used in the model estimation. The results of the estimated models are then discussed in relation to the literature. In the third subsection, willingness to cycle to the tram station further away is investigated.
Generated Choice Sets
The threshold distance
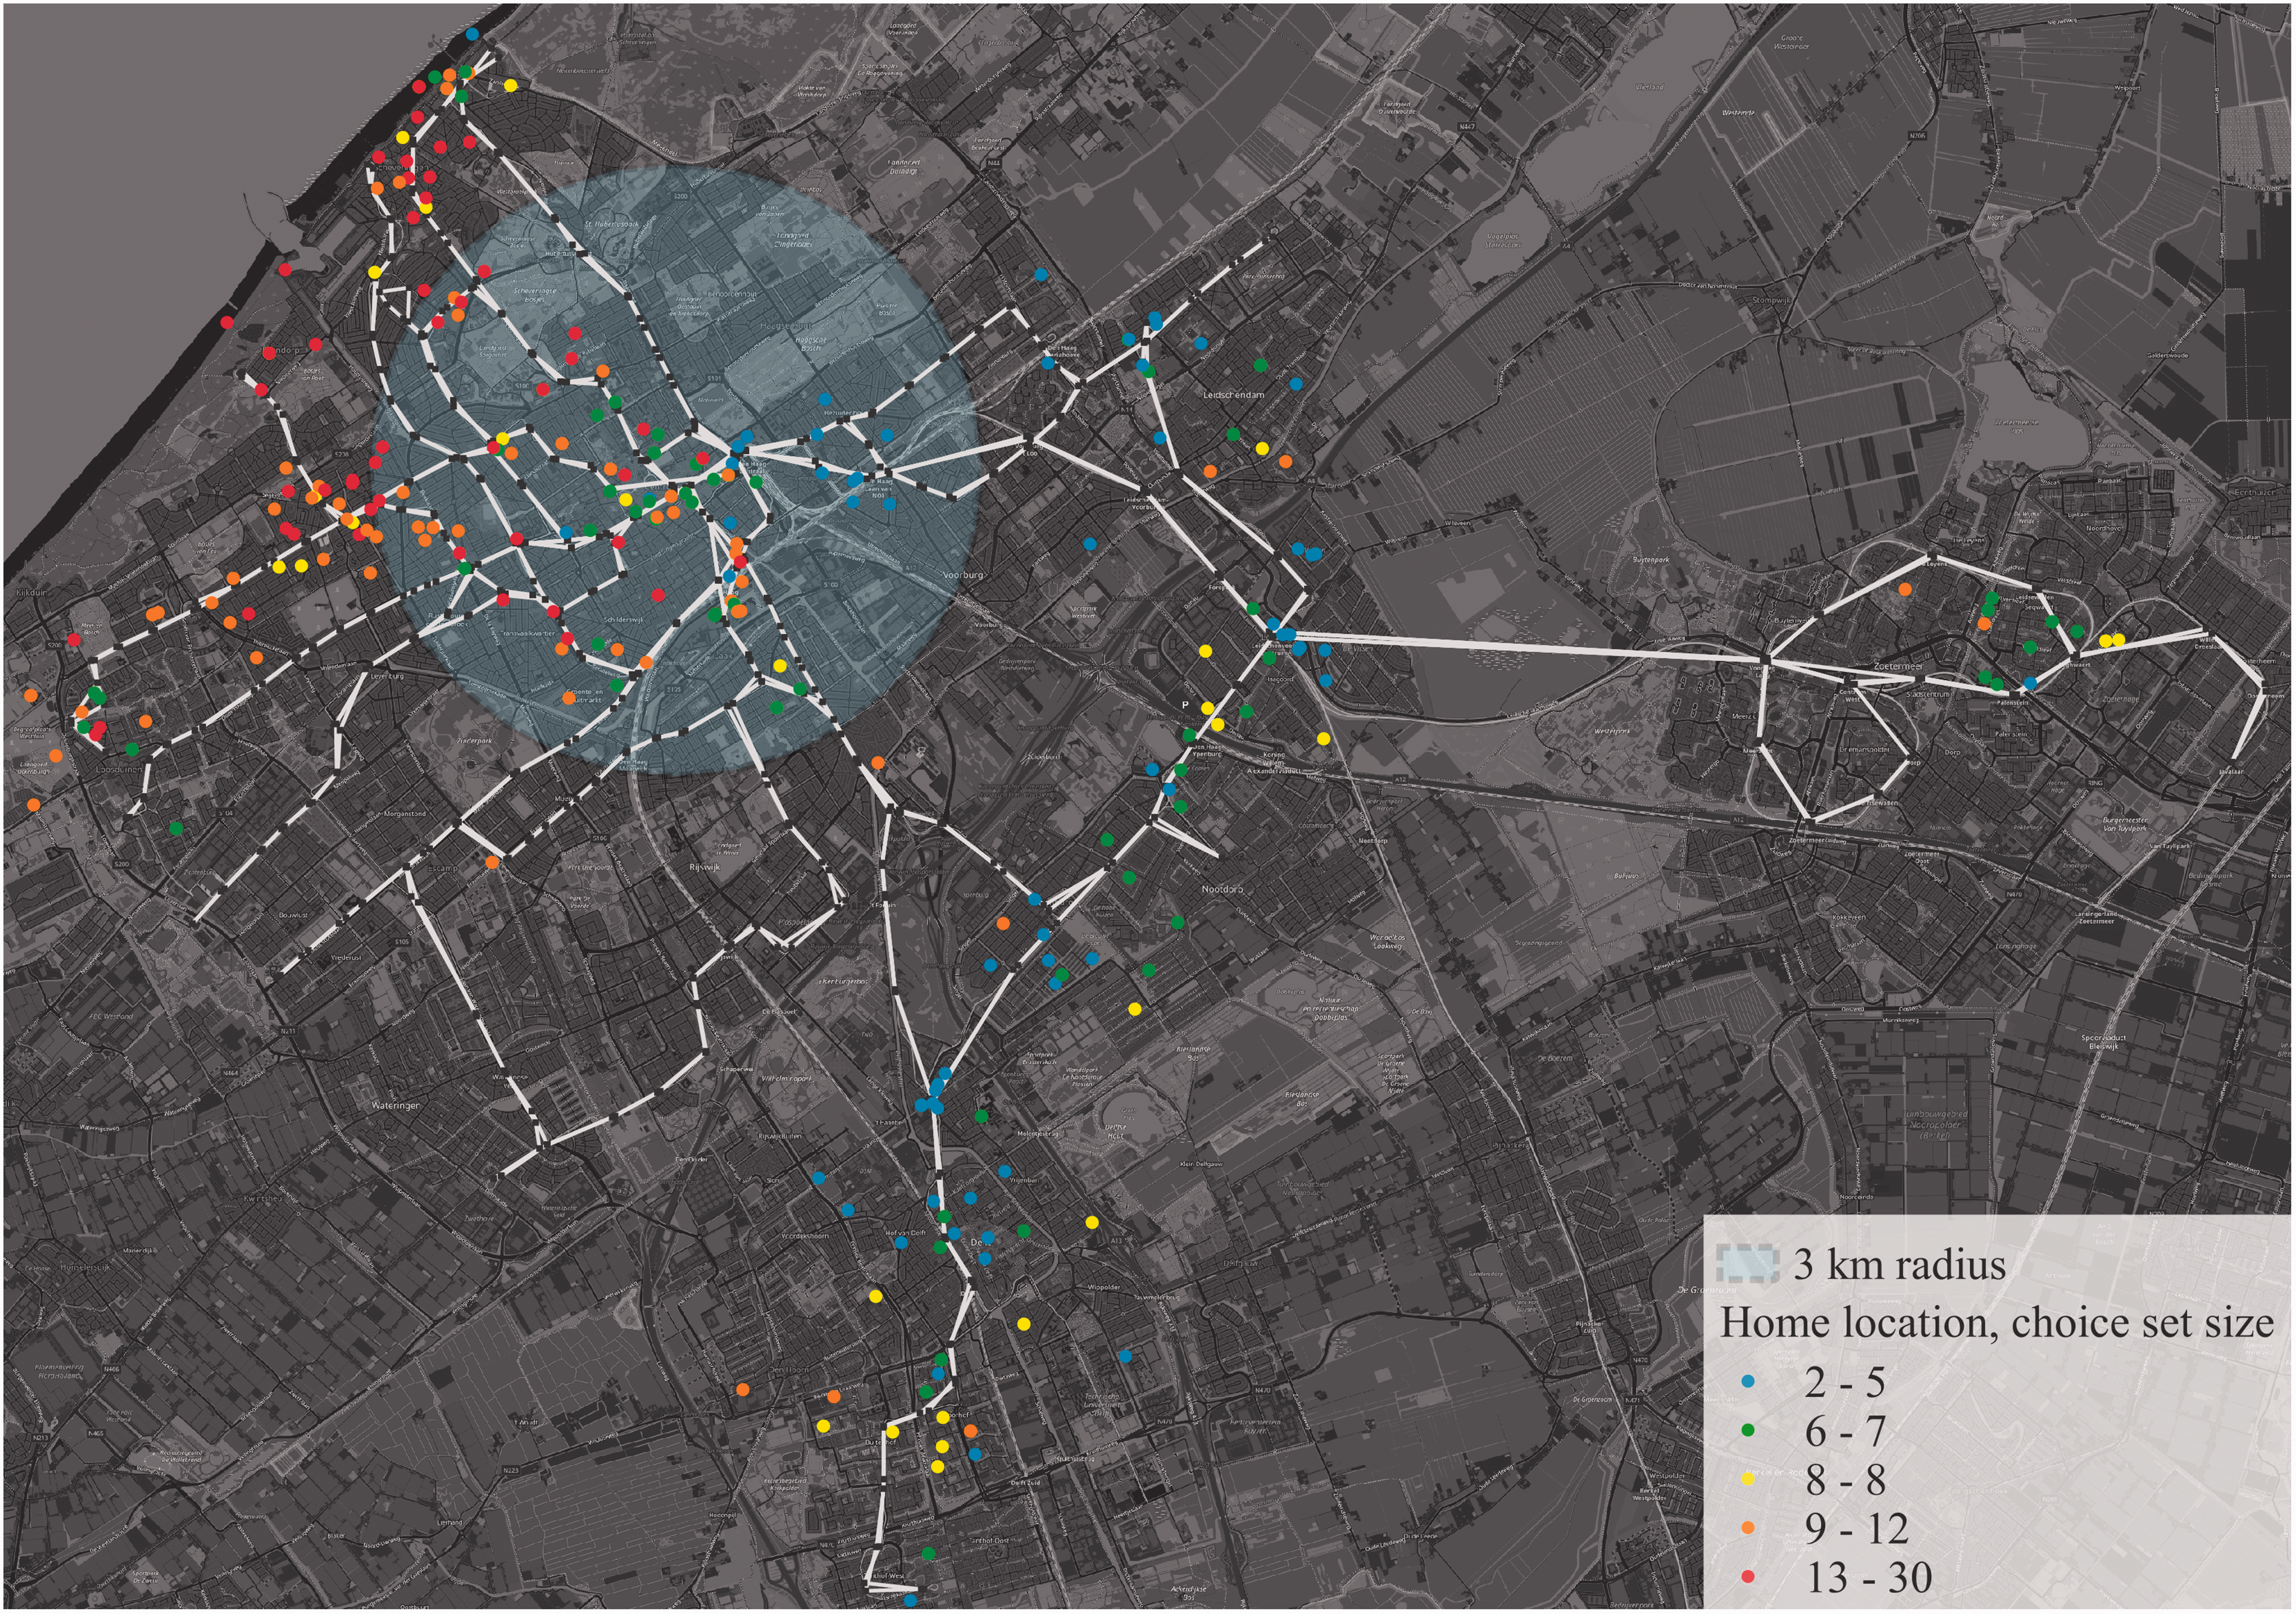
Tram network of The Hague, the home locations of all respondents, and their final choice set sizes.
EBA Input Parameters
To obtain the final choice sets, the EBA model is calibrated on access distance, total transit travel time, and number of transfers in transit. Unlike Shelat et al. (
23
), the threshold parameters indicate the maximum difference, rather than ratio, relative to the smallest value in
EBA Behavioral Parameters
Calibration of the EBA model with the above settings found that the most important attribute in the choice set formation procedure is transit travel time, followed by the number of transfers and the access distance. This indicates that travelers, on average, first eliminate stations based on the transit trip characteristics, before removing those that do not match their access distance thresholds.
The search space for the threshold parameters ranged from zero to the highest possible value in the SCS and had an accuracy of 1 m, 1 s, and one transfer for each attribute, respectively. On average, individuals accepted about 16 min additional travel time compared with the lowest travel time among their feasible alternatives. Given the 3 km radius used to generate
In relation to the number of transfers, individuals did not accept one more transfer than the minimum required. This strict constraint may have resulted from the large majority of trips in the network not making a transfer at all. Including alternatives with extra transfers would drastically reduce the efficiency because it would introduce too many unobserved alternatives for trips with zero observed transfers.
Individuals consider stations up to 1.565 km further than their nearest station. This value is greater than any of the observed maximum differences (the highest was 1.3 km). Thus, it was used by the model to regulate the number of considered, but unobserved, alternatives in the choice set for the given multiplier value. For the above behavioral parameters, the observed (Figure 3a) median and 90th percentile access distances are 0.298 km and 0.776 km, respectively; whereas those for the maximum (Figure 3b) considered access distances in the choice set are 1.638 km and 1.96 km.
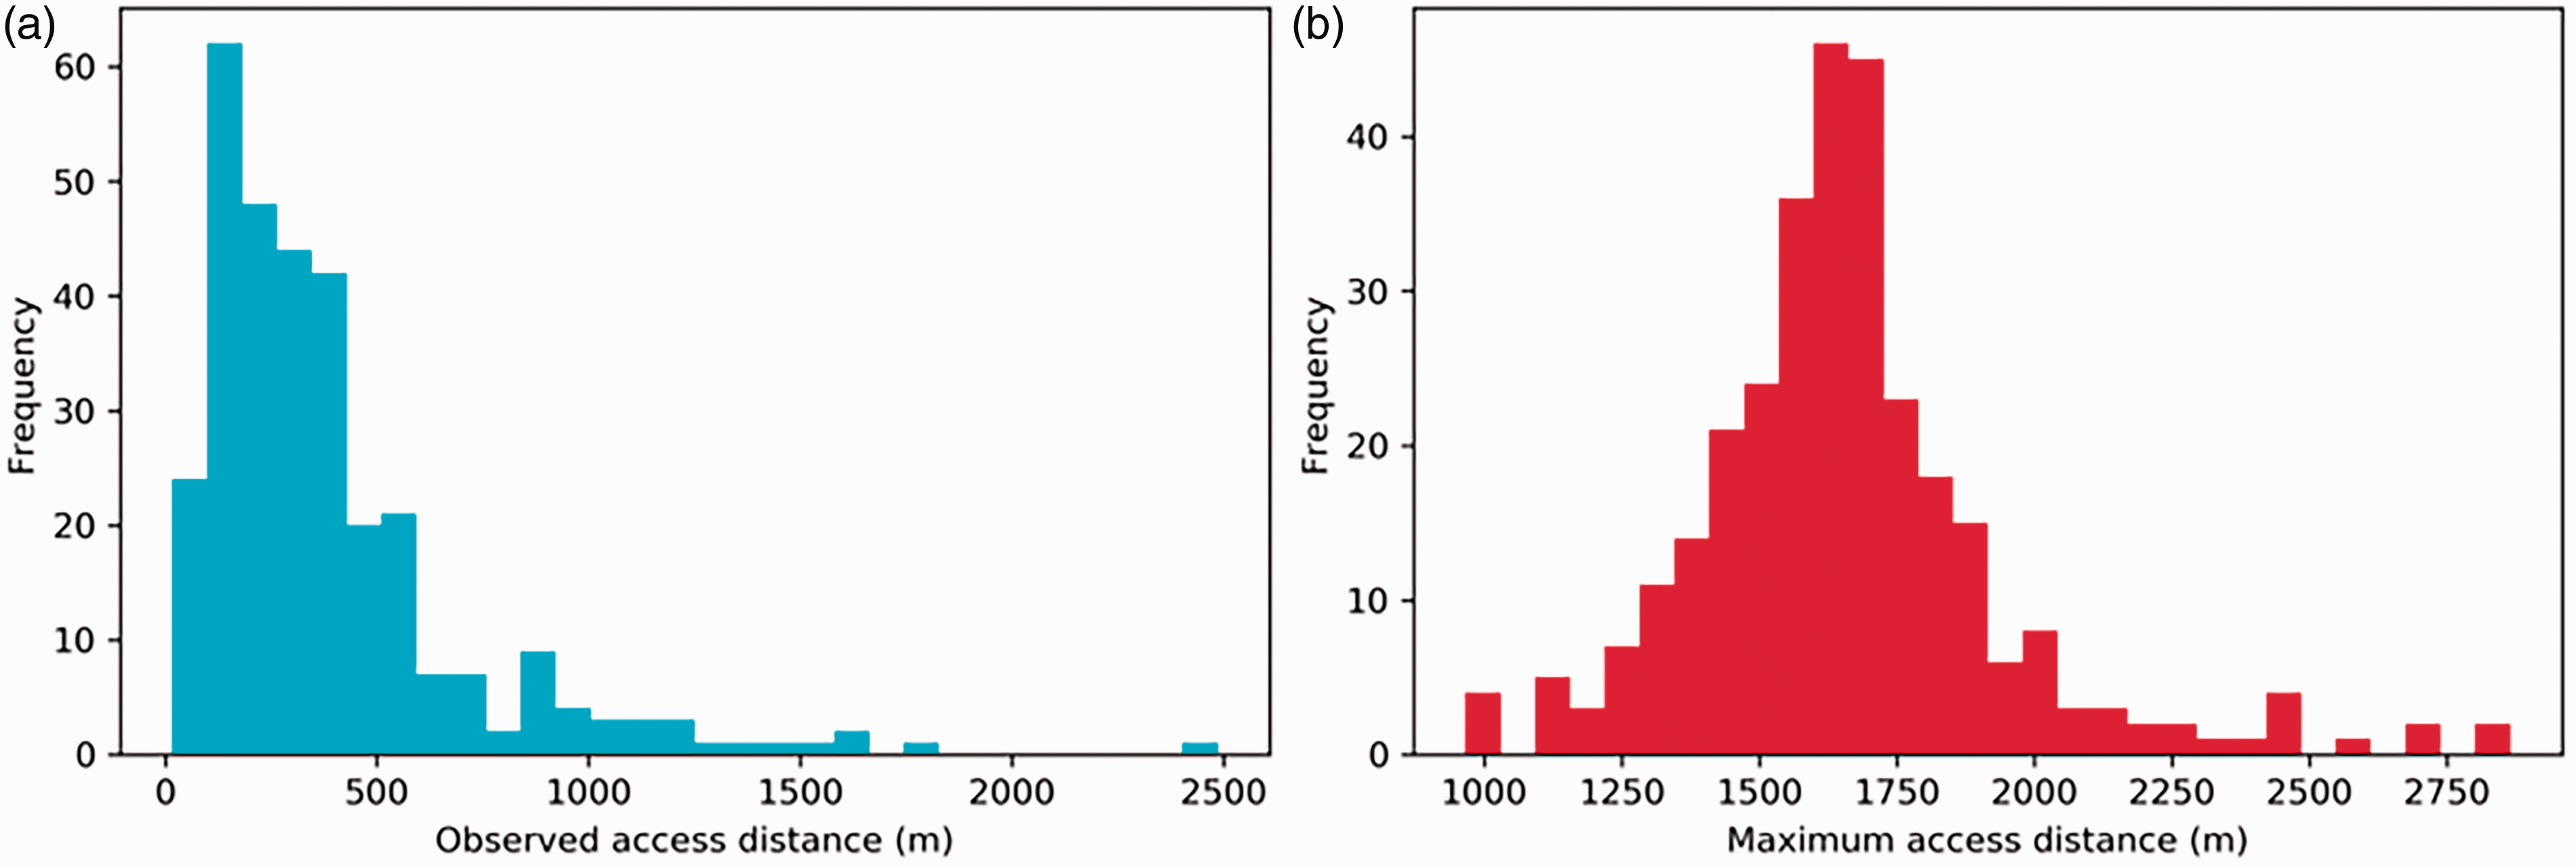
Observed (a) and maximum (b) access distance in the choice set.
Final Choice Sets
The final SCS
i
contains observations of 308 individuals (out of 353 in the SCS) of which 307 had more than one alternative in their choice set and were therefore eligible for the subsequent choice modeling step. The median and 90th percentile sizes of
Joint Tram Station and Access Mode Model
The joint model is estimated according to the specification above. The model is optimized by removing insignificant parameters up to the 90% confidence interval. Two models are presented, distinguishing mode-specific distance and mode-specific access time (Table 2). These two variables are highly correlated, consequently they cannot both be included simultaneously. Other studies investigating the joint choice (e.g., [12,17]) include access distance, whereas studies related to time valuation in transit (e.g., [32]) include access time. To enable comparison, both models are presented, with other variables kept identical. The remainder of this section discusses the results of the estimated models.
Estimation Results of the Joint Tram Station and Access Mode Model
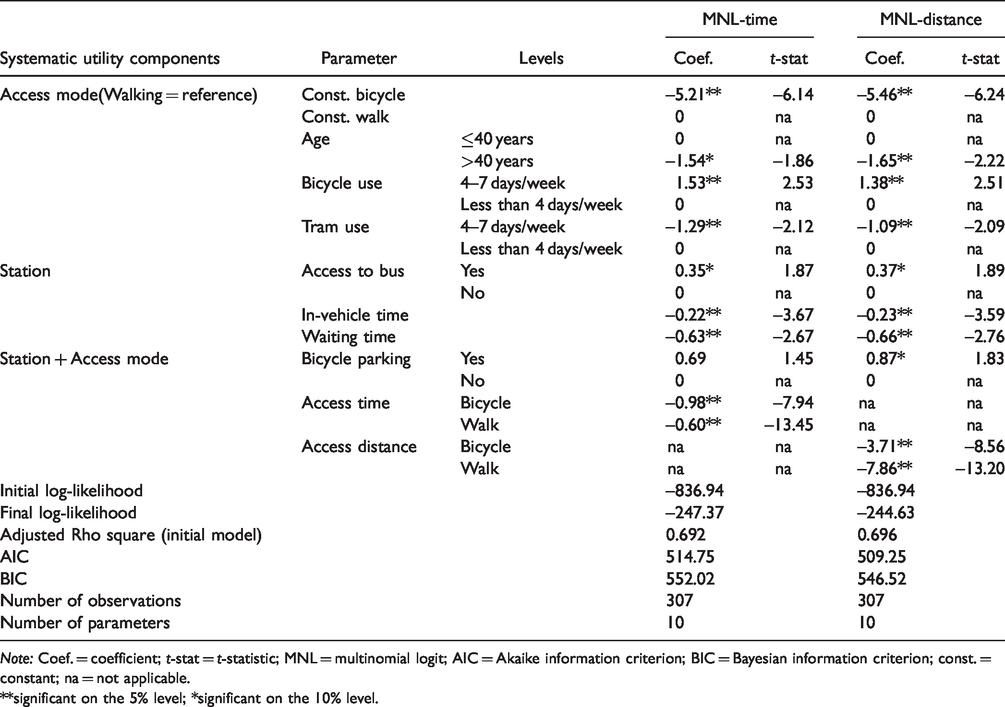
Note: Coef. = coefficient; t-stat = t-statistic; MNL = multinomial logit; AIC = Akaike information criterion; BIC = Bayesian information criterion; const. = constant; na = not applicable.**significant on the 5% level; *significant on the 10% level.
Overall Model Fit
Of the two estimated models, MNL-distance has the best model fit based on all optimization criteria. Consequently, access distance has a higher explanatory power compared to access time. This finding most likely results from individuals being more willing to travel for a similar time period to access the transit network using both modes compared with traveling a similar distance. By bicycle, with higher average speed, one can travel further in the same time period. The model fit of both models is very high, with 69%–70% of the behavior being explained by the 11 parameters included in the models. Most of the behavior can be explained by four parameters: in-vehicle time, waiting time, bicycle access distance or time, and walking access distance or time (55%–59%).
Access Mode
The individual-specific variables are estimated with walking as a reference. Generally, walking is preferred over cycling, as shown by the very negative constant for cycling. Gender and ethnicity do not have a significant association with access mode, which is in line with a study on general mode choice in the Netherlands ( 30 ). Only one study into the joint choice has investigated individual characteristics ( 13 ). However, that study investigated train stations in North America, where cycling is rare and car use is high. It found that males were less likely to use the car compared with females, preferring active modes instead. Related to age, the model shows that individuals over the age of 40 are less likely to cycle to the tram stop compared with younger individuals. Chakour and Eluru ( 13 ) also found a relation with age, however they found that individuals younger than 25 are less likely to use active modes than to use the car.
The general use of bicycle and tram influences the access mode choice of individuals. An individual cycling 4–7 days per week is more likely also to use the bicycle to access the transit network. On the other hand, when individuals travel by tram on 4–7 days per week, their utility for cycling decreases. Thus, individuals who are most likely to cycle to the tram station (looking at general mode use) are those who cycle frequently and use transit less than 4 days per week.
Tram Station
Generic station characteristics and tram journey characteristics were investigated. The first are not very important in the choice model. Compared with train stations, tram stations generally are more basic and similar to one another. The presence of a train/tram or metro/tram hub did not significantly influence the tram station choice. However, a tram/bus hub is more attractive to individuals compared with stations that only serve trams.
The number of transfers is not included in the model estimation, as the EBA method used in choice set generation already excluded stations from which the number of transfers is higher than the minimum required in an origin-destination pair. This means that although the number of transfers may be relevant, the impact on the choice behavior cannot be quantified in this choice model. The in-vehicle time and waiting time of the transit journey are valued negatively, according to expectations. The in-vehicle time for differences between walking and cycling as access modes (also in relation to their access distance/time) were tested but no such effect was found. The value of waiting time is about 2.8 times the value of in-vehicle time. Another study on the tram network of The Hague found a value of 2.5 (32), suggesting that the proposed model is sensible. In joint choice studies, these variables are often excluded. Some studies focus purely on the characteristics of the station and exclude the transit journey ( 12 , 13 ). Others do not include waiting time ( 14 , 16 ) or have merged waiting time and in-vehicle time ( 17 ), preventing the authors from making comparisons with similar studies.
Station + Access Mode
Stations that provide bicycle parking are more attractive for cyclists. Givoni and Rietveld ( 17 ) and Debrezion et al. ( 12 ) investigated the influence of bicycle parking facilities on the joint bicycle-train station choice, where they also found a positive relationship. The effect found here is stronger than that found by Debrezion et al. ( 12 ). Givoni and Rietveld ( 17 ) found that bicycle parking facilities that are perceived as having a higher quality have stronger impact on station choice. As information on the quality of the facilities was not available in this study, no findings are made on how quality affects the choice of tram station.
The access time of the bicycle mode is valued more highly than walking (1.6 times), which is expected because the bicycle can be chosen to optimize on time. This means that the trade-off values between access time and in-vehicle time and waiting time differ per access mode. For the bicycle, the trade-offs are such that access time is valued at 4.4 times in-vehicle time and 1.5 times waiting time. For walking these trade-offs are 2.7 and 0.97 times, respectively. To the best of the authors’ knowledge, no other studies have investigated walking and cycling as access modes and tram as urban transit mode, consequently no direct comparison between the trade-off values can be made. The values in this study, however, are higher than those found, for example, by Abrantes and Wardman ( 33 ), who performed a meta-analysis on values of time for bus and rail in the UK (only walking as access mode). Because of the large differences in context, access modes, and urban transit modes, the present study cannot identify why these differences arise.
In relation to access distance, walking is valued 2.1 times higher than cycling, which could be because of the extra physical effort and lower speed related to walking. Givoni and Rietveld ( 17 ) found a value of 1.43 and Debrezion et al. ( 12 ) found a value of 2.3, both for accessing train stations in the Netherlands. This means that the value for trams in this study lies within the same range. On average cycling becomes more attractive than walking for distances of 1.31 km or more (by including only the constant and distance).
Willingness to Cycle Further to the Station
Based on the model estimation (MNL-Distance), the willingness to cycle further to the station can be calculated for different characteristics of the tram station, individual, and transit journey (Figure 4). This provides information on their impact on the catchment areas of cyclists at the urban level, which extends the research by Rijsman et al. ( 2 ) on catchment areas. As the model is linear-in-parameters, the willingness to cycle further can be summed for different characteristics to find the combined impact on the catchment areas of cyclists.
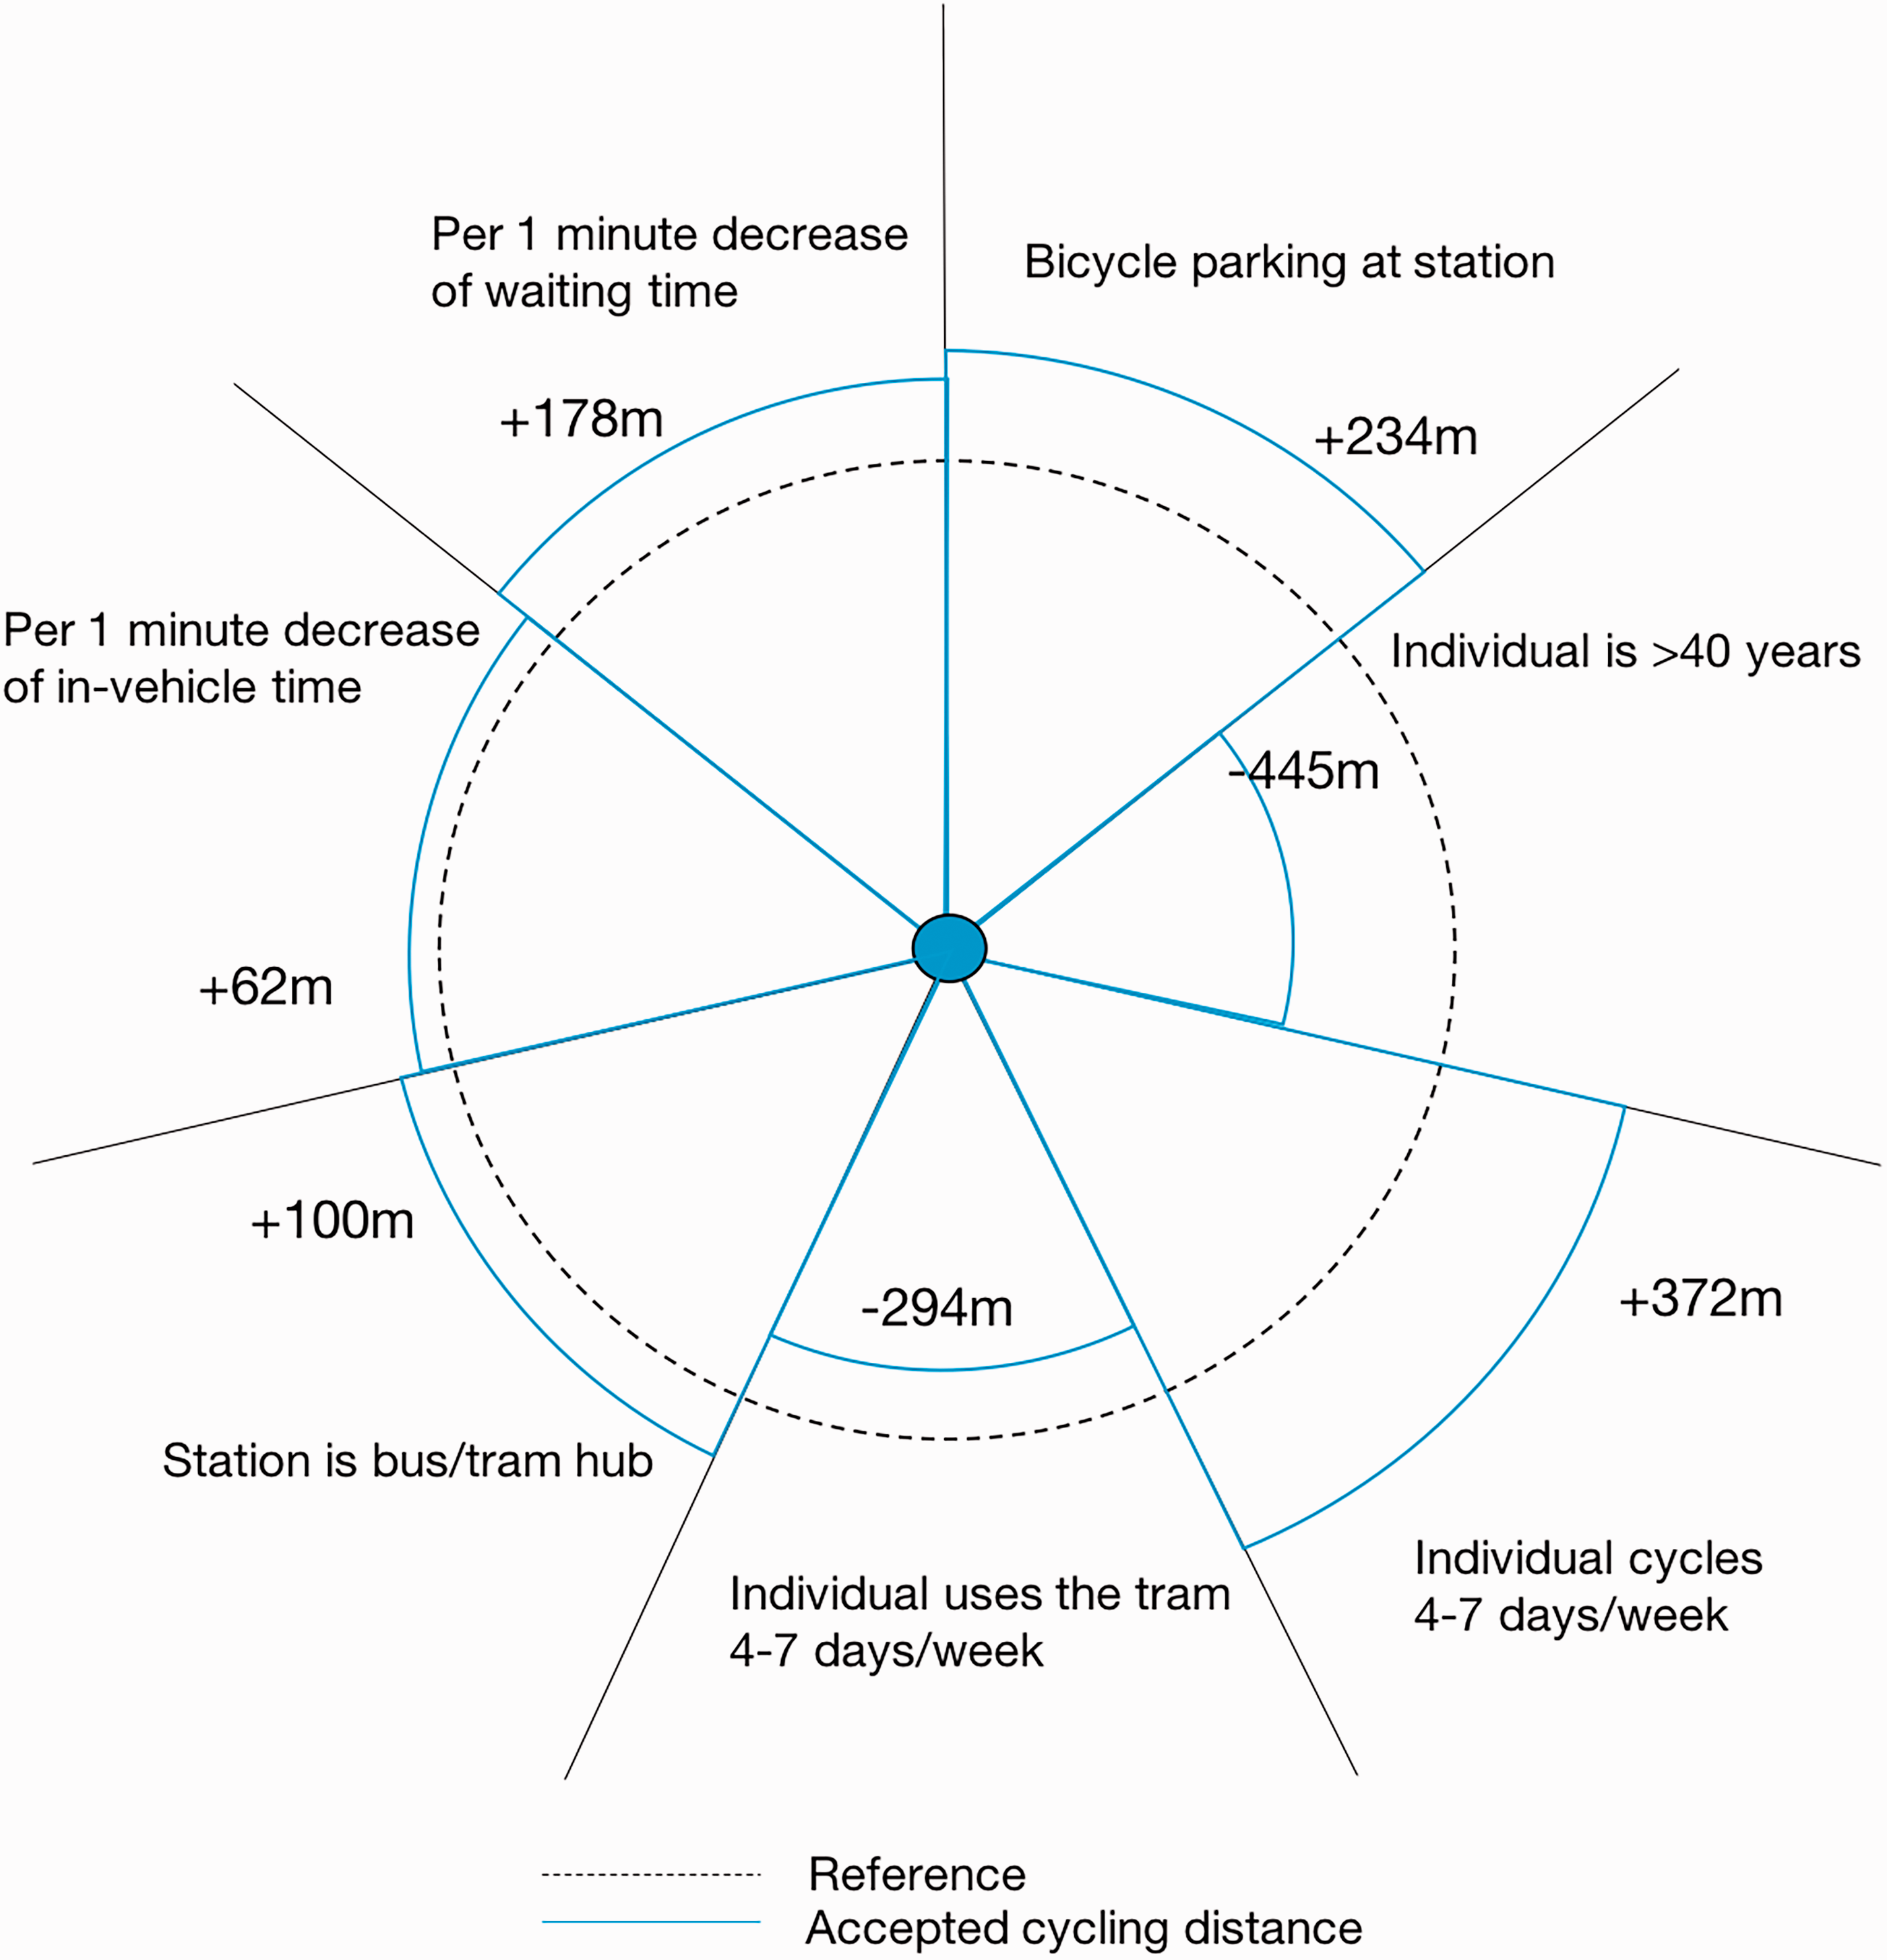
Willingness to cycle further to the tram station for different characteristics.
A station that provides bicycle parking is more attractive to cyclists than stations that do not offer this facility, such that cyclists are willing to cycle an average of 234 m further to use them. Consequently, the catchment areas of a station can be increased when implementing bicycle parking. For a bus/tram station, a cyclist is willing to cycle 100 m further. Consequently, if a bus/tram station offers bicycle parking, a cyclist is willing to cycle 334 m further to use it.
Individuals older than 40 are less willing to cycle compared with younger individuals, such that they will cycle 445 m less. Consequently, if a neighborhood contains many individuals over the age of 40, the catchment areas of the stations in that neighborhood are lower compared with stations in other neighborhoods. An individual who cycles 4–7 days per week is willing to cycle 372 m further compared with individuals who cycle less often, whereas high tram use has the opposite effect and reduces the cycling distance by 294 m. An individual who uses both tram and bicycle often is willing to cycle 78 m more than individuals who do not.
The effect of transit journey characteristics can have a large effect on the catchment area of cyclists. For each minute that their transit journey is shortened, via in-vehicle time or waiting time, an individual is willing to cycle on average, respectively, 62 m and 178 m further. This means that a reduction in transit time can quickly increase the accepted cycling distance. If, for example, improvements are made toward light rail transit (LRT), where station density is reduced to increase travel speed and frequency, individuals would be willing to cycle much longer distances.
Conclusions and Recommendations
This paper presents the findings of a joint access mode and tram station model, applied on revealed preference data from The Hague, the Netherlands, with the goal of identifying the factors relevant for the joint choice. By investigating the joint choice, trade-offs between the access journey and transit journey are calculated. Furthermore, the effects of these factors on the bicycle catchment area are investigated. Various studies have already investigated the joint choice between access mode and train station choice (national/regional level transit) ( 12 – 17 ), but this has never been investigated for the tram (urban level transit).
The joint choice is influenced by factors that are related to the access mode, the transit journey, and the combination of these. The findings suggest that choice of access mode depends on individual characteristics and the general use of bicycle and tram. Age has the largest impact, followed by the general frequency of bicycle use. Gender and ethnicity are not found to have a significant impact. The choice of tram station depends on station and tram journey characteristics, where the latter are most important. The choice set generation model finds that individuals do not choose stations that result in them making more transfers than strictly required. The choice model results show that waiting time is judged more strictly compared with in-vehicle time (2.8 times). The factors affecting both choice dimensions are the access journey characteristics and bicycle parking facilities. Walking distance was found to be weighted more negatively than cycling distance (2.1 times).
The bicycle catchment area is influenced by all factors in the joint model. Willingness to cycle further is investigated via trade-offs. Bicycle parking facilities increase the catchment area by 234 m. Individual characteristics, which can be observed on neighborhood level, have a large effect on the accepted distance, where older individuals (40+) accept 445 m less than younger individuals. The transit journey time (in-vehicle and waiting), has the largest impact on willingness to cycle further. Improvements to the system, such as fewer stops, higher frequency (like LRT), or both, result in a much higher accepted cycling distance. Consequently, catchment areas of tram stations can increase for cyclists when improvements are implemented to the station or transit journey.
Based on this study several recommendations for future research arise. This study was not able to identify the effect of the quality and quantity of bicycle parking facilities at urban transit stations on the joint choice. Understanding this effect could provide more insights into which facilities to provide at each station. Furthermore, the bicycle-tram combination is expected to compete with the bicycle on the urban level. It would be interesting to investigate what the trade-offs are between cycling for the entire trip and cycling to the tram station. Also, increasingly bicycle sharing systems are available, which means that use of the traveler’s own bicycle is no longer required. This would affect when and where the bicycle can be used (both access and egress). These effects on the joint choice are not yet known, but would influence the facilities required for each station. Furthermore, because of the data limitations, this study was unable to include detailed attributes of the access leg in the model (e.g., infrastructure quality, barriers encountered). The inclusion of this type of variable could further increase our understanding of cycling to the station. This study focused on walking and cycling as access modes. However, in other contexts or future situations, other modes, such as e-bicycles and cars, could also be valid access modes. It is expected that the trade-offs and factors of influence differ for these modes, but future research needs to confirm this. Next to that, the urban transit mode investigated in this study is the tram. It is expected that the impact of the factors found in this study will vary for different urban transit modes (e.g., bus, metro, or heavy rail), resulting in different trade-offs between the access leg and transit leg.
Footnotes
Acknowledgments
The authors thank HTM personenvervoer N.V. for their collaboration and all the respondents for their participation.
Author Contributions
The authors confirm contribution to the paper as follows: study conception and design: D. Ton, S. Nijënstein, S. Shelat; data collection: L. Rijsman; analysis and interpretation of results: D. Ton, S. Shelat, S. Nijënstein; draft manuscript preparation: D. Ton, S. Shelat, S. Nijënstein, N. van Oort, S. Hoogendoorn. All authors reviewed the results and the paper and approved the final version of the manuscript.
Declaration of Conflicting Interests
The author(s) declared no potential conflicts of interest with respect to the research, authorship, and/or publication of this article.
Funding
The author(s) disclosed receipt of the following financial support for the research, authorship, and/or publication of this article: This study is supported by the Allegro project (No. 669792), which is financed by the European Research Council and Amsterdam Institute for Advanced Metropolitan Solutions, and by the My-TRAC project (H2020 Grant No. 777640).