
Abstract
This case study describes the development of a new timetable designed to reduce delays on the London–Shenfield regional railway line in the United Kingdom (UK). Reducing delays on high-density railway lines is challenging because frequent service makes it difficult to identify the root cause of delays and there is limited ability to solve delay problems by adding buffer times to timetables. On the other hand, it is very important to reduce delays on high-density lines since they affect many passengers and because a delay on one train can easily affect following trains. In this study, detailed railway operational data was used together with Oyster card ridership data to identify the root cause of delays and help develop an alternative timetable. The alternative timetable was tested and refined using stochastic simulation. The new timetable was placed in service during 2016 and led to a significant reduction in delays: punctuality within 5-min of scheduled arrival time increased by 6.2% during the most critical hour of the morning peak period. The paper describes the methodology, its application, study results, and transferability.
High-density railway service can be defined as operating trains at a frequency near the railway line’s theoretical maximum capacity. High-frequency service is generally operated on lines near major stations and cities.
Today, many railways are attempting to increase service density to make maximum use of infrastructure and thereby justify the high cost of railway infrastructure. However, operating more service means that delays on one train will impact other trains; the networked nature of railway service means that these delays can affect trains far from the originally impacted train. As a result, railways have a dilemma: how can they maximize service without causing undue delays.
To solve this dilemma, railways constantly monitor train performance and adjust timetables to reduce delays. While there are many software-based tools available to help railways develop and refine timetables, there is no single tool that can automatically develop improved timetables using operating and delay data. Instead, this process is carried out by experienced timetable planners using a variety of software tools and considerable creativity.
This paper presents a case study describing how the morning peak period timetable for the existing high density service between Liverpool Street Station and Shenfield, in London, United Kingdom (UK), was adjusted to reduce delays. This service will be connected to the Queen Elizabeth Line (formerly known as Crossrail) currently being built through central London. The paper begins with a description of the Shenfield Line service and a brief summary of the new Queen Elizabeth Line. The following section describes the study purpose and methodology. The next section describes how the methodology was used to develop a new timetable that significantly reduced delays on the Shenfield Line. The final section presents conclusions and recommendations.
London–Shenfield Line
Railway Transport in London
Railway transport has been fundamental in London’s development and forms the backbone of its public transport system. Today London is served by an extensive network of international, national, and regional railway lines that terminate or pass through 18 major stations located in and around central London. These stations are linked by the Tube, a dense underground rapid transit network that provides service throughout the city and nearby suburbs.
While London’s railway network is excellent, it faces the same challenges as other cities: rapidly increasing travel demand, the difficulties of maintaining old infrastructure while continuing to operate, and insufficient resources for expanding service.
Privatized Railway Operations in the United Kingdom
Railway service in the UK was privatized between 1994 and 1997. Service is now operated by private companies (train operating companies [TOCs]) over publicly owned infrastructure. The Department of Transport (DOT) is responsible for contracting service except for key regional lines around cities. Transport for London (TfL) is responsible for contracting service on the London Underground, Overground, several suburban lines (including the London–Shenfield line considered in this research), and the future Queen Elizabeth Line.
There are two types of operations contracts: franchises and concessions. In a franchise, the operator pays the public authority (or receives a specified subsidy) and accepts the commercial risk. In other words, the operator keeps the fare income and is allowed to adjust service to increase revenues. Franchises usually last for a minimum of 7 years and cover a defined geographic area or service type. Franchises are not awarded on an exclusive basis, which means that day-to-day competition with other franchises and open access operators is possible, although today competition only occurs in a limited number of cases.
A small number of urban railway lines are contracted out as concessions. Concession holders are paid a fee to run a service that is usually tightly specified by the awarding authority. They do not take commercial risk, although concession contracts normally include conditions to reward or penalize operators for better/worse service than specified in the contract (e.g., punctuality). The London–Shenfield Line (referred to below as Shenfield Line) is operated as a concession.
Shenfield Line Description
The Shenfield Line operates on surface tracks from London’s Liverpool Street to Shenfield in the east of London. It is one of the routes controlled by TfL and known collectively as the TfL Rail network.
The operating concession for TfL Rail was awarded to the Hong Kong Mass Transport Railway (MTR) in 2015. MTR is a privately owned company that operates Hong Kong’s rapid transit lines and service in several cities including Stockholm and London.
The authors assisted MTR in fine-tuning railway timetables as part of MTR’s original concession bid and have continued to assist MTR with timetable planning. This paper describes a study performed for the MTR to reduce delays on the Shenfield Line.
The Shenfield Line will be connected to the Queen Elizabeth Line (formerly known as Crossrail). The Queen Elizabeth Line is a tunnel through central London for high-frequency standard railway service. It will link the city’s eastern and western suburbs but is also designed to attract intra-central London trips and thereby relieve overcrowding on several Tube lines.
The service concept is the same as Paris’ RER or German S-Bahn systems: several regional railway lines will operate through a central city tunnel and then branch off to serve different suburban corridors. Initially, one line will be operated through the tunnel, the other branches will be added in stages.
The Queen Elizabeth Line is a huge infrastructure project. When completed it will cost about 18 billion British pounds (GBP) which is approximately 23.6 billion U.S. dollars (USD). Construction began in 2009, and service is expected to start between October 2020 and March 2021. ( 1 )
Figure 1 shows the full Queen Elizabeth Line highlighted in green on London’s public transport map. The inset on the lower part of Figure 1 shows the existing Shenfield Line service from Liverpool Street.
The Shenfield Line is the initial 20-mi section of the Great Eastern Main Line (which connects London with Norwich). There are four tracks on the London–Shenfield section. They are operated as two parallel double-track lines; one (electric lines) dedicated to the London–Shenfield services, and the other (main lines) to all longer-distance trains.
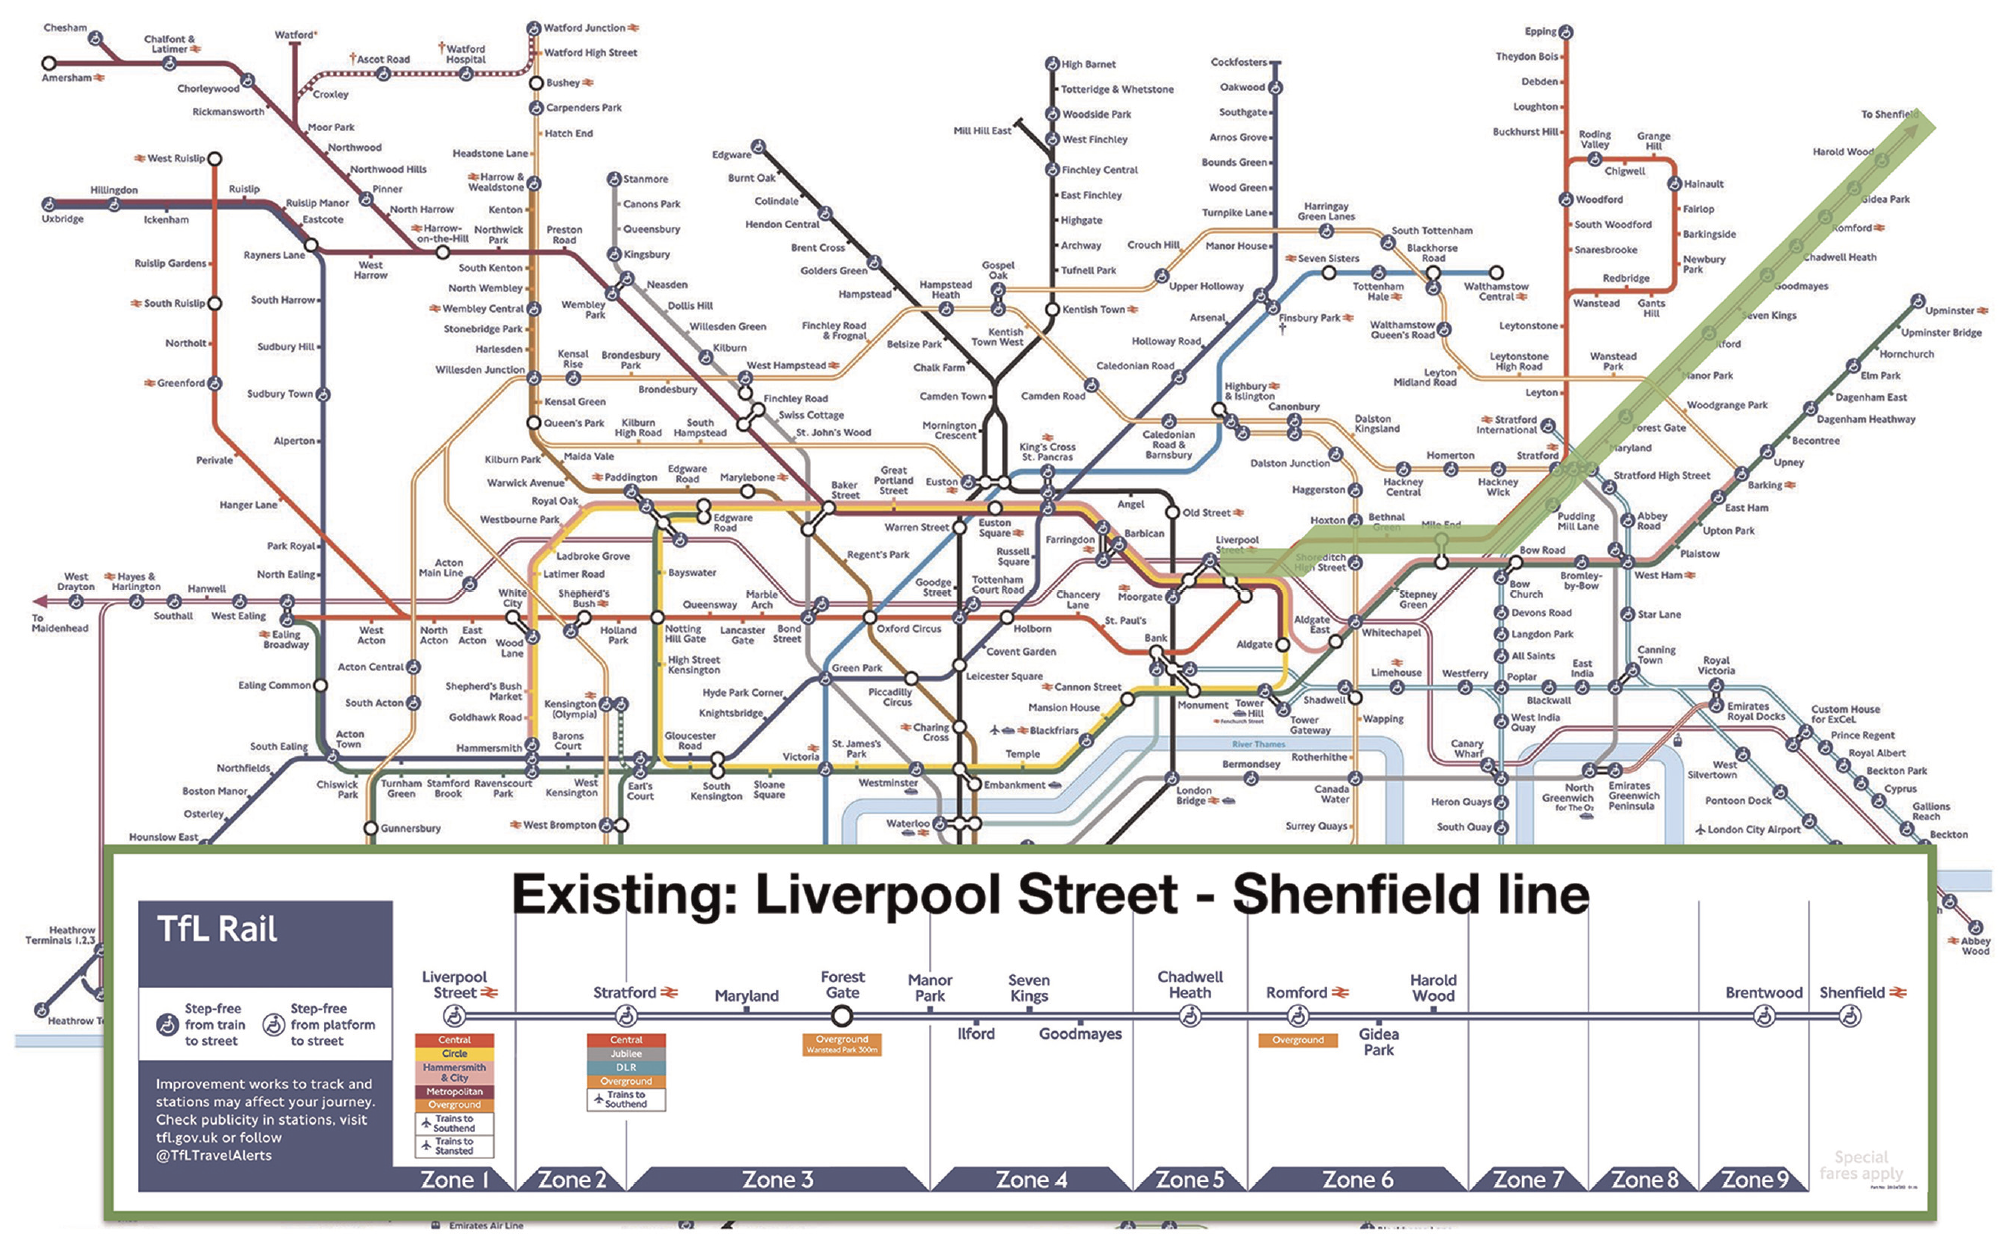
Crossrail project—Queen Elizabeth Line and existing Shenfield branch service.
The line starts at Liverpool Street Station, one of the UK’s most important stations and third busiest in London, serving 67 million passengers in 2015. It has 18 platforms, six dedicated to the suburban lines, eight to the main line, and 4 to the electric line. While the platform tracks are dedicated to specific lines, the station throat track sections are shared: in particular main line trains use the electric line tracks, causing potential conflicts and delays.
The line is equipped with a four-aspect block signaling system. The line includes very short block lengths (up to 250 m); these are so short that they require a combination of (restricted) overlaps and signal aspects to guarantee safe operations (train protection and warning system [TPWS] and automatic train protection [ATP]).
The Shenfield Line is operated from the integrated electronic control centre (IECC) at Liverpool Street. The system implements an automatic route setting (ARS) process which operates the line with no signaler intervention unless delays or other disruptions require a modification to the timetable or train itinerary.
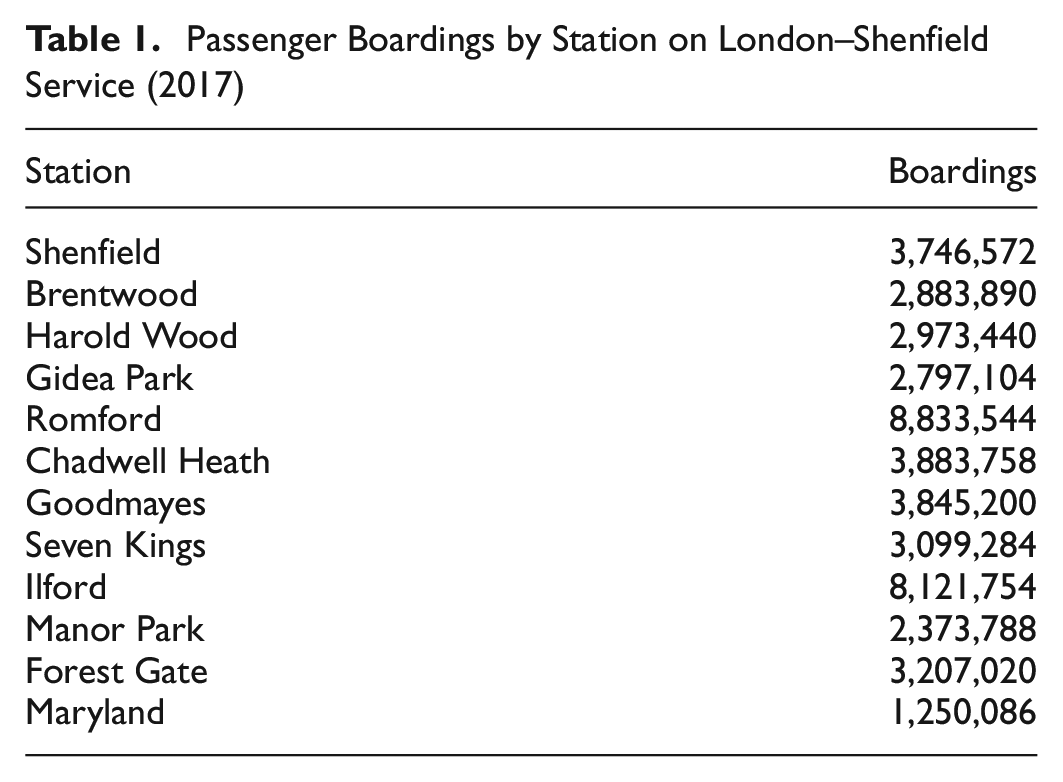
The first stop after Liverpool Street is Stratford, a major interchange in Greater London, used by over 40 million passengers per year. Between Stratford and Shenfield, the line has 11 intermediate stops: some with very low ridership (e.g., Maryland), while others, such as Romford and Ilford, are used by over 8 million passengers per year (Table 1).
Passenger Boardings by Station on London–Shenfield Service (2017)
TfL has procured a set of Class 345 electric multiple unit (EMU) rolling stock for operation on the Queen Elizabeth Line, but these EMUs are not yet available for service on the Shenfield Line. In the interim, the service is operated with a set of Class 315 EMUs. The Class 315 rolling stock was built in the early 1980s and is operated with two four-car vehicle sets. While each vehicle has three doors, the internal layout is not ideal for high demand regional service since it has a 3+2 standard seating and a narrow aisle. The new Class 345 EMUs will have a better seating arrangement, new monitoring systems, and improved performance characteristics.
Problem Description and Study Methodology
Problem Description
Shenfield Line service is a classical high-density railway operation. Service to Liverpool Street Station in the morning peak period operates approximately every 3.5 min (17 trains arrive between 8:00 and 9:00 a.m.). As with all high-density operations, a delay on one train can easily affect the following trains creating problems for passengers and railway operators as they struggle to return service to schedule.
Furthermore, since part of the operating payments to MTR are based on performance (including punctuality), delays also have a direct impact on revenues. This gives operators extra incentive to solve delay problems and very carefully design timetables in the franchise bidding process; promising too much service leads to punctuality penalties, promising too little makes the bid unattractive.
In this case MTR won the TfL Rail concession by committing to provide a very high level of performance as measured using the conventional public performance measure (PPM), the percentage of trains reaching their destination within 5 min from the scheduled time. Should MTR fail to achieve this performance, it must pay TfL a penalty for each train run below the target.
In 2015, MTR recognized a delay problem on trains to Liverpool Street Station from the Shenfield Line (see Figure 1) and began to investigate ideas for reducing these delays. Figure 2 illustrates arrival delays for Shenfield Line trains in 2015. As shown, delays increase remarkably over the morning peak period, with punctuality within 5-min of schedule decreasing from over 90% at the beginning of the service period to about 75% around 8:30 a.m.
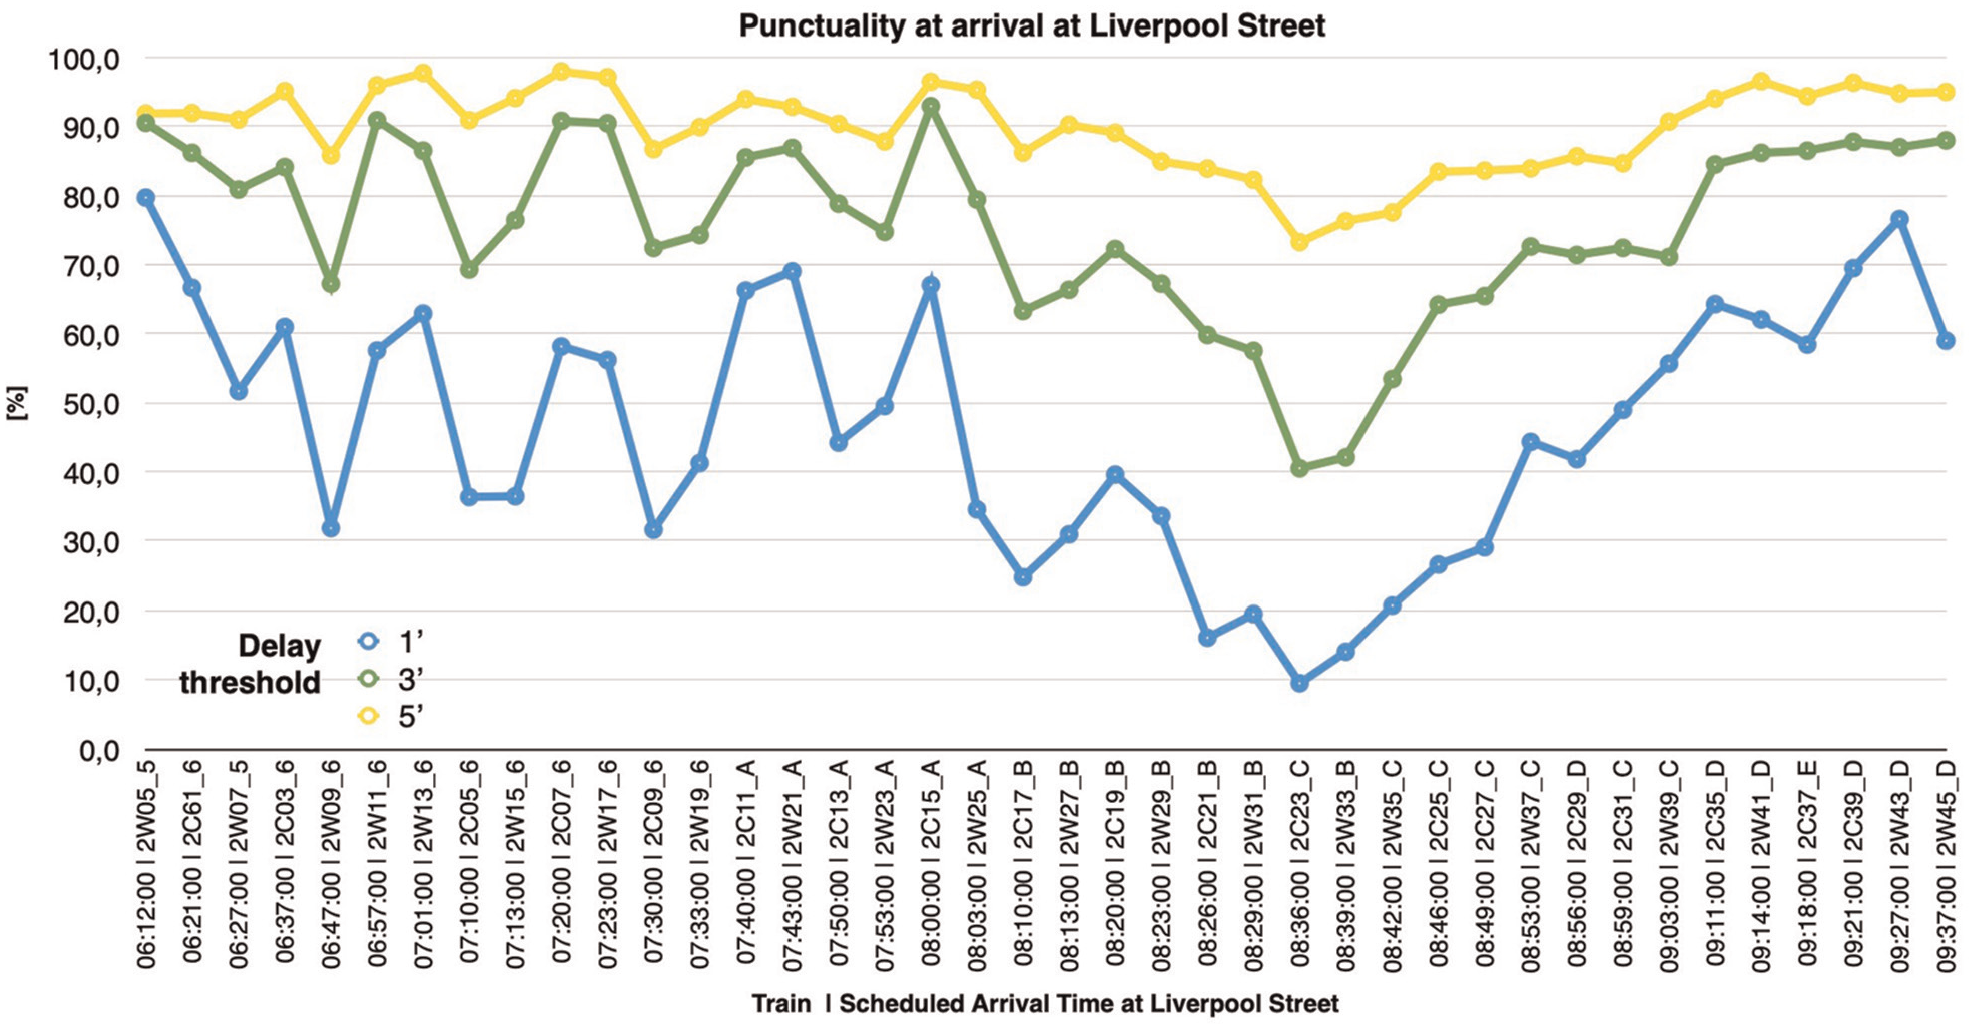
Shenfield Line train arrival delays at Liverpool Station (a.m. peak period).
Study Methodology
It is difficult to identify and solve delay problems on high-density railway networks because there are many possible delay causes, and very little flexibility for adjusting train paths since a small change made to one train often creates the need to adjust many other trains in a continuing cycle.
The first step in the Shenfield Line timetable improvement study was to determine the root cause of delays by examining the line operations in detail. The second step was to use this information to develop a set of timetable adjustments to reduce these delays. The resulting timetable was tested and refined using simulation. This section summarizes the study methodology; the following section describes how it was applied in the case study.
Delay Cause Identification
There are two types of delays: unique and continuing. A unique delay is caused by something unusual such as a medical emergency on a train. A continuing delay is caused by something that happens regularly but may not be obvious. Railways must develop plans for responding to unique delays and systematically investigate continuing delays. The Shenfield Line study focused on continuing delays.
The process of investigating continuing delays uses observation and experience to develop hypotheses, seeks data to test these hypotheses, and then develops potential solutions. The process is often iterative, as hypotheses and solutions are defined, reconsidered, and refined.
One of the major causes of continuing delays, especially in peak periods, are inadequate station dwell times. In this case, trains are delayed because there is insufficient time provided in the timetable for all passengers to board and alight. An insufficient dwell time at one station often causes knock-on delays, since more people than planned are likely to be waiting at the next stations.
While the problem of insufficient dwell time is well understood, it is often difficult to identify the precise trains or stations which cause problems, especially for high-density service and on complex networks with many service variations. Here, planners must use information beyond railway operations data to help better identify and understand the actual problem.
A very promising source of information are automatic fare collection (AFC) systems such as London’s Oyster card. In AFC systems, passengers use a card to check in/out and are assessed a fare based on the trip length, timing, and mode. AFC systems are revolutionizing public transport planning by providing huge amounts of high-quality data which have never before been easily available.
In this study, Oyster card data was used to assign passengers to actual trains, and then the resulting passenger loadings were analyzed using spreadsheets and graphically to identify stations and trains with inadequate dwell times. These data were also used to identify the relationship between the train stopping time and the number of passengers boarding/alighting, as well as to develop a minute-sharp origin–destination (O/D) matrix (i.e., an O/D matrix for each minute). These were then used to estimate the passenger load on board existing services, and to predict the passenger loads on services in the proposed timetables.
Onboard train monitoring recorders (OTMR) are another source of data that could be used to identify delay causes. OTMR log files contain highly accurate train-tracking data, log files for many key vehicle systems (e.g., door closing and opening, throttle and brake positions, and train payload based on the pressure in air suspension circuits). The advantages of OTMR are:
Stop time is measured more accurately than with track circuit data;
Specific dwell time elements are measured separately (door-opening time, door-closing time, effective door open time, train restarting time);
Payload weights can be used to validate passenger assignment estimates from AFC data;
Throttle position can be used to more accurately calibrate driving behavior.
Unfortunately, the Shenfield Line’s Class 315 rolling stock is not equipped with OTMRs so this data was not available for this study (however the new Class 345 rolling stock will have recorders).
Testing and Refining Timetables using Simulation
Once the cause of delays had been identified, it was possible to develop and test timetable improvements designed to solve the delay problem.
Much research has been completed on creating robust railway timetables. This research has supported the development of software packages designed to help planners create robust timetables by simulating railway operations based on a very detailed (microscopic) infrastructure model. There are two basic approaches to these railway scheduling simulations: deterministic and stochastic ( 2 ):
Deterministic railway scheduling simulations test timetables based on fixed assumptions for train operations.
Stochastic railway scheduling simulations test timetables based on statistical data from actual train operations.
Often, planners create an initial timetable deterministically and then use stochastic methods to fine-tune these timetables.
Stochastic simulation provides more robust results because it is based on real railway operating data, as opposed to assuming ideal conditions. Stochastic simulation is often used in planning high-density railway service because it enables users to very precisely allocate capacity. On the other hand, stochastic simulation requires much more data and more powerful hardware than deterministic simulation, since stochastic simulations must be repeated for a statistically relevant number of runs (in this research 100 runs were made).
The stochastic railway operations simulation program called TRENO suite was used in this case study to analyze existing data and to help identify and test timetable improvements for the Shenfield Line service ( 3 ).
Shenfield Line Timetable Improvement Study
This process for developing an improved Shenfield Line timetable consisted of the following workflow:
Collect and analyze track circuit data, passenger counts, and Oyster card data;
Develop timetable improvement alternatives;
Simulate alternative timetables and analyze results;
Identify the best alternative timetable.
The study was completed between December 2015 and March 2016. The new timetable was implemented in May 2016.
Data Collection and Preparation
The first step in the study was to collect and prepare operating and passenger data for further analysis. The study used track circuit data to understand train movements and Oyster card data to understand passenger demand. These data were collected over the period from September to December 2015. These data were used to estimate four key measures:
Passenger arrival rates (London-bound trips) for each station;
Number of passengers boarding and alighting each train at each station;
Relationship between stop time and number of passengers boarding for all trains and stations;
Critical trains (i.e., trains carrying near or over-capacity loads, and trains with high delays).
The number of passengers boarding and alighting each train at each station was derived from the Oyster card data. London’s public transport network is one of the largest and most complex in the world, making a network-wide assignment of passengers to services using Oyster card data extremely complex because of the combination of possible alternatives for most trips and uncertain transfer times.
However, thanks to a fortunate combination of characteristics, passenger assignment on the Shenfield Line could be accurately estimated without complex algorithms. These characteristics are:
a) The Shenfield Line is mostly used by passengers to/from London travelling via the Liverpool Street and Stratford stations. No other lines—except the minor Romford-Upminster branch—stop at the other stations on the Shenfield Line. This means that, for London-bound traffic in the a.m. peak, all passengers recorded using Oyster cards at stations on the Shenfield Line used the route.
b) All passengers alighting at Liverpool Street tap out with their Oyster card as they exit from the platform—before tapping in to a connecting service (e.g., Tube)—that is, a trip interruption. This means it is possible to know how many passengers are on board at Liverpool Street.
c) At Stratford, passengers change to the other lines without tapping out, that is, an interchange.
Combining these characteristics means that the Oyster card trip records for the London-bound a.m. peak period consist of all trips starting at any station on the London–Shenfield route except Liverpool Street. Within this set of trips, all trip records to destinations external to the route have an interchange—and thus must exit the train at Stratford. The result is a reliable, minute-sharp O/D matrix for the line. For all passengers except those leaving the train at Stratford, both the arrival and departure time is known.
Once this O/D matrix was developed, passenger boardings at stations could be assigned to actual trains using two simple rules:
1) All passengers take the first train arriving if there is sufficient capacity on the train.
2) The minimum time to access the platform and board a train is 1 min.
These rules were tested and found to be valid by comparing the expected and actual tap-out times of all a.m. peak period trips for one day (excluding the trips with an interchange at Stratford since tap-out time was not available for these trips). It should be noted that these same rules can also be used for assigning the O/D matrix to the proposed timetables developed later in the study.
This approach was used to assign passengers to actual train movements (based on track circuit data) based on the Oyster card data from all available days (5 weeks of Monday to Friday data). This provided the number of passengers boarding, alighting, and on-board for all stations and all trains.
These data were then plotted against corresponding train stop times to help visualize and analyze the relationship between passenger exchange and stop time. Significant scientific work can be found in literature on this topic: Palmqvist, and Cornet et al. present the most updated reviews of previous papers ( 4 , 5 ). The research shows that when the number of passengers boarding and alighting is small, stop time is independent of the number of boardings and alightings. As boardings and alightings increase, stop times increase linearly, meaning that the marginal dwell time per passenger is constant ( 6 ). Once the number of passengers already on board nears train capacity, then the increase in marginal dwell time per passenger increases more than linearly.
As mentioned above, the Class 315 trainsets are not ideal for suburban service since they are laid out as 3+2 seats with a narrow aisle and little circulation space around the doors. It would have been interesting to analyze the impact of this layout on boarding time under various levels of passenger loading (i.e., AW0–AW4). However, this was not possible in the short amount of time available and because only a few AW3/4 trains were included in the available Oyster card data.
The focus therefore was to identify the relationship between dwell time and passenger exchange on the Shenfield Line, so that it could then be used to estimate dwell time during the simulation of future timetables. This estimation was performed separately for each station to implicitly include the impact of passenger distribution on the platform on dwell time.
An analysis of the data showed that the study could focus on boardings only, since on the vast majority of passengers using the London–Shenfield route were traveling to London in the morning peak period.
All records corresponding to early or on-time train arrivals had to be excluded from the data set since they potentially include time the train spent waiting at a station for its planned departure time (i.e., to return to schedule), which is not function of the number of passengers.
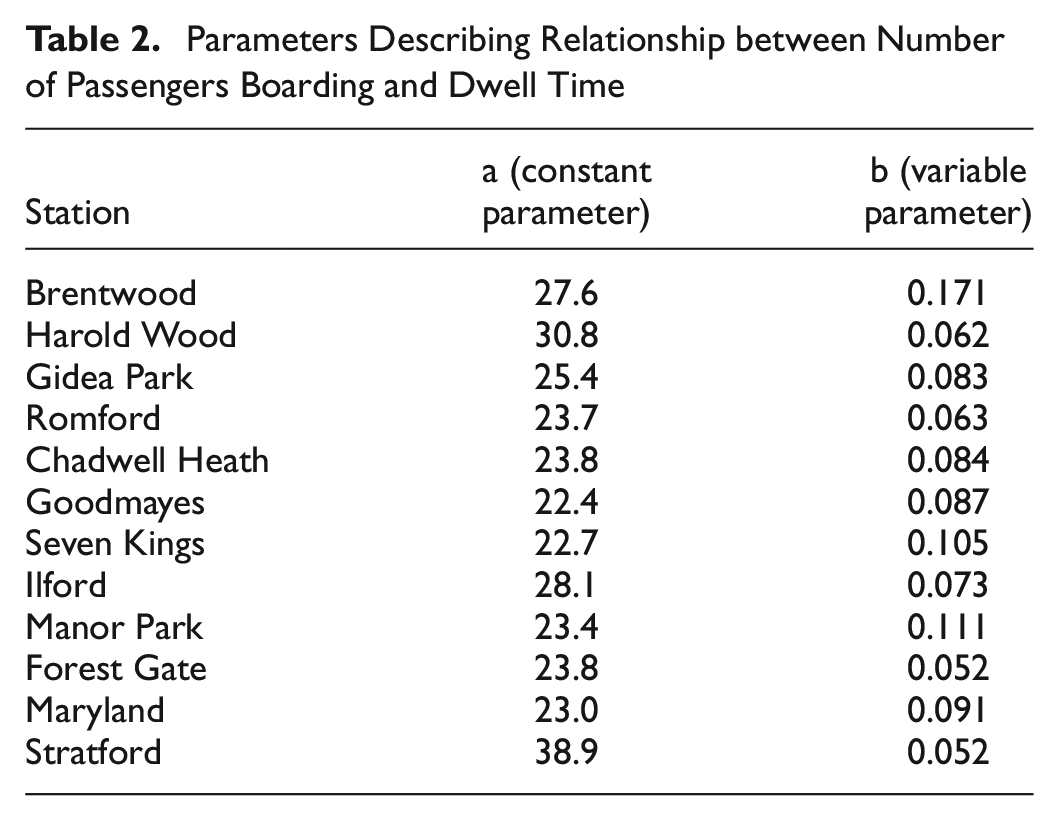
The number of records for fully loaded trains (i.e., AW3/4) was insufficient to accurately define the last (non-linear) part of the dwell time—passenger boarding curve, and therefore, a linear relationship between the number of passengers boarding and dwell time was chosen for use in the study

where
Td = Dwell time
ai, bi = parameters identified for each station i
N = Number of passengers boarding and alighting.
Table 2 shows the parameters obtained for all stations. The table was derived by performing a linear regression of the dwell time versus number of passengers for all late-arriving trains in the analysis period (time in which both the Oyster and track circuit data were available). Figure 3 shows the input X-Y diagrams for four stations. Given the limited time available, no further analysis was performed to explain the resulting parameters by, for example, linking them to station layout or number of waiting passengers.
Parameters Describing Relationship between Number of Passengers Boarding and Dwell Time
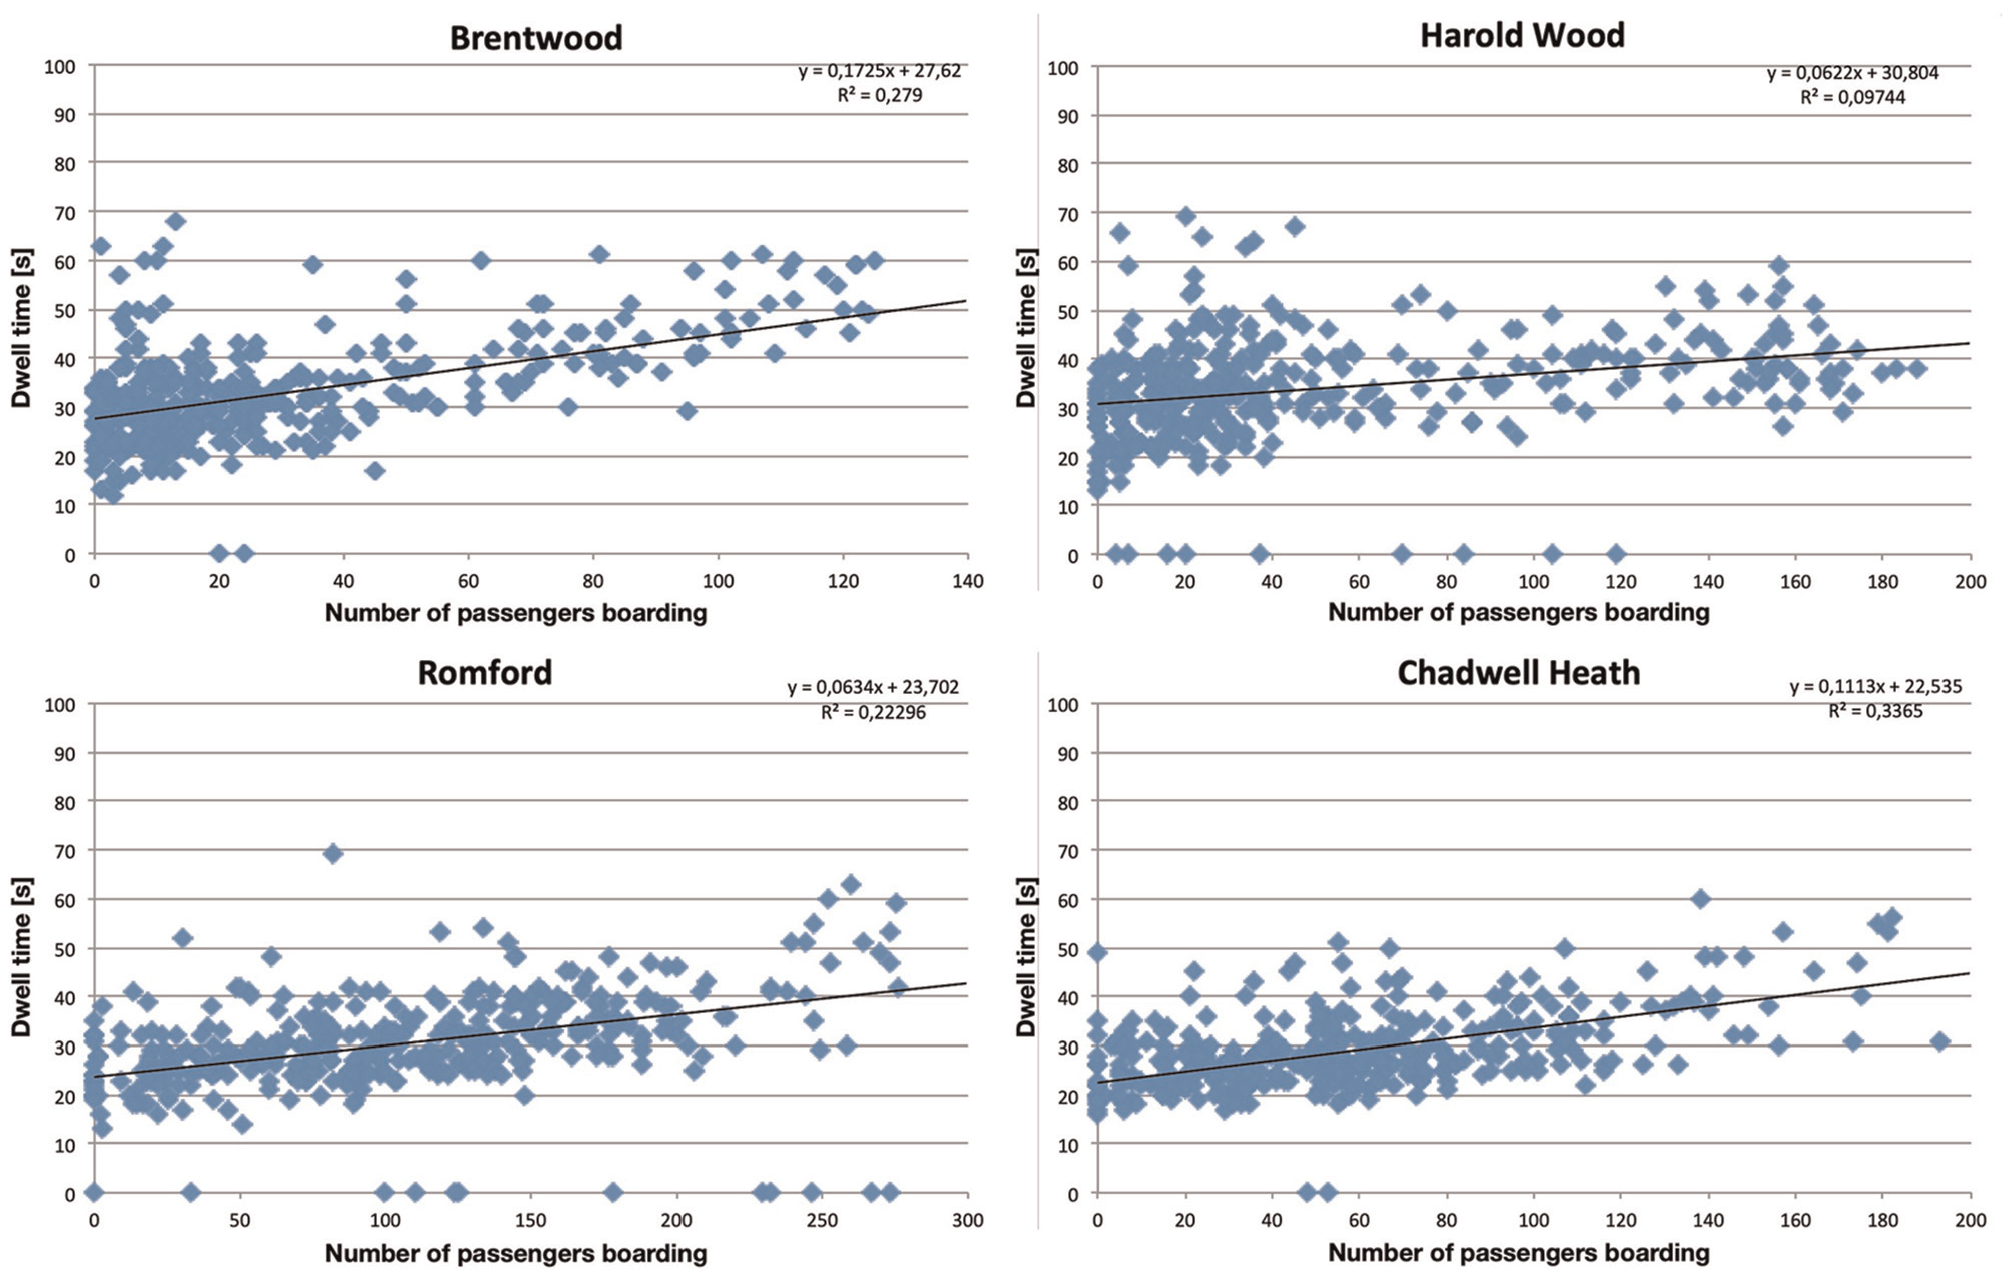
Relationship between number of passengers boarding and dwell time.
In summary, this step estimated passenger loading on actual trains, developed a minute-sharp O/D matrix, and estimated the relationship between passenger boardings and dwell times for all stations.
Combined Analysis of Train and Passenger Data
Once the operating and passenger data had been collected and prepared, it was possible to analyze the train delays and passenger volumes on board actual trains in detail. The detailed data is presented in Figure 4.
Figure 4 shows the number of passengers on board each train at arrival in Stratford over the a.m. peak period. The figure shows planned arrival time in London on the X axis, while colors indicate the origin station of passengers. The figure shows trains that systematically operate at maximum capacity (critical trains); these trains are identified with numbers at the top of the bars. The figure clearly shows that all critical trains are followed by a train with significant residual capacity.
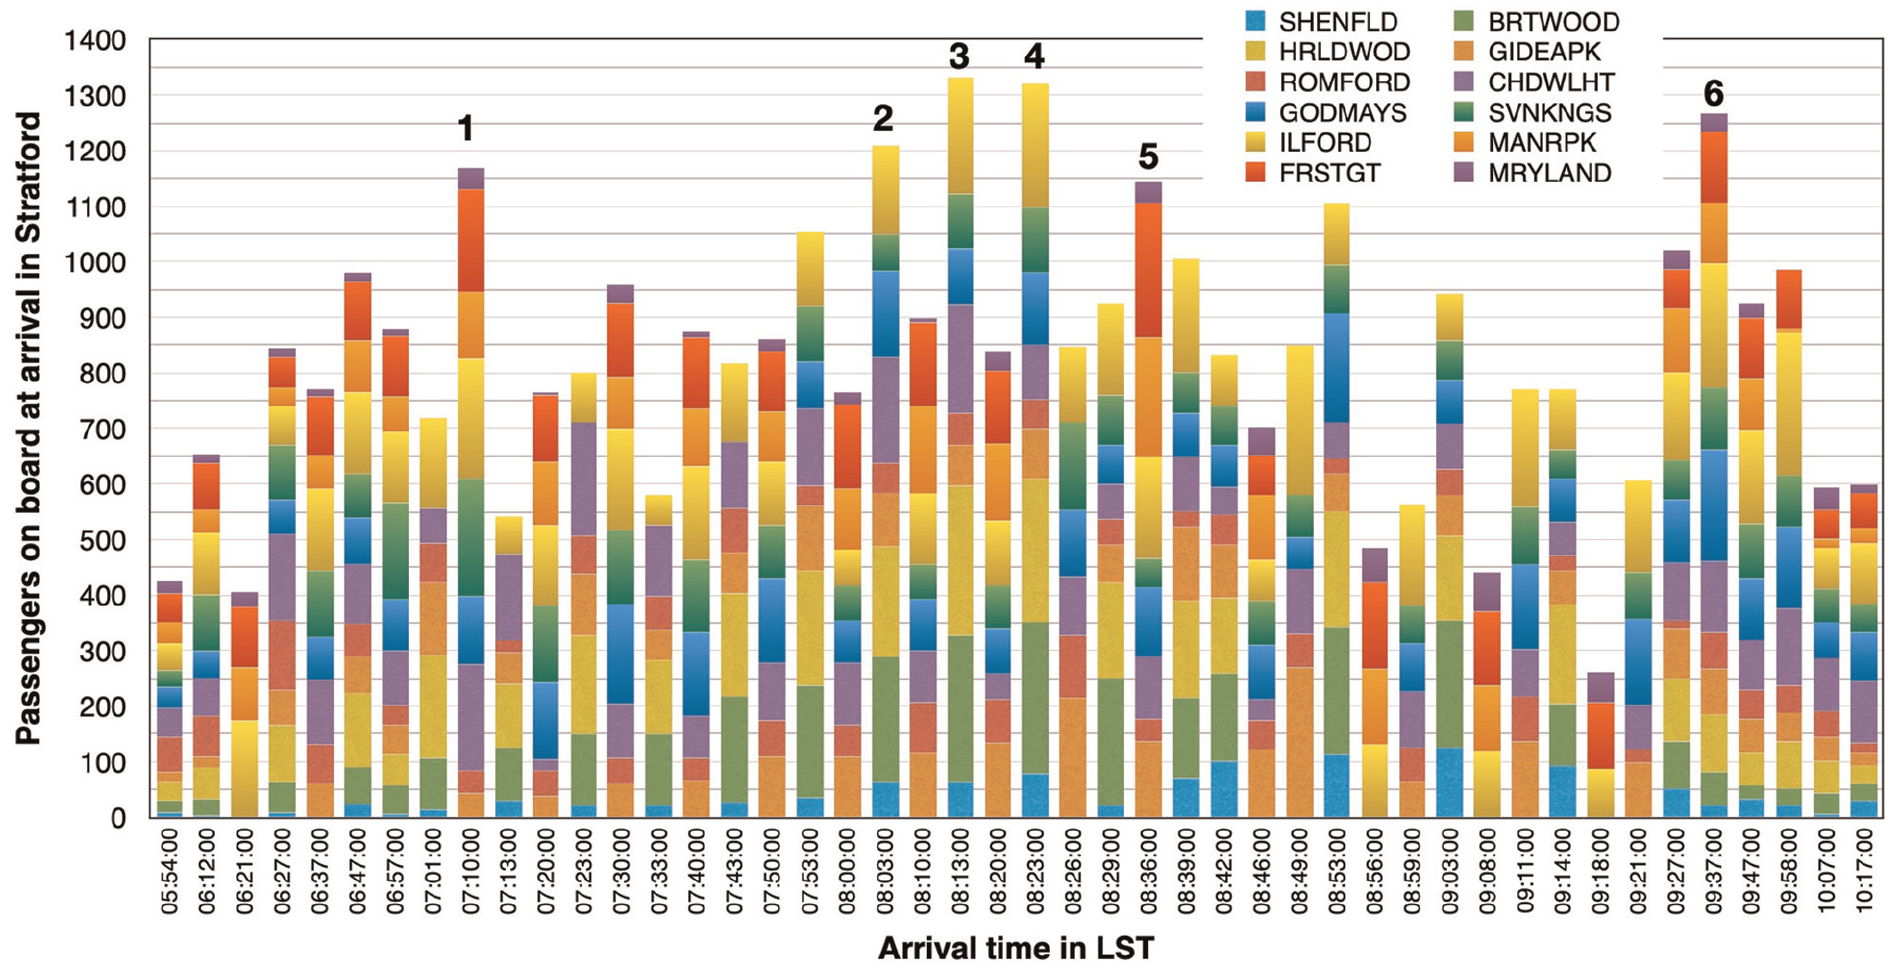
Passenger loadings during the a.m. peak period.
The reason for this uneven loading could be easily identified in the graphic timetable presented in Figure 5. The graphic timetable shows that the general service pattern consists of long services (starting in Shenfield) and short services (starting in Gidea Park). As shown, there is a longer headway before the faster long services than before the shorter and slower services. Thus, the longer Shenfield services not only call at three additional stations at the beginning of the line, but also attract more passengers at all the other stations.
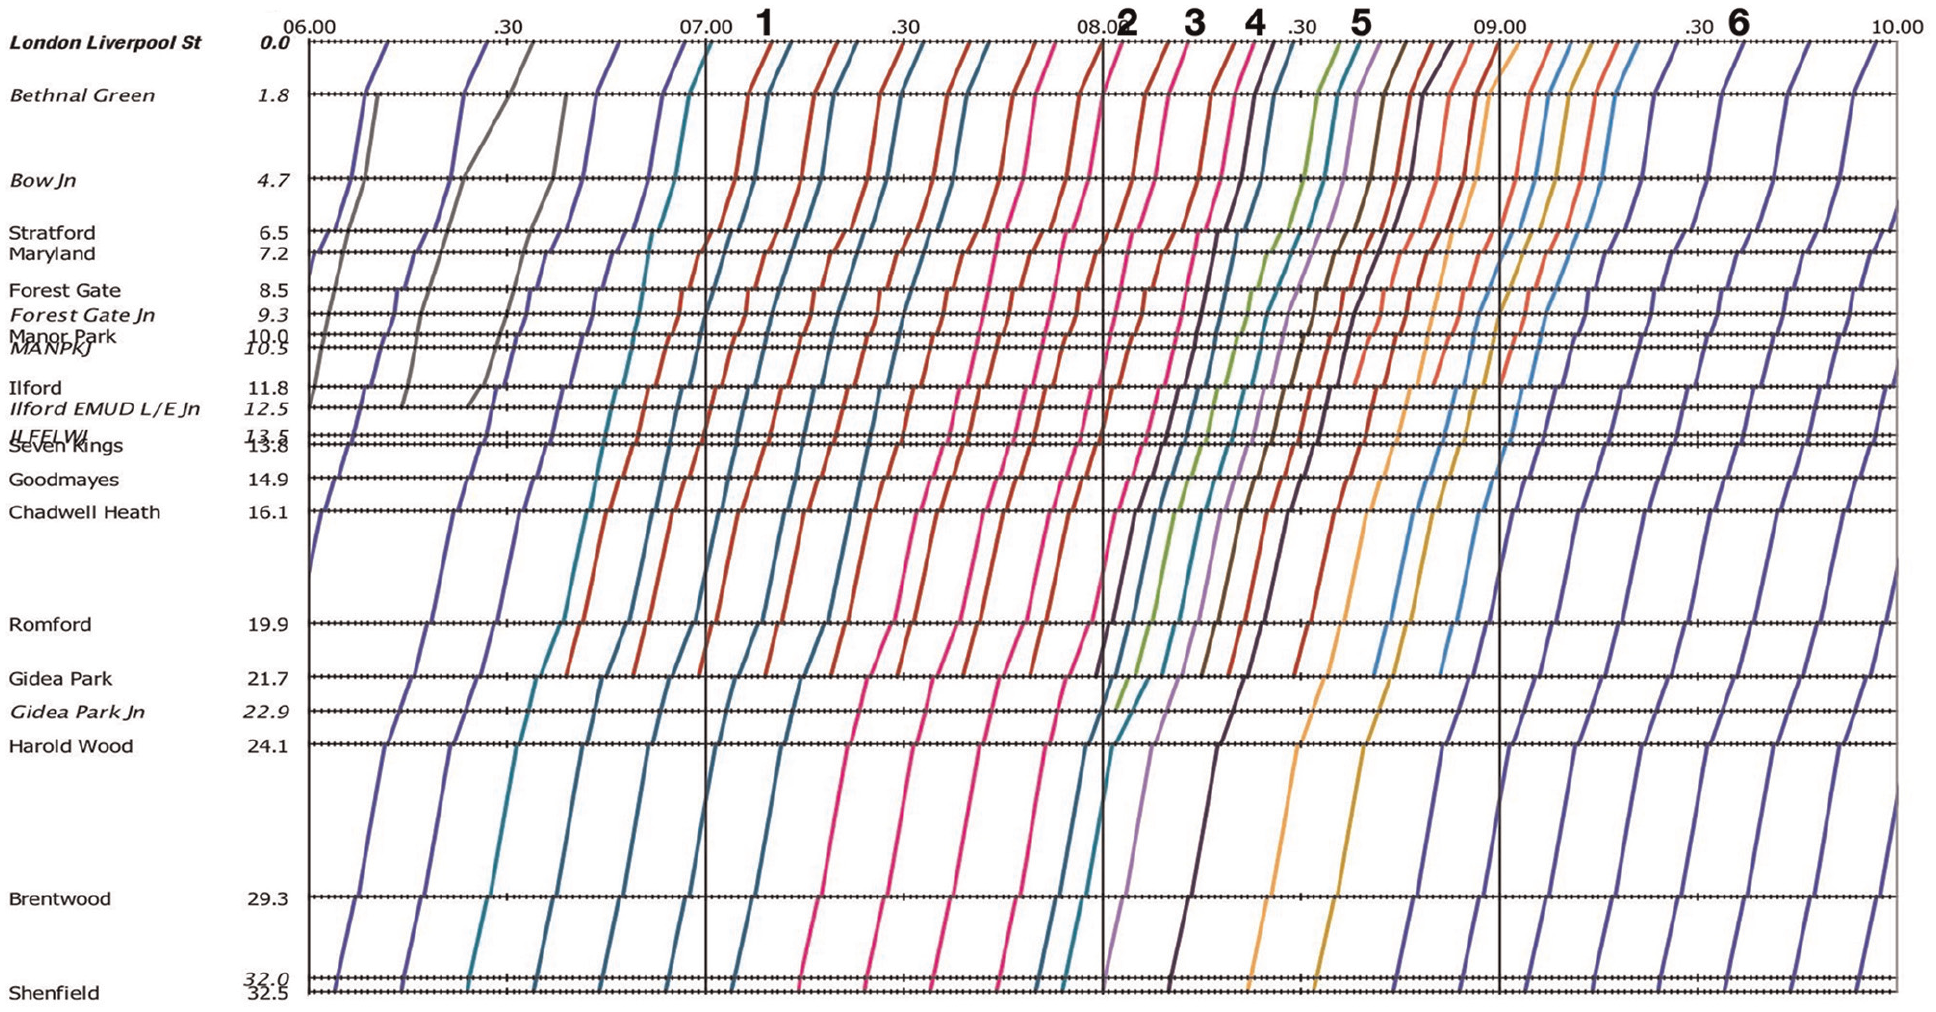
Graphic timetable for trains shown in Figure 4.
Developing an Improved Timetable
The analysis outlined above showed that the root timetable-related causes of continuing delays were the uneven headways in the first shoulder of the peak (which were particularly unfavorable to the longer Shenfield services), and the too-short headways in the super-peak (8:20 to 9:00 a.m.) Reducing overcrowding was particularly important, since dwell times increase over-proportionally when trains are almost full (although this could not be shown statistically using the specific Oyster card data available for this study). Since the Shenfield line is operated at very high density, overlong dwell times caused by packed trains quickly create delays that propagate to the following trains.
Once the root causes for delays had been identified, it was possible to start developing timetable adjustments to reduce these delays. There were many constraints placed on these adjustments: the study needed to be completed quickly, no new rolling stock was available, and the service needed to comply with the concession agreement’s strict service requirements (e.g., there was very limited ability to skip stops). These constraints limited the range of possible improvements that could be considered to two: adjusting running time margins, and slight changes to stopping patterns.
The first step in developing these timetable adjustments was to divide the a.m. peak period into four sub-periods: early service, first shoulder, super-peak, and second shoulder, since the possible adjustments varied for each sub-period. Next, specific timetable adjustments could be identified and tested.
For the early service, the main issue was the long gap in trains at most stations before arrival of the 07:10 train (arriving at Liverpool Street Station) indicated as number 1 in Figure 5. This gap delays the train by increasing the number of passengers boarding. Since the immediately previous train (light green line) skips most stops, there is a significant 15-min gap between trains at many stations. The overlong gap was solved by adding the skipped stops to the previous service.
In the first shoulder, the problem was also the small headway between the short and long services, which causes overcrowding on the long services. This was addressed by making headways in the shoulders of the peak more regular by adding a stop at Maryland to the longer Shenfield services and adjusting the running time margins of the faster services to make the planned time between Ilford and Stratford more similar to that of the shorter Gidea Park services. This reduced the speed difference between the longer services and shorter services, thus making the longer services slightly less attractive to passengers at inner stations.
In the super-peak, the problem was the uneven headways between short and long services. To address this problem, the current timetable structure during the super-peak was modified fairly significantly by scheduling trains a little earlier to slightly anticipate the super-peak’s start (to reduce overcrowding on the most critical trains), and then by evening-out all headways in the super-peak. More specifically, headway intervals were increased until the deterministic simulation proved that the new timetable was conflict-free. The 08:23 arrival at Liverpool Street Station (4 in Figure 5) was expected to carry fewer passengers, and some stops were added to the following services to create regular headways before the 08:36 train arrival (5 in Figure 5) shown in light green. The 08:50 and 08:53 arrivals were inverted to even the headways from Shenfield, and the following train from Ilford extended to Chadwell Heath to increase the number of passengers potentially using it.
In the second shoulder, a more regular pattern similar to the first shoulder was proposed.
The proposed timetable adjustments were accepted by MTR with slight changes to make them more consistent with the Timetable Planning Rules; the only significant change was the further extension to Gidea Park of the Chadwell Heath service; this was done by MTR for operational simplicity (to avoid having a single turnback at one location). Figure 6 compares the December 2015 timetable (dashed lines) and proposed timetable (solid lines). The line color indicates a different stopping pattern.
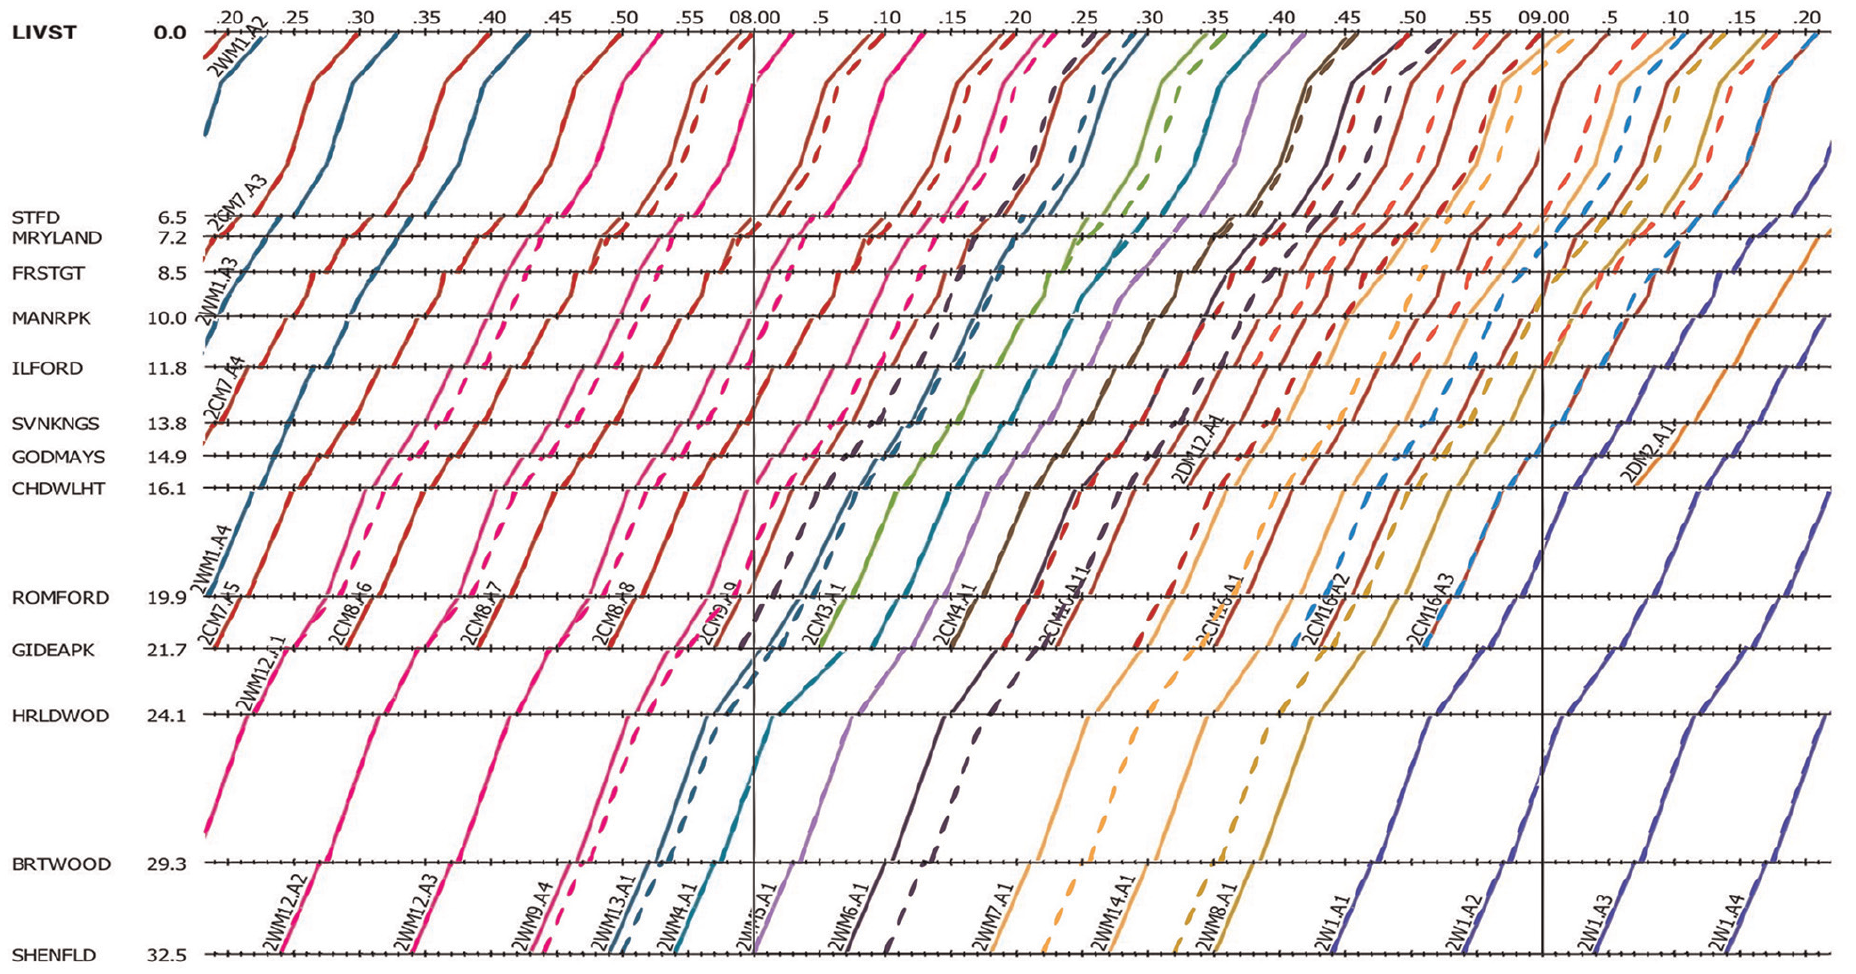
Timetable comparison: December 2015 (dashed lines) versus proposed (solid lines).
Simulate and Analyze Improved Timetable
The proposed timetable was tested in two ways. The first consisted of simply assigning the O/D matrix to the new timetable, and comparing the resulting passenger loadings to the original timetable loadings. Figure 7 shows this comparison for the new timetable in the most critical section (arrival at Stratford).
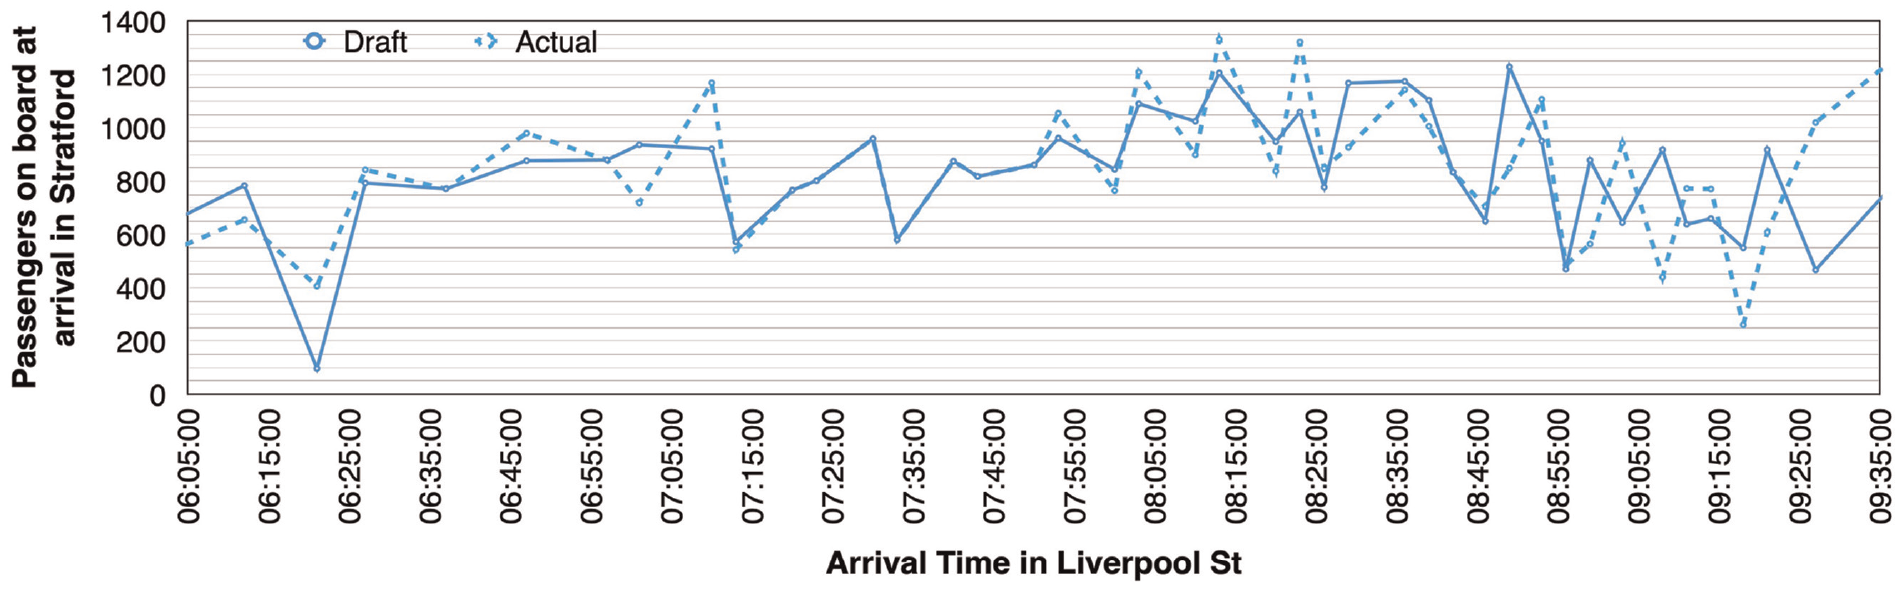
Evaluation of the proposed timetable: impact on passenger loadings at Stratford Station.
The dashed line shows passenger loadings for the original timetable, and the solid line loadings for the proposed timetable. The diagram clearly shows how the proposed timetable would reduce loading on the most critical trains, both at the beginning of the peak and during the super-peak. The figure also shows that rescheduling trains to anticipate the super-peak increases loading on several trains at the end of the peak period (although not to critical levels).
The new timetable was also tested using stochastic microscopic simulation (outlined above) to estimate its impact on service reliability. More specifically the simulation evaluated arrival punctuality within 3 and 5 min at Stratford and Liverpool Street Station.
The stochastic simulation considered three components. The first was variability of driver behavior (estimated during a previous study) and the second was input delays, obtained through analysis of operational data. The third stochastic input was dwell time. In this case using actual values would not have reflected the more equal train loadings in the proposed timetable, and therefore would underestimate its benefits. Therefore, the linear relationship between passenger boardings and dwell time for each station (presented in the section on data collection above) was used to estimate dwell times for the proposed timetable, and these dwell times were used in the stochastic simulation to represent the variability of dwell times.
The simulation was repeated 100 times, thus obtaining a set of data comparable with almost 4 months of real operations. First, a simulation of the original timetable was performed to validate the model against real data and estimate the residual model error. Next, the proposed new timetable was tested and compared with the original timetable.
Figure 8 illustrates simulation results comparing 3 and 5 min delay at Liverpool Street Station for the original timetable (dashed lines) to the proposed new timetable (solid lines). Figure 8 clearly shows the benefits of the proposed new timetable; it maintains higher punctuality during the super-peak, and has a more stable overall performance, which is particularly relevant for the worst-performing services.
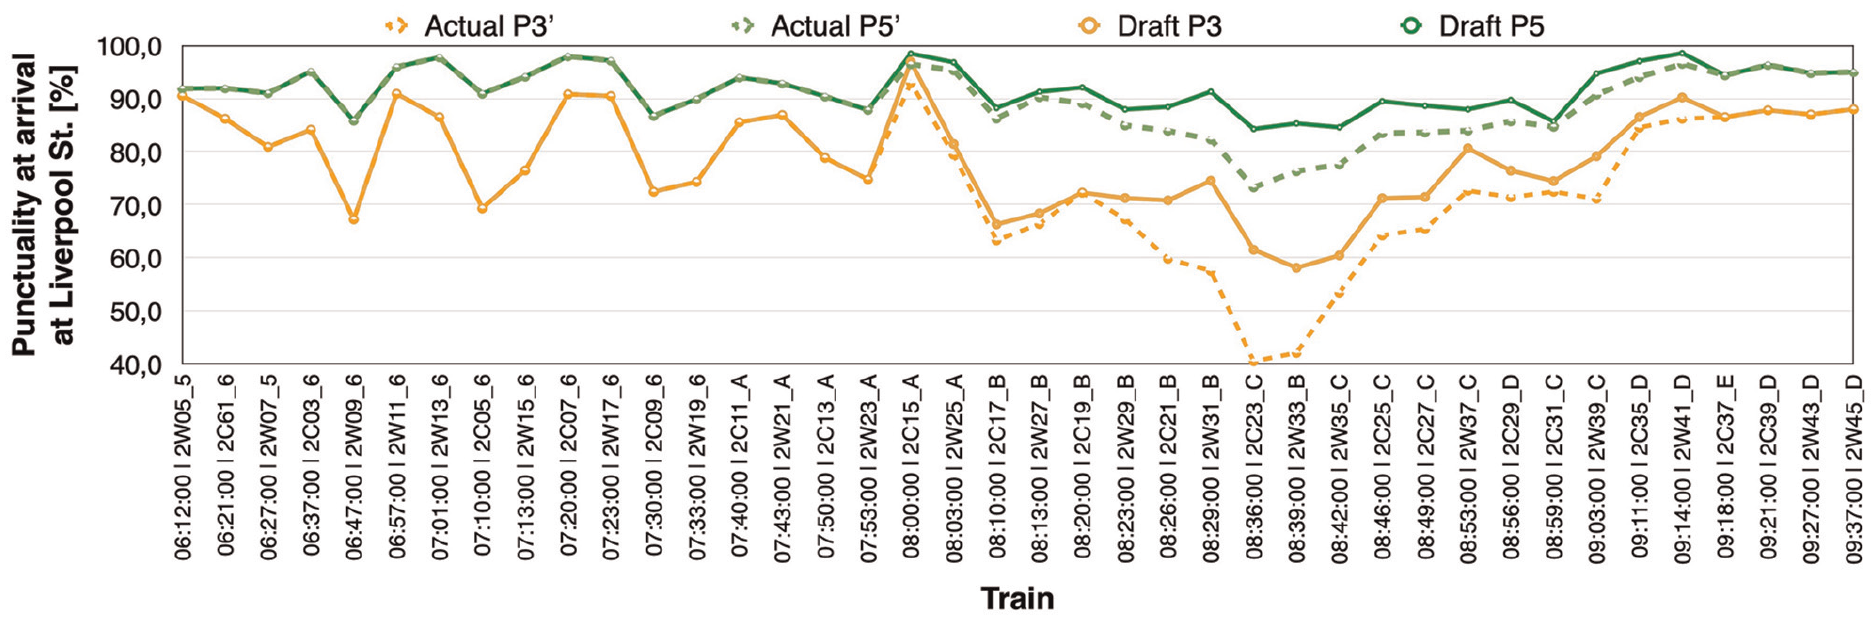
Evaluation of the proposed timetable: punctuality within 3 and 5 min at Liverpool Street Station—simulated delays with proposed timetable (solid lines) versus the original timetable (dashed lines).
Study Results
The study recommendations were implemented in minor timetable adjustments made in May 2016 to the a.m. peak period trains. Before and after delay data were collected to determine the effectiveness of the timetable adjustments. Four weeks of data (Monday to Friday) were collected before the adjustments, and 4 weeks of data were collected after implementation. These data are considered to be representative as they were collected from a time period (May–June) when the weather is generally stable and before vacation periods.
The timetable adjustments led to a significant reduction in delays and improvement in service. Figure 9 compares delays at all stations for a train arriving about 8:35 a.m. in Liverpool Station in the 4 weeks before and after implementation of the timetable adjustments. It shows that the train delays are reduced for all stations, although slight delays are still visible.
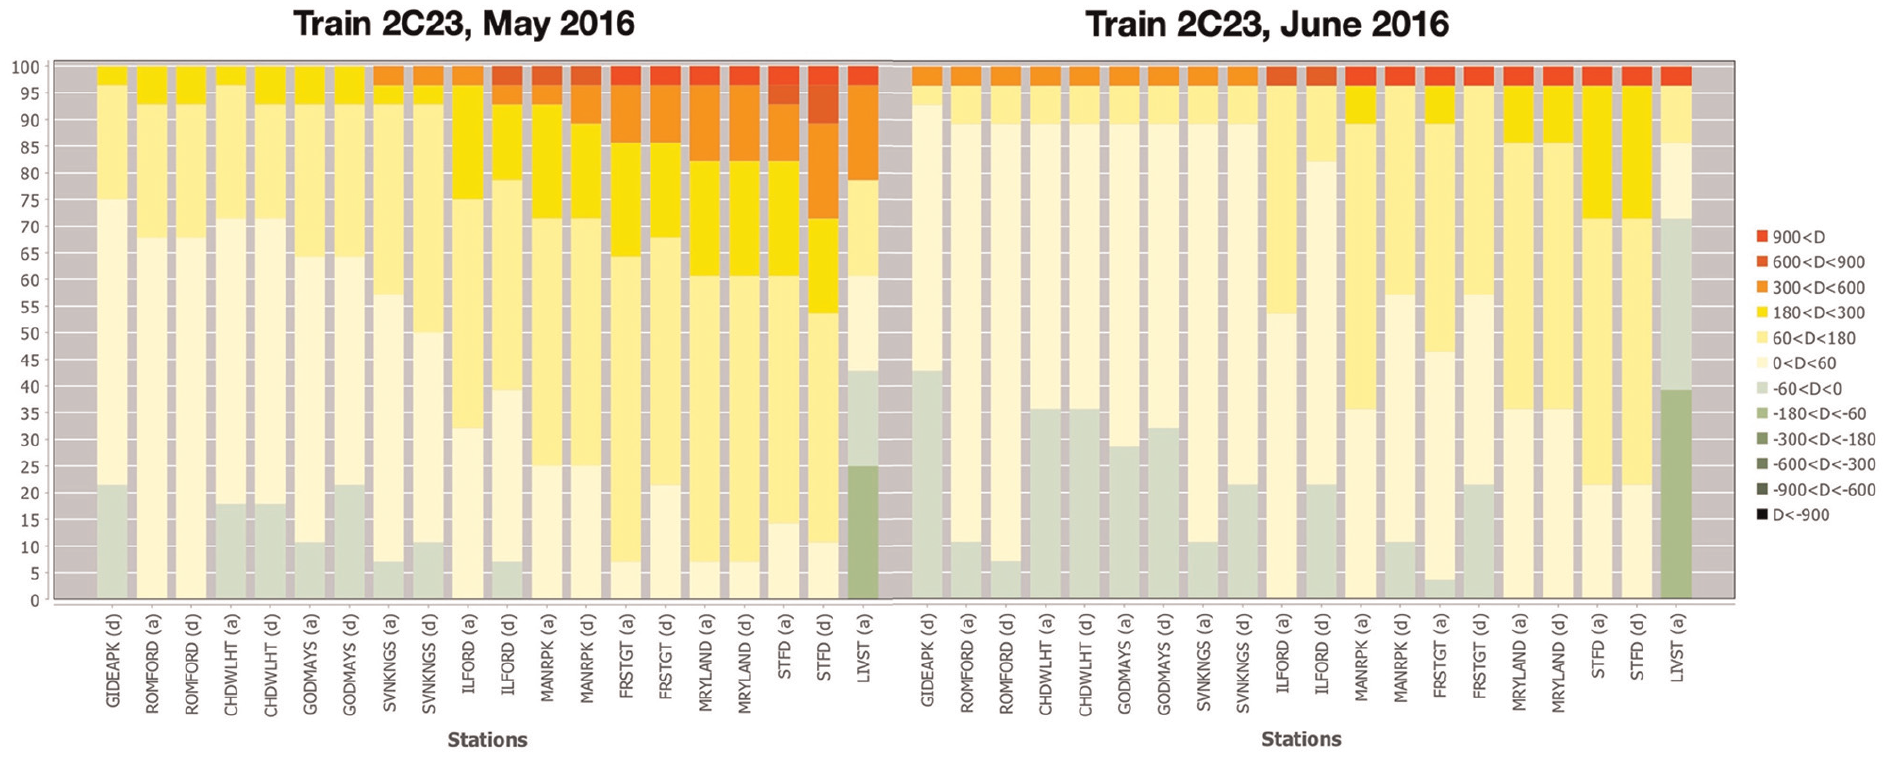
Delay comparison along the line of a critical train before and after timetable change.
The punctuality of all trains operated during the peak period also improves significantly. Figure 10 compares the number of trains that arrived within 3 and 5 min of scheduled time during the peak period at the Liverpool Street Station. As shown, the service is demonstrably better, especially during the middle of the peak (between 8:00 and 9:00 a.m.), and has quite similar performance for later services. The key performance metric for the operator, punctuality within 5 min at the destination station, increased by 2.9%, from 92.7% to 95.6%, in the time period considered in the study (06:30–10:00). Even more remarkable was the improvement in punctuality during the super-peak (08:00–09:00) which increased by 6.2%, from 87.2% to 93.4%.
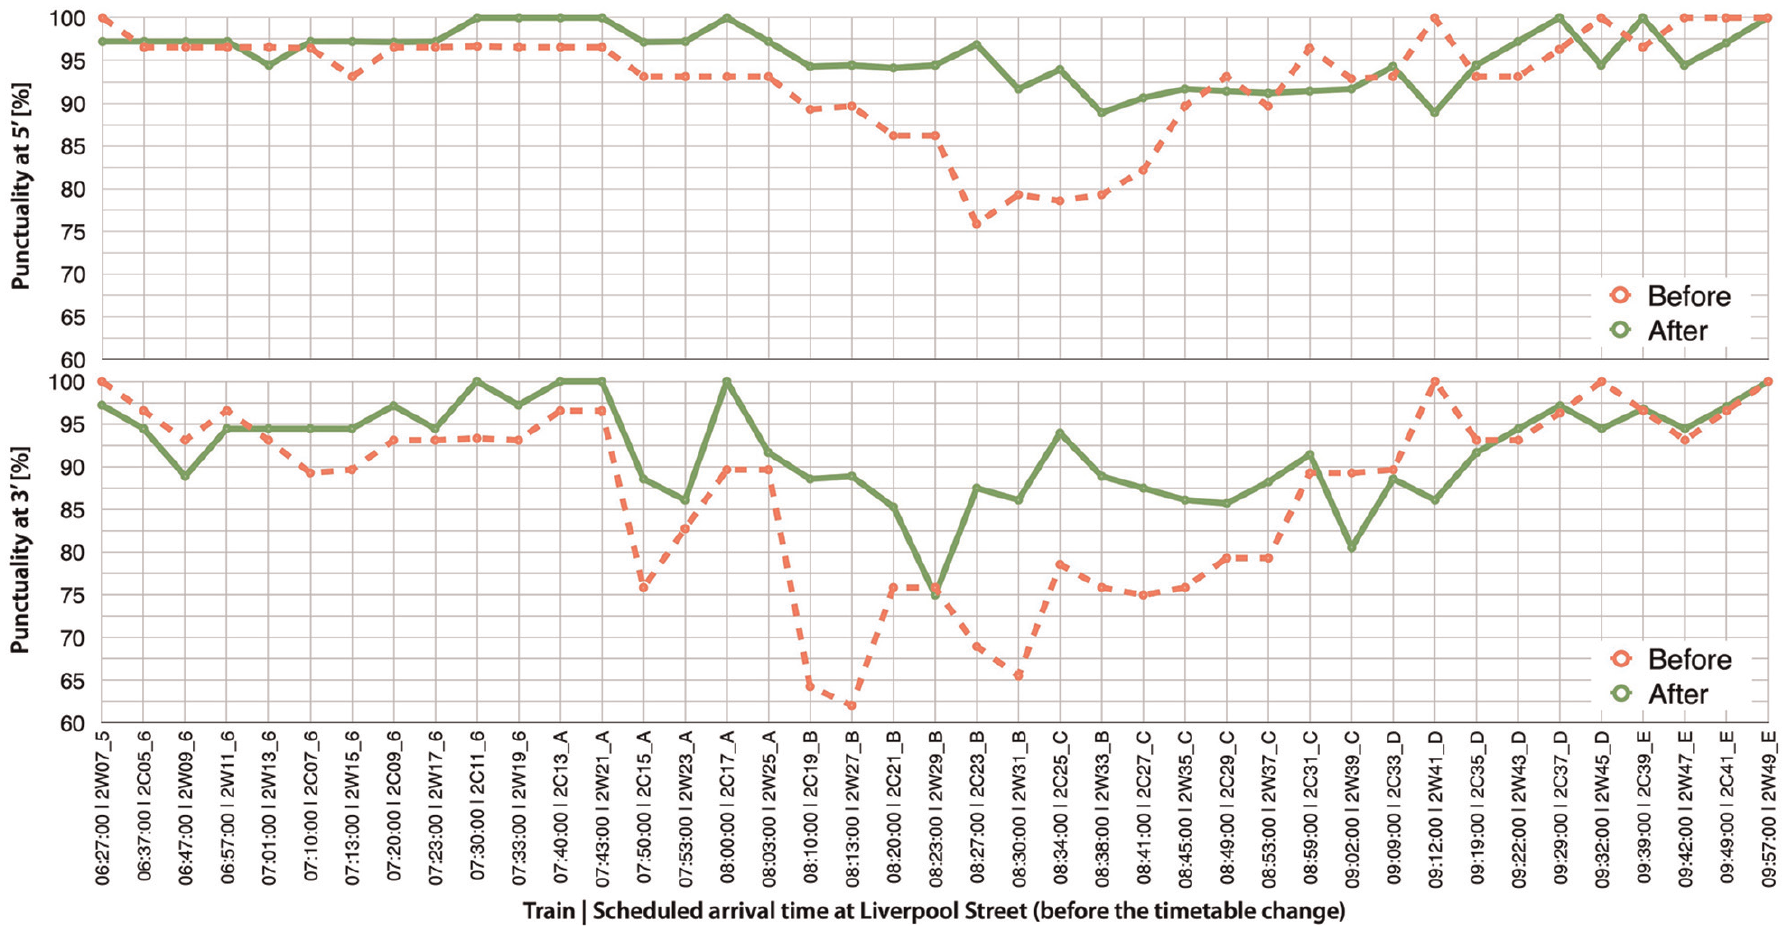
Arrival time punctuality at Liverpool Street before (red dashed lines) and after (green solid lines) the timetable change.
Practical Implications and Method Transferability
The study methodology is a practical approach for improving the operation of busy railway lines. It supports timetable planning by helping analysts identify weaknesses in the current service, and accurately testing timetable changes. The method can be applied to any urban or suburban railway network with the following characteristics:
Service is operated frequently enough so that passengers do not consult the timetable, they simply go to the station (i.e., less than 10-min headway);
A minute-sharp O/D matrix is available (or can be developed);
Passengers follow an obvious routing to reach their destination (if this is not true the work flow would remain the same, but a more refined route choice model should be used).
The method uses AFC data, but if this data is unavailable passenger count data could be collected manually or with passenger counting devices at stations, as long as all trains stop at all stations (which means that all passengers on the platform board the first available train).
It is also possible to extend the method so that it can be used to estimate passenger delays and travel times. These could then be used as a demand-oriented performance measure.
Conclusion
Improving service on densely scheduled railway lines is important for railways seeking to increase efficiency and better serve passengers.
New software tools and the availability of new data (e.g., from AFC systems, vehicle monitoring devices such as OTMR, and digital railway signaling systems) can help timetable planners identify problems and develop effective scheduling solutions. Stochastic simulation techniques are especially helpful for complex railway networks because they are based on actual railway operating data and therefore can more precisely model expected performance.
In the Shenfield Line study, stochastic simulation tools and data from AFC systems was combined with scheduling experience to develop a set of minor timetable adjustments designed to improve operations. These adjustments were implemented in May 2016 and led to a significant reduction in delays: punctuality at the destination station increased by 2.9% in the a.m. peak period and by 6.2% in the most critical hour (8:00–9:00 a.m.). The data analysis and timetable development was completed in a few weeks using an existing microscopic simulation model. Thus, the proposed method proved not only accurate and successful, but also effective for use in standard railway planning time frames. The method can be used on other railway lines for which similar data are available; the only caveat is the need for a usable algorithm for assigning passengers to trains, which in this case—similar to many other suburban lines—could be extremely simplified.
Much of the analysis of passenger data was completed using customized spreadsheets developed for the study. One recommendation for future research is investigating options for automating these manual processes and integrating them into railway planning software. Additional data from sources such as OTMR could also be used to improve the analysis process.
Another topic for future research is obtaining more information on passenger movements through the public transport network and vehicle boarding. For example, most AFC systems today cannot distinguish which route a passenger uses when there are multiple possible routes (they only collect data from entries and exits to the whole system). This is especially problematic for dense networks like London, where, unfortunately this data is most needed. Similarly, better models of passenger station arrival data would be useful for better estimating dwell times.
These improvements would be helpful in the effort to develop a method focused on reducing actual passenger delays rather than train delays, and thus give railways a tool for significantly improving customer service.
Footnotes
Author Contributions
The authors confirm contribution to the paper as follows: study conception and design: G. Medeossi; data collection: G. Medeossi; analysis and interpretation of results: G. Medeossi, A. Nash; draft manuscript preparation: G. Medeossi, A. Nash. All authors reviewed the results and approved the final version of the manuscript.
Declaration of Conflicting Interests
The author(s) declared no potential conflicts of interest with respect to the research, authorship, and/or publication of this article.
Funding
The author(s) disclosed receipt of the following financial support for the research, authorship, and/or publication of this article: The work described in this paper was completed as part of G. Medeossi’s on-going technical services contract with MTR.