
Abstract
Granular sodium formate (NaCOOH) is a popular deicer used at airports. It is mainly used to weaken compacted snow/ice and thereby facilitate mechanical ice removal. Earlier research has developed a set of methods quantifying deicer performance, but linking these test results to operational guidelines is difficult. The main objective of this study is to increase the knowledge of how temperature and prewetting affect the ice penetration performance of granular sodium formate. A new method to evaluate the development of ice penetration process is presented here. Ice penetration tests were performed with single grains on large, optically clear ice cubes, and digital image analysis is used to quantify the initial waiting time, penetration rate and –depth, and melted volume. Eighteen tests including dry and prewetted sodium formate grains were performed at three different temperatures (–2°C, −5°C, and −10°C). Prewetting reduced the initial waiting time (the time it takes before the particles started to penetrate) by a few minutes at −10°C, but at higher temperatures, this reduction was insignificant. The particles penetrated the ice at a constant rate. At −10°C, the particles penetrated at 10–15 mm/hour, while at −2°C this speed is about five times higher. Prewetting does not seem to have a clear beneficial effect on the penetration rate. Suggestions are given on how to capture the results from this study into operational guidelines for deicing operations at airports, using sodium formate as deicer.
Air transport provides fast and cost-effective movement of freight and passengers around the world. During the winter season, the accumulation of snow and ice on runway surfaces poses a potential risk of both delays and accidents because airplanes need a certain level of tire–pavement friction for safe take-offs and landings. Preventing the build-up of slippery layers of snow and ice is not always possible, so reactive methods such as sanding, plowing, and deicing are needed to control and mitigate the effect of snow or ice on the runway.
Deicing is a method where chemicals (hereafter called deicers) are applied onto the runway to assist the removal of ice layers. A standard deicing operation at airports is performed in three steps. Firstly, any loose snow or loose ice particles are removed by snow-clearing equipment. Such equipment typically consists of a truck with a front-mounted snowplow and a trailer consisting of a rotating steel brush and an air blower. In the second step a solid (granular) deicing chemical is spread over the runway. The particles’ main function is to penetrate through the ice layer. This perforates the ice layer and thus weakens it. If the deicer particle reaches the pavement, it can continue melting horizontally and further weaken the ice–pavement bond. This process is called undercutting (1, 2). The third step is to mechanically remove the weakened ice layer by scraping, brushing, and blowing.
The two most-used deicing products on airfields in Norway are Aviform S-Solid™ and Aviform L50™. Aviform S-Solid™ is a granular deicer that consists of 98 wt% sodium formate (NaCOOH) (3). Aviform L50™ is a liquid deicer that consists of a 50 wt% potassium formate (KCOOH) solution (4). The liquid deicer is mainly used as an anti-icing agent, but it is also applied as a prewetting liquid for the granular deicer, or directly onto very thin ice layers. The solid deicer is used to weaken thicker ice layers.
Formate-based deicing chemicals are organic salts and thereby bio-degradable. Despite being degradable they still have negative environmental impact because the decomposition process requires oxygen (5). The cost per ton of formate-based chemical is much higher than chlorides and formates can also cause some degree of corrosion on planes, ground support equipment, and electrical systems (6). Based on those concerns there is a wish within the industry to reduce the usage of deicing chemicals. One way of doing this is by developing comprehensive guidelines for practitioners that optimize their utilization. These guidelines are ideally based on sound fundamental knowledge about deicer performance, combined with practical experience.
Throughout the years, researchers have developed various methods to quantify deicer performance. Research done in association with the Strategic Highway Research Program (SHRP) had significant influence on standardizing the performance indicators, as well as shaping up methods to measure those properties. In that work, Chappelow et al. describe three main measures to quantify the performance of solid deicers as: melting performance, quantified with “SHRP H-205.1 ice melting test”; penetration, tested with “SHRP H-205.3 ice penetration test”; and undercutting, specified in “SHRP H-205.5 ice undercutting test” ( 1 ). Those procedures were suitable for comparing different deicers, but high variability in results and limited correlation with field observations makes it difficult to use these tests for developing guidelines ( 7 ).
Several test methods have been developed in an attempt to improve the accuracy of the orginal SHRP tests. Koefod et al. used ice cube titration, where ice cubes were melted in a diluted brine of the tested chemical ( 8 ). A shaker test and improved shaker test tried to solve the issue that the melting process needs to be fully completed before ice melting capacity can be measured ( 9 , 10 ). Nilssen et al. developed used calorimetry, which prevents physical separation of the ice from the meltwater ( 11 ). Muthumani et al. gives an in-depth description of the main pros and cons of various testing methods, but a recurring observation is that the tests lack a direct translation to field performance, thus giving practitioners limited possibility of efficient application of the results in their local environment ( 7 ).
The aim of most of the improved tests is to precisely measure the melting capacity (how much ice it is possible to melt with a known amount of deicer) and the melting rate (how fast the deicer can melt the ice). The focus on those properties leaves a demand for reliable and consistent methods for measuring deicer penetration and, to some extent, undercutting (7). In addition, most of the experiments were performed with deicers commonly used for road deicing, namely sodium chloride (NaCl), magnesium chloride (MgCl2) and calcium chloride (CaCl2) (12, 13). No documented research data has been found for the melting performance of formates (NaCOOH and KCOOH) using improved methods.
Some practitioners add a prewetting liquid to the granular deicer, which is believed to “boost” the deicing performance of granular products. Earlier research has shown that blending rock salts with a liquid solution before the application can increase the effectiveness of the deicer in low temperatures (14). The effect of the presence or absence of a prewetting liquid, as well as different prewetting ratios for sodium chloride and other commonly used salts, has been tested, but also in this subject, there seems to be a lack of quantified results specifically for formates.
The main objective of this study is to increase the knowledge about how temperature and prewetting affect the ice penetration performance of sodium formate granules. To do so, a new method was developed that better reflects conditions in the field, compared with the SHRP H-205.3 ice penetration test. The scope of the study was narrowed by evaluating only one type of granular deicer (sodium formate), testing at three different temperatures, with and without the addition of a prewetting solution.
The Ice Penetration Process
A granular deicer can melt ice because it creates a deicer solution that has a freezing point that is lower than the temperature of the ice (15). The (concentrated) deicer solution is thermodynamically more attractive than the ice lattice, causing the frozen water molecules to melt into the deicer solution. In chemistry the “attractiveness” of a given phase is better known as the chemical potential, and ice can melt as long as it is in contact with a solution that has a lower chemical potential than the ice (16). When water molecules from the ice melt, it dilutes the solution and more solid deicer chemical can dissolve as well. This dissolving of the deicer keeps up the chemical concentration and ensures that the freezing point (and thus the chemical potential) of the solution remains low. As this process continues, the shrinking deicing particle sinks deeper into the ice, leaving a cavity filled with diluted deicer solution. The speed of the melting is found to be directly linked to the driving force (difference in chemical potential) and the diffusion coefficient of the chemicals in water (16). The melting process continues even when the deicer particle is fully dissolved, but now the additional meltwater dilutes the solution and causes the freezing point and chemical potential to rise.
The melting process is strongly endothermic (–334 kJ/kg ice) and this causes the temperature of the ice and solution to drop. Heat from the environment can now flow towards the colder solution and the solution (and ice) temperatures rises again (17). The melting process is finished when the ice and the solution have reached thermal equilibrium with the environment and the freezing point of the solution matches the ambient temperature. At this point, the ice melting capacity is reached.
The function of prewetting is often explained by “kick-starting” the ice melting process. Indeed, adding a liquid deicer solution to prewet the granular deicer can facilitate the ice melting because it provides the medium for the granule to dissolve in.
Methods
Ice penetration tests were performed by placing a single grain of commercial sodium formate deicer (Aviform S-solid™) on clear, bubble-free ice (3). A small amount of dye (Eosin B, CAS number: 548-24-3) was added to color the produced meltwater. Two cameras (Canon EOS 100) were placed on tripods around the ice sample, so that they faced perpendicular sides of the ice cube. Both camera models were Canon EOS 100 equipped with standard 18–55 mm lens. The lens-to-target distance was 30 cm. The image resolution was 5184 × 3456 pixels, which corresponded to 24 pixels/mm in the focal plane. The cameras took photos from the front and side of the ice cube simultaneously at 15 s intervals. The tripods were regulated so that the top of the ice cube was placed at the center of the image. A small leveler was used to ensure that the top was horizontal, to prevent the runoff of meltwater and prewetting solution off the edges. The experimental setup is illustrated in Figure 1a.
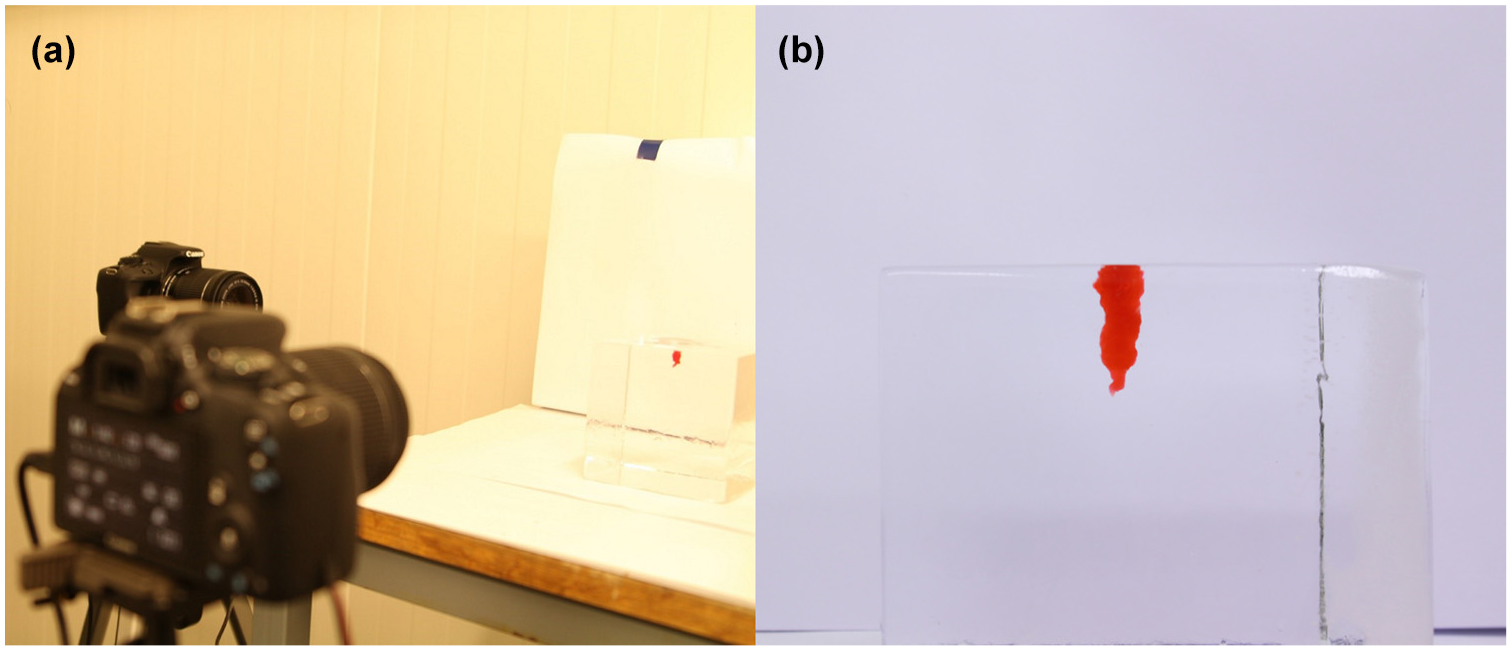
(a) Illustration of the test setup, and (b) the ice cube (10×10×10 cm) viewed from camera 1.
Ice Sample Production
A large block of bubble-free ice was grown in a plastic box (55×35×27 cm) that was placed on an aluminum plate and insulated from the sides and the top with 5 cm extruded polystyrene (XPS) insulation plates. The inside of the box was covered with a thin plastic liner. The box was filled with 27.5 liters of tap water (resulting in a water depth of 20 cm) and placed in a walk-in cold room at −20°C. A fan was placed under the box to achieve a constant flow of cooling air for the bottom water layers. Two submersible aquarium pumps were placed near the water surface to circulate the water. This setup caused the ice to freeze from the bottom upwards and any possible air bubbles were not trapped in the ice. The freezing process went on until the ice layer was at least 10 cm thick. At that point, the remaining water was pumped out and the ice block (and plastic liner) was removed from the box. The block was allowed to warm up to −10°C before it was cut with a band saw into 15 cubic samples with dimensions 10×10×10 cm. The ice samples created by this method had a mean density of 915 kg/m3. They were wrapped in plastic to prevent sublimation and stored in a freezer at −15°C.
Test Procedure
The tests were performed in a cold walk-in lab that was set to desired temperature at least 48 hours before the test. At the same time, the ice specimens were moved into the lab. A warm aluminum plate (25°C) was used to quickly melt/polish the sides of the ice cubes. This removed any irregularities left from the sawing and created ice cubes that were optically transparent. Deicer samples and dye powder were placed in the lab at least 24 hours before the test. All sodium formate grains were weighed before the test. The biggest grains from the sample, with weight ranging from 0.0553 g ± 0.0001 g to 0.1178 g ± 0.0001 g, were used for the test. For each test, a single grain of sodium formate was rolled in a small amount of the dye powder and placed on top of the ice cube with a pair of tweezers. For the prewetted tests, 20 vol% (using a bulk density of 950 kg/m3 for Aviform S-Solid™) of Aviform L50™ (50 wt% KCOOH solution) was added with a micropipette within seconds after the grain was placed on the ice. This corresponded to a 26 wt% prewetting ratio. Each test was repeated three times and every test took between 2.5 and 3 hours to ensure that the deicer was completely diluted, and an equilibrium was reached. This was also confirmed by temperature measurements that displayed meltwater temperature equal to the ambient temperature of the cold room. The temperature of the solution was measured using a PT1000 probe thermometer (Ebro TFX 410-1) after each test was completed. The final volume of the meltwater was determined by sucking up the meltwater, using a 2.5 mL syringe.
Image Analysis
The photo series from each camera was post-processed by clipping out the region of interest (ROI) to minimize the color variation and limit the size, and the processing time of the photos. The ROI contained ice from the top of the cube to the bottom of the melted part. A color thresholding macro was then created based on the last photo of each series. The macro, made in ImageJ open source software, distinguished parts of the photo where the ice has melted. To achieve this, a high enough contrast was required, so red dye (Eosin B) had to be used during the tests. The photo series was then converted to a binary Tagged Image File Format (TIFF) file based on the outcome of the thresholding method. The chosen thresholding method was based on YUV color space, where the threshold of luminance parameter “Y” was manually adjusted until the whole melted area was selected. Later, any image noise and particles not connected to the melted area were removed. These steps, from the original image based on Figure 1b to the final binary image, are illustrated in Figure 2.
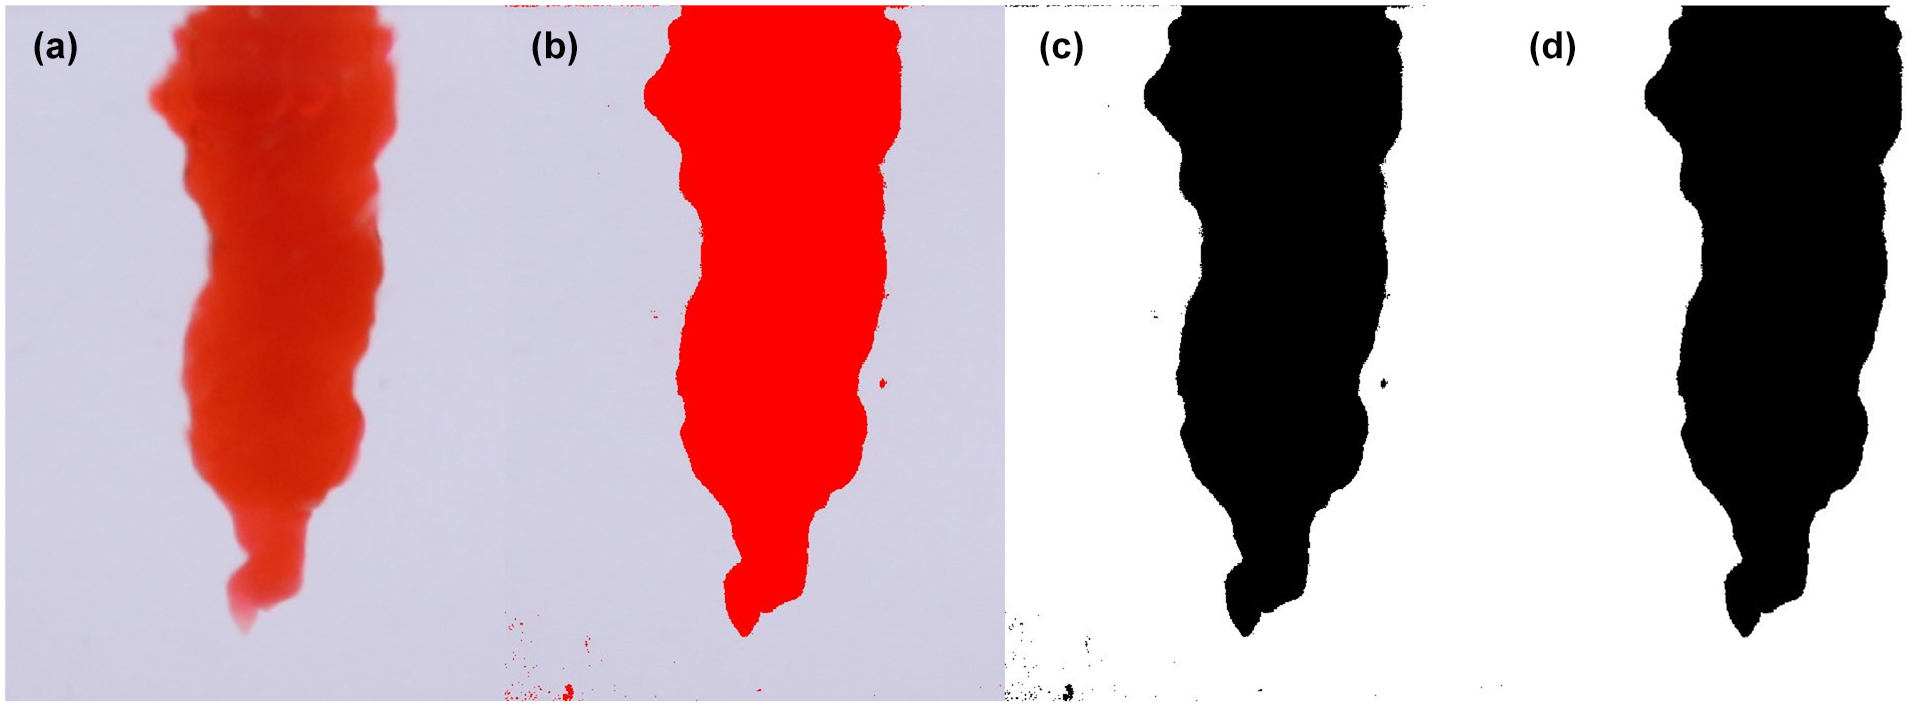
Post-processing of photos: (a) the cropped photo containing the region of interest (ROI), (b) the area that fell within the color thresholding specifications, (c) the image converted to a binary file, and (d) final binary image after noise reduction.
A Matlab script was developed to analyze the photo series. The program analyzed the processed series of TIFF images and calculated the penetration depth and volume development based on the pixel-to-millimeter ratio. The volume was calculated by dividing the shape of the meltwater into a stack of elliptical disks. Each disk had a height of 1/24 mm (1 pixel) and the area of the horizontal cross-section was given by the formula A=π*a*b, where a and b are the lengths of a semi-major and a semi-minor axis in the ellipse. Values for a and b were measured from the images taken by camera 1 and camera 2 respectively. The penetration depth was calculated based on the vertical distance between the highest and the lowest point that contained dyed pixels. The resulting volume and penetration values at each timestamp were then plotted in a graph to enable comparison between the tests.
The image analysis script calculated the volume of the melted ice based on the whole cavity, while manual measurements with the syringe gave the volume of the deicer and meltwater solution. Since ice density and meltwater density are different, a direct comparison of the volumes was not possible. Therefore, the density of the meltwater and deicer solution at equilibrium was found experimentally for each test temperature, using a 50 mL pycnometer (specific gravity bottle). In addition, a calibration factor for the syringes was found based on the difference in density measured with the pycnometer and syringes. The densities found with pycnometer were 1033.7 kg/m3 in −2°C, 1063.9 kg/m3 in −5°C, and 1113.2 kg/m3 in −10°C, while desnities measured with syringes were 1027.6 kg/m3 in −2°C, 1058.5 kg/m3 in −5°C, and 1.109.8 kg/m3 in −10°C. Those values resulted in correction factors of 1.1366 in −2°C, 1.1687 in −5°C, and 1.2204 in −10°C for conversion between solution volume measured manually with the syringe and melted ice volume.
Results
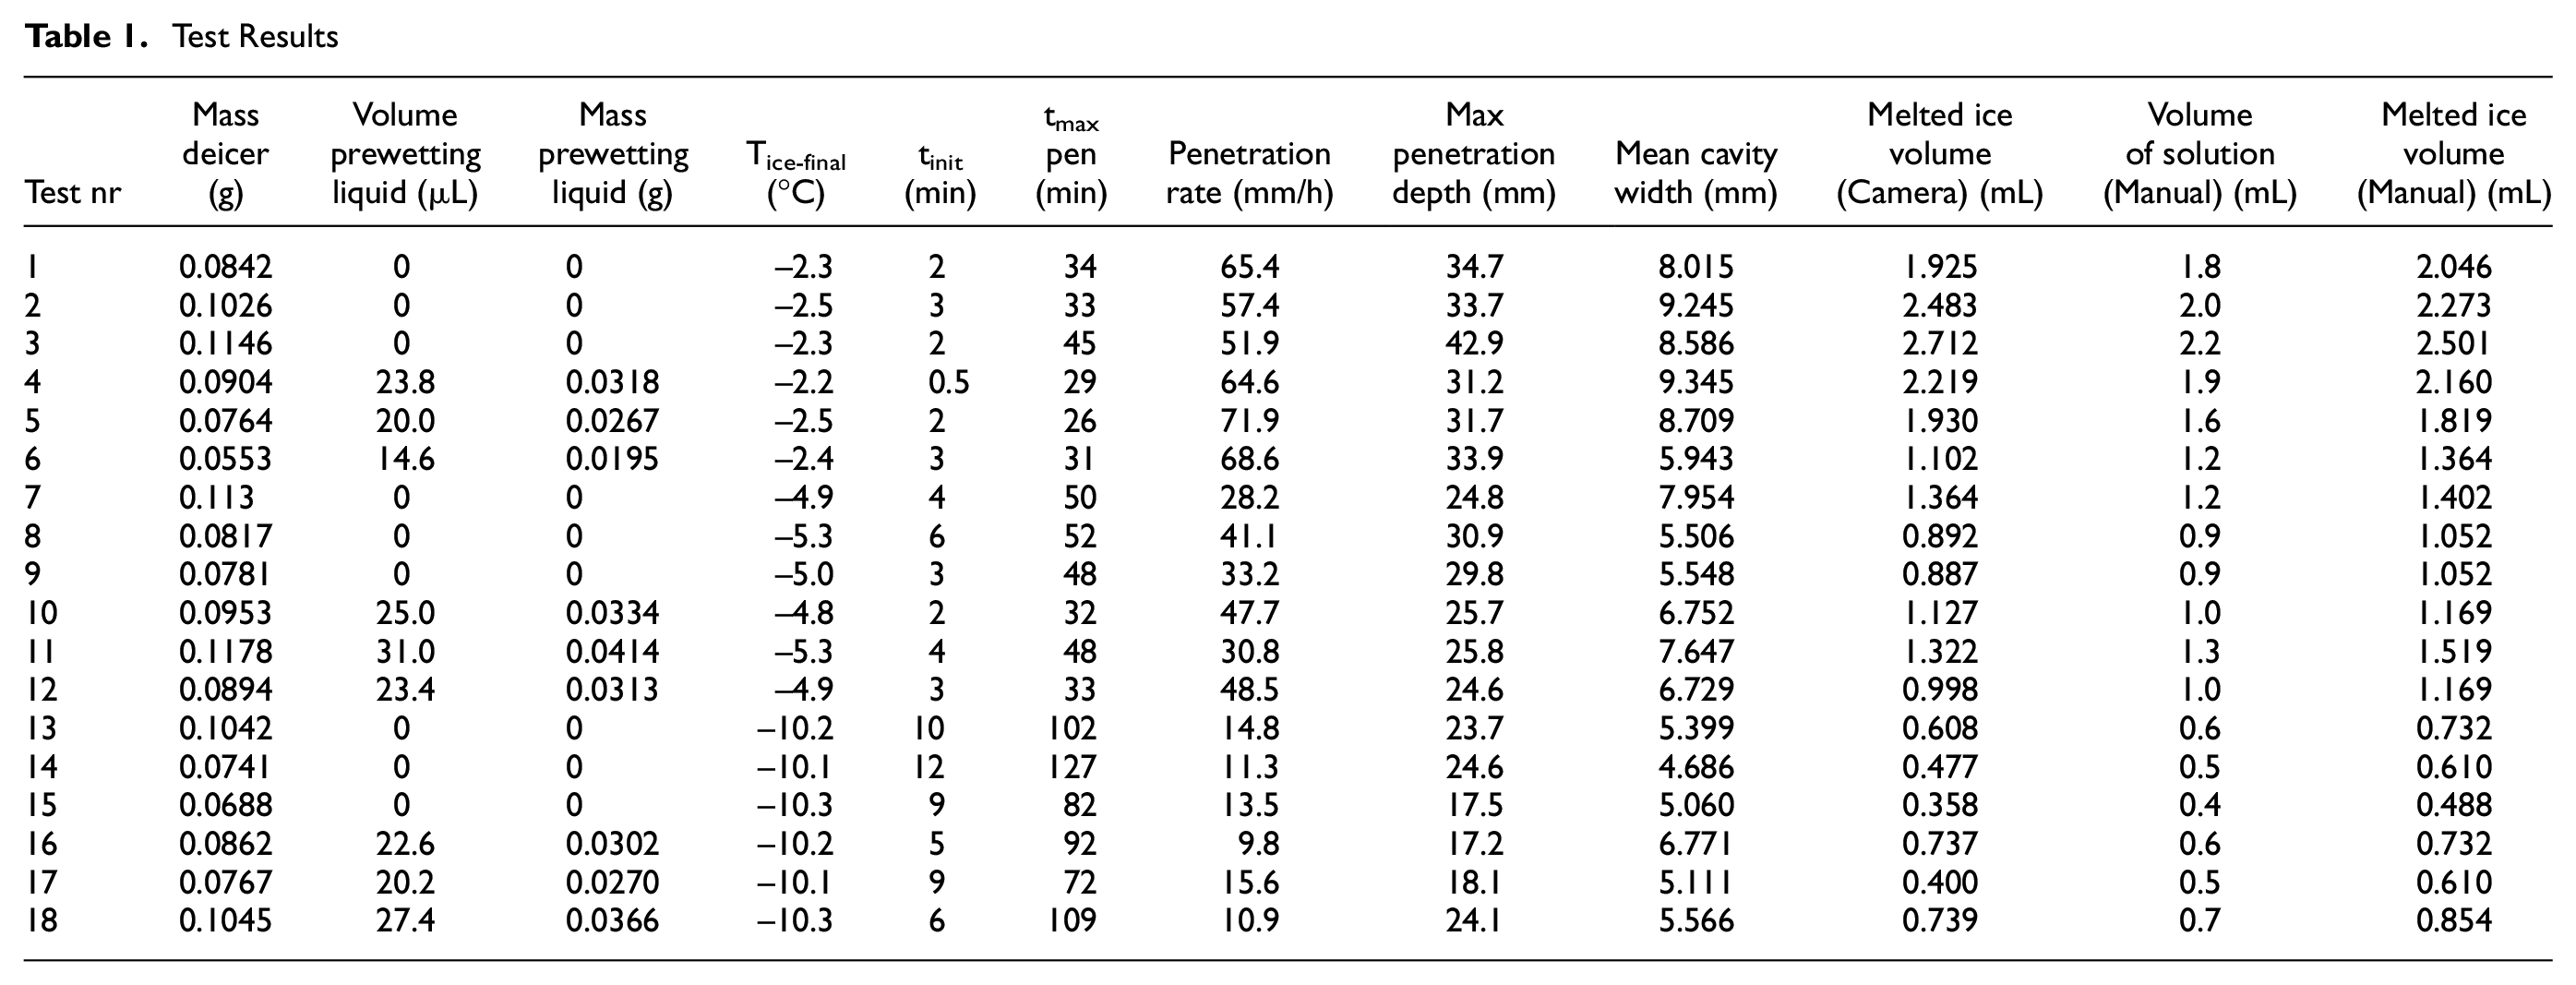
A total of 18 experiments were performed, including nine prewetted and nine dry samples at three different temperatures. The results are tabulated in Table 1.
Test Results
The final volume measured from the images is compared with the manual volume measurements in Figure 3a. It shows a good linear correlation between the two volume measurements.
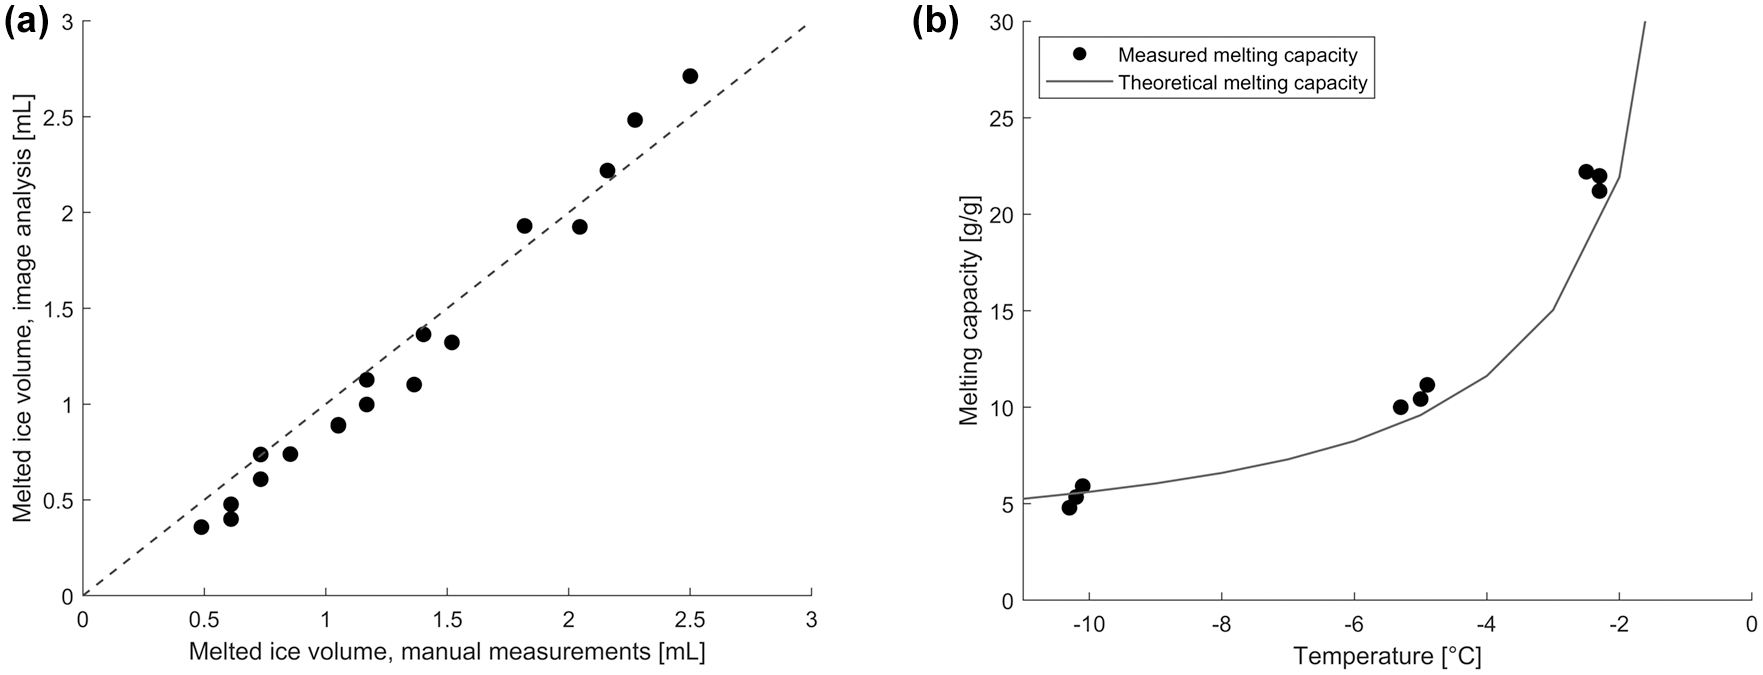
(a) Comparison between the final volumes measured from the images versus manual volume measurements. The grey dashed line shows the line of perfect correlation, and (b) comparison between theoretical and measured melting capacity of non-prewetted solid deicer, based on camera measurements.
The melting capacity, defined as the mass of melted ice divided by the mass of the deicer, was calculated for each test based on the volume measured from the images. Figure 3b shows these values, compared with the theoretical melting capacity calculated using freezing point curve following the method described by Nilssen et al. ( 18 , 19 ). Figure 3b shows that the full melting capacity of the deicers was reached, or slightly overestimated.
A typical development of melted volume (as percentage of maximal total melted volume) and penetration is illustrated in Figure 4. The melting process can be characterized by three distinct phases: 1) an initiation phase, 2) a penetration phase, and 3) a widening phase. In all tests, it took a certain time before the particle started to penetrate the ice. In the example shown in Figure 4 the initiation phase took 3 min. It was observed that during this phase the particle became wet but remained on top of the ice surface. After the initial waiting period, the melted volume increased at a constant rate and the particle penetrated with a constant speed into the ice. In the example in Figure 4 this steady-state penetration phase lasted until 37 min, after which the penetration distinctly slowed down or stopped completely.
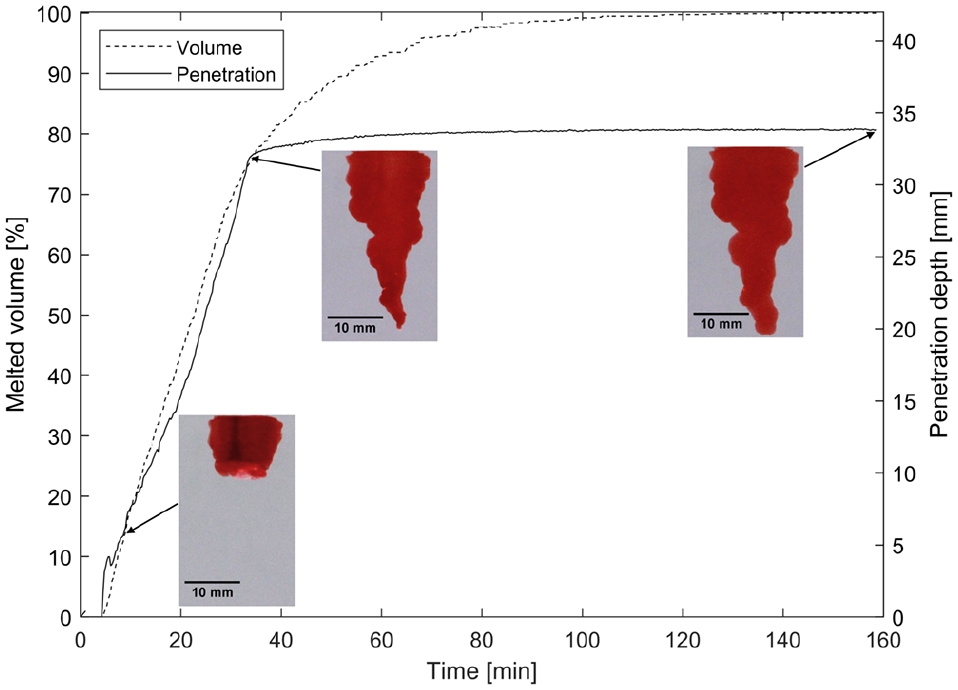
Typical penetration and volume development during a test (Test #2). The development of the cavity is illustrated at 10, 37, and 160 min.
Figure 5 shows a typical development of penetration and melted volume in different test temperatures. In −2°C, the penetration stopped when about 75% of the total melting capacity was reached. At −5°C the penetration stopped roughly at 90% of total melted volume, while in −10°C the penetration development and melting process stopped simultaneously. For the higher temperatures (–2°C and −5°C) the melting rate slowed down and the cavity mainly widened. The penetration depth increased only marginally in this last widening phase.
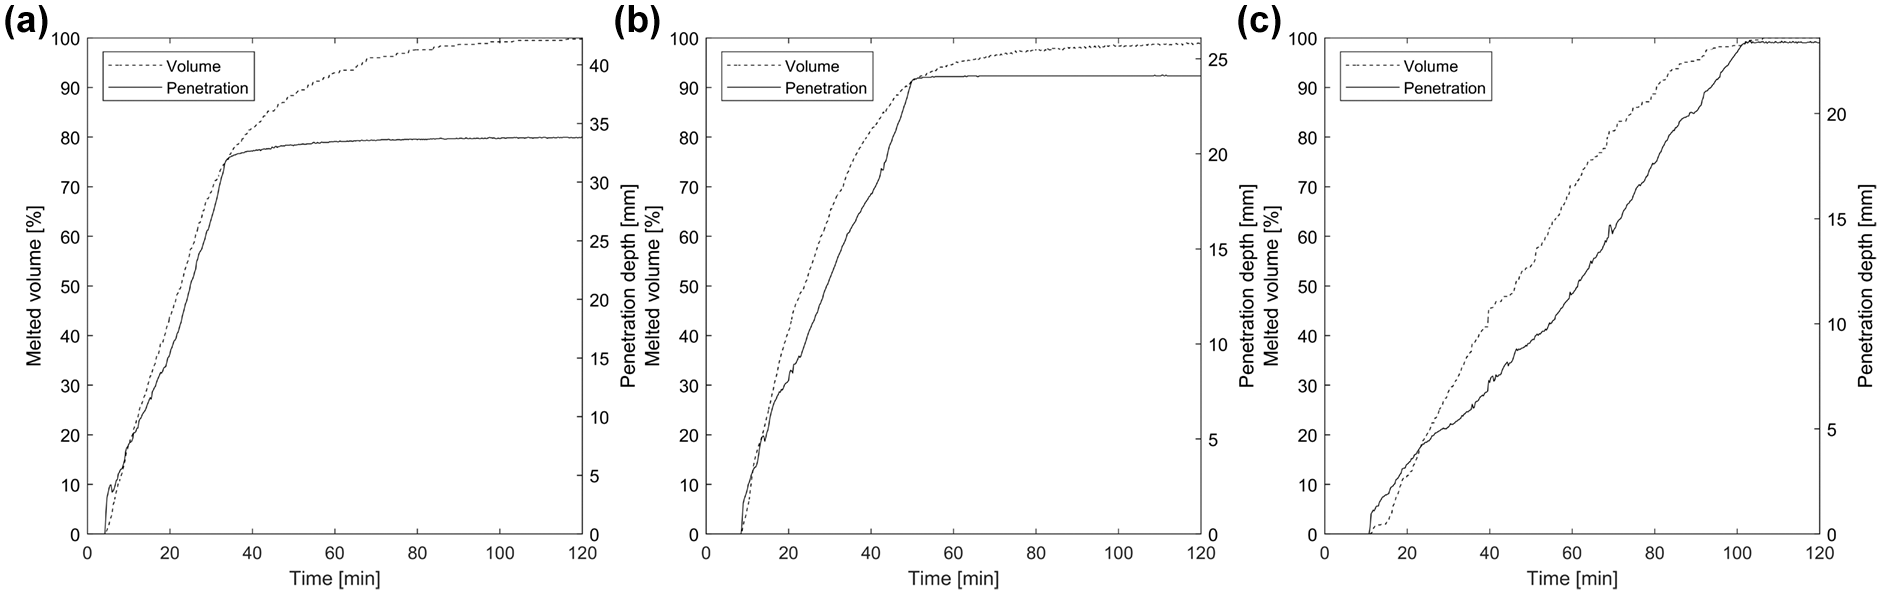
Typical penetration and volume development during tests in (a) −2°C (Test #2), (b) −5°C (Test #7), and (c) −10°C (Test #13).
The effect of temperature and prewetting on the duration of the initial phase (expressed as the initial waiting time) is shown in Figure 6a. The initial waiting time was longer for lower temperatures. For the dry granules, this initial phase lasted from 2.5 mins ± 1 min in −2°C, 4.5 mins ± 1 min in −5°C, and up to 10 mins ± 2 mins in −10°C. The observed influence of prewetting on the process varied based on the temperature. At higher temperatures (–2°C and −5°C), prewetting did not have a significant effect on the initial waiting time. At −10°C prewetting reduced the average waiting time from 10 min to 6.6 min.
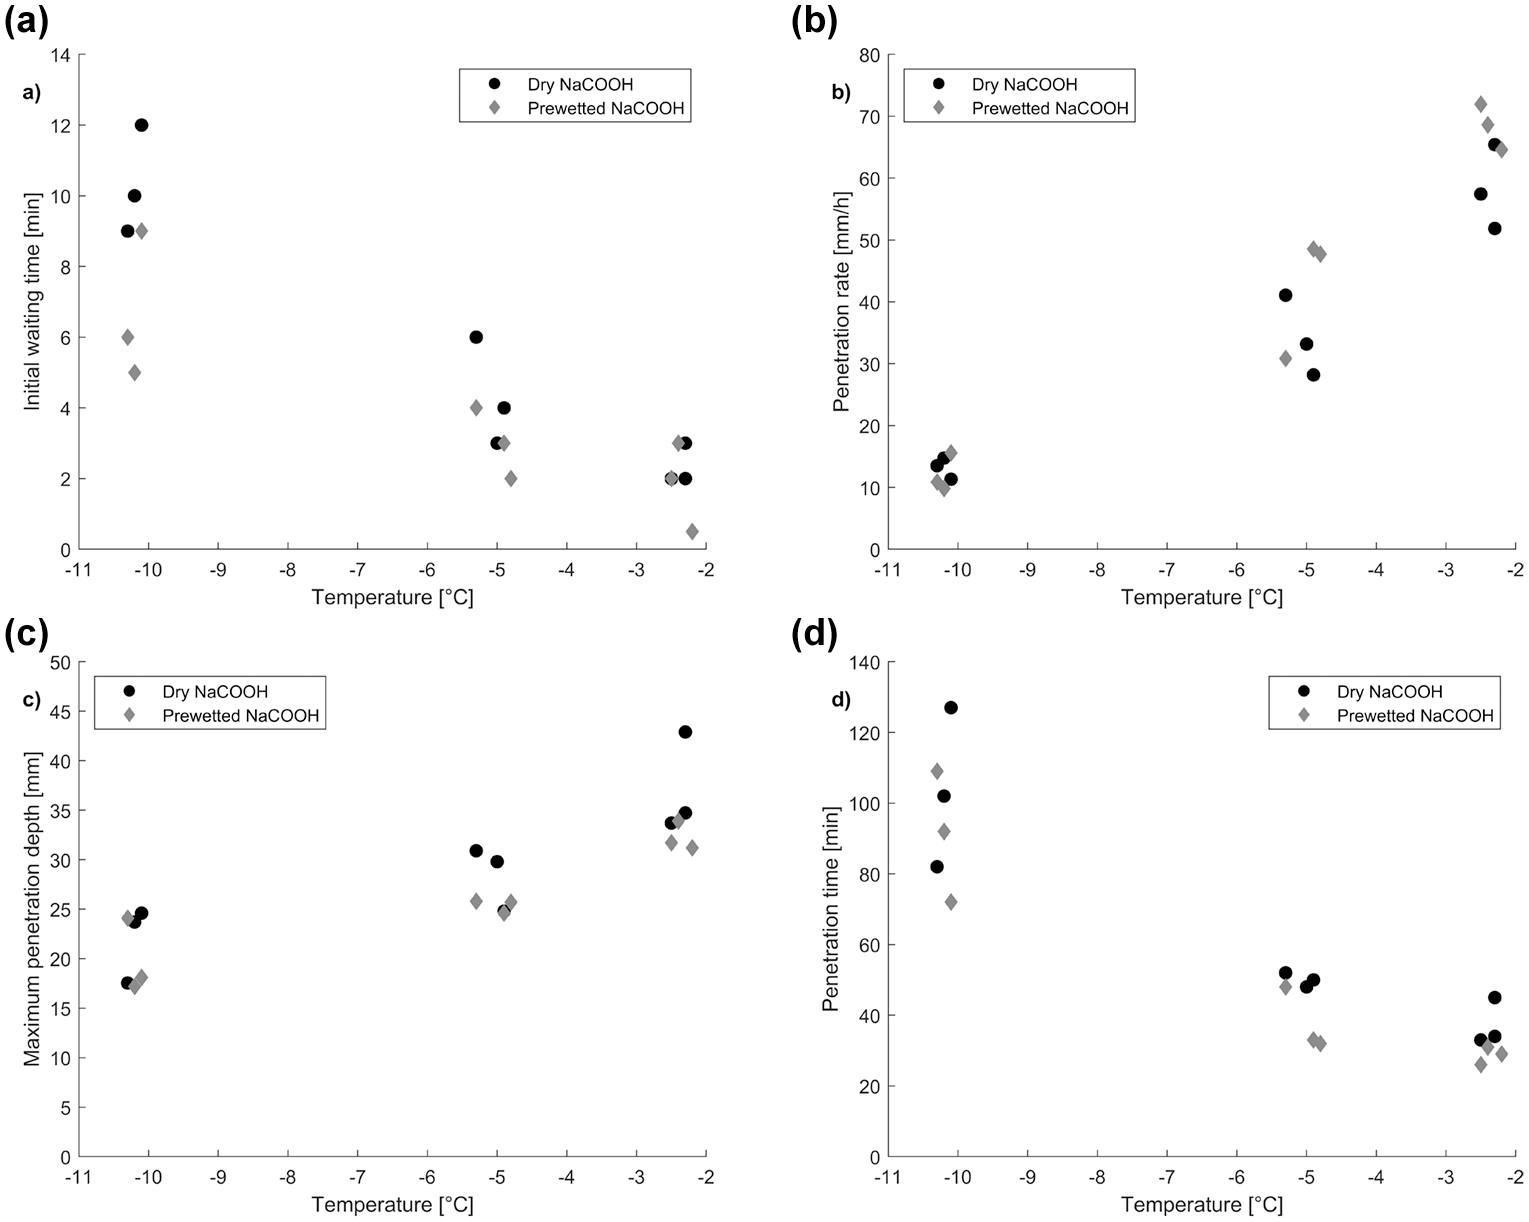
(a) Initial waiting time as a function of temperature, (b) penetration rate expressed in (mm/h) for prewetted and dry samples, (c) maximum penetration depth, and (d) time to reach maximum penetration depth.
The penetration rate (in mm/h) during the penetration phase is plotted as a function of temperature in Figure 6b. The penetration rate is strongly dependent on the temperature, and the particles penetrated faster at warmer temperatures. At −10°C, the particles penetrated at 10–15 mm/hour, while at −2°C this speed was about five times higher. Prewetting does not seem to have a clear beneficial effect on the penetration rate. At −2°C there can be an increase, but the amount of data is too limited to draw firm conclusions. At −5°C and 10°C the penetration rate is unaffected by prewetting.
Figure 6c shows that the maximum penetration depth increased at higher temperatures. On average, the particles penetrated 21 mm into the ice at −10°C, compared with 35 mm at −2°C. The final penetration depth is dependent on the particle mass. The average particle mass at −2°C, −5°C, and −10°C (0.087 g, 0.096 g, and 0.086 g, respectively) were reasonably comparable, but within each temperature the variation was too large to draw any conclusion on the effect of prewetting on the maximum penetration depth.
Figure 6d shows the penetration time (= duration of initial phase + duration of penetration phase) as a function of temperature. At −2°C maximum penetration was reached between 26 and 45 m, with an average of 33 min. At −5°C it took about 10 min longer (average penetration time 44 min). At −10°C the penetration time and variation in penetration time increased significantly, now ranging between 72 and 127 min, with an average of 97 min. At the warmer temperatures (–2°C and −5°C) there is a slight tendency for shorter penetration times for the prewetted NaCOOH, compared with the dry NaCOOH.
Discussion
The image analysis technique was found to give a reasonable estimate of the melted volume, when it was compared with the the manual measurements of the deicer solution (Figure 3a). The remaining scatter in the data is probably due to experimental uncertainties and the challenge to extract all the liquid from the cavity. Also, Figure 3b shows good agreement with theoretically calculated melting capacities. It shows that the full melting capacity was reached, and illustrates that the deicer can melt up to four times more ice at −2°C, compared with −10°C.
As can be seen in Figures 2 and 4, the shape of the cavity is not a straight cone or cylinder, but rather irregular. In some tests it tended to melt not strictly vertical, but rather at an angle. The authors believe this is due to the crystal structure of the ice. Because grain boundaries are regions with a large amount for mismatches in the lattice, it is easier to melt/penetrate first into these regions ( 20 ). Other, large-scale defects/impurities in the ice such as air bubbles, sand particles, or other contaminations are also likely to affect the penetration depth and rate. With voids present, it is likely that the meltwater flows into those areas, increasing both the total penetration depth and rate. Dense ice can occur naturally during periods with many melting–refreezing cycles or in the case of frequent freezing rain, so the method will generally illustrate a worst-case scenario when it comes to measured penetration values ( 21 ).
Making bubble-free ice is a slow process. It required over one week to grow the ice and it needed to be cut with a band saw in a large walk-in coldroom. Hence it is not as straightforward as the SHRP H-205.3 ice penetration test, where ice is grown in a 4 mm hole drilled in a Plexiglas block. But an important observation with practical applications is that the cavities in the experiments in this study became up to 11–12 mm wide, even though the particles were not bigger than a few millimeters. Restricting the width of the cavity to 4 mm increases the total penetration depth, as the total melting volume is given by the melting capacity and the mass of the used particle. This method thus gives a penetration depth that is more likely to be in the range that is achievable in the field. The intention of the standard SHRP penetration test was to have a comparative test method for different deicers. For that purpose, it fulfills its needs, but it is important to remember that it cannot be used to predict realistic penetration depths for commercial deicers.
The first main finding illustrated in Figure 4 is that sodium formate particles penetrate the ice at a constant rate. This was true for all tests, both dry and prewetted. The authors believe the rather distinct stop in penetration rate coincides with the point that the solid deicer is fully dissolved. At higher temperatures the deicer solution continues to melt at a decreasing rate, mainly widening the cavity. Wåhlin and Klein-Paste showed earlier that the melting rate of liquid deicers is controlled by the chemical potential difference (which is determined by the chemical concentration) and the diffusion of chemical into the meltwater (or, viewed reversely, the diffusion of melted water molecules into the chemical solution) ( 16 ). If a constant melting rate is achieved, then the driving force (the chemical potential difference) and the resistance (the mass diffusion) remain constant. To do so, the deicer particle needs to add chemical into the meltwater to prevent the concentration (and thus the driving force) from dropping. For sodium formate, the observation of a constant penetration rate suggests that the deicer concentration at the melting interface did not change much, even when the temperature changes (due to the endothermic melting reaction).
As shown in Figure 6a the melting reaction started quickly at −2°C (within 1–3 min), while it took between 5 and 12 min at −10°C to get visible penetration. At −10°C prewetting did reduce the waiting time, but still it took at least 5 min to get the reaction started. Prewetting is often justified with the argument that it “kick-starts” the melting. For sodium formate it indeed does so at lower temperatures but from an operational point of view, its time saving potential is limited to a few minutes, and only at temperatures below −5°C.
The observation that the penetration rate was strongly dependent on temperature (Figure 6b) can be explained by the fact that sodium formate has a rather high eutectic temperature of −16°C (22). The eutectic point is the lowest possible freezing point one can get with the deicer, since it requires that the solution is saturated with the deicing chemical. As pointed out earlier the freezing point of a deicer solution, Tf is directly linked to its chemical potential ( 16 ). The speed at which a given deicer melts is therefore proportional to the difference between Tf and ice temperature Ti. At −10°C the difference between Tf and Ti cannot exceed 6°C, whereas at −2°C this difference can be up to 14°C. The actual difference is not known, as chemical concentration at the melting front was not measured, and the temperature of the ice first decreases (due to the endothermic melting reaction) and then increases again due to heat flowing from the surroundings to the ice (17). A deicer with a lower eutectic point would have had a higher driving force at −10°C and the difference between −10°C and −2°C would not have been fivefolded. Due to this high eutectic point, sodium formate has no capabilities to penetrate ice below −16°C. The observation that prewetting did not significantly enhance the melting rate is expected because the prewetting liquid quickly gets diluted so it does not alter the melting reaction much once a certain amount of meltwater has been created.
The maximum penetration depth (Figure 6c) at −2°C (35 mm) was 1.6 times higher than at −10°C (21 mm). This is rather little, given that sodium formate can melt five times more ice at −2°C, compared with −10°C. The reason why the penetration depth is not directly correlated to the melting capacity is that the cavity not only gets deeper, but also wider. The mean width of the fully grown cavity was on average 8.3 mm at −2°C, compared with 5.4 mm at −10°C (Table 1). Ideally the cavity should be as small as possible, because a narrow cavity not only increases the penetration depth, but it also increases the chance to get undercutting. When the particle has reached the underlying pavement and there is still solid deicer left, it starts to continue to melt horizontally. This increases significantly the area per particle where there is no adhesion between the ice and the pavement. Although different deicers were not investigated here, it may be that faster melting also leads to wider and shallower cavities. If that is the case, there seems to be a tradeoff between the melting speed and the achievable penetration depth. When it comes to prewetting, Figure 6c does not show a beneficial effect on the maximum achievable penetration depth, but due to the variations in particle mass within each test temperature, the data is inconclusive at this point. Large gains in penetration depth due to prewetting are not expected, because prewetting only marginally increases the melting capacity.
Altogether, the results of this study show that prewetting sodium formate with a 50 wt% potassium formate solution only has a small beneficial effect by reducing the initial waiting time with a few minutes at low temperatures (–10°C). It did not increase the penetration rate and it is not likely that it can increase the penetration rate of a single particle. That said, there can be other beneficial effects of prewetting during deicing operations, for example by making the particles heavier so they get distributed better, or that fine-grained grained particles (that will have little penetration capacity alone) adhere to each other into larger agglomerates. But if prewetting is solely done with the purpose to kick-start the reaction one should be sure this time gain is not consumed by filling up the prewetting tanks at the spreader; an operation that easily can take 10–15 min.
Suggested Implementation into Guidelines
As mentioned in the introduction, it is desirable to develop operational guidelines and working procedures for winter maintenance that are based on practical experience (best-practice), combined with sound physical understanding of how the deicer works. This study provides some pieces of knowledge that can be implemented in such guidelines. This last section discussed and suggested how this could be formulated. Note that these suggestions are based on winter maintenance practices at airports and are only based on data for sodium formate deicers.
Directly after application, the particles are prone to be displaced by traffic. Particularly reversed engine thrust during landings can blow away/displace the particles. So, to get effective results, the particles should at least melt to their own height (typically up to 5 mm) into the ice, before any traffic should be allowed on the treated area. Since the ice used in this study is a “worst case ice” when it comes to penetration rate, Figures 6a and b can be used to determine that after 15 min (5 min initial waiting time + 10 min penetration) most of the particles will have melted at at least 5–10 mm into the ice. A guideline sentence that captures this could read: To prevent blow-off, do not allow any traffic on the treated surface for at least 15 minutes after deicer application.
Some deicing operations are possible to plan many hours in advance. In Norway, many airports manage to stay operational even when there is compacted snow or ice on the runway. But when the weather forcast predicts a mild period, winter maintenance personnel want to remove the ice before it starts to melt by itself. In these situations, timing the operation is crucial to get the best possible effect and these operations are planned for within a workshift or even between different workshifts. Ideally, all the ice is removed before the surface temperature reaches 0°C. The operation is preferably done when there is little air traffic to minimize delays, and it is favourable to do the deicing at daytime as it is typically warmer and maybe even some sunlight can supply heat during the melting process. Figures 3b and 6 illustrate that there are only benefits by deicing at higher temperatures. The melting capacity strongly increases, the waiting time is shorter, the penetration rate faster, and the particles penetrate deeper into the ice. A guideline sentence that captures this knowledge could read: Whenever possible, conduct the deicing operation at temperatures higher than −5°C.
Figure 6d showed that the penetration process was finished within 52 min for all tests conducted at −5°C and −2°C. Since the experiment was done on very dense ice with the largest particles of the sample from the commercial product, little wind that can add convective heat, or radiative heat from, for example, sunlight, it is likely that the majority of all particles have reached their full penetration depth within 1 hour. Undercutting was not investigated in this study, but it is likely that full undercutting takes a longer time because, once the particle has reached the pavement, the diffusion distance becomes much longer as the “ring” of deicing solution that undercuts the ice increases in size. This should be investigated further, but, for now, a guideline sentence that captures the results on penetration time could read: After chemical application, wait about 1 hour to ensure all particles have fully penetrated the ice. To achieve undercutting the waiting time may need to be longer.
Conclusion
The penetration of a granular sodium formate deicer has been investigated in a laboratory study at −2°C, −5°C, and −10°C. The ice penetration tests with single deicer grains were performed on large, optically clear ice cubes. The initial waiting time, penetration rate and −depth, and melted volume were documented using an image analysis technique. Special attention was given to the effect of ice temperature and the use of a prewetting liquid.
The time it takes before the particles started to penetrate (initial waiting time) was found to be in the range of 5–12 min at −10°C and between 1 and 6 min at or above −5°C. Prewetting reduced the initial waiting time by a few minutes at −10°C, but at higher temperatures, this reduction was insignificant.
The particles penetrated the ice at a constant rate, for almost the entire penetration depth. The penetration rate is strongly dependent on the temperature. At −10°C, the particles penetrated at 10–15 mm/hour, while at −2°C this speed is about five times higher. Prewetting does not seem to have a clear beneficial effect on the penetration rate. At −2°C there can be an increase, but the amount of data is still too limited. At −5°C and −10°C the penetration rate is unaffected by prewetting.
The maximum penetration depth was higher at warmer temperatures. The largest grains (up to 5 mm) were tested. These particles penetrated 21 mm into the ice at −10°C, compared with 35 mm at −2°C. These penetration depths are expected to be lower for smaller grains, but higher when the ice contains a significant amount of air bubbles.
The SHRP H-205.3 ice penetration test uses ice that is grown in a 4 mm hole drilled in a Plexiglas block. The cavities in the experiment in this study were much wider (up to 11–12 mm), even though the particles were not bigger than a few millimeters. Restricting the width of the cavity to 4 mm seriously increases the maximum penetration depth. This should be kept in mind when interpreting data from SHRP H-205.3 ice penetration tests.
Suggestions are made on how to capture the results from this study into operational guidelines for deicing operations at airports, using sodium formate as deicer.
Footnotes
Acknowledgements
The authors are very grateful to Sergey A. Kulyakhtin and Bent Lervik for practical assistance during the experiments. The authors would also like to thank Johan Wåhlin for comments on an earlier version of the manuscript. Finally, the authors would like to thank Thomas Tøftevåg, Bernt Ruud, Petter Emblem, and Jan Andersen, all working at the Norwegian airport operator Avinor, for sharing their practical expertise on deicing operations.
Author Contributions
The authors confirm contribution to the paper as follows: study conception and design: A. Klein-Paste; data collection: M. P. Trzaskos; analysis and interpretation of results: M. P. Trzaskos, A. Klein-Paste; draft manuscript preparation: M. P. Trzaskos, A. Klein-Paste. All authors reviewed the results and approved the final version of the manuscript.
Declaration of Conflicting Interests
The author(s) declared no potential conflicts of interest with respect to the research, authorship, and/or publication of this article.
Funding
The author(s) received no financial support for the research, authorship, and/or publication of this article.
Data Availability
Raw data will be made available on request to the corresponding author.