
Abstract
Rubber swelling in bitumen, which is a diffusion-induced volume expansion process, plays a dominant role in the design of crumb rubber modified bitumen binders and their properties development. This study aims to investigate the kinetics of bitumen diffusion into truck tire rubber, the equilibrium swelling characteristics of rubber, and the mechanical properties of rubber before and after swelling at different high temperatures. Fourier transform infrared spectroscopy results indicate that no rubber dissolution happens during the interaction in the temperature range from 160°C to 200°C. Aliphatic compounds from bitumen preferentially diffused into rubber during the swelling process. The diffusion coefficients of bitumen into rubber were determined by the sorption test using the gravimetric method. The diffusion coefficient increases with the increase of temperature in an Arrhenius form. The volume expansion of rubber during swelling was captured by the X-ray computed tomography scan images. Rubber swells faster at the earlier stages, then the expansion rate slows down. The swelling ratio of rubber increased from 1.97 at 160°C to 3.03 at 200°C after 36 h interaction. Mechanical tests by dynamic shear rheometer reveal that swollen rubber becomes softer compared with the dry rubber and exhibits obvious viscoelastic behaviors. With the increase of temperature, the softening and viscous effect are more significant. The obtained parameters can be implemented to swelling and micromechanical models to better predict the binder properties.
The use of crumb rubber modified bitumen (CRMB) has been a common practice in the asphalt paving industry for many years. Modification of bitumen with crumb rubber modifiers (CRMs) from scrap tires was reported to improve the physical and mechanical properties of binders. Compared with neat bitumen, CRMB has higher resistance to rutting, aging, fatigue, and thermal cracking ( 1 – 3 ). These improvements are attributable to the interaction between bitumen and CRM.
Bitumen, as a refined residue from the distillation process of crude oils, is a complex mixture of thousands of different hydrocarbon molecules. Based on the differences in size and polarity, bitumen molecules can be separated into four molecular groups, saturates, aromatics, resins, and asphaltenes (SARA). Bitumen is commonly accepted as a multi-disperse colloidal system, where high-molecular-weight asphaltene micelles are peptized by resins and dispersed in low-molecular-weight maltenes (saturates and aromatics) ( 4 ). CRM mainly consists of natural and synthetic rubber, which are cross-linked with sulfur and reinforced with carbon black. In addition, various processing agents, such as aromatic hydrocarbons and antioxidants, have been added to improve its workability and prevent it from aging, respectively ( 5 ). The often-referred interaction during the production of CRMB in literature is essentially the interaction between the rubber polymer and bitumen. From the viewpoint of polymer science, the bitumen–rubber interaction can be regarded as a process that a polymer (rubber) dissolves into a low-molecular-weight solvent (bitumen). Depending on different interaction parameters (e.g., temperature, time, and mixing technique, etc.), there are two mechanisms involved in the bitumen–rubber interaction process: diffusion-induced swelling of rubber network and chain disentanglement/secession of the swollen rubber (rubber degradation) ( 6 – 9 ). Theoretically, swelling and degradation are two successive processes of the dissolution of rubber in bitumen. As elastomers, rubber particles swell by absorption of the aromatic oils from the bituminous matrix to form a gel-like structure at elevated temperatures. After the completion of rubber swelling and under severe interaction conditions (excessively high mixing temperature with high shear and extended mixing time), rubber network degradation occurs. This process involves two chemical reactions: depolymerization and devulcanization, which break down the polymer chain bonds or crosslinking bonds thus reducing the average molecular weight of rubber ( 10 ). Besides the interaction conditions, the raw material parameters (e.g., bitumen microstructure and composition, rubber composition, morphology, and particle size, etc.) also have great impacts on the dissolution process of rubber in bitumen.
Few studies in the past have been done to quantitatively investigate the diffusion of bitumen into rubber. Frantzis measured the mass uptake of rubber in bitumen to determine the diffusion and solubility coefficients of bitumen in rubber from waste tires at 180°C ( 11 ). Artamendi and Khalid extended this gravimetric method to different types of bitumen to investigate the diffusion kinetics ( 12 ). More recently, Dong et al. used the Styrene Butadiene Rubber (SBR) sheet to simulate the swelling process of rubber in bitumen. Differential scanning calorimetric analysis, X-ray photoelectron spectroscopy tests, infrared spectroscopic analysis, and tensile tests were conducted to examine the physical, chemical, and mechanical properties of rubber before and after swelling in rubber ( 13 ).
The bitumen–rubber interaction alters not only the component fractions and microstructure of bitumen but also the nature of rubber. Rubber swelling process stiffens the binder while degradation is detrimental to the mechanical properties of binder. For the conventional wet-processed CRMB at temperatures from 160°C to 200°C, only partial degradation occurs, and the final binder properties are dominated by the rubber swelling process ( 9 ). Therefore, it is of vital importance to understand the interaction process to guide the production of CRMB. Instead of investigating the properties of CRMB prepared at different conditions with different material combinations, this study focuses on the interaction between a single rubber unit and bitumen at different conditions. It is not the intention of this study to involve many material combinations, but instead, to develop a robust methodology to determine the diffusion kinetics of bitumen into rubber and swelling properties of rubber.
Objective and Approach
This study aims to investigate the kinetics of bitumen diffusion into cylindrical rubber samples cut from scrap truck tires, the equilibrium swelling characteristics of rubber, and the mechanical properties of rubber before and after swelling at different high temperatures. From the physical viewpoint, rubber swelling is a multiphysics phenomenon which consists of mass diffusion and volume expansion (mechanical deformation). Gravimetric method (weight gain experiments) was used to determine mass uptake parameters and diffusion coefficient. Fourier transform infrared spectroscopy (FTIR) was employed to detect the component exchanges between rubber and solvent. The volume change of rubber during the swelling process was measured by micro X-ray computed tomography (CT) scan. Furthermore, the mechanical properties of rubber before and after swelling were tested by the dynamic shear rheometer (DSR) with dedicated sample preparation procedures.
Materials and Methods
Materials and Sample Preparation
Penetration grade 70/100 bitumen (Nynas) with a SARA (saturated hydrocarbons, aromatic hydrocarbons, resins, asphaltenes) fraction of 7% saturates, 51% aromatics, 22% resins, and 20% asphaltenes, was used to interact with the rubber. The cylindrical rubber samples were cut from waste truck tires as shown in Figure 1. A uniform rubber slice of 2 mm thickness was cut from the tire tread (metal fiber free) using the water jet cutting technology. Then, laser cutting was applied on the slice to obtain the rubber cylinders with a diameter of 8 mm. These cylindrical rubber samples were subjected to the swelling test and DSR test later. The rubber sample comprises about 55% total rubber polymer (natural and synthetic rubber), 25% carbon black, and 20% processing agents. The processing agents mainly consist of antioxidants/antiozonants and curing additives (e.g., sulfur, zinc oxide, stearic acid, accelerator, and oil, etc.).
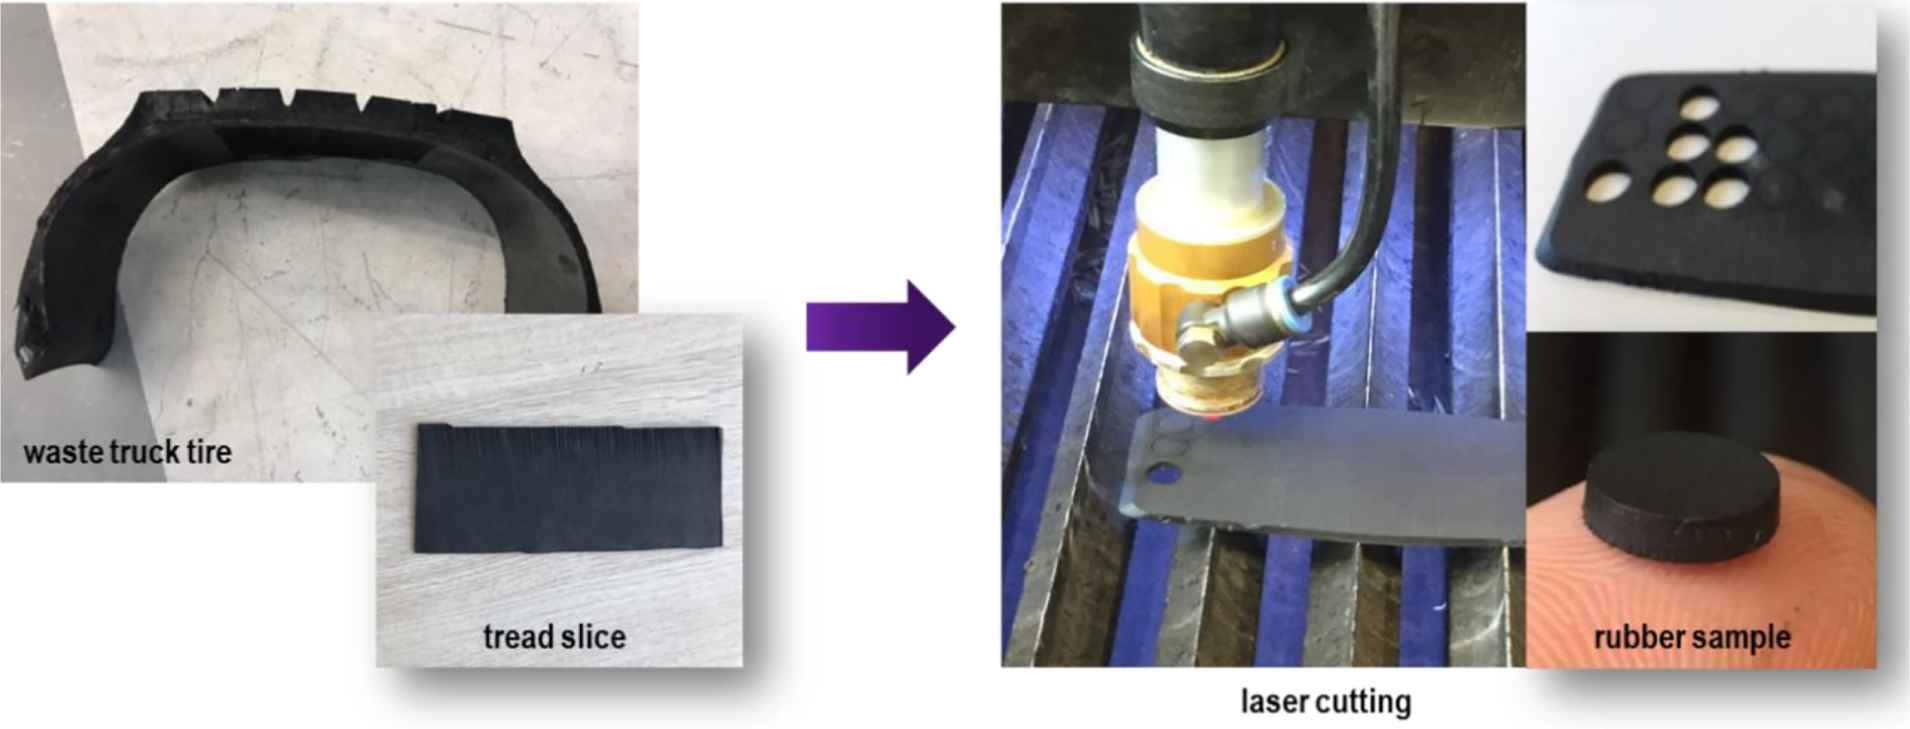
Cylindrical rubber sample (2 mm-thickness and 8 mm-diameter) preparation process.
Rubber Swelling Test
Gravimetric method (weight gain experiments) was used to determine mass uptake parameters and diffusion coefficient. The cylindrical rubber samples were immersed in small glass bottles containing approximately 5 g bitumen. The receptacles with lids were kept in an oven at the desired temperatures of 160°C, 180°C, and 200°C, which are in the temperature range of conventional wet process. At regular time intervals (0.5, 1, 2, 3, 4, 6, 8, 18, 24, 28, 36 h) the samples were taken out of the bottles, blotted with Kimwipes (wiped dry with absorbent paper) to remove the surface-adhered excess bitumen. More dense data collection was conducted at the early stages where bitumen diffusion is usually faster than later stages. The rubber samples were then weighed (±0.05 mg) on an electronic balance under closed environments. The mass uptake was obtained by difference between the initial weight and the weight after immersion in bitumen. For each temperature, three rubber replicates were used for the test.
Concurrently, another group of rubber swelling tests were performed using the same setup at the same elevated temperatures of 160°C, 180°C, and 200°C. After swelling for different time durations (2, 6, 14, 26, 36 h), instead of taking out the rubber samples, the glass bottles containing both rubber cylinder and bitumen were scanned by the micro X-ray CT with a high resolution of 0.025 mm in all directions (Figure 2). As a non-destructive visualizing technique, X-ray CT can distinguish the rubber part and the bitumen part in the glass bottle based on the density difference, and thereby monitor the volume change of rubber during swelling. After obtaining the 2D CT scan images, Simpleware® software was utilized to analyze the image data and to reconstruct the 3D images of rubber samples for further volume calculation.
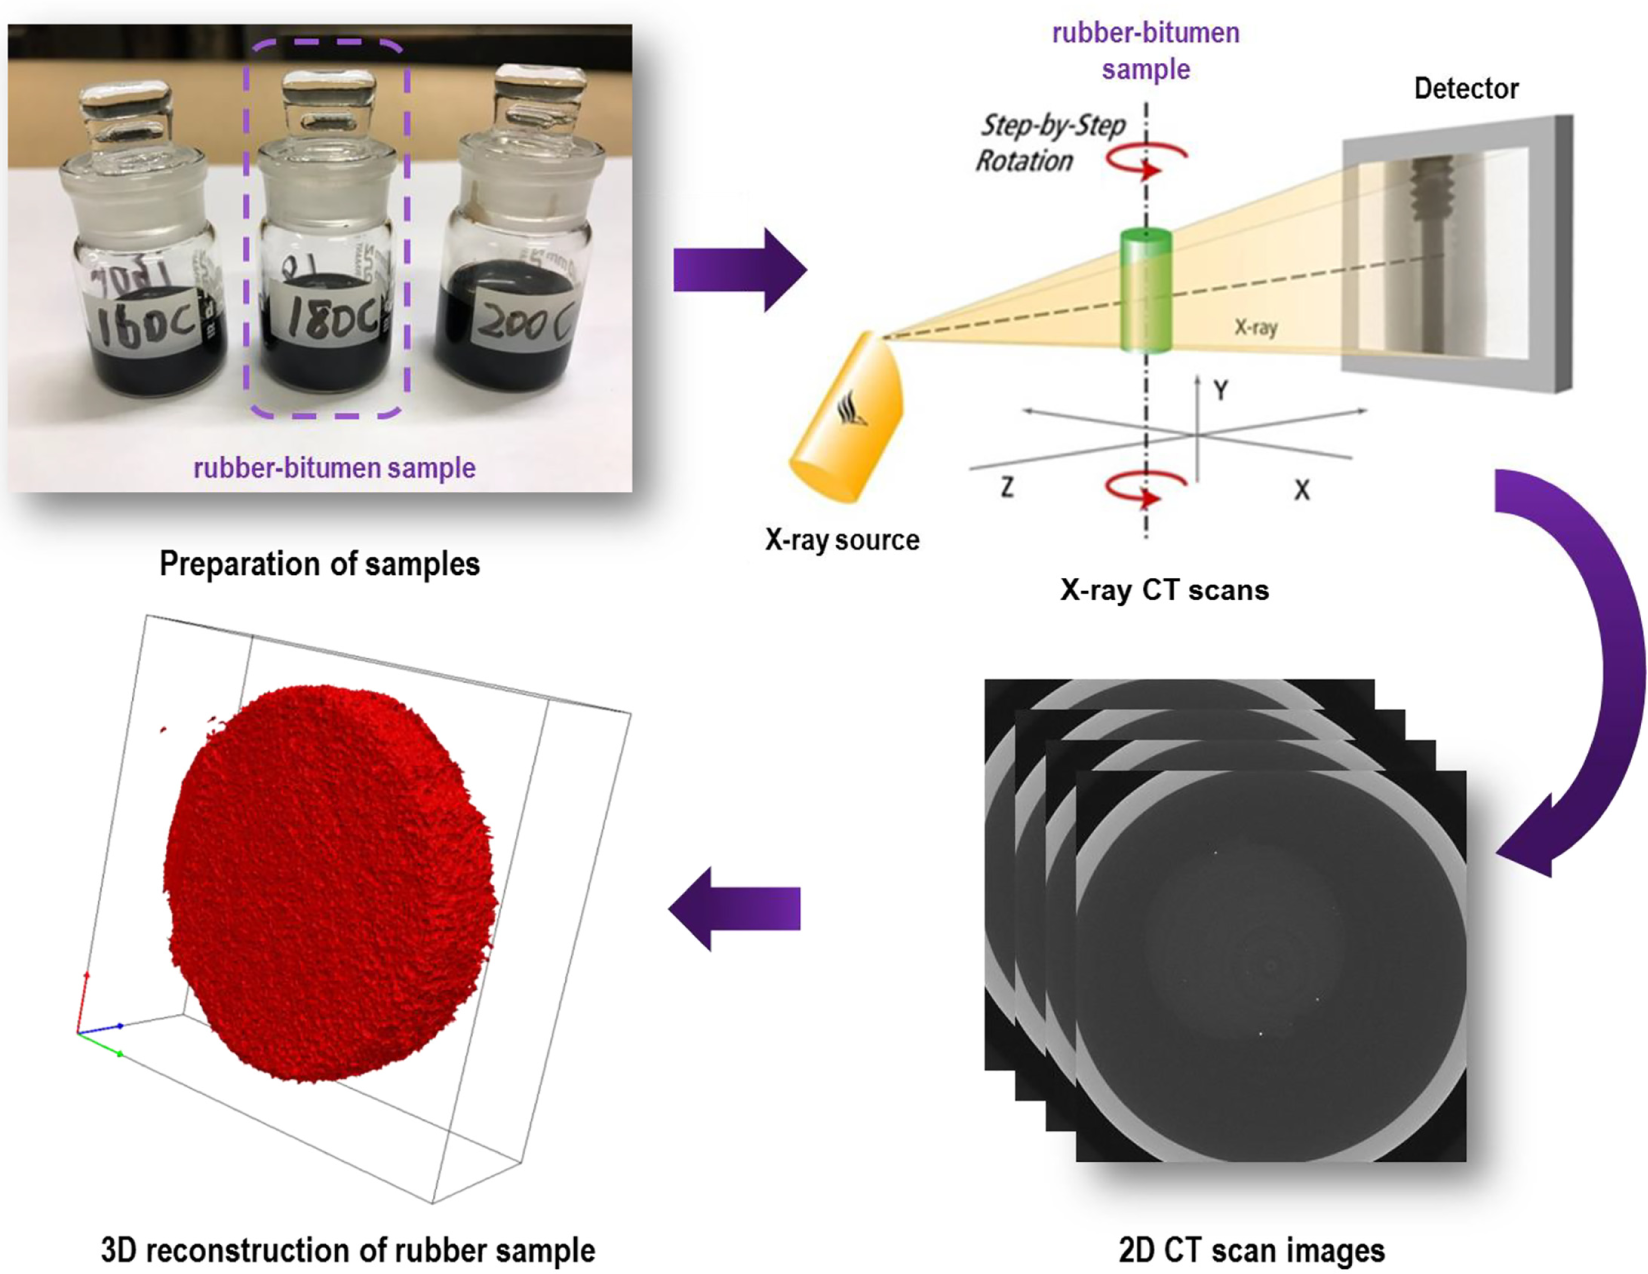
X-ray CT scan test for monitoring the rubber swelling process.
Does the Rubber Dissolve into Bitumen? Study of Rubber in Napthenic Oil
Before conducting the rubber swelling test in bitumen, a question needs to be answered to ensure the results obtained from the swelling tests are the consequences of swelling—does the rubber dissolve into bitumen? Therefore, the rubber samples were first immersed in a naphthenic oil at elevated temperatures to examine if there is dissolution of rubber taking place during the swelling process. The naphthenic oil has a Hildebrand solubility parameter of 18.5 MPa0.5, which is closer to truck tire rubber (18.6 MPa0.5) than most bitumen components (in the range from 17.2 to 18.8 MPa0.5) ( 12 , 14 , 15 ). Therefore, it is easier for rubber to dissolve into the naphthenic oil than bitumen based on the solubility theory. The naphthenic oil was collected periodically and was subjected to FTIR test to examine if there are new functional groups appearing because of the interaction with rubber.
FTIR tests were also performed on the swollen rubbers from the rubber swelling test in bitumen. Small rubber units were cut from the core of swollen rubber samples with a special drill tool to avoid the interference of bitumen on the surface of the rubber. The small rubber units were tested by FTIR to see which component of bitumen has diffused into rubber. In short, these two types of FTIR tests were performed to examine what has been released into naphthenic oil and what has been diffused into rubber.
Fourier Transform Infrared Spectroscopy (FTIR)
A Perkin Elmer Spectrum 100 FTIR spectrometer was used in the attenuated total reflectance (ATR) mode to acquire the infrared spectra for all the test samples. It was used to detect the component exchanges between rubber and solvent. The FTIR spectrum was obtained in the wavelength number range from 4,000 to 600 cm−1 with a scanning resolution of 4 cm−1 averaging 20 scans for each measurement at ambient temperatures.
Component Exchange between Rubber and Solvent based on FTIR Analysis
As mentioned before, the objective of immersing rubber samples into the naphthenic oil at elevated temperatures is to examine if the dissolution of rubber happens during the swelling process. The reason for choosing a naphthenic oil instead of bitumen is because its functional groups are relatively simple compared with bitumen. Besides, it is a better solvent for rubber swelling than bitumen. Therefore, it is easy to distinguish if rubber polymer molecules appear in the spectra of the collected naphthenic oil samples (Figure 3a). The spectrum peaks at 966 cm−1 and 696 cm−1 are often used as indicators of polybutadiene (PB) and polystyrene (PS) in rubber respectively. From Figure 3a, it can be found that no rubber polymer functional groups were detected as no PB or PS peaks showed up. However, the absorption peak at 1700 cm−1 corresponding to carbonyl functional group, which was not existing in the pure naphthenic oil spectrum, appeared in the reacted naphthenic oil samples. The intensity of this peak increased with higher interaction temperature and extended time. This may be attributed to the released aromatic oil, and oxidation of carbon black released from rubber samples. Therefore, no rubber dissolution (or too inconspicuous to be detected) during interaction with naphthenic oil takes place in the temperature range from 160°C to 200°C. In addition, the rubber sample retained its integrity after the interaction at a macroscale by visual inspection. It is anticipated this is the same case for the interaction of rubber with bitumen based on the solubility theory. It may be contradictory to previous studies which claimed the dissolution of rubber particles happened during the mixing process ( 16 ). In their studies, CRM dissolution was measured by considering the portion of CRM particles that passed through mesh No. 200 (smaller than 0.075 mm) as the dissolved portion. However, this portion of CRMs may be the consequence of disassociation/splitting of the big particles because of the mixing force and swelling effect ( 17 ). It is just a physical size-reducing process in which no dissolution happens in a chemical sense. Therefore, the diffusion coefficient measured using the gravimetric method represents the accurate diffusion of bitumen components into rubber since no rubber mass loss is expected.
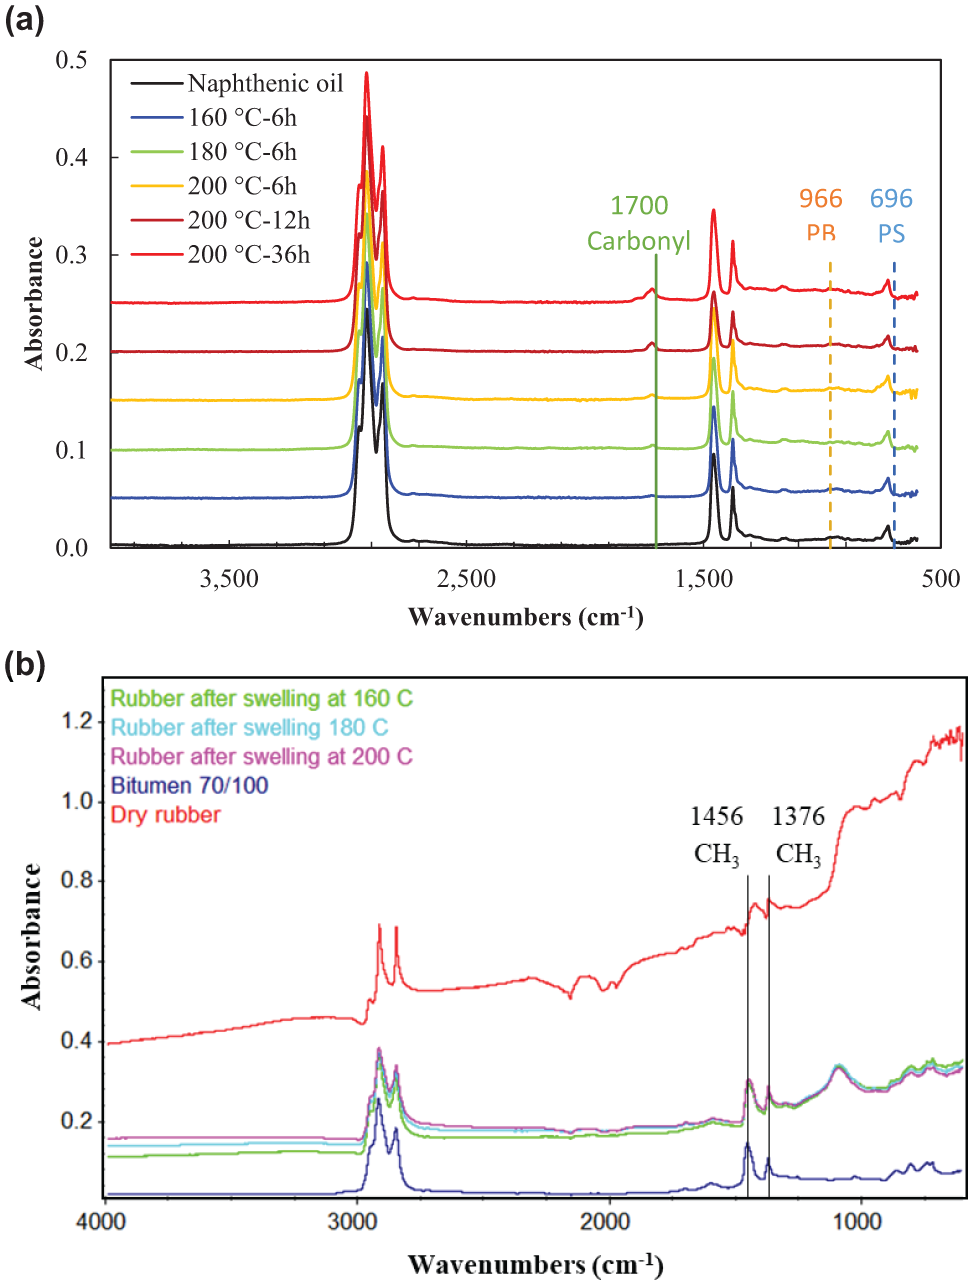
FTIR results of (a) reacted naphthenic oil samples and (b) rubber samples before and after swelling.
Figure 3b shows the spectra of dry rubber sample and rubber samples after swelling at different temperatures. It can be found that the absorption peaks at 1456 cm−1 and 1376 cm−1 corresponding to aliphatic components, which were not present in the dry rubber but in the bitumen, which showed up in the swollen rubber samples. The two peaks close to 1456 cm−1 and 1376 cm−1 shown in the dry rubber are not related to aliphatic. This indicates that aliphatic compounds from bitumen diffused into rubber during the swelling process. Previous studies also observed the preferential absorption of compounds with linear aliphatic chains into rubber ( 18 ).
Rubber Swelling in Bitumen
A series of rubber swelling tests were performed at different temperatures to investigate the diffusion kinetics and volume change.
Diffusion Coefficients of Bitumen into Rubber
In relation to physics, the swelling of rubber in bitumen is a diffusion-induced volume expansion phenomenon ( 19 ). The driving force of the diffusion process is the chemical potential of the external solvent (maltenes) produced from the concentration difference between rubber and bitumen. This diffusion process continues until the concentrations of light fractions inside and outside the rubber are uniform and, consequently, equilibrium swelling is reached. Fick’s law of diffusion is usually used to describe the kinetics of bitumen diffusion into rubber. Considering the case of one-dimensional diffusion, the total amount of diffusing substance into rubber at time t can be expressed as ( 11 ):

where
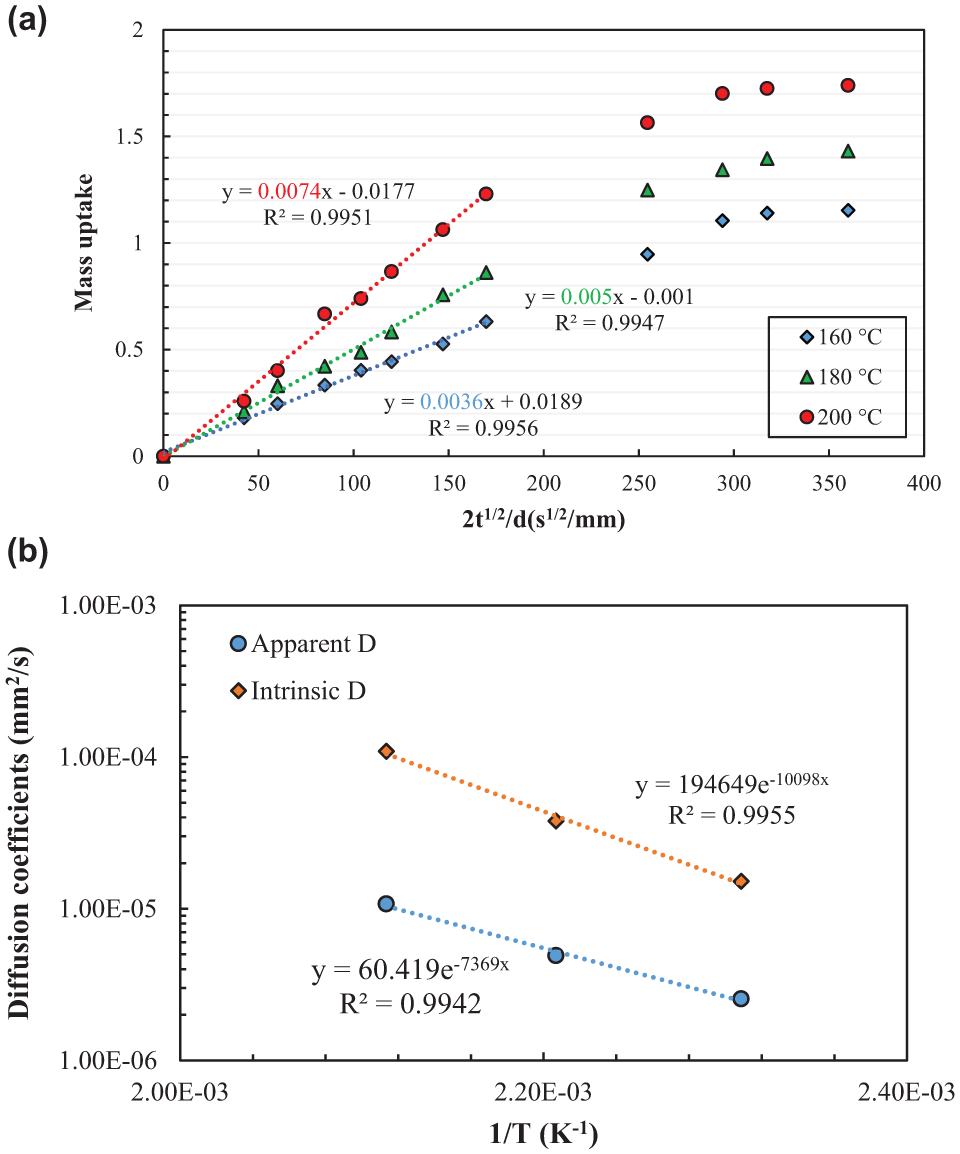
The bitumen uptake data collected from the sorption experiments (truck tire rubber and Pen 70/10 bitumen) at different temperatures are presented in Figure 4a in a plot of mass uptake versus 2t1/2/d. Each data point is an average value of three replicated samples. It can be found that the bitumen components were initially absorbed by rubber rapidly and then reach the equilibrium at elevated temperatures. The sorption curves showed a linear region followed by an equilibrium plateau region. Furthermore, bitumen uptake was faster at higher temperatures at the earlier stages as seen by the higher initial slopes of the sorption curve, which indicates a higher diffusion rate. The equilibrium mass uptake also increases as the temperature increases.
(a) Sorption curves of bitumen into truck tire rubber and (b) Temperature dependence of the diffusion coefficients.
The diffusion coefficients calculated from the initial slopes of the sorption curves and the approximate equilibrium mass uptake were summarized in Table 1. The diffusion coefficients determined here were considered as apparent because of several reasons (
12
). First, the sample thickness was assumed as constant, whereas in reality the thickness increased because of swelling. Second, the diffusion coefficient was assumed as constant and independent of concentration (in other words, the surface concentration of penetrant is constant). However, both bitumen composition and physical properties of rubber changed during the diffusion process. The light fractions of bitumen diffused into rubber preferentially at the earlier stages and the other fractions of bitumen might also diffuse into rubber at the later stages because of changes of the internal structure of swollen rubber. Therefore, corrections to diffusion coefficients under swollen conditions were made by calculating the intrinsic diffusion coefficient

where
Diffusion Coefficients and Equilibrium Mass Uptake of Bitumen into Truck Tire Rubber
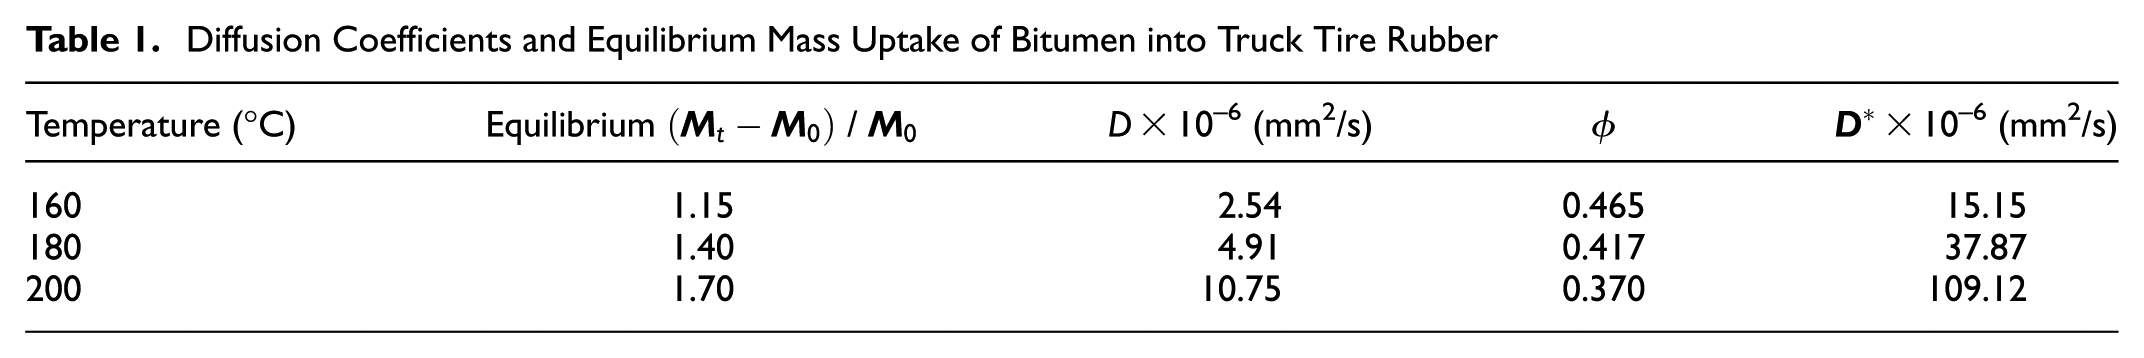
The relationship between diffusion coefficients and temperature was plotted in Figure 4b. The temperature dependence of the diffusion coefficient can be found to follow an Arrhenius equation (Equation 3). As the temperature increases, both the mobility of bitumen molecules and polymer chains increase, which enhances the diffusion process of bitumen into the rubber. Greater segmental motion results in an increase in the size of free volume and subsequent increase in the diffusion coefficient ( 21 ).

where
Volume Change of Rubber during Swelling in Bitumen
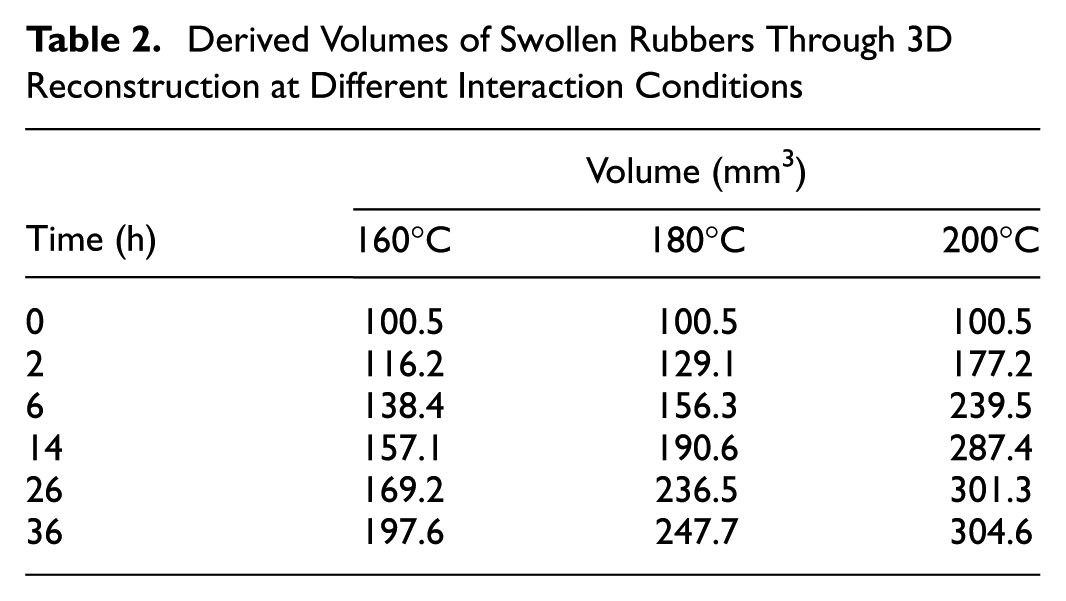
X-ray CT can distinguish objects based on the difference in density and reflect them in the obtained slice images with different greyscale levels. Figure 5 presents the cross-sectional images of the scanned samples at different interaction conditions. The raw images were cropped to remove the glass bottle with only bitumen and rubber left. The density of bitumen is 1.03 g/cm3 while the density of rubber is around 1.15 g/cm3. Therefore, the light part is the rubber cylinder while the surrounding dark part is bitumen. The value shown in each image represents the diameter of the rubber circle using the measurement function in the software. Considering the diameter of the original dry rubber sample is around 8 mm, the size of rubber sample continued increasing with the increase of interaction time at different temperatures. The rubber samples swell more at higher temperatures as reflected by the larger diameter. In addition, as more bitumen diffuses into rubber, the rubber phase becomes darker and the boundary between the two phases becomes vague. Taking the image at 200°C and 36 h as an example, it is difficult to distinguish the rubber phase and bitumen phase as the greyscale values of these two phases are already very close. It shows that the swollen rubber is saturated with bitumen components and may form a gel-like structure. To quantitatively evaluate the volume change of rubber during the swelling process, the 3D images of the object were reconstructed with the 2D slice images. The volume of each swollen rubber was derived using the built-in measurement function of the software. The volumes of the rubber samples at different swelling states were summarized in Table 2. Rubber swells faster at the earlier stages, then the expansion rate slows down. After 36 h interaction at 160°C, rubber swelled to twice as big as the original. The volume of rubber increased to approximately three times the initial volume after 36 h interaction at 200°C. Since rubber swelling is a diffusion-induced volume expansion process, it is logical that higher diffusion coefficients result in larger swelling ratios (swollen rubber volume divided by the dry rubber volume).
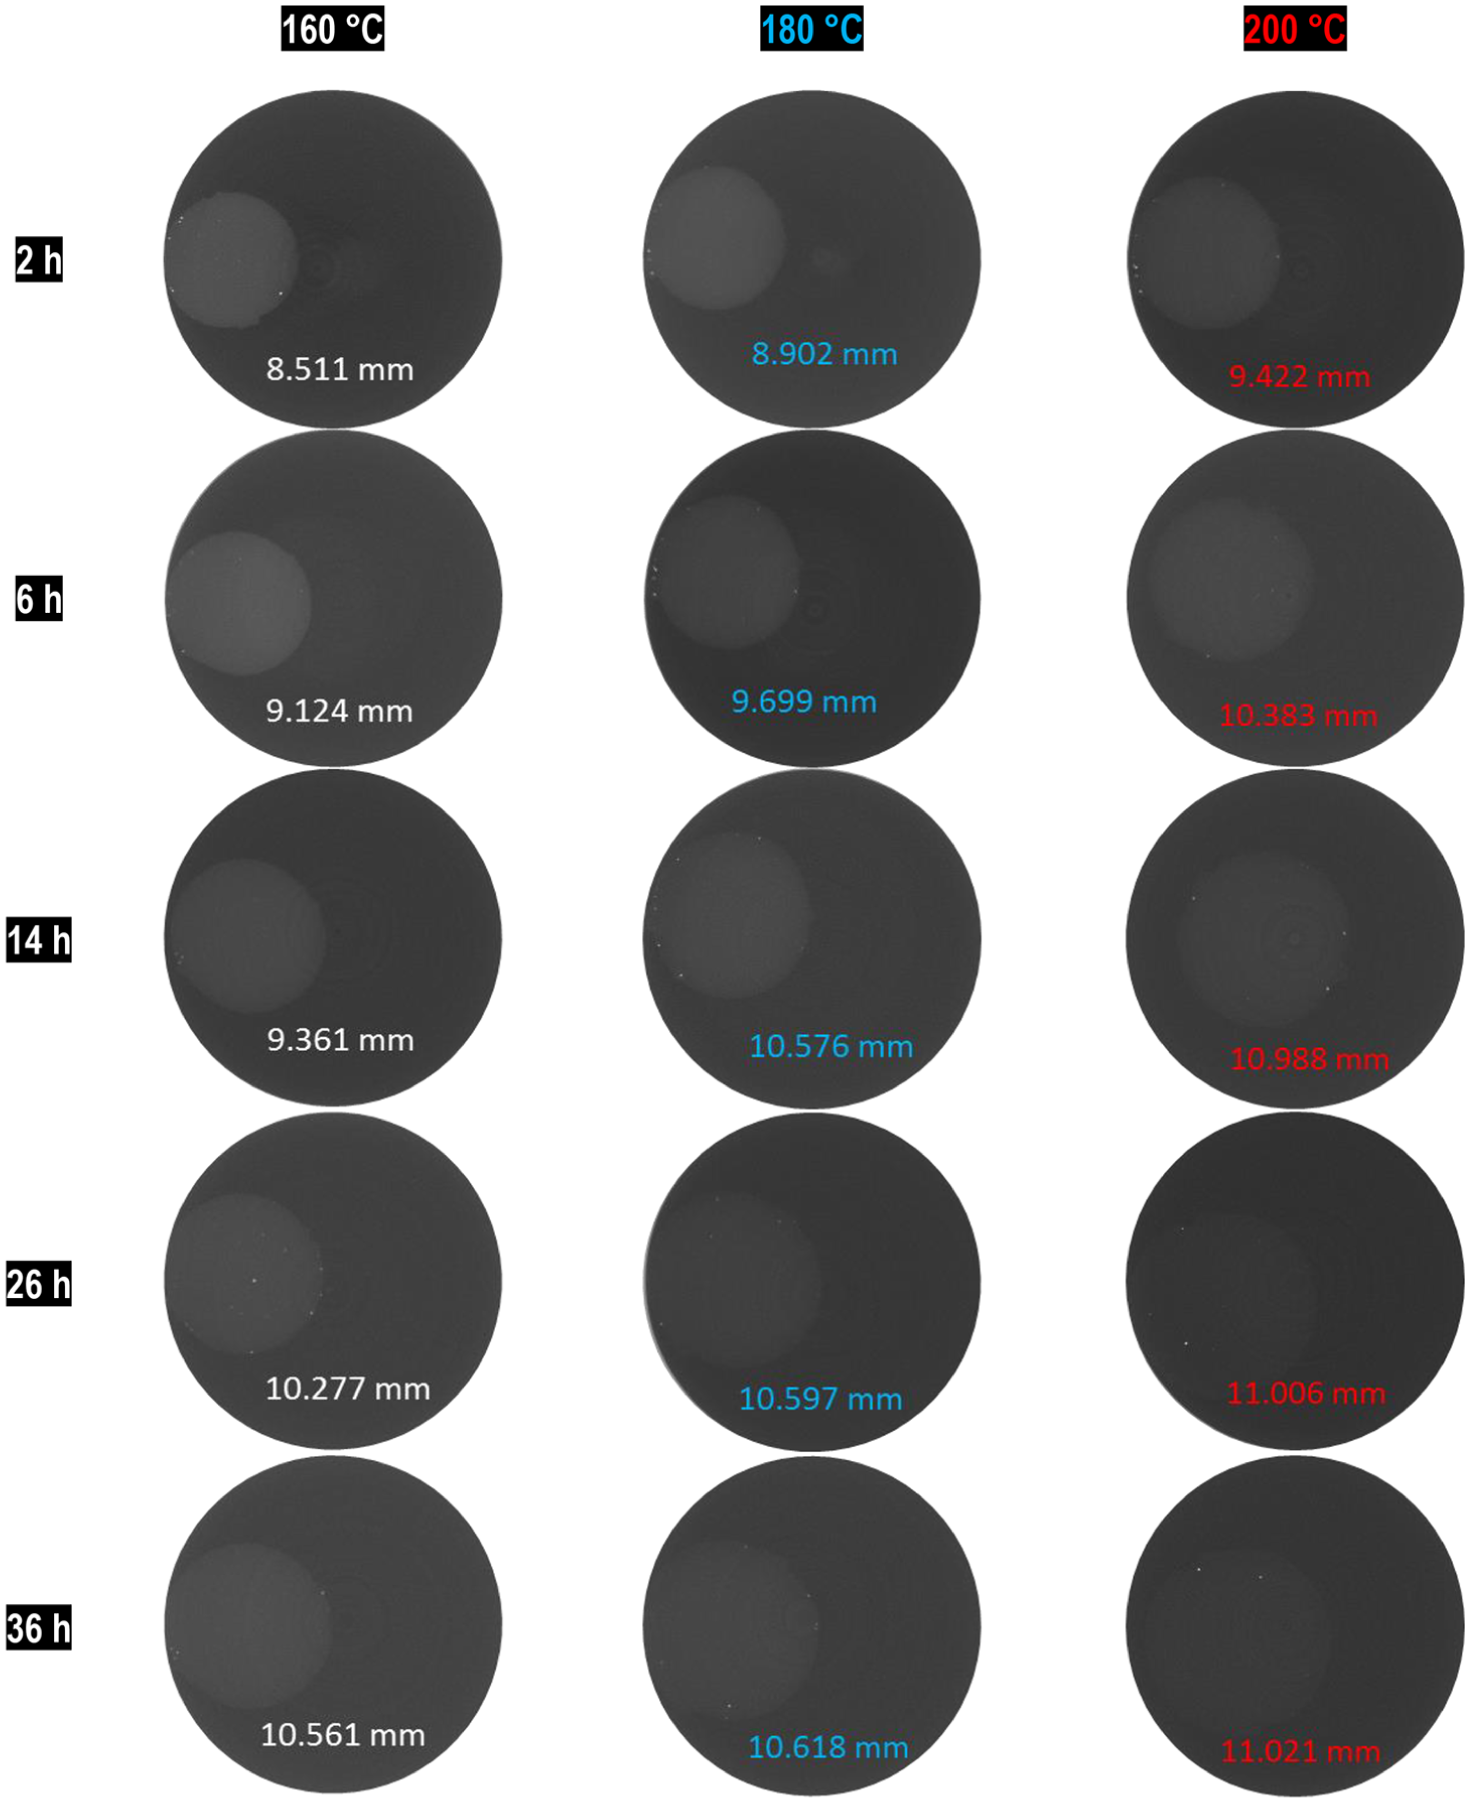
2D slice images from CT scan at different interaction temperatures and times.
Derived Volumes of Swollen Rubbers Through 3D Reconstruction at Different Interaction Conditions
Mechanical Properties Characterization
Mechanical Test by Dynamic Shear Rheometer (DSR)
The mechanical properties of rubber before and after swelling were tested by DSR. The unreacted (dry) cylindrical rubber sample can be directly placed between the 8 mm parallel plates of the DSR. Before the placement, a two-component adhesive, Plex 7742 and liquid Plexmon 801, was mixed and applied on the surface of the bottom plate and the top surface of the rubber sample. Excess glue was removed from the sides. The test started after 10 min hardening process of the adhesive to ensure a proper bonding between rubber and plates. After CT scan, the swollen rubber samples were taken out from bitumen after swelling for 36 h: it is believed to reach the swelling equilibrium at this moment based on the diffusion test. The swollen rubber samples were cleaned of bitumen by wiping with absorbent paper while hot and brushing gently for a few seconds with cold trichloroethylene. Through this process, the obtained swollen rubber sample is a gel-like material with aromatic oils inside the rubber network. Since the geometry of cylindrical rubber samples changed after swelling, a special drill tool with an inner diameter of 8 mm was used to trim the swollen sample to the desired diameter. Because of the good adhesion between the plates and swollen rubber, no glue was used. For both dry and swollen rubber samples, manual adjustment was applied on the gap between the plates until the normal force is close to zero.
Frequency sweep tests of rubber samples were performed from 0.1 to 100 rad/s over a temperature range of −10°C–130°C with an increment of 20°C. According to the previous study, the measurements were carried out at a strain level of 1% under strain-controlled mode ( 22 ). The viscoelastic parameters (complex modulus and phase angle) of each sample were collected and analyzed.
Effect of Swelling on the Mechanical Properties of Rubber
From a micromechanics point of view, CRMB can be treated as a composite material in which rubber particles are included in the bitumen matrix. The change in properties of rubber after swelling has an important effect on the mechanical properties of rubber modified binders. During the rubber swelling test process, it was found the swollen rubber sample became soft and viscous due the absorption of bitumen components, forming a gel-like structure ( 8 , 23 ). However, few studies have looked into the mechanical properties of this gel-like material. To further investigate the effect of swelling on the mechanical properties of rubber, the dry and swollen rubber samples after 36 h interaction at different temperatures were tested by DSR.
Based on the time–temperature superposition principle, the master curves of complex modulus and phase angle of different rubber samples at a reference temperature of 30°C were built in Figure 6. From the obtained data, it was found the swollen rubber is not a rheologically simple material so that common rheological models for bitumen are not suitable for it. Therefore, the master curves were established using a generalized logistic function in Equation 4 and the Williams–Landel–Ferry (WLF) equation (Equation 5) for shift factors fitting to form smooth curves ( 24 ).

where A is either complex shear modulus or phase angle. δ is the lower asymptote; α is the difference between the values of upper and lower asymptote; λ, β and γ define the shape between the asymptotes and the location of the inflection point.

where
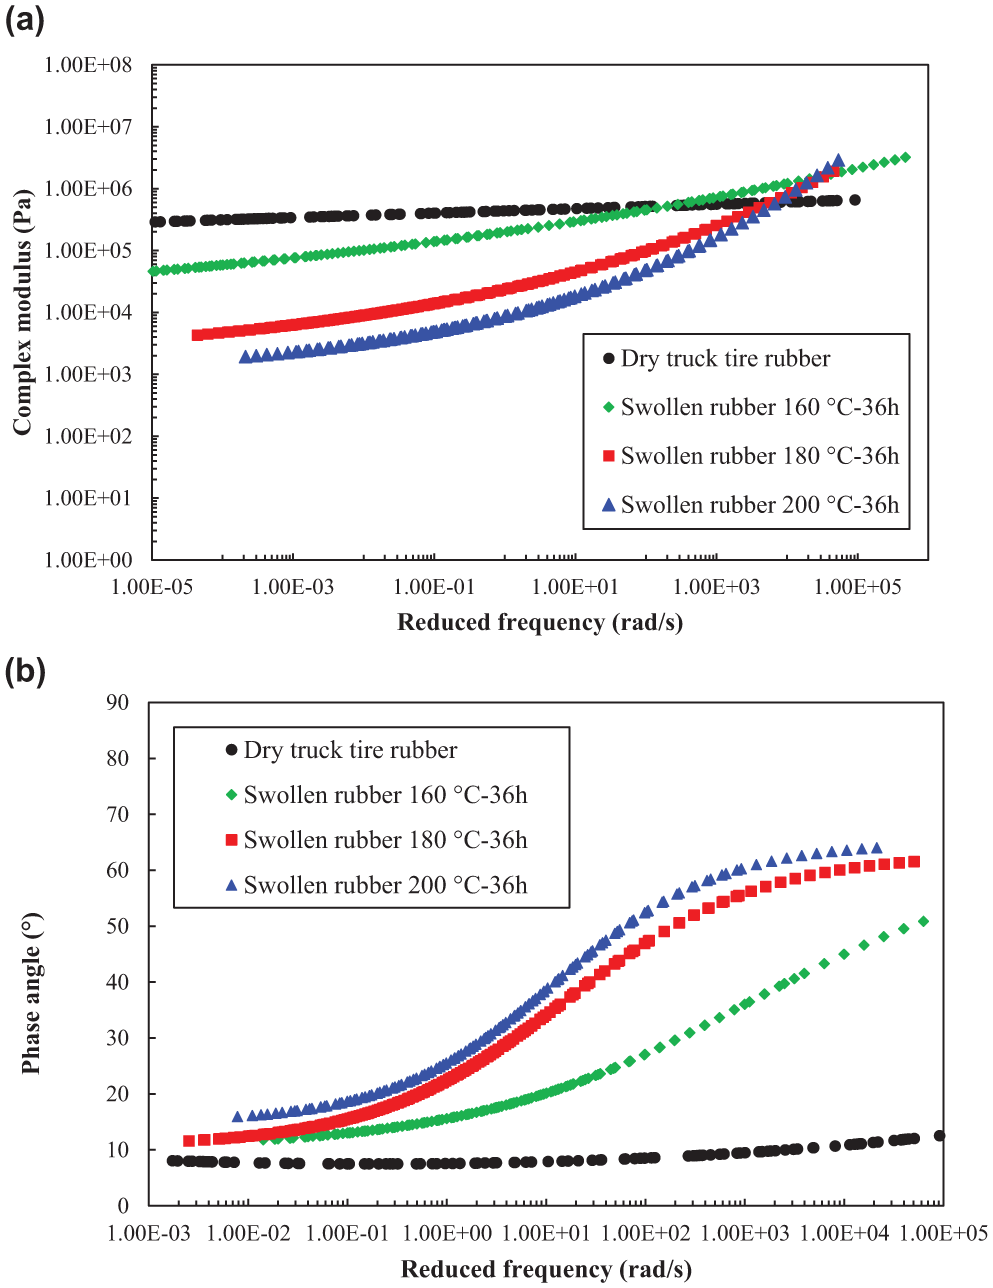
(a) Complex modulus and (b) phase angle master curves of rubber before and after swelling.
It can be seen that dry rubber exhibits obvious elastic behaviors whose complex modulus and phase angle are almost frequency independent. However, rubbers after swelling show obvious viscoelasticity. The complex moduli of swollen rubbers were all lower than the dry rubber in the low-frequency range. At high frequencies, the modulus of different samples crossed each other. Based on the existing master curves, it can be anticipated that swollen rubber interacted at 200°C for 36 h shows the highest modulus at very high frequencies (corresponding to very low temperatures). This is because the absorbed bitumen in the swollen rubber sample plays a more dominant role than rubber and behaves more elastic in the composite at low temperatures. Considering the complex modulus of bitumen used in this study at very high frequencies is higher than rubber, the swollen rubber sample containing more bitumen will exhibit higher complex modulus at very high frequencies ( 25 ). At the dry state, rubber polymer chains are entangled or crosslinked to each other, forming tightly folded coils, which contributes to the rubber elasticity. When the rubber polymer chain segments start to absorb bitumen molecules, the folded polymer coils start unfolding, causing the swelling and loosening of the network. Consequently, this polymer network swelling process will decrease the complex modulus at a macroscopic scale. With the increase of interaction temperature, the modulus of swollen rubber decreases while the phase angle increases. This means the viscous component in the swollen rubber increases after the interaction at higher temperatures. It is noteworthy that the phase angles of swollen rubber samples increase with the increase of frequency, which is contradictory to the common behaviors of bitumen. This is the unique nature of rubber polymers. Actually, the phase angle of rubber usually experiences an increase stage and then a decrease stage over a large frequency range ( 26 ).
Conclusions and Recommendations
This study conducted various laboratory tests to investigate the swelling process of rubber in bitumen. The following conclusions can be drawn:
Through FTIR results, no rubber dissolution (or too inconspicuous to be detected) during interaction with naphthenic oil takes place in the temperature range from 160°C to 200°C. This supports that rubber did not dissolve into bitumen in the same temperature range. Aliphatic compounds from bitumen preferentially diffused into rubber during the swelling process.
Through bitumen sorption tests, the corrected diffusion coefficients of Pen 70/100 bitumen into truck tire rubber are determined as 15.15 × 10⁻⁶, 37.87 × 10⁻⁶, and 109.12 × 10⁻⁶ mm2/s at 160°C, 180°C, and 200°C, respectively. The diffusion coefficient increases with the increase of temperature in an Arrhenius form.
The volume expansion of rubber during swelling was captured by the CT scan images. Rubber swells faster at the earlier stages, then the expansion rate slows down. The swelling ratio of rubber increased from 1.97 at 160°C to 3.03 at 200°C after 36 h interaction.
Through DSR tests, swollen rubber becomes softer compared with the dry rubber and exhibits obvious viscoelastic behaviors. With the increase of temperature, the softening and viscous effect are more significant.
The obtained diffusion coefficients, swelling characteristics, and mechanical properties can be further used as the model inputs for both numerical simulation of rubber swelling process and micromechanical models, to better predict the mechanical performance of CRMB ( 27 ). Further research can be extended to more material combinations, for example bitumen with different chemical compositions, and car tire rubber.
Footnotes
Author Contributions
The authors confirm contribution to the paper as follows: study conception and design: Haopeng Wang, Xueyan Liu, Sandra Erkens, Athanasios Skarpas; data collection: Haopeng Wang; analysis and interpretation of results: Haopeng Wang, Xueyan Liu, Panos Apostolidis, Athanasios Skarpas; draft manuscript preparation: Haopeng Wang. All authors reviewed the results and approved the final version of the manuscript.
Data Accessibility Statement
The datasets generated during and/or analyzed during the current study are available from the corresponding author on reasonable request.
Declaration of Conflicting Interests
The author(s) declared no potential conflicts of interest with respect to the research, authorship, and/or publication of this article.
Funding
The author(s) disclosed receipt of the following financial support for the research, authorship, and/or publication of this article: H. Wang would like to thank the financial support from China Scholarship Council. The financial support of Khalifa University via the CIRA-2018-115 research grant is also gratefully acknowledged.