
Abstract
The distribution of passenger demand over the transit network is forecasted using transit assignment models which conventionally assume that passenger loads satisfy network equilibrium conditions. The approach taken in this study is to model transit path choice as a within-day dynamic process influenced by network state variation and real-time information. The iterative network loading process leading to steady-state conditions is performed by means of day-to-day learning implemented in an agent-based simulation model. We explicitly account for adaptation and learning in relation to service uncertainty, on-board crowding and information provision in the context of congested transit networks. This study thus combines the underlying assignment principles that govern transit assignment models and the disaggregate demand modeling enabled by agent-based simulation modeling. The model is applied to a toy network for illustration purposes, followed by a demonstration for the rapid transit network of Stockholm, Sweden. A full-scale application of the proposed model shows the day-to-day travel time and crowding development for different levels of network saturation and when deploying different levels of information availability.
Transit performance is the result of the dynamic interactions between supply and demand. Day-to-day variations as well as the inherent uncertainty of transit services, especially when operating in complex urban environments, influence service reliability and on-board crowding. Passengers’ route-choice decisions may be influenced by their own past experience as well as the provision of relevant information. The distribution of passenger demand over the service network is forecasted using transit assignment models (TAM) which conventionally assume that passenger loads satisfy network equilibrium conditions. By calculating equilibrium conditions, TAMs load transit passengers on a given transit network to obtain passenger loads and the level of service, making them a fundamental analysis and evaluation tool at both planning and operational levels. Static TAMs represent passenger demand in relation to aggregate flows and therefore do not consider how behavioral responses evolve as a result of disaggregate service dynamics and variations. This study presents a dynamic TAM with a disaggregate demand representation and explicit modeling of the evolution of individual passenger experience and their perception of on-board crowding, service reliability and alternative information sources.
Models for loading passengers represent transit networks either in relation to common line segments or time-dependent vehicle trips, commonly denominated as frequency-based and scheduled-based models, respectively ( 1 ). These models are used for strategic planning such as evaluating network design implications. The modeling tools available for strategic transit planning purposes typically lack explicit representation of the dynamics in transit systems, which may lead to unrealistic passenger loads or travel times, as illustrated elsewhere ( 2 – 4 ).
Transit simulation models have emerged in the last decade as a tool for analyzing operations and real-time control ( 5 – 7 ). These models mimic the dynamics of transit operations. Transit models can be therefore described as either strategic transport models, which predict how a given level of service affects traveler behavior (i.e., departure time, mode and route choice), or detailed transit-traffic simulation models, which are used for modeling the level-of-service changes as a consequence of operational measures.
This study brings together the underlying assignment principles that govern TAMs and the disaggregate demand modeling enabled by agent-based simulation modeling. Substantial interdependencies between transit level of service and passenger behavior require a transit path choice model that is sensitive to traffic congestion, crowding, failure to board and real-time information provision. In the context of transit assignment, effects of information and level-of-service variations (e.g., crowding) are most suitably described as within-day events embedded in an evolutionary day-to-day process. The dynamic stochastic decision-making that this implies is most naturally implemented as an agent-based simulation model, as has been acknowledged in the car traffic assignment research domain ( 8 ). An agent-based modeling framework which represents individual vehicles as well as individual passengers can potentially allow obtaining network loading conditions as a result of passengers’ adaptation to network conditions and to uncertainty through day-to-day learning in a bottom-up fashion ( 5 ).
A TAM can be based on equilibrium conditions or dynamic loading process. The Stochastic User Equilibrium TAM is formulated as a fixed-point problem typically solved by the heuristic method of successive averages technique ( 9 – 14 ).
Day-to-day learning models have similarities with equilibrium models in that they also have the ability to explore the long-term user adaptation effects of a certain network setup, that is, repeated games. Nagel and Marchal show that while day-to-day learning may not satisfy the mathematical definition of equilibrium conditions, the iterative process results in a stochastic user equilibrium ( 15 ). Cascetta and Cantarella exploited this feature to present a doubly dynamic assignment model for car traffic, in which they model both within-day and day-to-day flow fluctuations as a stochastic process and formulate a fixed-point solution to the dynamic network loading problem ( 16 ). However, in a within-day dynamic framework, unique and stable equilibrium is unlikely to exist. Moreover, agents, who by definition are autonomous decision makers, cannot be assigned to paths strictly according to equilibrium ratios. Therefore, the goal in an agent-based transport model is not to find the equilibrium per se, but rather to emulate the processes leading to it. Thereby, transient effects can also be investigated. Ettema et al. developed a day-to-day learning model in an agent-based car traffic assignment framework ( 17 ), whereas Wahba and Shalaby applied similar concepts in transit assignment ( 6 ).
This paper develops a complete path choice model based on within-day and day-to-day adaptation with hyper-paths. The doubly dynamic model builds on the dynamic and stochastic transit simulation model developed by Cats et al. which was used for evaluating the benefits of increased capacity( 4 ). However, the main pitfall was the inconsideration of the consequences of congestion effects on individual route choice. This deficiency is addressed in this study by developing a behavioral learning mechanism for a dynamic agent-based transit assignment model. Moreover, in addition to on-board crowding conditions, passengers update the credibility of different sources of information from day to day.
The key contribution of this study is the development of an iterative network loading for a dynamic TAM that accounts for within-day uncertainty. The iterative network loading is facilitated by a learning process that obtains a congested transit equilibrium that for the first time arises from the disaggregate evolution of expected travel costs that are based on accumulated experience of service reliability, travel information and the reliability of travel information. Thereby, we attain full consistency between expected and experienced travel times. Two key features of this study set it apart from past work: the notion of credibility coefficients attached to different information sources such as experience and information as well as their evolution; and the dynamic modeling of service uncertainty and thereby variations in on-board crowding conditions which allows for their incorporation in the day-to-day context.
The outline of the remainder of this paper is as follows. In the next section the developments in modeling individual learning in relation to travel reliability and information in agent-based transport assignment models are reviewed, with a focus on transit-related studies. The authors then present the modeling approach including a brief description of the dynamic path choice model and then detail how the learning mechanism incorporates user experience pertaining to service and information reliability. The model is then applied to a toy network for illustration purposes, followed by a demonstration for the rapid transit network of Stockholm, Sweden. Furthermore, the implications of different levels of information availability are chartered in the application section. The paper concludes with reflections on the potential and limitations of the proposed approach.
Adaptation and Learning in Agent-Based Transport Assignment Models
The steady-state condition in a system involving many utility maximizing agents is known in game theory as Nash equilibrium. User equilibrium models, both deterministic and stochastic, have been developed and enhanced over the last decades for static traffic and transit assignment. Many of the developments in the transit sphere adopted ideas from car traffic assignment models and tried to adjust them to transit network conditions. However, several characteristics of transit systems introduce additional complexities as compared with the car traffic assignment problem. The main reason for the greater complexity is the need to represent the line-based service layer and its limited availability in both space and time. This is especially evident in the case of transfer connections with temporal and spatial constraints. An additional complexity arises from the relationship between service uncertainty, passenger loads, comfort, travel times and capacity constraints.
Following developments in car traffic assignment, several models for performing iterative transit network loading using day-to-day learning have emerged in the last two decades. Nuzzolo et al. developed a day-to-day learning procedure that involved updating expectations concerning waiting time, in-vehicle time, and on-board crowding in a schedule-based transit assignment model ( 11 ). Agent-based models such as MATSim ( 5 ) and MILATRAS ( 6 ) have implemented learning mechanisms and uncertainty in the transit assignment. The path choice in both models is limited to pre-trip and does not include hyper-paths, hampering the application of flexible path choices in the TAM.
The credibility of different information sources is an integral part of route choice. In the car traffic context, Emmerink et al. argue that the effects of advanced traveler information systems should be analyzed at the driver level and model this in a bounded rationality framework, where real-time information is used to update path choice en-route ( 18 ). Jha et al. developed a Bayesian updating model (implemented in the dynamic car traffic simulator DYNASMART) for travel time perception formed by a combination of real-time information and previous experience ( 19 ). The Bayesian approach accounts for travel time uncertainty and information source confidence. In the transit context, MILATRAS includes a deterministic en-route choice component for considering real-time information which is modeled as equivalent to perfect network knowledge in MILATRAS. Thus, Wahba and Shalaby assume that in the presence of real-time information, passengers’ expectations and experiences are identical; travel predictions are thus assumed to be perfectly reliable ( 6 ). The (un)reliability of real-time information was explicitly addressed by Cats and Gkioulou ( 20 ). They developed an agent-based learning framework implemented in a transit simulation model with hyper-paths for considering passenger within-day and day-to-day adaptation to waiting time uncertainty, real-time information and failure to board.
Agent-based dynamic transit assignment face considerable challenges in maintaining two essential properties: the hyper-path property ( 21 ) and obtaining consistent values of time ( 22 ). Value of time is essential in all stages of transport modeling and evaluation, as it determines how the traveler selects between alternatives. In transit, value of (perceived) time depends heavily on the crowding level and on the comfort and reliability of the travel time. In agent-based transit simulation models, travel time and valuations may differ between the expected values used in the choice model and the experienced values that come out from the model as a result of the absence of a day-to-day learning mechanism.
A commonly applied learning model, reinforcement learning, formulates the expected payoff as an average of past payoffs, possibly including the payoffs of strategies that were not chosen. Camerer et al. studied the cognitive processes leading to Nash equilibrium ( 23 ). Cheng et al. empirically validated the behavioral parameters for day-to-day learning for car traffic assignment using license plate recognition data ( 24 ). Avineri and Prashker found in laboratory experiments that high variability in route travel times leads to slower learning, which in the short term favors the more variable alternative ( 25 ). As pointed out by Ettema et al., the weight given to previous payoffs depending on their recency is an important parameter in the learning function ( 17 ). However, humans learn faster than predicted by the reinforcement learning rule for two main reasons: sophisticated players are able to anticipate the behavior of other players, and experienced players teach less experienced players. These findings support the idea that all or most travel time experience in a transport model should be available to all travelers. On the other hand, travel time experience in transit depends heavily on the time of boarding, which makes it difficult to form universal travel time experiences.
The approach taken in this study is to model transit path choice as a within-day dynamic process influenced by network state variation and real-time information. The iterative network loading process leading to steady-state conditions is performed by means of day-to-day learning implemented in an agent-based simulation model. The authors explicitly account for adaptation and learning in relation to service uncertainty, crowding and information provision in the context of congested transit networks. The application part of the study examines arguments for and against universal travel time experiences (as opposed to learning based on individual experience only).
Modeling Approach
The following first introduces how paths are defined so that they can be incorporated into a probabilistic en-route dynamic travel model by calculating action probabilities. The experiences are then integrated into the learning process, and the stopping criterion determines whether convergence has been attained. Finally, model implementation in the simulation platform is briefly described.
Paths
In this study, a path is defined as an ordered set of stops which allows a traveler to move from the origin to the destination by traversing exactly these stops. Path definition is associated with a fixed number of transfers without either prescribing the transit lines to be used or the exact stops at which transfers between lines will take place (see Figure 1).
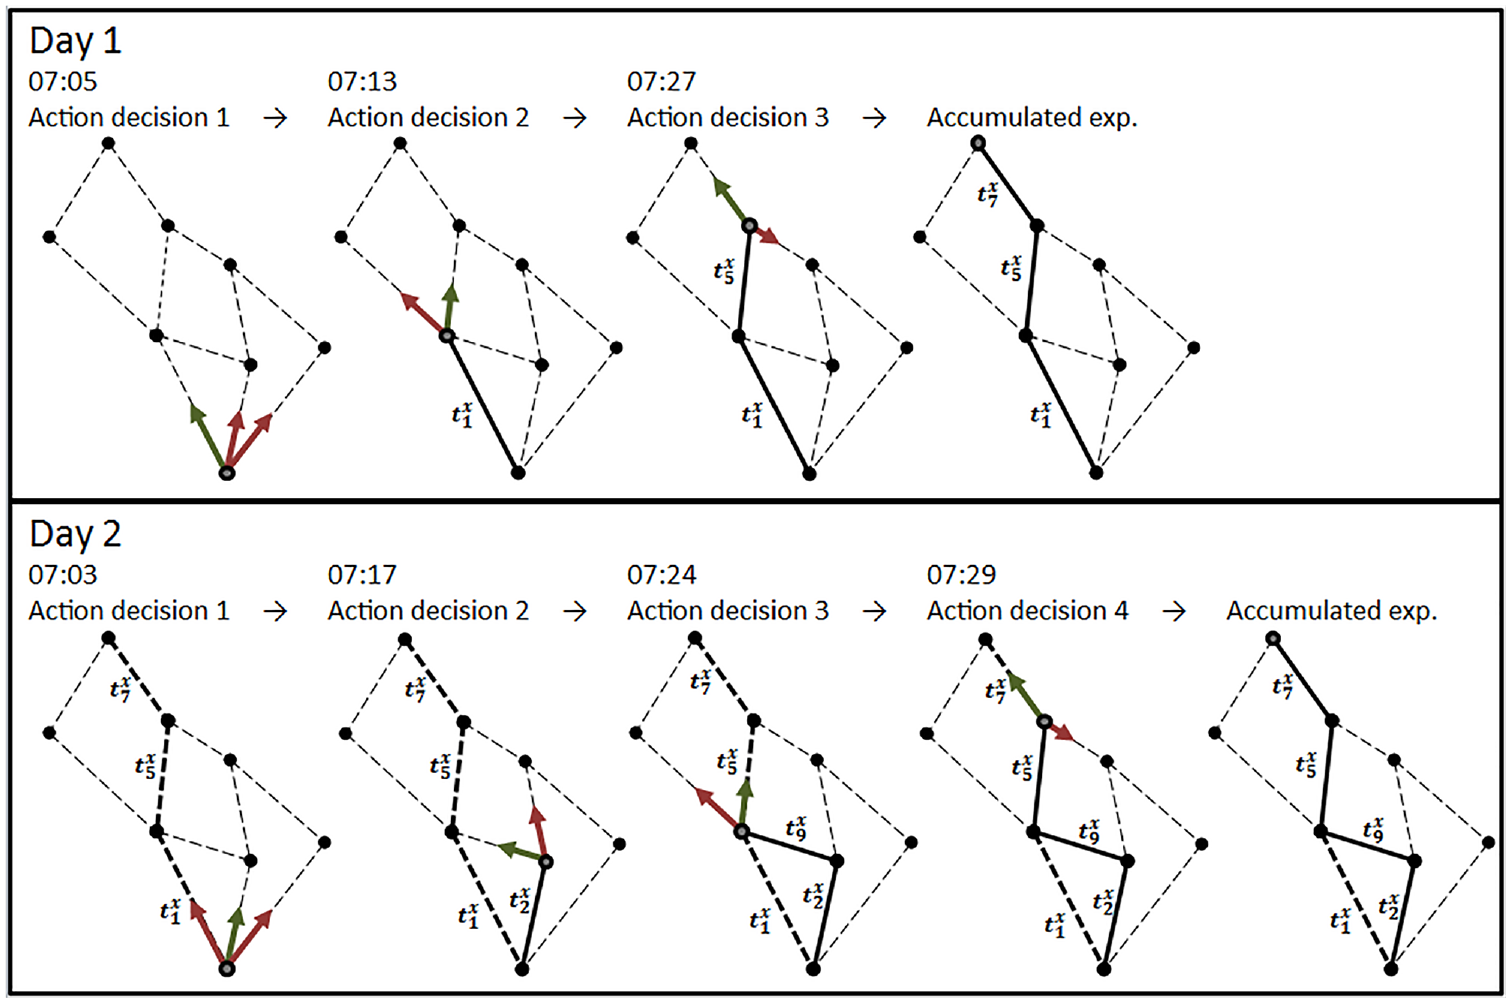
The agent makes a sequence of dynamic decisions based on scheduled travel (green arrows indicate the chosen action and red arrows indicate other evaluated action alternatives).
Paths are generated as part of model initialization by applying some conditions and filtering rules, such as maximum number of transfers, maximum walking distance and dominancy (a path being inferior to another in all aspects) ( 26 ).
When passenger agents start from their origin and travel through the transport system, the exact path they follow is neither known nor ever decided upfront. Instead, the agent takes each action decision (i.e., boarding vs. staying at the stop, at which stop to alight, whether to stay at a given stop or walk to a neighboring stop) based on the combined utility of the paths leading to the destination from the current position included in these actions. Figure 1 provides a schematic chart illustrating the dynamic path notion adopted in this study. A boarding passenger does not choose a specific path involving a certain boarding action, but rather chooses a boarding action by evaluating all the associated possible paths (as well as those associated with the alternative action, namely to stay at the stop and wait for another service). Note that all downstream conditions are assessed at each choice-making situation, therefore this is not a myopic process. If the passenger decides to stay at the stop (or is denied boarding because of overcrowding), a new boarding decision will be prompted upon the arrival of the next transit vehicle. A similar choice structure is prompted when the passenger selects where to alight and whether to remain at the stop or walk elsewhere upon alighting at a stop. This notion can be considered the dynamic variant of the hyper-path notion introduced in the seminal works of Nguyen and Pallottino ( 21 ) and Spiess and Florian ( 27 ).
Although this approach resembles the Optimal Strategies algorithm ( 27 ) in the ability to model strategies (hyper-paths) rather than paths, it still relies on path enumeration as the fundamental choice set. The algorithm includes implicitly the joint frequencies of all attractive lines at the current stop (and thus in the resulting travel time), as the probability of choosing the first arriving vehicle at each instance is higher because of the shorter (expected) waiting time. It also includes joint frequencies of the lines further downstream in a specific path, but because of its tree-like structure, it lacks the ability to base decisions explicitly on joint frequencies of different paths further downstream. However, as explained below, this deficiency is relaxed by the learning mechanism. Another deficiency is that the choices currently apply multinomial logit, which assumes the independence of irrelevant alternatives (IIA) property, although it is well known that transit route choice frequently violates the IIA property. The choice structure partially mitigates this problem, as the most correlated alternatives (i.e., same visited stops) will be in the same branch of the tree.
Action Probabilities
The action decisions take place in a random utility framework, in which the probability that passenger

where

The passenger
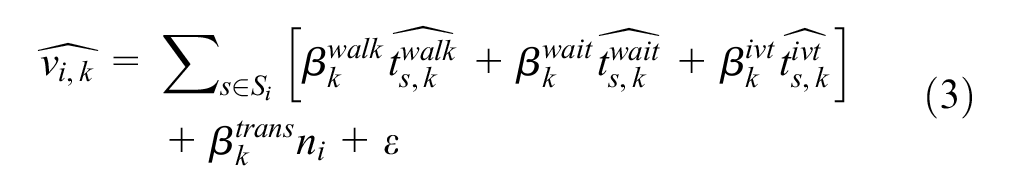
The generalized travel cost comprises of the summation of all travel attributes—walking, waiting and in-vehicle time—for all travel segments
The expected travel time

where
Learning
The iterative day-to-day learning allows passengers not only to gain experience and update their expectations regarding their waiting and in-vehicle times, but also enables the evolution of credibility coefficients. The latter reflects how informative and reliable passengers perceive various information sources to be by means of updating their respective weights. The credibility level
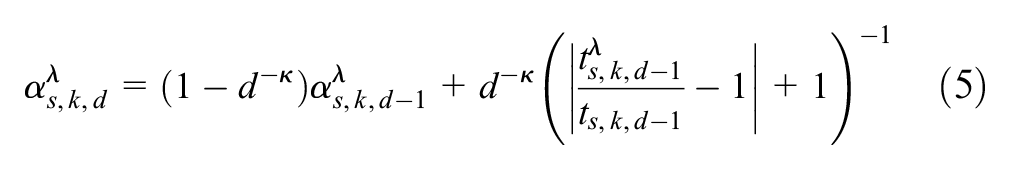
where
The model applies reinforcement learning. The accumulated travel time experience on day

Bogers et al. found that the weight of the most recent experience of travel time is decreasing throughout the learning period (
28
). The recency parameter
On-board crowding affects the perception of the travel time, and therefore the crowding level determines
Even though the learning framework is developed for passengers gaining individual experiences, the simulation also allows consideration of the experiences gained by fellow passengers. Thus, the experience of a travel segment for a certain day and time period is the average experience of all passengers that used that segment during the same time period. This approach has been implemented as an alternative approach for attaining steady-state network state conditions, enabling the investigation of the effect of information availability on network loading evolution.
Convergence
The travel time and path choices will inevitably vary from day to day as a result of model stochasticity. The convergence indicator is defined in relation to the perceived in-vehicle time and respective credibility coefficient which are both subject to day-to-day learning as follows:
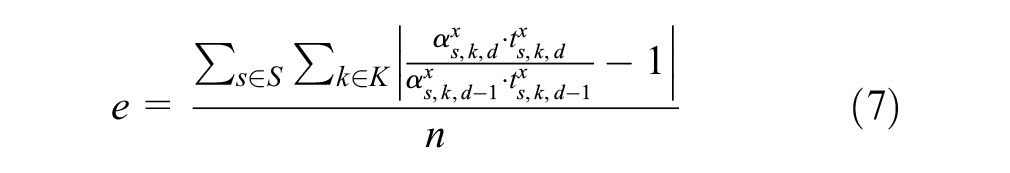
where
Implementation
The model is implemented in the event-based simulation framework BusMezzo, which includes traffic dynamics and transit operation and control ( 29 ). BusMezzo models individual vehicles, but not their second-by-second movements. The simulation model keeps track of the passenger occupancy of each individual vehicle along its trip. The number of seats and vehicle capacity (number of seats plus the maximal number of standing passengers) are specified per vehicle type. The disutility of in-vehicle time depends on whether a passenger has a seat or has to stand, as well as on the on-board crowding. Previous studies have demonstrated that BusMezzo can reproduce the bunching phenomenon ( 29 ) and represent dynamic congestion effects including variations in on-board crowding and denied boarding ( 4 ). Model sensitivity to supply and demand parameters has been examined by Cats and Hartl ( 3 ).
The proposed model contains two sets of parameters: (i) crowding coefficients incorporated in the route-choice model, and (ii) learning coefficients included in the day-to-day function. The former can be estimated using stated preferences extracted from choice experiments ( 30 , 31 ) or revealed preferences inferred from smart card data records ( 32 , 33 ). The learning coefficients are conventionally estimated using repeated-experiment games ( 28 ).
Application
The model has been tested for two networks. First, a toy two-link network is used to illustrate model properties under highly congested conditions. Second, the dynamic assignment model is applied on the rapid transit network of Stockholm. Each network is run for 20 days, to study the progression of the day-to-day learning and the experienced travel time, which proved to be sufficient to attain steady-state conditions. As part of the experiments the authors examine, in addition to the individual experience and learning, the case of the so-called “shared experience.” This allows study of the evolution and convergence properties of these alternative specifications.
Utility function parameters, the
Toy Network
Network Settings
The simple toy network consists of one origin and one destination with two lines, A and B, connecting them. The lines depart from different stop locations and travelers cannot change to the other line once the decision has been taken. The headway for both lines is 5 min. Line B has a shorter nominal travel time than line A (10 min for line B compared with 15 min for line A), but the vehicle capacity for line B is limited to 100, which is only one-tenth of the capacity of line A with a capacity of 1,000 passengers. The total hourly line capacity per hour is therefore 1,200 for line B and 12,000 for line A.
Assume a demand of 3,600 travelers generated evenly during 1 h in the toy network. Upon initialization, the travelers expect a waiting time of 2.5 min (i.e., 150 s) for both lines, so line B will be the preferred choice because of the shorter in-vehicle travel time it offers. The travelers are assumed here to have homogenous preferences and depart every day within the same 10 min time window (the exact departure time is randomized within the time window to avoid a situation in which passengers arrive to the first stop in the exact same order every time).
Passenger Flow and Travel Time Evolution
The waiting time convergence gives a good sense of what happens at the line level in extreme crowding situations. On the first day, the faster and more exclusive line B becomes extremely oversaturated, which results in passengers left behind and very long waiting times, that is, an average waiting time of 40 min because of successive failure to board and after accounting for the perceived denied boarding multiplier. In the succeeding days the experienced waiting time becomes substantially shorter and only 5–15% of the travelers experience denied boarding, but the experience attained on the first day is retained in the accumulated experience for a relatively long time. When travel time experience is shared among all travelers, most passengers switch to line A on the second day (Figure 2, right). As the in-vehicle travel time is longer on line A, the few passengers left on line B now get a comparatively comfortable and short trip. Thus on the third day many of the passengers return to line B. In this way the passenger demand oscillates between lines A and B. Because of the diminishing weight attached to the experience gained on the last day in the learning function (Equation 6), the expected waiting time stabilizes after a while and the fluctuations diminish.
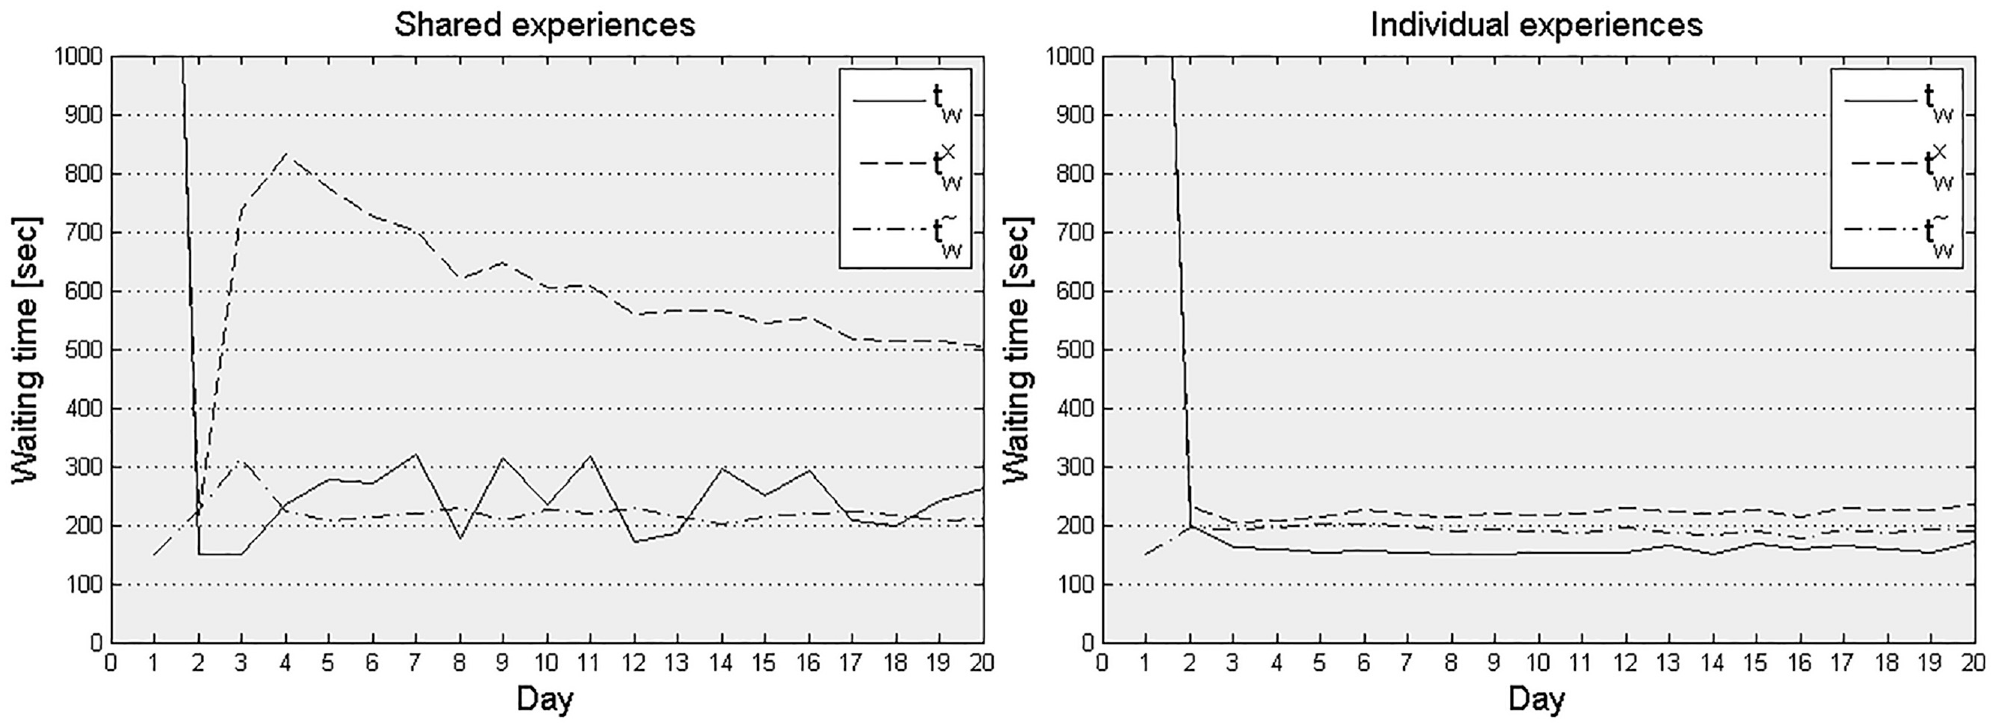
Average waiting time day-to-day learning curve in the toy network for shared (left) and individual (right) experience accumulation.
With individual memory (Figure 2, left) a larger share of the passengers choose to stay on line B on the second day. These are the passengers that were able to board quickly and found a seat quickly on the first day. For most of the travelers, however, line B was such an extremely negative experience on the first day that they refrain from trying it again. After the first day, less than 5% of the travelers experience denied boarding.
These tests indicate that neither individual nor shared memory gives entirely stable travel times in a highly congested network. This is because, at capacity, waiting time resulting from denied boarding is very sensitive to small changes in traveler choices. Traveler choice in the model is stochastic and users are assumed to make new decisions every day. The convergence indicator
Sensitivity Analysis: Recency Parameter
A sensitivity analysis for the recency parameter
Sensitivity Analysis: Passenger Demand
To study the impact of network saturation on flow distribution and its evolution, a sensitivity analysis is performed by varying the overall passenger demand level between 600 and 4,800 passengers per hour (Figure 3). Different levels of network saturation lead to different experienced waiting time on the first day. However, as a result of the learning process, the experienced waiting time for different levels of demand is almost the same on day 20 in the toy network. This is visible in Figure 3, in which the waiting time for day 1 and 20 for different levels of demand is plotted. It also shows the number of travelers on line B on the respective days. As demand increases the waiting time on the first day becomes significantly longer. On day 20, however, the travelers clearly have learned to prefer line A, so waiting time is relatively short also for high demand levels.
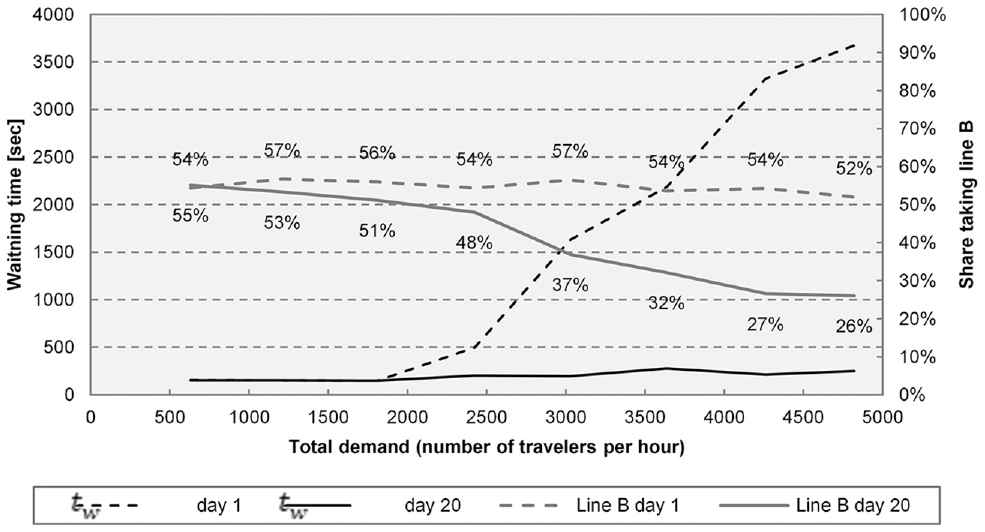
Waiting time and path choice as function of demand in the toy network.
Stockholm Network
Case Study Description
The Stockholm network analyzed in this study consists of 12 bidirectional lines (Figure 4). In the assignment, 78,000 travelers associated with 4,600 different origin–destination pairs are distributed over more than 600,000 possible paths during the a.m. peak hour. Just as in the toy network, all trips are generated within 1 h and are assumed to maintain their departure time window from one day to the other. The simulation running time for a single run (day) is less than 1 min on a standard laptop. Because of the model stochasticity, any final travel time result should be the average of several simulation instances. To yield a maximum allowable error of less than 1% for the average generalized passenger travel time, 10 simulation runs are found sufficient.
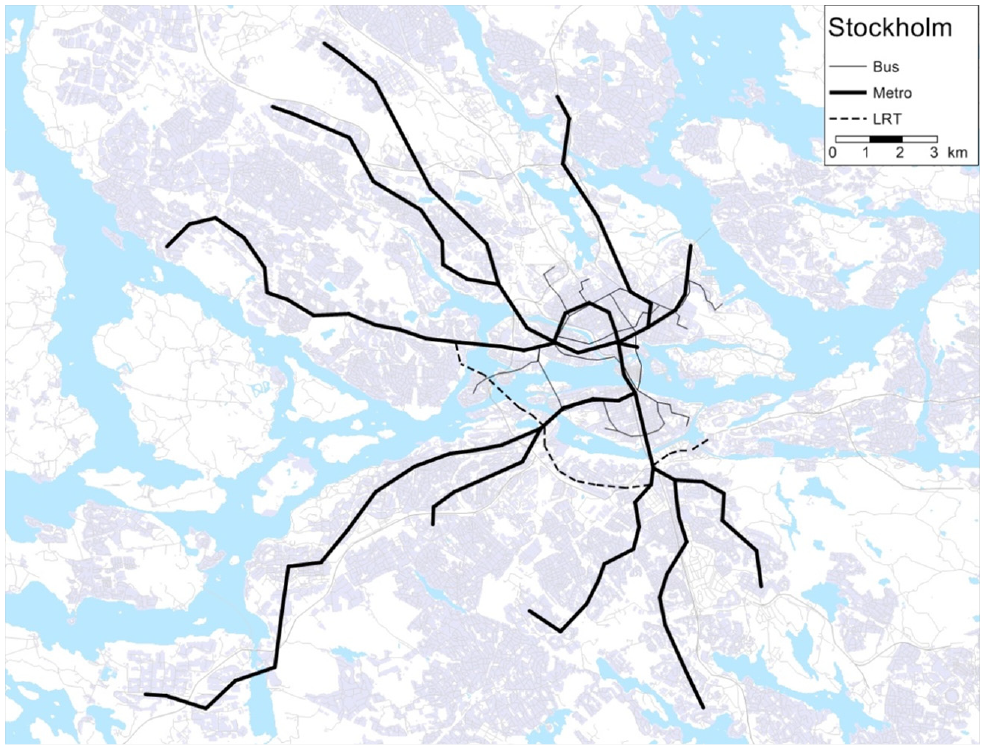
The Stockholm network.
Waiting Time Evolution
The waiting time day-to-day development in the full-size network is slow when solely utilizing individual experiences (Figure 5). Differently from the toy network, passengers have many travel alternatives and therefore need to explore the network before they can exploit alternatives based on their experiences. Conversely, with shared experiences the learning process accelerates significantly so that waiting times reach steady-state conditions after just four iterations (days). Model outputs gradually converge and approach the expected waiting time for both individual and shared learning cases, albeit at different speed. At the individual passenger level the experience continues to fluctuate moderately.
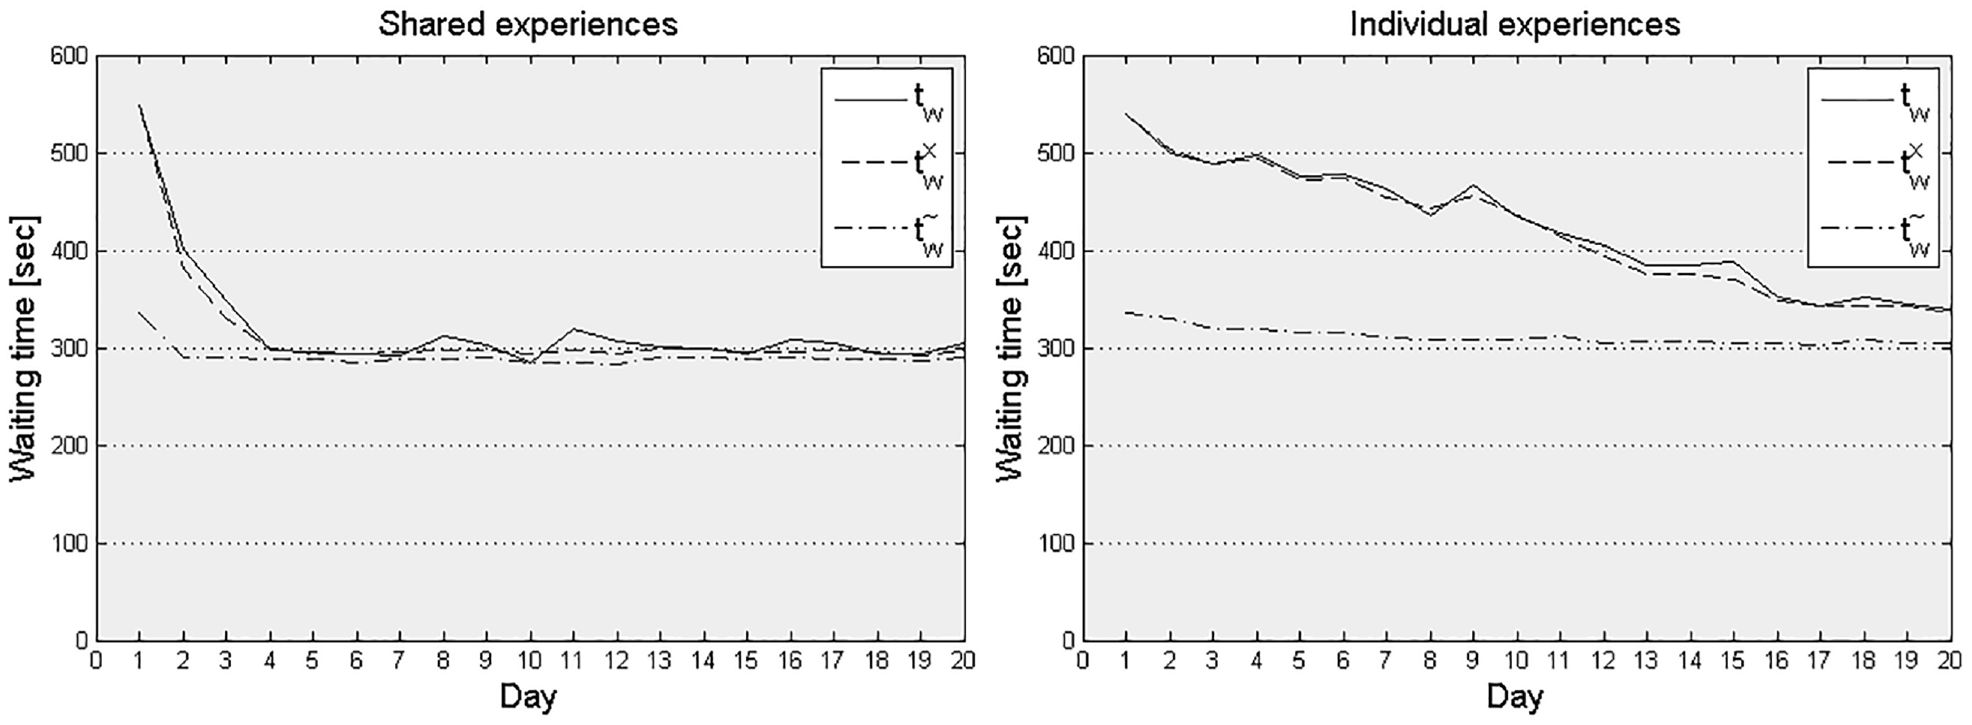
Average waiting time day-to-day learning curve in the Stockholm network for shared (left) and individual (right) experience accumulation.
Sensitivity Analysis: Passenger Demand
When performing a sensitivity analysis with respect to demand level for the Stockholm network, waiting time does not increase as a function of demand as drastically on the first day as in the toy network. The options are more diverse and travelers are distributed over a large number of alternatives already on the first day. This also means that the day-to-day decrease in waiting time is not as dramatic as for the toy network, especially not for individual learning.
Information Credibility Coefficients
The credibility level associated with different sources of information varies considerably among passengers depending on their experiences. Variations in the latter for a given origin and destination stem from different departure times, (probabilistic) route-choice decisions, discrepancies between planned and delivered service and thus provisioned information and accumulated experience. For some lines, accumulated experience predicts waiting time better than real-time information or the timetable, and so the experienced waiting time credibility level gradually increases. For many other lines, however, it hovers around one-third, implying that accumulated experience does not provide more accurate estimates of expected waiting time than the timetable or real-time information do. In most of these cases, real-time information gives the best estimate of waiting time. The credibility value of accumulated waiting time stabilizes after about 10 days and stays thereafter roughly unchanged. Overall, the relative weights set by the average values of the credibility coefficients for the Stockholm network for experience, real-time information and timetable are 39%, 32% and 29%, respectively.
Passenger Loads and Perceived In-Vehicle Time Evolution
Perhaps surprisingly, the average perceived in-vehicle time does not change much from day to day. This can be understood when considering the following. Everything else being the same, if travelers switch from a crowded to a less crowded path alternative, this alternative is associated with a longer nominal in-vehicle travel time (otherwise it would have already been chosen) as well as the crowding conditions for the passengers that were already on the less crowded path, while reducing the crowding conditions for the passenger under consideration and those passengers that keep using the original service. Thus, although the formation of user equilibrium means that the generalized travel time decreases substantially for some of the travelers, it also involves many travelers perceiving slightly longer travel time than previously. Consequently, although perceived in-vehicle travel time decreases on average, it does so only marginally. This is not necessarily the case with waiting times (Figure 5). If one of the alternatives is a high-capacity metro line capable of keeping headways regular even for high demand, travelers can switch to this line without causing waiting time externalities. Thus, waiting time can often be Pareto-improved from day to day, whereas in-vehicle time cannot.
The day-to-day development of crowding is better illustrated graphically in relation to the spatial distribution of saturation measured as the passenger volume over capacity ratio (Figure 6). Link flows keep fluctuating, but are most volatile on the first few days. A number of links are highly saturated—that is, on-board crowding on vehicles traversing these links is approaching capacity—on the first simulation day (Figure 6, top). A value above 1 indicates that passenger demand is not absorbed during the 1 h passenger generation (i.e., passengers are left behind). On day 20, the crowding level has decreased for many of the most saturated links (Figure 6, bottom). These links are all bus links, which shows how the travelers optimistically choose to go by bus in day 1 while discarding capacity limitations, but with time they learn that it is wiser to use the more reliable and less crowded high-capacity metro.
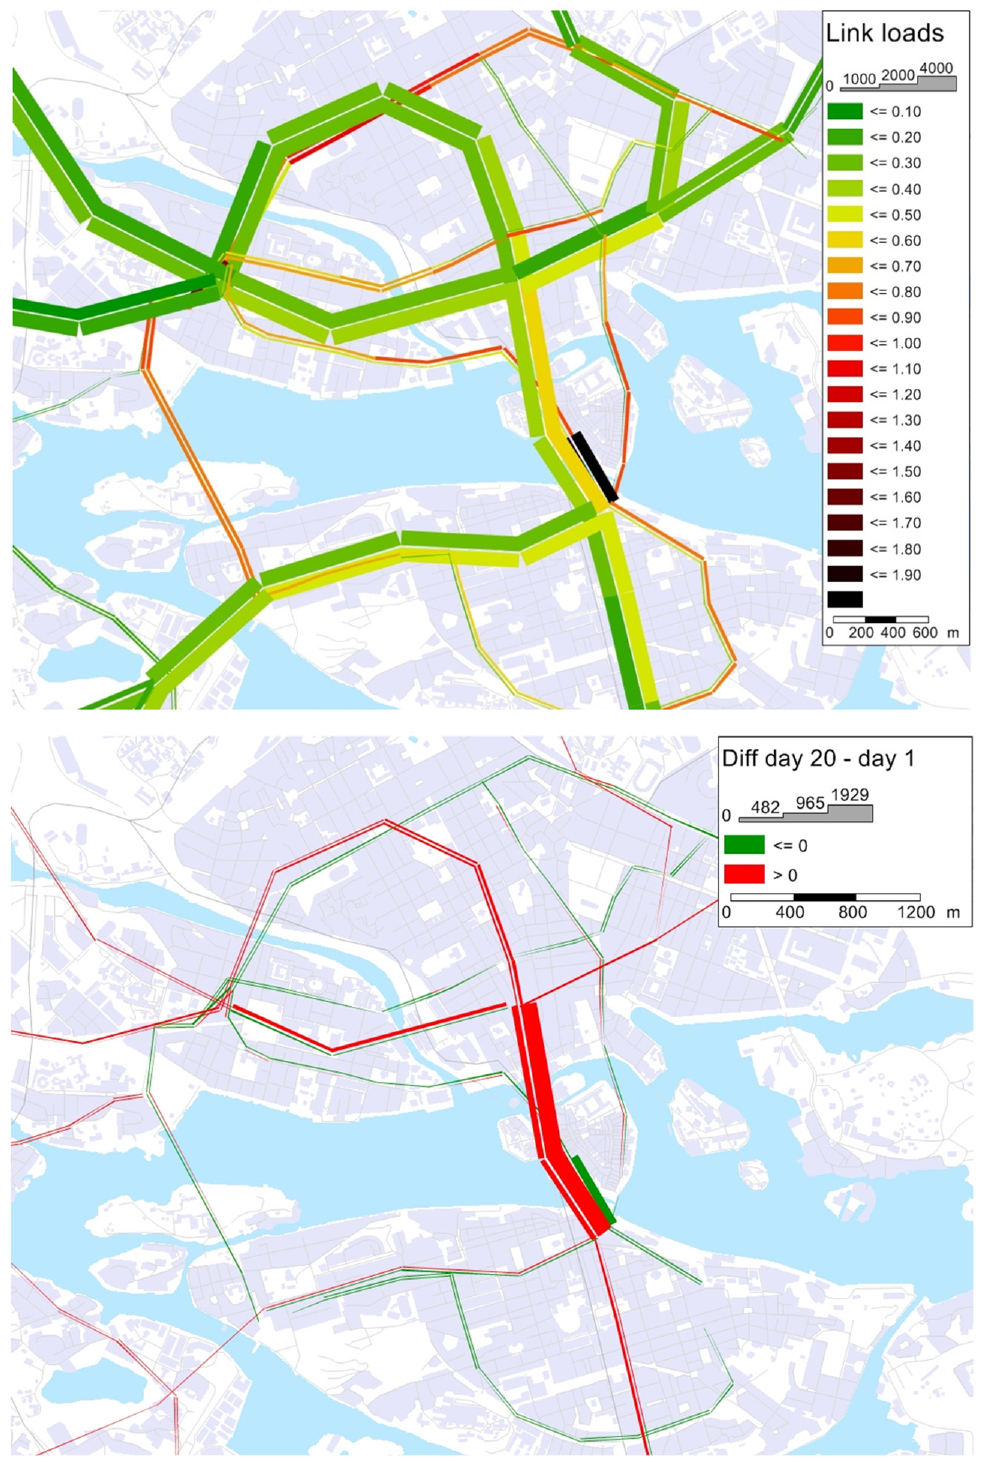
Saturation in the Stockholm network: on day 1 (top) and the difference between day 1 and day 20 (bottom).
Discussion and Conclusion
This paper presents a model framework which represents individual traveler strategies in varying and uncertain environments by modeling how travelers adapt their choices within-day based on day-to-day learning. Through iterative network loading, we attain consistency between expected and experienced travel time and value of time in an agent-based stochastic simulation framework. We link the iterative network loading to the agents’ behavioral day-to-day learning processes and passengers consider different sources of information and update their credibility from day to day. The model can be used for studying how reliability, crowding and information provision affect path choice, passenger loads and travel times for frequent transit services. The second application case in this paper demonstrates that the model can simulate traveler adaptation and learning for a real-size urban transit network.
The learning approach may not merely constitute a means to attain steady-state conditions but can also in some cases, such as in response to disruptions, be instrumental in understanding the evolution from non-equilibrium to equilibrium conditions. Furthermore, several simulation runs (days) can be considered as a set of possible close-to-equilibrium solutions which may represent a set of possible states at which the system may arrive, and so be used in modeling uncertainty in forecasting and evaluation.
The results of model applications highlight the relative difference in outcomes between waiting time and in-vehicle time on path choices and average travel times. In-vehicle travel time and crowding can only increase up to the point where the vehicle is completely full, whereas there is in principle no upper limit on waiting time. The enforcement of strict capacity constraints implies a discontinuous increase in travel cost as function of network saturation. These aspects demonstrate the importance of representing vehicle capacity, flow-dependent dwell time and passenger waiting time (including denied boarding) explicitly and dynamically for correctly modeling path choice and travel time. Unlike previous advanced schedule-based TAMs that have relied on a pre-trip path choice, this model introduces strategies in an agent-based dynamic assignment to enable the agents to choose between hyper-paths and adapt to within-day dynamics.
These findings highlight the differences between assuming individual and shared experiences in the learning process. Although individual experiences (i.e., that each agent has access only to experience personally gained on past trips) might seem most intuitive and lead to fast learning in a toy network, this approach has two major downsides: First, as the application of the full-scale network shows, individual experiences require substantially more iterations before reaching steady-state conditions. Second, research provides evidence to suggest that humans learn faster than a reinforcement learning model without information sharing would imply ( 17 ). Therefore, to study transient effects, such as user adaptation in case of a sudden change of level of service, the individual reinforcement learning approach may not necessarily be the most realistic.
Adaptation and learning in transit is not limited to route-choice decisions. The model presented in this study can be extended to encompass other choice dimensions such as mode choice and departure time choice. Learning with respect to departure time choice behavior can be modeled by applying penalties for early and late arrivals compared with the individual desired arrival time. Future work may integrate the proposed model into a transport demand model that includes other choice dimensions so as to allow for feedback loops and facilitate the application of the model as part of planning practices. Other directions for future research include studying travel memory accumulation, adaptation, learning and habit formation in travel choices based on laboratory studies and revealed preference data, and incorporating these behavioral aspects in TAMs. Special attention might be given to studying these aspects among newcomers/tourists and post-disruption behavioral adjustments. Finally, adaptation may also be exercised by the transit supply-side such as in the case of frequency adjustments, timetable redesign and dynamic pricing.
Footnotes
Author Contributions
The authors confirm contribution to the paper as follows: study conception and design: O. Cats, J. West; data collection: J. West; analysis and interpretation of results: O. Cats, J. West; draft manuscript preparation: O. Cats, J. West. All authors reviewed the results and approved the final version of the manuscript. The authors do not have any conflicts of interest to declare.
Declaration of Conflicting Interests
The author(s) declared no potential conflicts of interest with respect to the research, authorship, and/or publication of this article.
Funding
The author(s) received no financial support for the research, authorship, and/or publication of this article.