
Abstract
Because of technology penetration in the transportation system, the automated vehicle (AV) is set to be a future mode of transport. Given the major implications of AVs, investigation of the potential impact of these vehicles on travel behavior is vital for a wide range of purposes, especially for policy making. In this study, we report the results of a stated preference survey distributed in the Netherlands in which respondents had to choose between conventional cars, public transportation, and AVs for different travel distances and trip purposes. Having collected information from 663 respondents we conducted an integrated study incorporating classic trip attributes (such as travel time and travel costs), attitudinal factors, and socio-economic variables to understand people’s choices. We studied a particular form of AVs, automated driving transport service (ADTS), which we defined as an automatically controlled door-to-door transport service provided by a vehicle with similar dimensions to a conventional car, albeit driverless. Results suggest that travelers’ mode preferences vary significantly for different travel distances and purposes. We found that conventional cars and public transportation are perceived as being the least attractive alternatives in relation to in-vehicle travel time on short- and long-distance commuting trips, respectively. Preference for ADTS lay between the car and public transportation, neither the best nor the worst alternative in all scenarios. Our findings suggest that ADTS adopters are likely to prefer this mode for long-distance leisure trips rather than short-distance commuting trips.
Advanced technologies have revolutionized many aspects of human life in various sectors including the transportation system. In fact, the transportation system is one of the essential areas which has been significantly affected by digitalization and technology development. Technological advancement in transportation, in particular automation, aims to make trips safer, faster, sustainable, and more efficient.
In recent years, the concept of automated driving has been introduced as an outstanding platform for the next generation of driving systems that is expected to improve safety, traffic flow efficiency, capacity, accessibility, and reduce congestion through the application of some new technologies such as vehicle to vehicle and vehicle to infrastructure communication. Using cameras, sensors, global positioning systems, adaptive cruise control, light detection and ranging, and advanced driver assistance systems, automated vehicles (AVs) can steer the vehicle and drive it automatically while passengers delegate control to a computer. Ultimately, by replacing the driver role with an automated driving system, AVs are able to totally free up passengers under automation levels 4 and 5 ( 1 ). In other words, AV users can mostly behave like passengers inside the vehicle, which implies that they will be able to multitask and be productive by allocating the travel time to do other activities such as sleeping, working, reading, eating, drinking, watching movies, monitoring the environment, and so forth. Thus, the aforementioned capabilities might motivate the shift from conventional (humanly driven) cars to AVs ( 2 , 3 ).
There is a growing body of literature that recognizes the importance of travel behavior studies that position AVs in the future mobility market, to investigate how travelers respond to this technologically advanced mode of transport. AVs could potentially change the market composition and travelers’ mode choices ( 2 , 4 – 11 ). Given that travel mode choice and the built environment are interlinked ( 12 ), AV adoption could also influence land use and urbanization patterns. Therefore, a clear understanding of the potential travel behavior changes might assist policy makers in managing the positive and negative implications of AVs.
Early studies focused on the classic alternative-specific attributes, including travel time and travel costs, for capturing travelers’ preferences amongst different AV forms such as private automated vehicles (PAVs) and shared automated vehicles (SAVs), when compared with other modes ( 5 – 8 ). Arentze et al. believe that although travel time and travel costs are initially assessed by travelers when establishing a trade-off between the alternatives, travel distance can play an important role in their final choice ( 13 ). Whereas most of the studies have only considered short-distance trips ( 4 , 5 ), AVs might be more attractive for long-distance trips because users can employ their travel time more efficiently and be more productive ( 8 ). Travel purpose is another influential factor that may affect mode preference and travel behavior ( 14 , 15 ). In addition, surveys such as those conducted by Yap et al. ( 4 ), Zmud et al. ( 8 ), and Haboucha et al. ( 11 ) have shown that psychological factors and attitudes might have a significant impact on whether an individual is inclined to choose AVs as a mode of transport. However, previous research has established that substantial uncertainties exist about AV adoption as well as the possible effect of automation on travel behavior ( 2 , 11 ). A large body of travel behavior research asserts that travelers value different travel-time components including in-vehicle time, walking time, waiting/searching time, and also consider travel cost constituents such as ticket costs, fuel prices, and parking costs. However, to date, only a few studies have integrated all the mentioned attributes in a survey related to AV ( 4 , 5 , 11 ).
To the best of our knowledge, this is the first study that has attempted to simultaneously examine the impact of travel distance (long- and short-distance trips) and travel purpose (commuting and leisure trips) on travelers’ mode preferences in relation to automated driving transport service (ADTS). ADTS is a drivererless vehicle similar to a conventional car, albeit controlled automatically by a computer or a remote operator as a door-to-door transport service, in competition with conventional cars and public transportation. This is a centrally controlled fleet of driverless vehicles that transport travelers on demand. This definition is presented so that respondents can easily imagine and relate to the ADTS, thus minimizing the risk of confused perceptions of how these vehicles might look and operate. Additionally, classic attributes including travel-time components and travel costs as well as attitudinal factors and the social demographic characteristics of the respondents are included in the study to comprehensively identify choice determinants.
Since ADTS has not been introduced to the market yet, a stated preference (SP) experiment was designed to present this hypothetical alternative to respondents. The next section presents the details of the study specifications, survey design, and model formulation followed by the results of the models and conclusions.
Methodology
Study Specifications
Inspired by the work of Azari et al. ( 14 ) and Shiftan et al. ( 15 ) who suggest that selecting the mode of transport and a place to park is dependent on the trip purpose, we incorporate the trip purpose in the study as a context variable to explore its effect on travelers’ mode choice. To minimize the number of choice sets, we considere commuting and leisure trips, which represent the majority of trip purposes in the Netherlands ( 16 ).
As mentioned, travel distance might also affect the travelers’ mode choice ( 4 , 13 , 17 ). Hence, various scenarios are considered based on trip distance to investigate its influence on travel behavior. To simplify the choice sets, we categorize trips into two groups, short distances of 10 km and long distance trips of 40 km long. The modal alternatives, attributes, and attribute levels are specified accordingly.
Conventional car, public transportation (i.e., bus, tram, and train), and ADTS as a door-to-door service provided by an AV are presented as the modal alternatives. Statistics show that 93% of trips are undertaken by car, train, and bicycle, although travelers mostly use the bicycle for trips up to 5 km in the Dutch context ( 16 ). Consequently, owing to the travel distance assumptions (10 km and 40 km in this study), the bicycle is not included as an alternative in the choice sets. The access and egress legs of public transport trips are assumed to be made on foot to prevent an increase in the number of alternatives and attributes.
The automated driving system could have been introduced in different forms such as PAV and SAV. Through the literature we observed that PAV would increase the distance traveled, which opposes sustainability policies, despite the probability that AV prices might be much higher than conventional cars. Thus policy makers might not be enthusiastic to widely support this type of motorized alternative. Moreover, SAV may not be popular amongst travelers on account of the lack of privacy afforded by sharing the system. We, therefore, decided to present another form of AV, the ADTS. Furthermore, the concept of ADTS could be easily and impartially presented to respondents who had not experienced AVs. One of the advantages ADTS adoption might be the possibility of shifting mobility from an ownership-model, as in the case of a private car, to an on-demand service.
Acknowledging that survey respondents have not experienced AVs, an SP experiment is selected as the data collection strategy. It is desirable that attributes and attribute levels in the SP experiment are based on real circumstances to which respondents could easily relate. Travel time is decomposed into in-vehicle, walking, waiting, and searching time for parking for the car to explore the difference between time spent inside and outside of the vehicle. Attribute levels are pivoted on the statistical data for the mobility characteristics of travelers in the Netherlands ( 16 ) as well as data obtained by some trip planners, for the hypothesized trips per distance category. The attribute levels of ADTS are specified identically to those of the conventional car, except for walking time, which is set to null because ADTS is defined as a door-to-door transport service. Furthermore, walking time is assumed negligible (i.e., no need to park the vehicle), whereas car drivers would have to park their cars and then walk to their final destination.
The instructions were written with care to ensure that the respondents could imagine the conditions as accurately as possible, given the nature of an SP experiment. Table 1 provides an overview of all attributes and the corresponding attribute levels per trip distance category.
Overview of Attributes of the Choice Alternatives Used in the SP Experiment
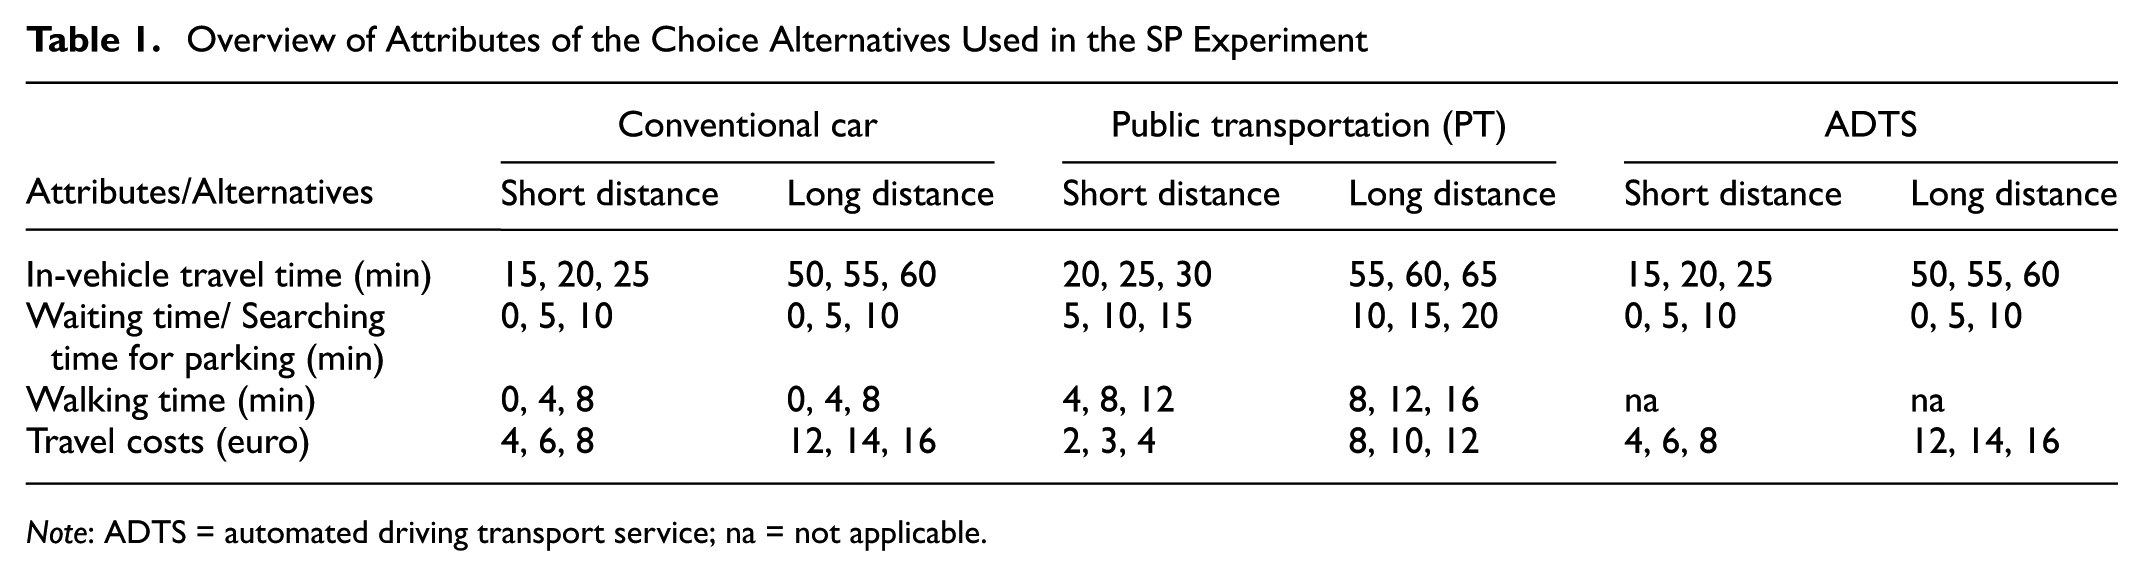
Note: ADTS = automated driving transport service; na = not applicable.
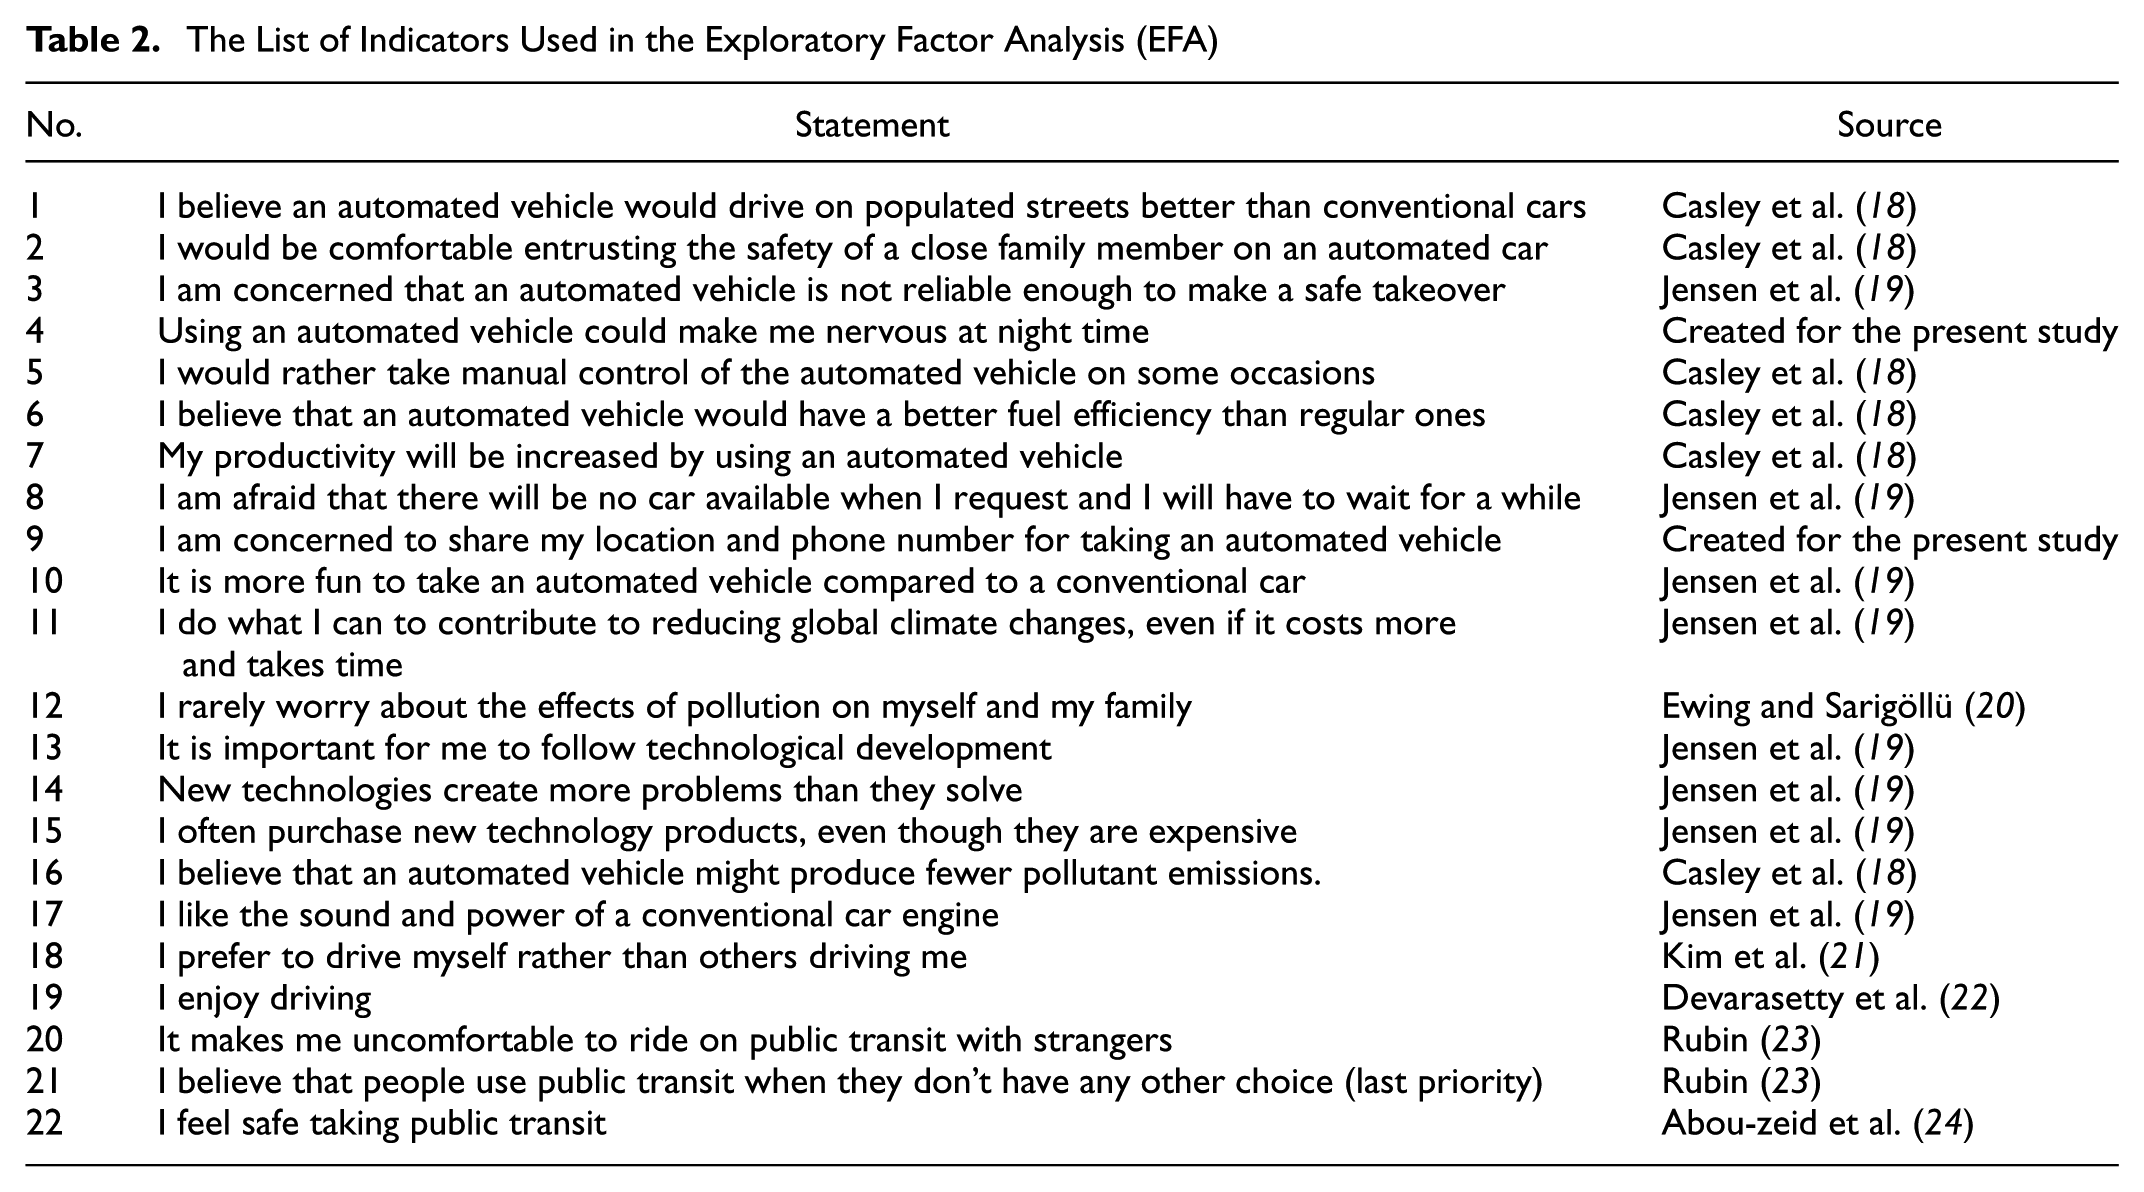
In addition to the classic attributes, travelers’ preferences might be affected by attitudinal factors such as “trust in AVs,”“concern about the environment,”“AV functionality,” and so on ( 4 , 11 ). Since attitudes as latent variables cannot be directly observed, 22 indicators are created and adapted from other studies to capture the level of agreement of the respondents by using a five-point Likert scale. Table 2 presents the statements as well as their sources.
The List of Indicators Used in the Exploratory Factor Analysis (EFA)
Survey Design
An online SP survey designed was distributed among a sample of the Dutch population by a survey panel provider in the Netherlands. The data of 663 respondents were used after checking the screening questions and the minimum time of completion. Several questions were embedded at the beginning of the survey to filter respondents who did not fulfill the criteria: respondents needed to be older than 18 years old, own a driver’s license, and use a car at least once a month. As an additional screening measure, several contradicting statements were introduced to examine whether respondents paid attention to the survey or not. For example, subjects that had given the same answer to the contradicting questions, “I enjoy driving” and “I do not enjoy driving” were screened out. Finally, if a survey was completed within less than 7.5 min, the corresponding questionnaire was not incorporated into the dataset.
The questionnaire consists of four parts: (i) transport-related attitudes, which included the aforementioned indicators; (ii) current individual mobility behavior, for instance, the frequency of using existing modes and driving short- and long-distance trips; (iii) six choice sets per respondent, and; (iv) socio-economic questions at the individual and household levels such as gender, age, education level, household size.
The choice sets presented in Section iii of the survey are orthogonally designed using the software package NGENE ( 25 ) with the aim of decreasing respondent task effort. Orthogonal design is selected because of the lack of in-depth knowledge about AV acceptance to determine the priors for a D-efficient design, and because orthogonal design is the most widely used ( 26 ).
In total, 54 treatment combinations were arranged in nine different blocks of six choice sets, which were then randomly distributed amongst the respondents. The choice sets consisted of three scenarios for short- and three for long-distance trips. Additionally, each respondent was faced with selecting two choices, one for commuting and one for leisure trips per choice task. To illustrate the set-up, an example of a choice set is depicted in Figure 1.
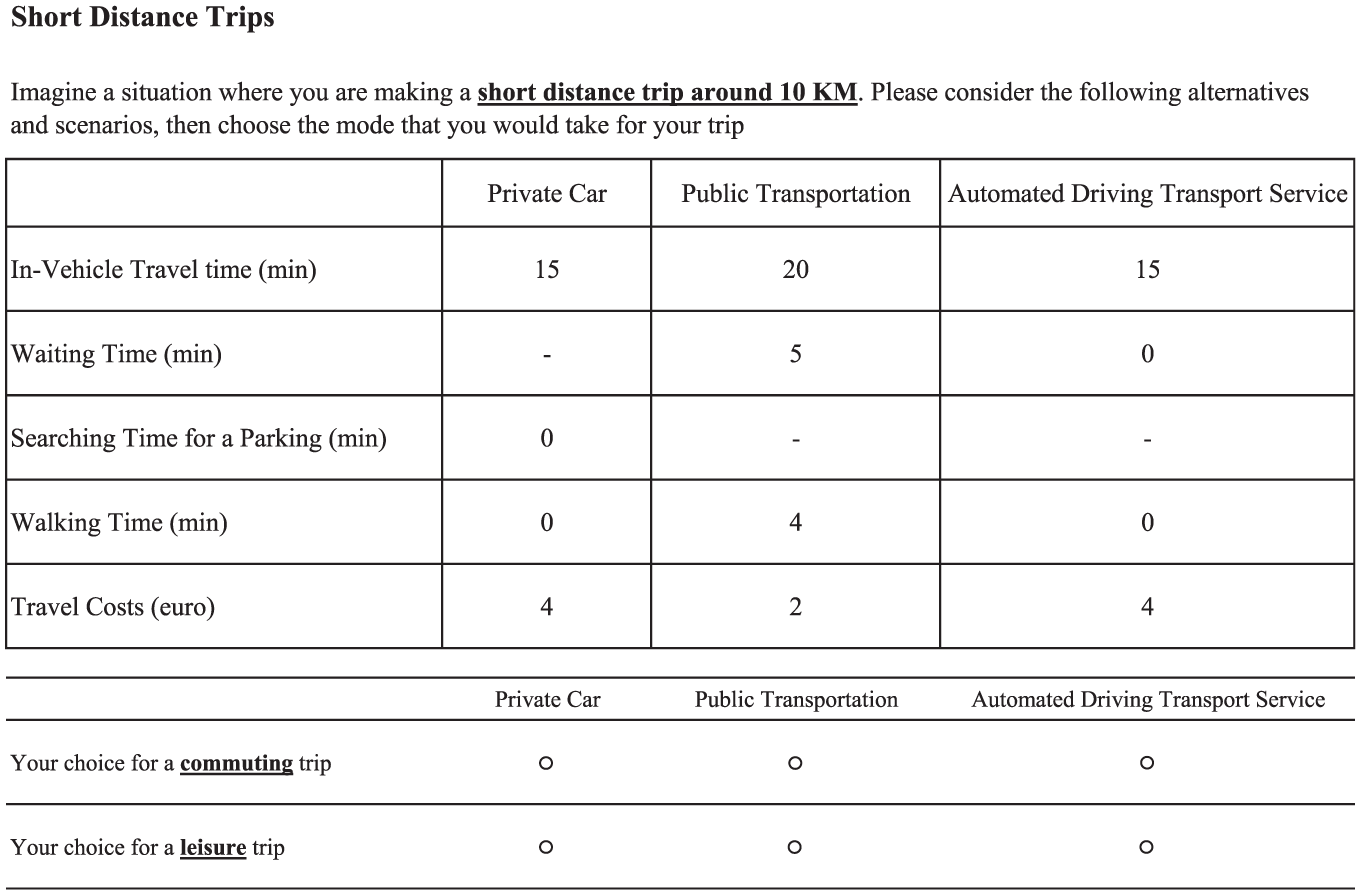
Example of a choice set for a short distance trip.
With regard to the order of the different parts of the survey, we embedded the choice sets in the third section since the first and second parts could shed light on automated driving so that the subjects would already be aware of its prospect prior to making mode choice decisions.
Discrete Choice Models
The random utility maximization framework, a discrete choice model (DCM), is one of the most applicable approaches to study traveler preferences for transport mode choice. It hypothesizes that alternative

where the first component of the utility function corresponds to the classic alternative-specific attributes depicted in Table 1: in-vehicle travel time, waiting/searching time, walking time, and travel costs.
The second component is associated with the factors that are intrinsic to the individuals, including attitudes and socio-economic variables. Previous studies found that individual-related variables are fundamental determinants of mode choice.
The EFA is applied to reduce the number of variables and classify them under the minimum required number of components to explain most of the variance. Based on the parallel analysis run in SPSS, the number of components is determined and the factor scores are incorporated in the DCM. This type of model is also known as a hybrid choice model because it estimates the integrated choice and latent variable either in a sequential or simultaneous way. It should be noted that sequential estimation postulates that the latent variables are error-free. Although a joint estimation is able to reflect the complexity of the relationship between psychological factors and socio-economic variables, it requires a substantial increase in estimation time and more complex modeling. We therefore opted for the sequential method, as it was found sufficient to investigate whether travelers’ attitudes influence their choices ( 4 , 11 ).
The final component in the utility function in Equation 1, the error term, represents unexplained variation. The assumption about the distribution of the error term results in different model specifications. By restricting all covariances to be zero, the simplest logit model is the multinomial logit model ( 27 , 28 ). This model assumes that the random variables are independently and identically distributed following extreme value type 1. Hence, it neglects taste heterogeneity amongst individuals as well as the correlation between choices made by the same individual across time. To overcome these restrictions, more complex models with higher degrees of freedom, including nested logit, cross-nested logit, mixed logit, and hybrid mixed logit (HMXL) models were estimated in this study. The hybrid mixed logit model with panel effects resulted in the best model fit. Following an iterative process, two final models are reported for long- and short-distance trips. The sample size and attributes are the same for both, enabling direct comparison. To gain a more in-depth insight into the impact of trip purpose, we checked whether it interacts with in-vehicle travel time, by incorporating the coefficients of the interactions between alternative-specific parameters of in-vehicle travel time and trip purpose: commuting and leisure trips in the utility function.
PythonBiogeme ( 29 ) was used to perform the maximum likelihood estimation of the DCM, and EFA was conducted in SPSS (Statistical Package for the Social Sciences). In the next section, the results of the models are presented and discussed.
Results
Exploratory Factor Analysis (EFA)
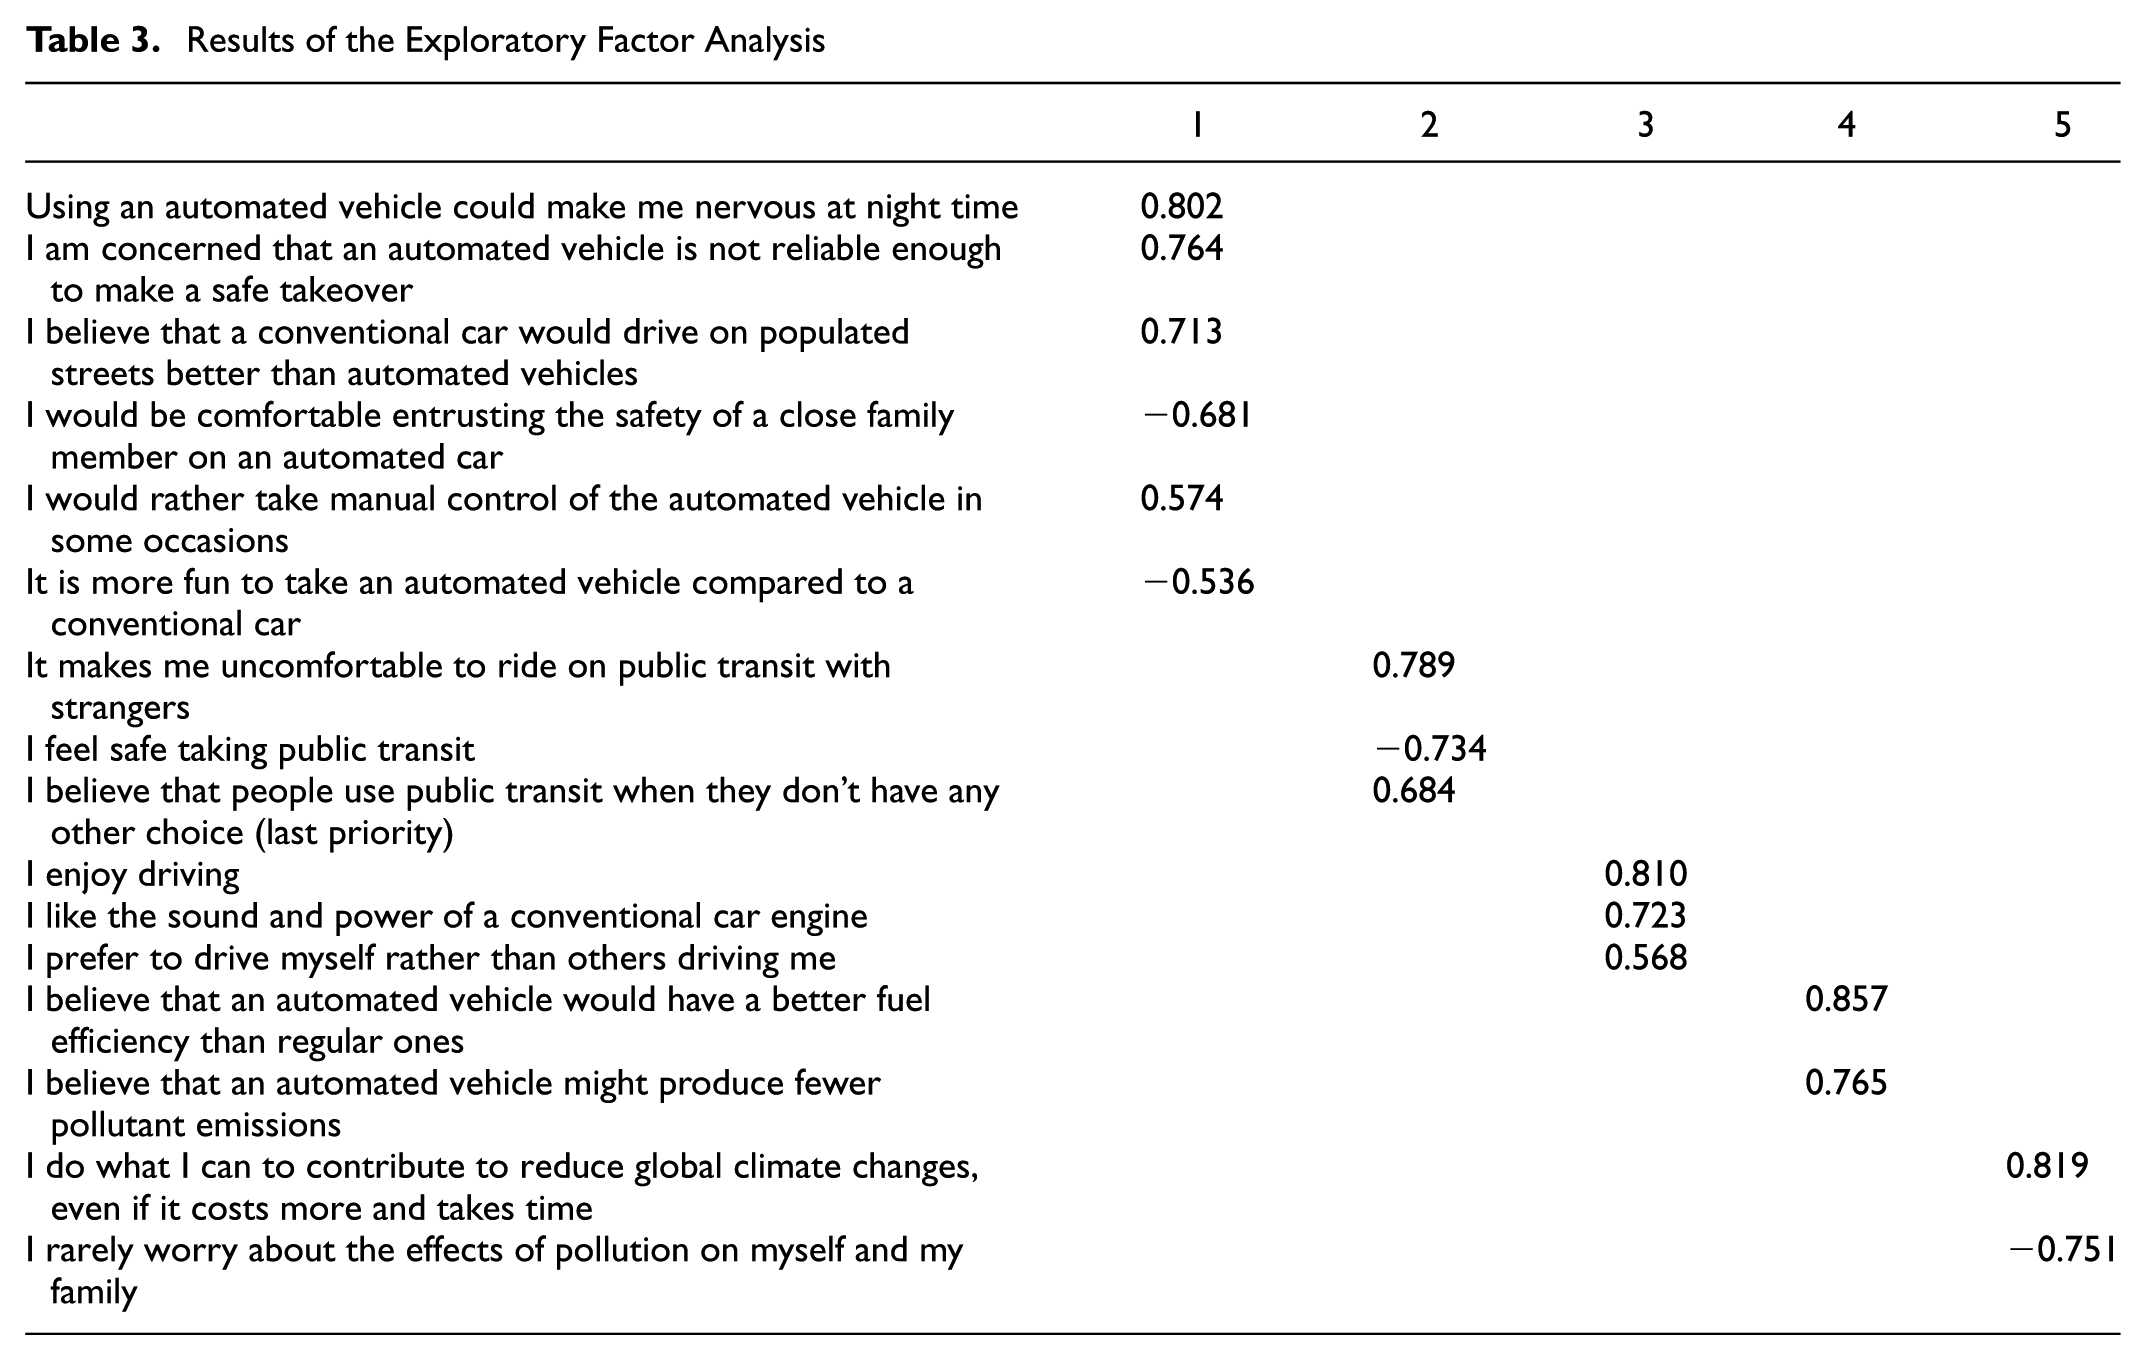
SPSS was used for the EFA to reduce the number of variables by categorizing highly correlated statements. Various methods including eigenvalue greater than 1 (K1), scree plot, and parallel analysis were applied to determine the minimum number of required components. Although K1, the most widely used method, is the default setting of many software packages, parallel analysis (PA) is one of the most highly recommended techniques and has shown greater accuracy in results ( 30 – 33 ). This process resulted in the extraction of five components, bundling 16 out of 22 indicators by PA with the following specifications. The direct oblimin rotation method was initially tested to investigate any strong correlations between the components. However, the results indicated that an orthogonal design could be applied and thus the varimax method was utilized. Indicators with communality > 0.4 as well as factor load > 0.50 were included in the final EFA.
Table 3 presents the latent variables, associated indicators, and the respective factor loads. The latent attitudinal factors can be denominated as trust in AVs, public transport interest, driving interest, positive viewpoints toward AV efficiency, and environmentally friendly attitudes. The corresponding factor scores are incorporated in the utility function detailed in the next section.
Results of the Exploratory Factor Analysis
DCM Model Estimation Results
The results of the final two models are summarized in Table 4 including the model fit, coefficient estimates, standard deviation of random variables, and the level of significance (t-value). Overall, 36 and 33 variables were estimated for long- and short-distance trip models, respectively, by the hybrid mixed logit model with panel effects and 2000 Halton draws.
Results of the Mixed Logit Models
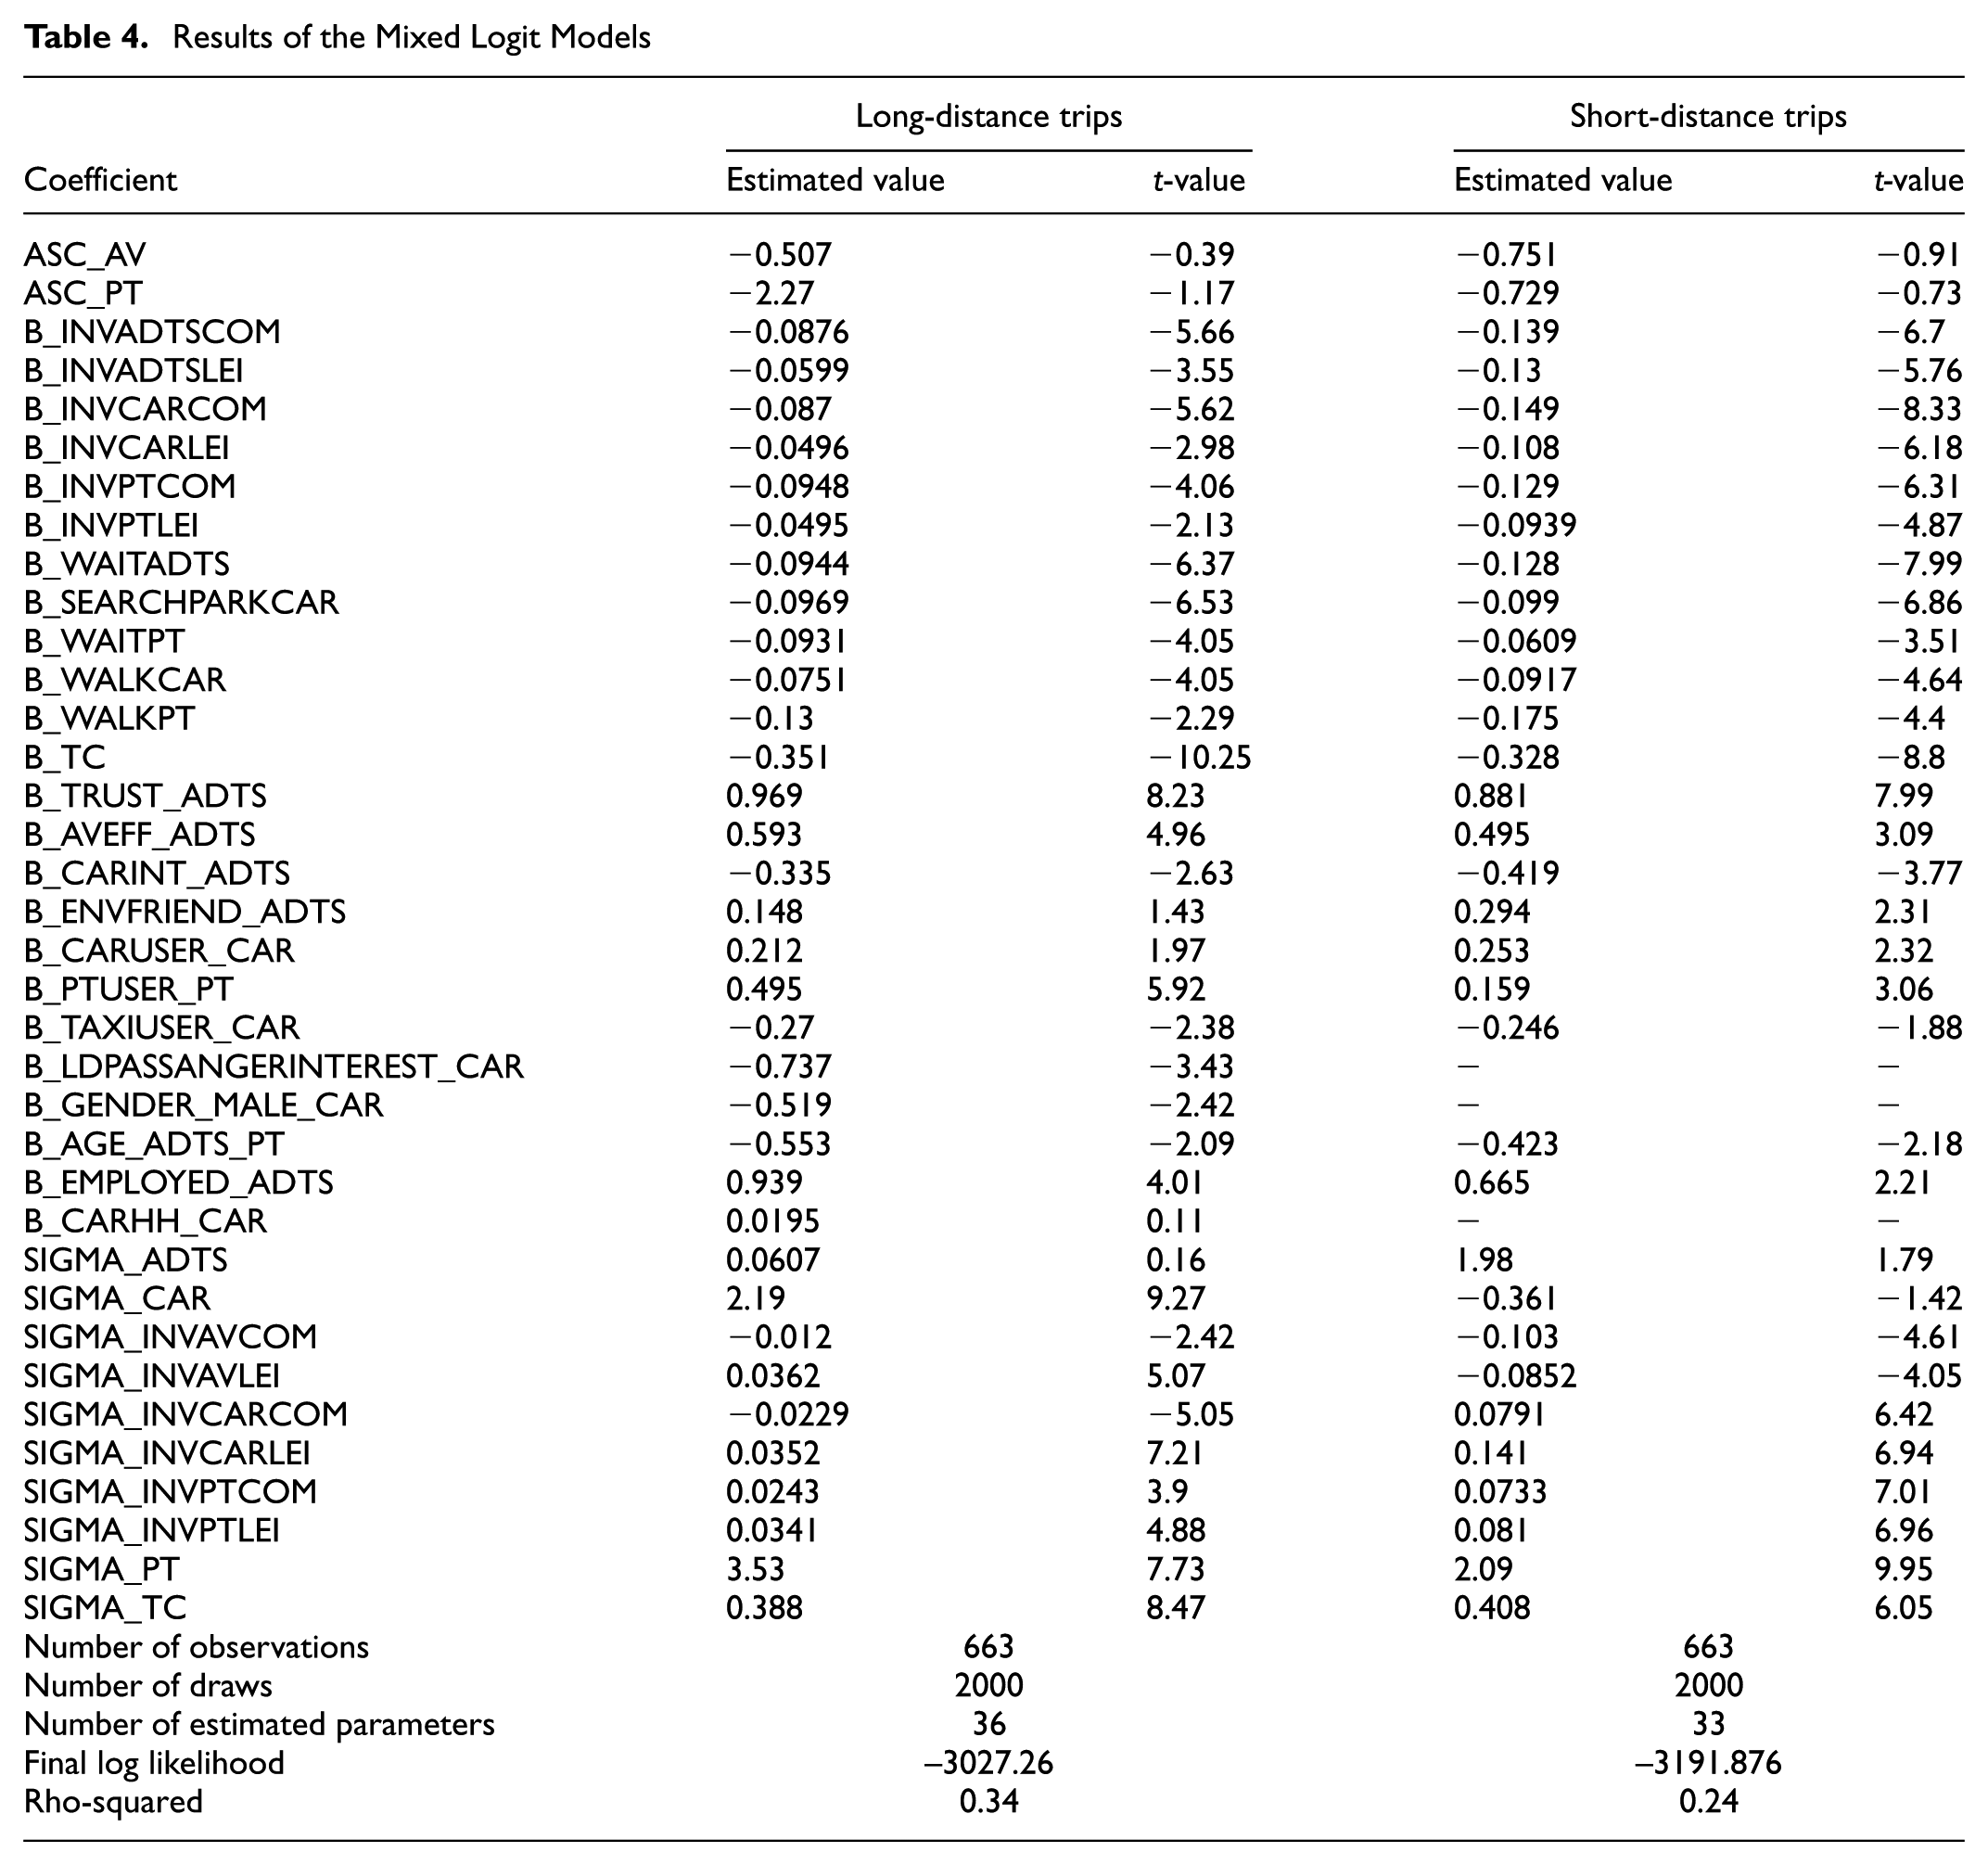
In the Table 4, ASC represents the alternative-specific coefficients that translate the mean unobserved preferences toward the associated alternatives. B and SIGMA indicate the estimated mean and the standard deviation of each random parameter, respectively. Finally, the suffixes CAR, PT, and ADTS indicate the utility function under which the variable has been placed.
Results show that the signs and values of all estimated coefficients are plausible. As expected, travel-time components and travel costs lead to disutility, with the associated coefficients having negative signs in both models. In-vehicle travel time denoted as “INV” in the table, which is defined by the time spent inside the vehicle, is hypothesized to interact with travel purpose. In general, the marginal value of in-vehicle travel time is less negative for leisure trips than commuting trips for the same travel mode regardless of the travel distance. This is arguably because leisure trips are more pleasant for travelers. With the same trip purpose and travel mode, in-vehicle travel time is valued more negatively on short- than long-distance trips. This shows that the disutility of in-vehicle travel time might be generally lower when traveling further, which is in line with Zmud et al.’s findings ( 8 ).
In the case of short-distance trips, the conventional car has the most negative value amongst all modes for in-vehicle travel time in commuting trips (–0.149). Car-related issues such as traffic congestion and finding a parking space might be the sources of the intense dislike when performing short-distance commuting trips, which are normally made in dense urban areas. However, public transportation has the highest disutility (–0.0948) for travel time on long-distance commuting trips, presumably caused by the higher likelihood of delays, line changing, seat unavailability, and longer walking distances. However, public transportation has the lowest in-vehicle travel time disutility for leisure trips for both short- and long-distance trips. These results seem to indicate that the combination of different travel distances and purposes can significantly influence travelers’ preferences.
Moreover, ADTS is positioned between the car and public transportation as it is perceived as being neither the best nor the worst alternative in all scenarios. ADTS is evaluated favorably in relation to in-vehicle travel time for long-distance leisure trips (–0.0599), whereas it is perceived as less attractive for short-distance commuting trips (–0.139).
Comparing the estimated coefficients of in-vehicle travel time, we can conclude that in-vehicle travel time for long-distance commuting trips in ADTS is perceived to be around 8% less negative than public transportation; no difference is derived between ADTS and the conventional car for this trip category. In contrast, on short-distance commuting trips, travelers might experience more pleasant time inside an ADTS than conventional cars, although time spent on public transportation is preferred over ADTS.
Waiting/searching and walking time play essential roles in determining utilities. That is why we incorporated them in the experiment with alternative-specific coefficients. The results show that waiting and walking time are indeed significant for all alternatives in both models. It is worth emphasizing that ADTS is assumed to be a door-to-door service, so walking time is irrelevant for this mode. On both long and short-distance trips, walking time for public transportation, which is access/egress time, is valued more negativly than the duration of walking from parking the conventional car to the final destination.
On long-distance trips, waiting/searching time was perceived as approximately equal for all alternatives. Conversely, on short-distance trips it is about 20% and 50% more negative for ADTS than the conventional car and public transportation, respectively. This implies that travelers are more sensitive to waiting for the envisioned AV service than for the alternatives.
Cost of travel is a strong determinant of travel mode choice. The estimated generic coefficients, unsurprisingly, were negative for both models, owing to the intrinsic disutility of cost. Moreover, the parameter value was roughly equal in both models, which shows that passengers were equally sensitive to cost in the two travel distance categories.
As discussed in the previous section, factor scores of the latent variables are incorporated in the final models. The results show that three and four out of the five latent variables are significant in the models estimated for long and short-distance trips, respectively. Trust in AVs is the most significant latent variable in relation to its t-value and magnitude compared with the other factors. This is in line with the study conducted by Molnar et al. that concludes that trust in AVs is the strongest component in explaining potential AV adoption ( 34 ). Our findings suggest that trust in AVs, positive view toward AV efficiency, and environmentally friendly attitudes could decrease the disutility of ADTS, whereas having an interest in driving leads to an increase in the disutility of AVs in both models.
Regarding the estimated coefficients of the current mobility characteristics of travelers, we conclude that individuals who currently use their car at least two to three times per month (labeled as car users in Table 4) are more likely to select the conventional car as the mode of transport, especially for short-distance trips. Interestingly, public transport users (at least two to three times per month) are around 70% more willing to choose this mode when undertaking a long- than a short-distance trip. Furthermore, taxi users and those who prefer to be a passenger on long-distance trips are more likely to use either ADTS or public transportation; however, these variables are not significant for short-distance trips.
The data in Table 4 also indicate that only a few socio-economic factors including employment status, age, and gender are found to be significant determinants. People aged 18 to 40 are more willing to use the conventional car, whereas working people prefer ADTS. However, men are more likely to favor ADTS for long-distance trips; gender is not a significant factor in short-distance trips.
Conclusion
This study aimed to investigate traveler mode choice by setting up scenarios in which AVs are an integral part of the mobility market. More specifically, we examined how mode choice determinants differ for different travel distance and trip purpose categories. DCMs are estimated using data collected in an SP experiment concerning alternative-specific and individual-specific classic attributes, socio-economic factors, mobility patterns, and attitudes.
In summary, the results show that the various scenarios incorporating different travel distances and purposes can significantly affect travelers’ mode preferences. The conventional car and public transportation are perceived as the least attractive alternatives in relation to in-vehicle travel time on both short- and long-distance commuting trips, respectively. Furthermore, prospective ADTS usage is perceived to be more favorable for long-distance leisure trips, and valued as less attractive for short-distance commuting trips.
The importance of trust in AVs, and other attitudinal factors, are reaffirmed as determinants of modal choice in this study, and therefore for AV adoption generally. Our findings suggest that trust in AVs is the most significant component for travelers to use AVs. Other factors are having positive views toward AV efficiency, and environmentally friendly attitudes, both of which could reduce the disutility of ADTS; whereas having an interest in driving yielded an increase in the disutility of AV.
As an aside, we found that, regardless of travel distance, in-vehicle travel time is valued less negativly for leisure trips than commuting trips using the same travel mode. At the same time, it is perceived more negatively for short- than for long-distance trips, independent of the travel purpose. These findings could be attributed to the intrinsic value of leisure trips over commuting, and long-distance trips in contrast with short-distance trips.
This study has several policy implications. In general, adoption of ADTS is likely to be highly dependent on the travel purpose, travel distance, travelers’ attitudes, and their sociodemographic characteristics. Our findings imply that market penetration is expected be the highest amongst middle-aged males who have environmentally friendly attitudes and undertake longer-distance leisure trips. Therefore, ADTS operators could focus on catering to the demands of this user group in the early stages of operations to attract early-adopters. Furthermore, improving travelers’ trust in AVs is identified as a critical factor for the eventual adoption of ADTS.
There are two notable limitations in this research. The first is inherent to SP experiments. As the respondents have not experienced riding AVs, their answers relied on how they envisaged the ADTS alternative. The second issue refers to the hybrid choice model structure. Latent variables can be incorporated either in a sequential or simultaneous way in the utility function. A joint estimation (simultaneous) allows investigation of the correlation between attitudinal factors and socio-economic variables through a complex calculation. This has been left for further research as the sequential estimation was sufficient to address the current research questions.
This research raises several interesting avenues for further research. Firstly, travel purpose could be expanded to encompass more categories including shopping trips, maintenance trips (e.g., taking children to/from school, visiting doctor, going to the bank, etc.), and the possibility of changing the daily activity pattern following AV adoption might also be explored. Secondly, the effect of AVs on other aspects of travel behavior, including route and destination choices could be investigated. Thirdly, considering other forms of AVs, including PAVs and SAVs as alternatives competing with ADTS might be an interesting research topic.
Footnotes
Author Contributions
The authors confirm contribution to the paper as follows: study conception and design: BA, GC, OC, PA; data collection: PA; methodology: PA; analysis and interpretation of results: PA, GC, OC; draft manuscript preparation: PA; review and editing: GC, OC, PA. All authors reviewed the results and approved the final version of the manuscript.
The Standing Committee on Transportation Demand Management (ABE50) peer-reviewed this paper (19-01058).