
Abstract
Urban transit networks typically consist of multiple modes and the journeys may involve a transfer within or across modes. Therefore, the passenger experience of travel time reliability is based on the whole journey experience including the transfers. Although the impact of transfers on reliability has been highlighted in the literature, the existing indicators either focus on unimodal transfers only or fail to include all components of travel time in reliability measurement. This study extends the existing “reliability buffer time” metric to transit journeys with multimodal transfers and develops a methodology to calculate it using a combination of smartcard and automatic vehicle location data. The developed methodology is applied to a real-life case study for the Amsterdam transit network consisting of bus, metro, and tram lines. By using a consistent method for all journeys in the network, reliability can be compared between different transit modes or between multiple routes for the same origin–destination pair. The developed metric can be used to study the reliability impacts of policies affecting multiple transit modes. It can also be used as an input to behavioral models such as mode, route, or departure time choice models.
Transit service reliability forms an important component of service quality and its importance to customer satisfaction has been repeatedly highlighted in the literature (1–3). From the operator’s perspective, improved reliability can reduce operational costs and increase revenue by potentially increasing the ridership and retention ( 4 ).
Urban transit networks typically consist of multiple modes and passenger journeys may involve a transfer within or across modes. Therefore, the passenger experience of reliability on such networks is based on the whole journey experience including the transfers. Although there are multiple passenger-oriented reliability indicators available (1–3, 5, 6), the majority are restricted to single-leg journeys (without transfers), and do not consider different modes and their interactions. Some of the recent work has looked at journeys with transfers, but focused primarily on the reliability of transfer time ( 7 ) or travel time from the time passenger boarded the vehicle ( 8 ), ignoring the waiting time at the origin.
This study uses an existing indicator—reliability buffer time (RBT, described by [ 5 , 6 ])—as a point of departure, and extends it to journeys with multiple legs and modes for urban, high-frequency transit networks using smartcard and automatic vehicle location (AVL) data. The developed metric aims to:
Measure reliability for multimodal public transport journeys;
Enable the comparison of different transit modes and routes; and
Be sensitive to the variability in waiting time, in-vehicle time, and transfer time for all legs of the journey.
The method developed is applied to a real-life case study of the Amsterdam transit network to demonstrate its implementation in practice. The methodology, however, is independent of the data system(s) in use and could be applied to any transit network where smartcard and AVL data sources are available.
By using a consistent method for all journeys using all available transit modes, reliability can be compared between any route for any origin–destination (OD) pair in a multimodal transit network. The developed metric can be used to study the reliability impacts of policies affecting multiple transit modes. Additionally, it could also be used as an input to behavioral models such as mode, route, or departure time choice models.
The rest of the paper is structured as follows. First a background on reliability and the application of automated data for reliability measurement is presented. The second section then introduces the new metric and the methodology to calculate it using smartcard and AVL data. The developed methodology is applied to the case study in the third section, for which the results are discussed in the fourth section. Lastly, the fifth section presents the conclusions and limitations of the study.
Background
Travel Time Reliability
Reliability in this context is defined as
Reliability may be measured in terms of travel time regularity (consistency of experienced travel times) or punctuality (deviation from the scheduled arrival time/travel time). Cats notes that in case of urban high-frequency services, passengers arrive randomly without consulting the schedule, making travel time regularity more relevant than punctuality ( 12 ). This study is based on dense high-frequency urban transit networks, so reliability has been measured in terms of regularity of travel time.
Reliability and Automated Data Sources
The smartcard data source has been utilized repeatedly in the recent past for a range of applications in transport planning. Pelletier et al. provide a review of these applications of smartcard data for strategic, tactical, and operational levels of transport planning ( 13 ). For service reliability measurement too, much of the recent research utilizes smartcard and AVL data sources ( 5 , 6 ). In addition, in practice, many transit agencies are moving toward such data sources because of lower data collection costs and better quality of data ( 10 ).
The AVL data provides spatiotemporal information on vehicle movement, which can be used directly to calculate vehicle-oriented passenger reliability metrics ( 14 ). For estimating passenger-oriented metrics, AVL data can be used in combination with automated passenger counts (APC) data to weigh the calculated metrics based on demand. Furth and Muller used the observed headways from AVL data to obtain the waiting time distribution at origin stop for buses ( 15 ). A similar approach was also employed by Ehrlich to estimate the travel time (waiting time + in-vehicle time) distribution for bus journeys in London ( 16 ).
Lee et al. highlighted the importance of including the impact of transfers on reliability assessment ( 7 ). Using AVL data, they estimated the additional delay caused by transfer synchronization. Jenelius also used the AVL data to estimate the transfer times by tracing a virtual “probe traveler” undertaking the journeys between different OD pairs ( 3 ). Because AVL data does not directly provide any information on transfers, assumptions need to be made to estimate transfer time(s) experienced by the passengers. However, with AFC data, the total journey time including the experienced transfer time can be inferred precisely for each passenger. In addition, the number of transferring passengers for each OD pair can also be derived.
Bagherian et al. used the AFC data for measuring regularity and punctuality for journeys with transfers ( 8 ). However, the travel time is measured from tap-in at first stop to tap-out of last stop of the journey, ignoring the waiting time at the origin stop.
Table 1 provides a summary of some of the notable studies using automated data sources for reliability measurement, in terms of the components of travel time reliability included and the type of journeys they are applicable to.
Existing Travel Time Reliability Measures using Automated Data Sources
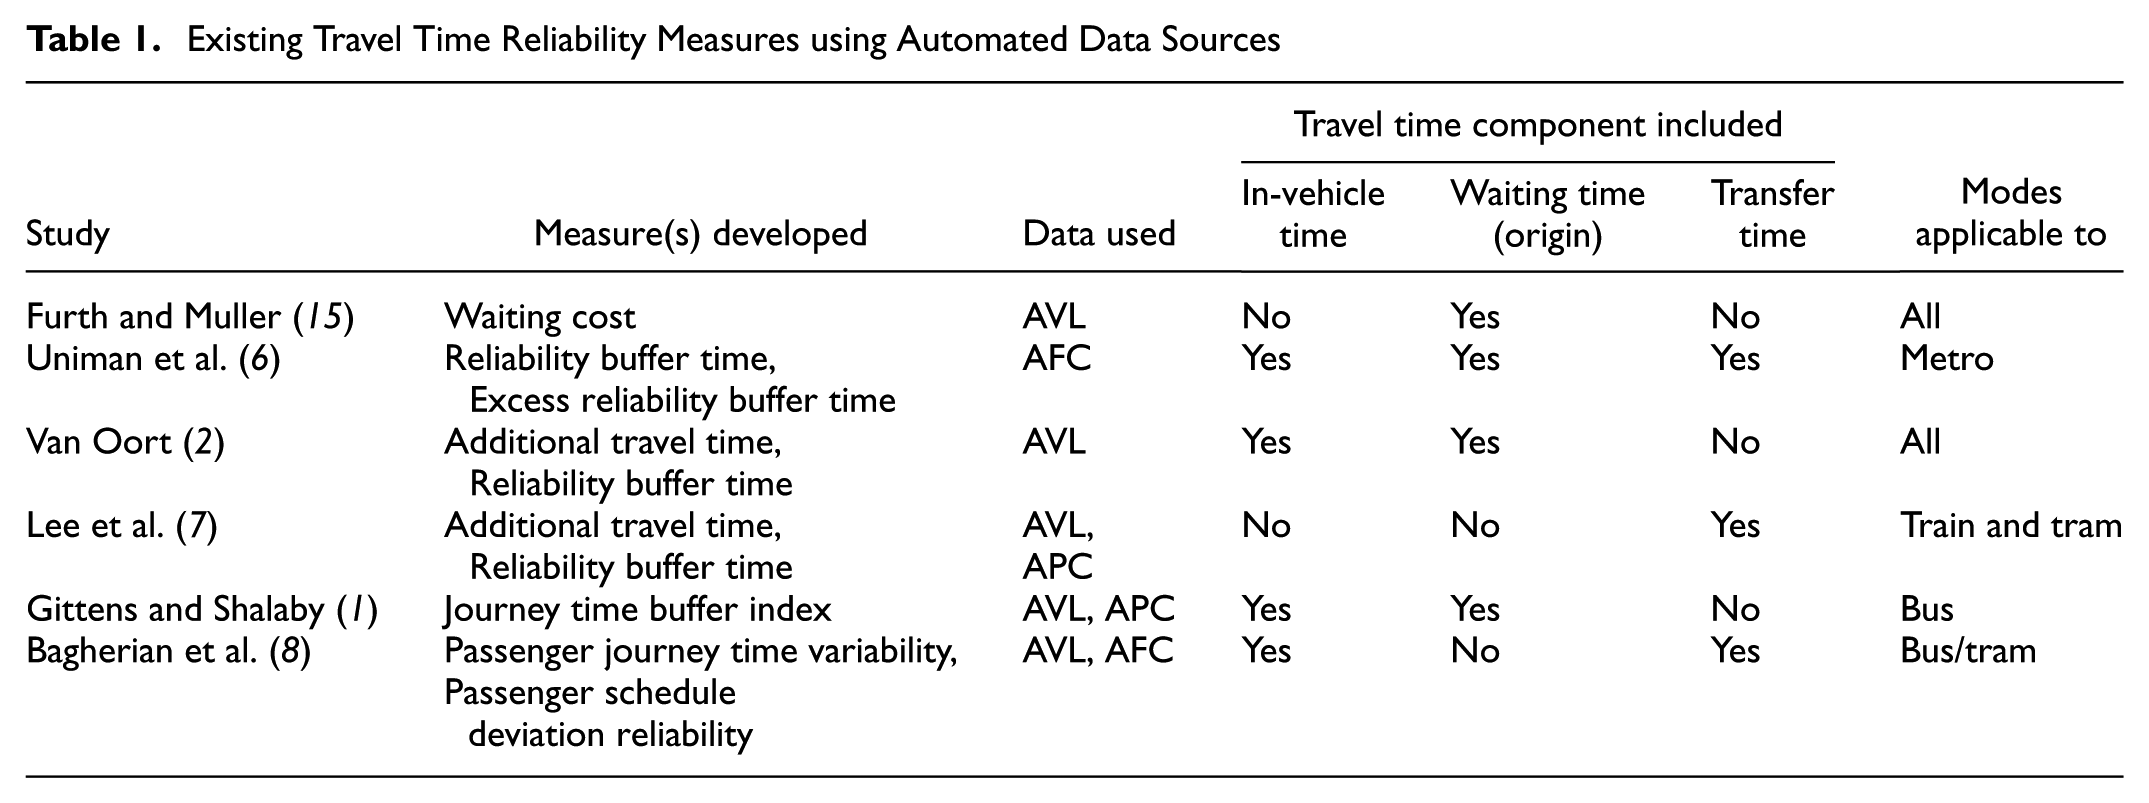
From a passenger perspective, the reliability of a journey should incorporate the variation in all the travel time components—the waiting time, in-vehicle time, and transfer time. Although the various components of reliability have been addressed individually or combined in the existing literature, none of the existing indicators incorporate sensitivity to all components of travel time for multimodal public transport journeys. This research aims to fill that gap.
Methodology
Definitions
In this study, the word “journey” refers to the travel made by a passenger from an origin transit stop to a destination transit stop including transfers, if any. A “leg” of a journey consists of the travel made using a single transit line, without any transfers. A journey may include multiple legs by the same or different transit modes.
The term origin–destination (OD) pair is used to denote a combination of transit stops (a stop–stop pair). An OD pair may be connected by more than one transit “route” which refers to the combination of transit lines a passenger may choose, where each route may or may not include a transfer.
Reliability Buffer Time
The RBT, first introduced by Chan ( 5 ) and later updated by Uniman et al. ( 6 ), measures the variability in travel time as the absolute difference between an extreme Nth percentile and the 50th percentile travel times. The value of N is typically set to 95 ( 17 ), where RBT can be interpreted as the additional time passengers have to budget for their travel to ensure on-time arrival one out of 20 times, a value considered acceptable in the literature. RBT, including its variations (such as individual RBT and platform to platform RBT [ 17 ]), is one of the popular ways of measuring travel time reliability. Besides being easy to compute, some of its key advantages include its representation of passenger perspective, ease of interpretation for nonexperts, and flexibility of calculation across time and space ( 17 ). Although originally developed for metro, RBT has also been applied for reliability evaluation of bus networks ( 16 ). However, so far, the majority of applications of RBT have focused on unimodal journeys. This study extends the calculation of RBT to multimodal transit journeys. The RBT is calculated for each transit route alternative per OD pair, which may or may not include transfers.
For a journey with multiple legs, the total travel time (of the transit part of a journey) includes the waiting time at the origin stop, the in-vehicle time for the first leg, the waiting times and in-vehicle times for the subsequent legs of the journey, and the transfer (walking) times between each leg—shown in Figure 1 for a journey with two transit modes. Because the passenger experience of reliability is defined by the variation in all of these components of travel time, the ideal reliability metric should be sensitive to each of these components, where each component may be perceived differently by travelers. However, this research assigns equal value to the variability in each individual component of travel time, because, in the end, the travel time variability of the entire journey is relevant for the traveler. Furthermore, these components may be correlated, in that the variation in in-vehicle time for the first leg of the journey could be absorbed by the waiting time at the transfer. Therefore, this study measures variability of the total travel time over the entire journey.
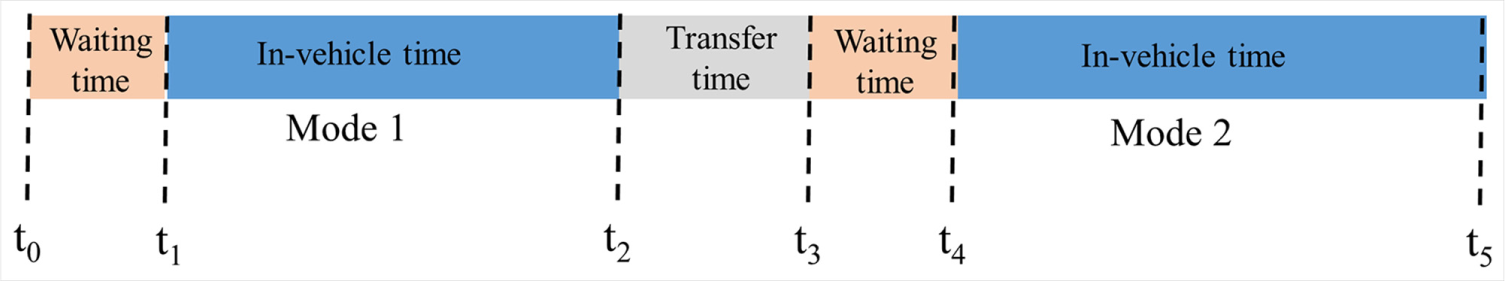
Components of passenger experienced travel time for a transit journey with two legs.
For each multi-leg journey “i”, the total travel time is given as:
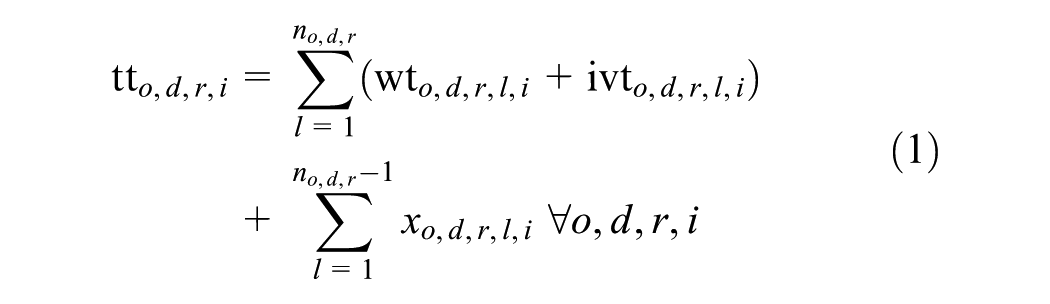
where
The individual travel times are aggregated over all journeys that belong to a specific OD pair and route combination, by calculating the median value and the 95th percentile value, and using these values to calculate the RBT for each OD pair for each route:

where
The RBT measures the absolute difference (in minutes) in travel times, as opposed to the relative values. This has been consciously chosen for this study, for three reasons:
Different modes have different speeds; that is, metro routes are expected to have a shorter travel time than trams for the same OD pair. Because one of the aims is to be able to compare reliability between modes, the relative values may underestimate the reliability of faster modes.
For OD pairs very close to each other (for example next stop on metro), the ratio of 95th to 50th percentile travel times may be very high, because the waiting time component is large compared with the in-vehicle travel time. If the reliability is measured as a percentage of median travel times, this will lead to RBT values exceeding 100% which are difficult to compare.
When using travel time variability in policy evaluation (using a value of travel time reliability) absolute values are preferred.
The RBT can be measured for any selected time interval such as the peak hour or three hours, provided that enough data points are available. It is recommended to choose a time period when the frequency of services is consistent, because variation in frequencies can contribute to higher variation in waiting and transfer times, leading to a higher RBT.
RBT Calculation using Smartcard Data
Because the aim is to measure variability in travel times, the large amount of observations provided by the smartcard data allow for a realistic measurement ( 6 ). For this study, data from the Dutch smartcard system [see Van Oort et al. ( 18 ) for details] and AVL data [see Van Oort et al. ( 14 ) for details] have been utilized. The Dutch smartcard requires tap-in and tap-out for all modes, implying both boarding and alighting locations and times are available. However, for systems in which tap-out is not recorded (London buses, New York metro, etc.), destinations can be inferred using a combination of smartcard and AVL data ( 19 , 20 ). Once the destination is available for all transactions, transfer inference is undertaken to combine individual transactions to journeys ( 21 , 22 ).
Depending on the system, the tap-in is either at the stop (e.g., most current metro systems, including Amsterdam) or on board the vehicle (most current bus and tram systems, e.g., London bus and Amsterdam bus and trams). When tap-in is in the vehicle, the difference between tap-out and tap-in times for each transaction correspond to the in-vehicle times only (t2-t1 and t5-t4 in Figure 1), whereas in the station-based tap-in, this time also includes access/egress time to the vehicle, waiting time at the platform and the transfer time within the same mode (if applicable) (t2-t0 and t5-t3 in Figure 1). For the sake of simplicity, and assuming they form a small component of the overall travel time, the access and egress time to the vehicle from the fare gates is not explicitly included in the specification of the measure used in this paper. It is assumed that this time is constant across passengers and therefore does not contribute to reliability.
For Amsterdam, for journeys with metro as the first mode, the total travel time can be calculated directly from the smartcard data as the difference between the last tap-out and first tap-in (t5-t0 in Figure 1). For journeys with buses and trams as the first mode, on the other hand, the waiting time at the origin stop needs to be measured/estimated separately (only t5-t1 in Figure 1 is measured). This is represented as:
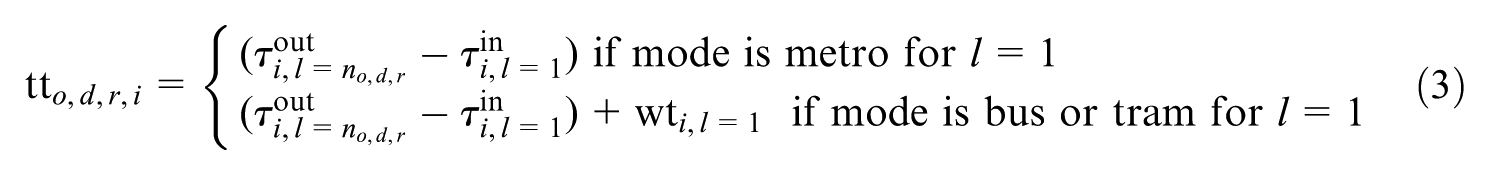
where
In this study, the waiting time at origin
For short headway services, it has been known that passengers arrive at the transit stops without consulting the schedules ( 15 , 23 ). Therefore, within this short interval of time between the arrivals of consecutive buses/trams, a uniform distribution of passenger arrivals can be assumed. Continuous random variables are then generated and sampled over the uniform distribution of [0, observed headway] to obtain waiting time for each individual journey. The observed headway is obtained from the AVL data. Because the waiting time is sampled over all the passengers arriving during an observed headway, this method captures the ramifications of uneven headways on passenger waiting times as more waiting times are sampled for the longer headways.
Once the waiting time is assigned for journeys in which the first mode is bus/tram, the total travel time is calculated for each journey (using Equation 1) and aggregated to percentile values for each route for each stop–stop pair. Subsequently, RBT is calculated based on Equation 2. RBT can be compared between multiple routes for the same OD pair. It can also be aggregated for each mode or mode combination by using a demand weighted average, given by:

where
Using a similar approach, it can also be aggregated or segmented to other dimensions such as for the number of transfers involved, or for the whole population or groups of users within the population.
Figure 2 summarizes the steps that can be followed to derive RBT for multimodal journeys using smartcard and AVL data.
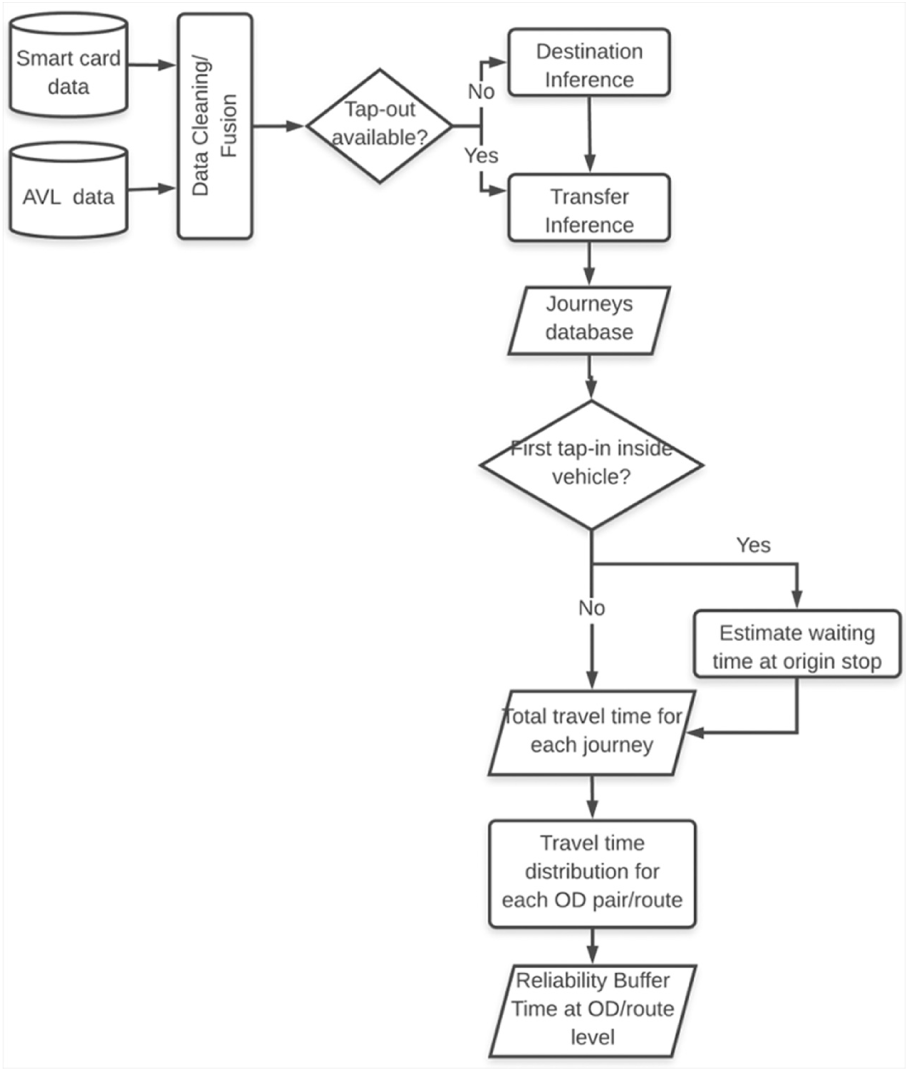
Analysis steps to derive RBT from raw smartcard and AVL data.
Application
Case Study Description
The proposed method is applied to a real-world case study consisting of bus, tram, and metro lines operated by GVB—the urban transit operator of Amsterdam. The study area consists of 4 metro lines, 15 tram lines, and 25 bus lines spread over 1,282 stops, shown in Figure 3.
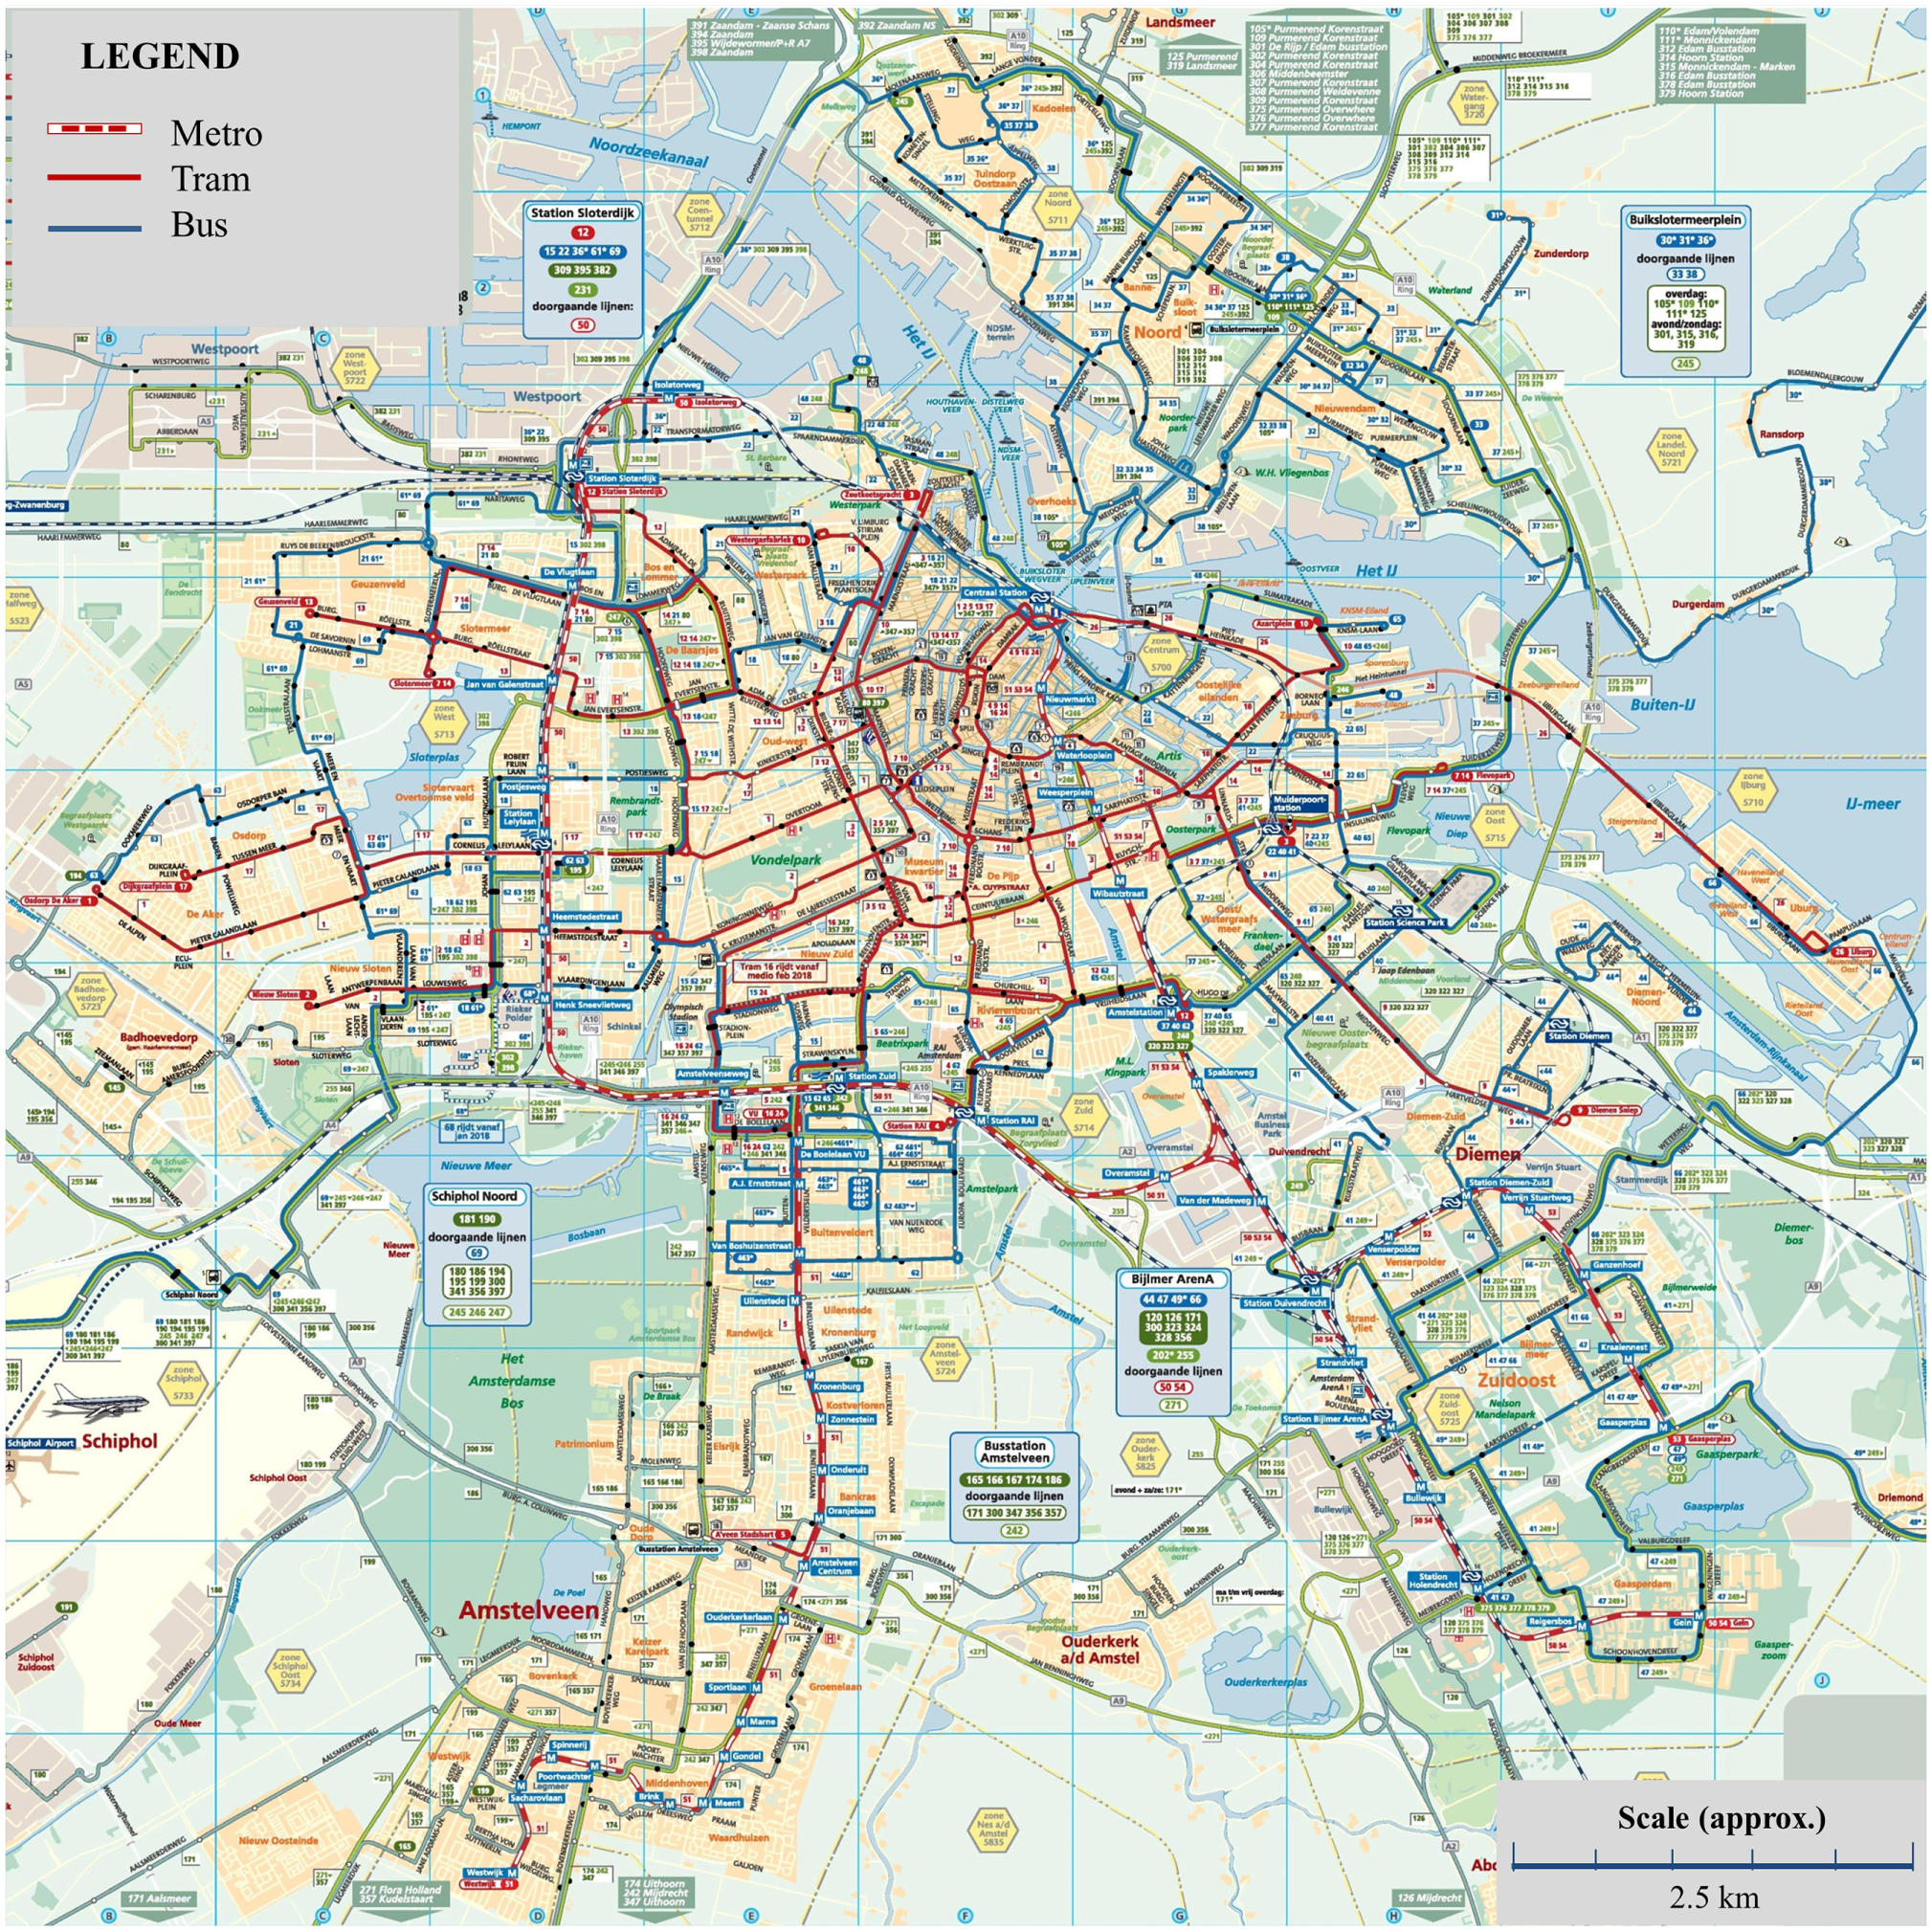
Amsterdam transit network (Source: GVB, 2018).
The smartcard and AVL dataset used for the analysis is for two weekdays (1 and 2 March 2018), and consists of more than 750,000 transactions per day for each day spread over more than 80,000 OD pairs. The average frequency for metro in the dataset is 6 to 8 trains per hour per direction during 7 a.m. to 7 p.m. For bus, this number ranges between 4 and 10 and for tram between 5 and 12 vehicles per hour per direction. Four bus lines (29, 231, 240, and 248) with a frequency of fewer than four vehicles per hour have been removed from the dataset used for the analysis.
The planned headways for the lines are found to be homogenous throughout the day, and the RBT analysis for this study has been performed for the entire day (7 a.m. to 7 p.m.). From the realized headways it can be observed that in regular situations during transit operation in the study area vehicle bunching is not common. The OD/route combinations with fewer than 20 observations during this period have been excluded from the analysis.
Implementation
Each record/transaction of the smartcard data received from the operator consists of a combination of tap-in and tap-out, which in case of buses and trams includes one leg of the journey only (without transfers). For metro it may include transfers within the metro, because passengers transfer without using their smartcard. Each record consists of boarding and alighting times, locations, and the mode used. For bus and tram trips, the line number and vehicle number are also provided. The data however does not provide a smartcard ID because of privacy restrictions, implying that the transactions cannot be tracked within the day. Instead, a journey ID is provided, which combines individual transactions based on the transfer inference criteria applied by the operator which identify any transaction by the same user within 35 min of the previous transaction as a transfer.
Data Cleaning
The raw smartcard and AVL data are first cleaned to remove erroneous or incomplete transactions such as unrealistic travel times, departure time before arrival time, missing origin and destination information and so forth (7.4% in the dataset).
For metro trips, some extreme values of travel times can be observed in the data, possibly because of passengers taking the wrong train or waiting for a friend at the platform. To ensure that such passenger behavior does not lead to unrealistic reliability measurement, the following procedure is applied to identify and remove records with odd passenger behavior for metro, ensuring that large disturbances are retained:
For each OD pair, select the records for which the travel time was more than double that of the median travel time and which exceeded by more than 15 min the median travel time for that OD pair. This value is decided by observing the outliers in the data, taking into consideration both very short and very long metro journeys.
For each selected record, check if there is another record in the smartcard data that started after the tap-in and ended before the tap-out of the selected record. If the difference between tap-outs of these two records is more than one headway (10 min), the selected record is considered an outlier and removed from the dataset. This results in the removal of 0.25% of metro trips.
Data Fusion
Next, the individual transactions in the AFC data are matched with the AVL data to obtain the actual vehicle arrival and departure times at stops for bus and tram trips. Because the smartcard data for Amsterdam does not provide a vehicle trip number which can be matched directly to the AVL data, the matching is undertaken based on the vehicle number, boarding time, and location. If a tap-in time lies between the arrival of a vehicle at the boarding stop and the arrival of the vehicle at the next stop on that line, the passenger trip is assigned to that vehicle trip ID. For the first stop in a vehicle trip, a buffer time of 5 min before the departure of the vehicle is considered for assigning the passenger trip to that vehicle trip. With this algorithm, 92% of the bus and tram trips could be matched to a corresponding vehicle trip, and of these 88% could be matched based on destination also. It is noted that there are other more rigorous methods available to match the remaining smartcard data to AVL data ( 24 ), but because that is not the focus of this work, this was not undertaken. Instead, for the passenger trips for which a corresponding vehicle trip could not be found in the AVL data, the tap-in and tap-out times have been considered as the trip start and end times.
Although the Dutch smartcard system requires tap-in and tap-out for all modes, ~3.5% of transactions have missing tap-outs for buses and trams. In the absence of the smartcard ID, it is not possible to infer destinations for these records, and they are therefore removed from the data.
Transfer Inference
Because the purpose of this study is reliability measurement, it is crucial that this step is carried out accurately as an incorrectly classified transfer may add extreme values of travel times, increasing thus the measured reliability. The transfer criterion of 35 min applied by the operator is very generous and may include some activities wrongly classified as transfers. Therefore, this study applies four additional transfer inference criteria derived from ( 21 , 22 ):
Two consecutive journey legs on the same line in either direction are not classified as a transfer.
Only those legs are considered as a transfer in which the passenger boarded the first vehicle which arrived after the passenger reached the next boarding stop. This has been calculated by estimating the walking distance as
Transfers occurring with a Euclidean distance of more than 750 m ( 21 ) between the two stops are not considered as transfers.
Circuity of more than 2.5 is classified as an activity. This has been applied to prevent back and forth trips on different but parallel lines from being classified as a transfer.
Waiting Time Distribution
The waiting time for journeys with bus/tram as the first mode is estimated by assuming uniform arrivals over the observed headway for each vehicle trip for each stop. For the vehicle trips for which the observed headway was not available (such as the first vehicle trip in the day), the headway was assumed as the average of the observed headways during the hour. Additionally, for the stops with headway longer than 15 min for a line, such as when a stop was skipped during certain runs, the waiting times have been distributed over 15 min (maximum planned headway) only.
RBT Calculation
With all the components of travel time available for each journey, RBT is calculated for each stop–stop pair and route combination for which a minimum of 20 observations (journeys) have been recorded. For Amsterdam, this represents 673,767 journeys spread over a total of 7,531 OD/route combinations.
Results and Discussion
Reliability per Mode
The RBT is calculated for each mode combination available in the data (Table 2) as the demand weighted average of RBT for each OD pair/route, as shown in Equation 4. Based on the observed data, journeys with only metro are found to be the most reliable, followed by the single-leg journeys using bus or tram modes. Because of separate right-of-way and no disruptions observed during selected days, there is negligible variation in in-vehicle time component for metro journeys and the RBT is primarily contributed by the variation in waiting time component of the journey (including at transfers).
RBT for Different Mode Combinations
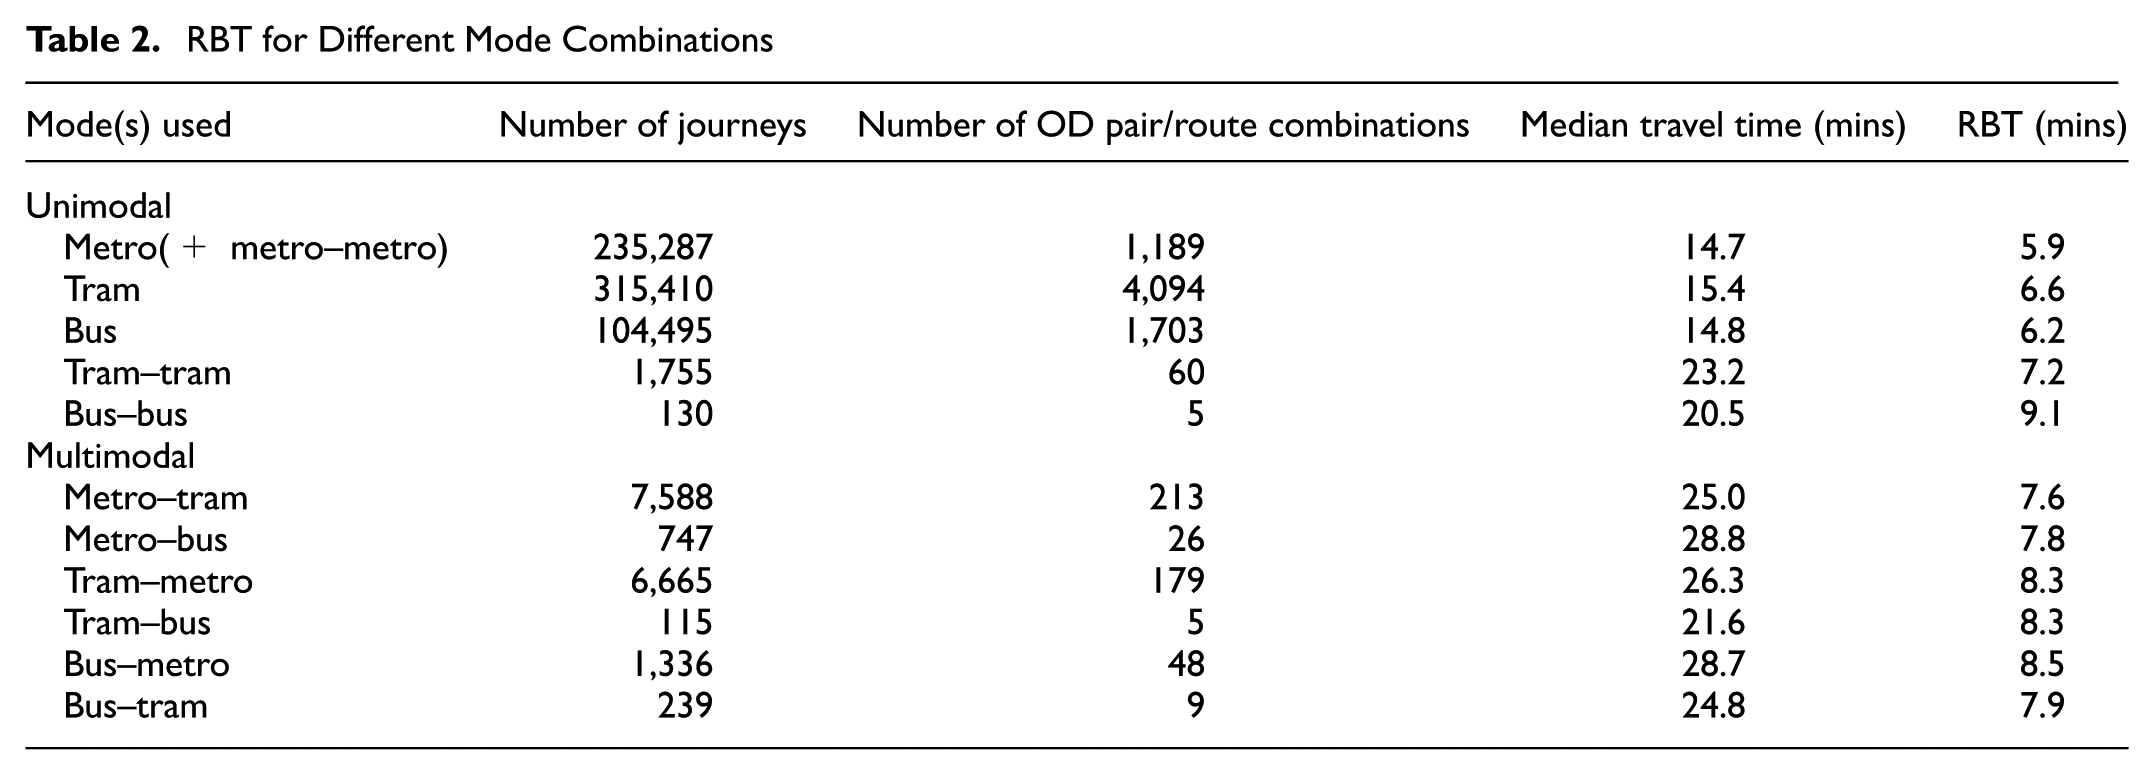
The tram network in Amsterdam serves the congested city center with mixed traffic, including bikes, and faces high passenger demand potentially causing lower reliability levels. Buses, on the other hand, tend to run on less central streets with lower demand levels and therefore less crowding variation, making them relatively more reliable for single-leg journeys. However, the frequency of buses is typically lower—making the journeys with intramodal transfers less reliable for buses than for trams.
Journeys with intermodal transfers do not show major variations between different mode combinations. That a transfer is involved increases RBT, with a lesser importance to the specific combination of bus, tram, or metro between which the transfer is made. It should be noted here that because RBT is measured in absolute terms, it is expected to be higher for journeys with transfers because of typically longer journey lengths.
Differences are also found in the distribution of RBT across OD pairs by mode(s) used (Figure 4). Only the mode(s) with a minimum of 40 OD/route combinations have been presented here. It is observed that the spread of RBT values across OD pairs is much wider for journeys with transfers compared with the ones without a transfer, possibly because of longer journey lengths for transfer journeys. Routes connected by single-leg bus journeys are found to have not only the lowest average RBT value but also the lowest variation of RBT across different routes. The largest spread of RBT is seen for the tram–tram transfer journeys. It is noted here that Table 2 shows the RBT as the demand weighted average whereas Figure 4 shows the spread of RBT over OD pairs. Therefore, although RBT for metro seems to be higher when looking at the distribution across OD pairs, more passengers seem to use the lower RBT metro routes, bringing down the overall RBT (Table 2).
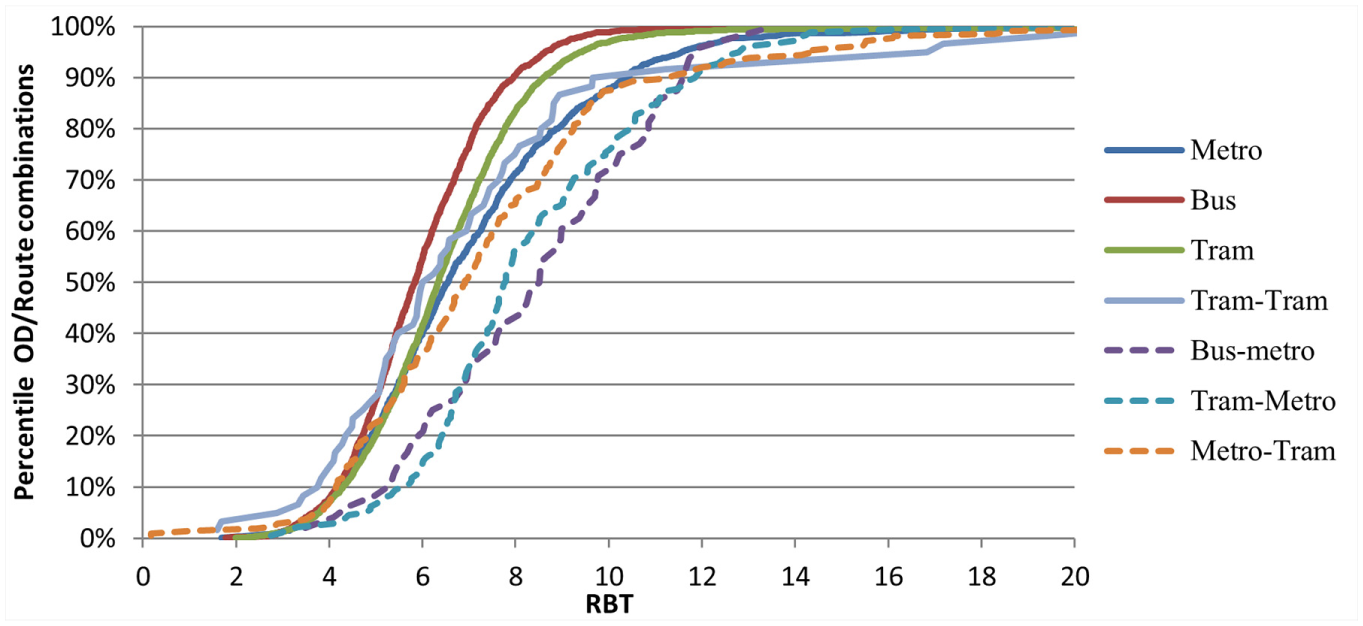
Distribution of RBT across OD pair/route combination by mode(s) used.
Reliability of Accessing Transit Hubs
The developed RBT can be used to analyze the reliability of a transit stop to/from all other origin/destination transit stops, as obtained using Equation 2. Figure 5 shows the spatial distribution of RBT values for journeys from various transit stops to two major train stations (Amsterdam Central and Sloterdijk) by various modes. The size of the circles represents the RBT from that origin to the selected train station.
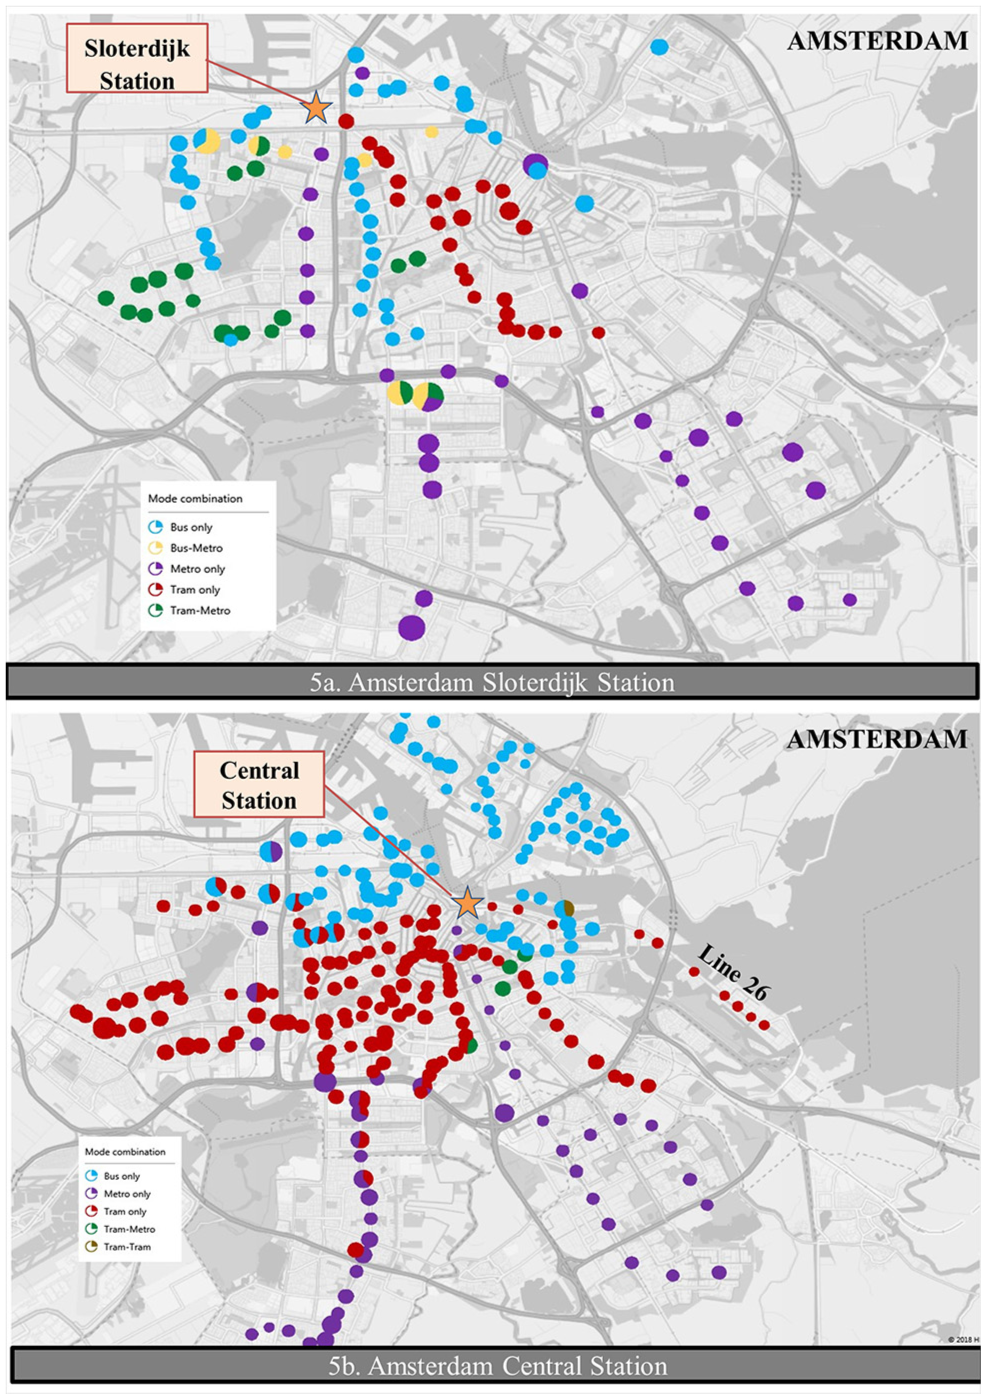
Reliability to transit stops using different modes.
The Sloterdijk station is situated outside the city center. Consequently, it can be reached in a relatively reliable way, from all directions and with all modes. In the South and in the Southeast of the city two metro branches can be observed that are less reliable, which makes sense because a transfer is needed to reach Sloterdijk from these branches. Moreover, the combined mode of tram and metro seems relatively less reliable for Sloterdijk.
To and from the Central Station most destinations are reached without a transfer. The metro branches to the Southeast of the city as well as the buses to the North are found to be relatively reliable. Reliability by trams seems relatively lower except for tram line 26 to the East of the city which avoids the crowded city center.
Reliability per Route
Next, the RBT for different routes for the same OD pair is investigated. Four route alternatives are available between the origin–destination pair of Station Sloterdijk to Boelelaan (Figure 6). One could either take a metro (with a transfer at Amsterdam Zuid station), or take the metro until Amstelveenseveg station and from there bus 62 or trams 16 or 24.
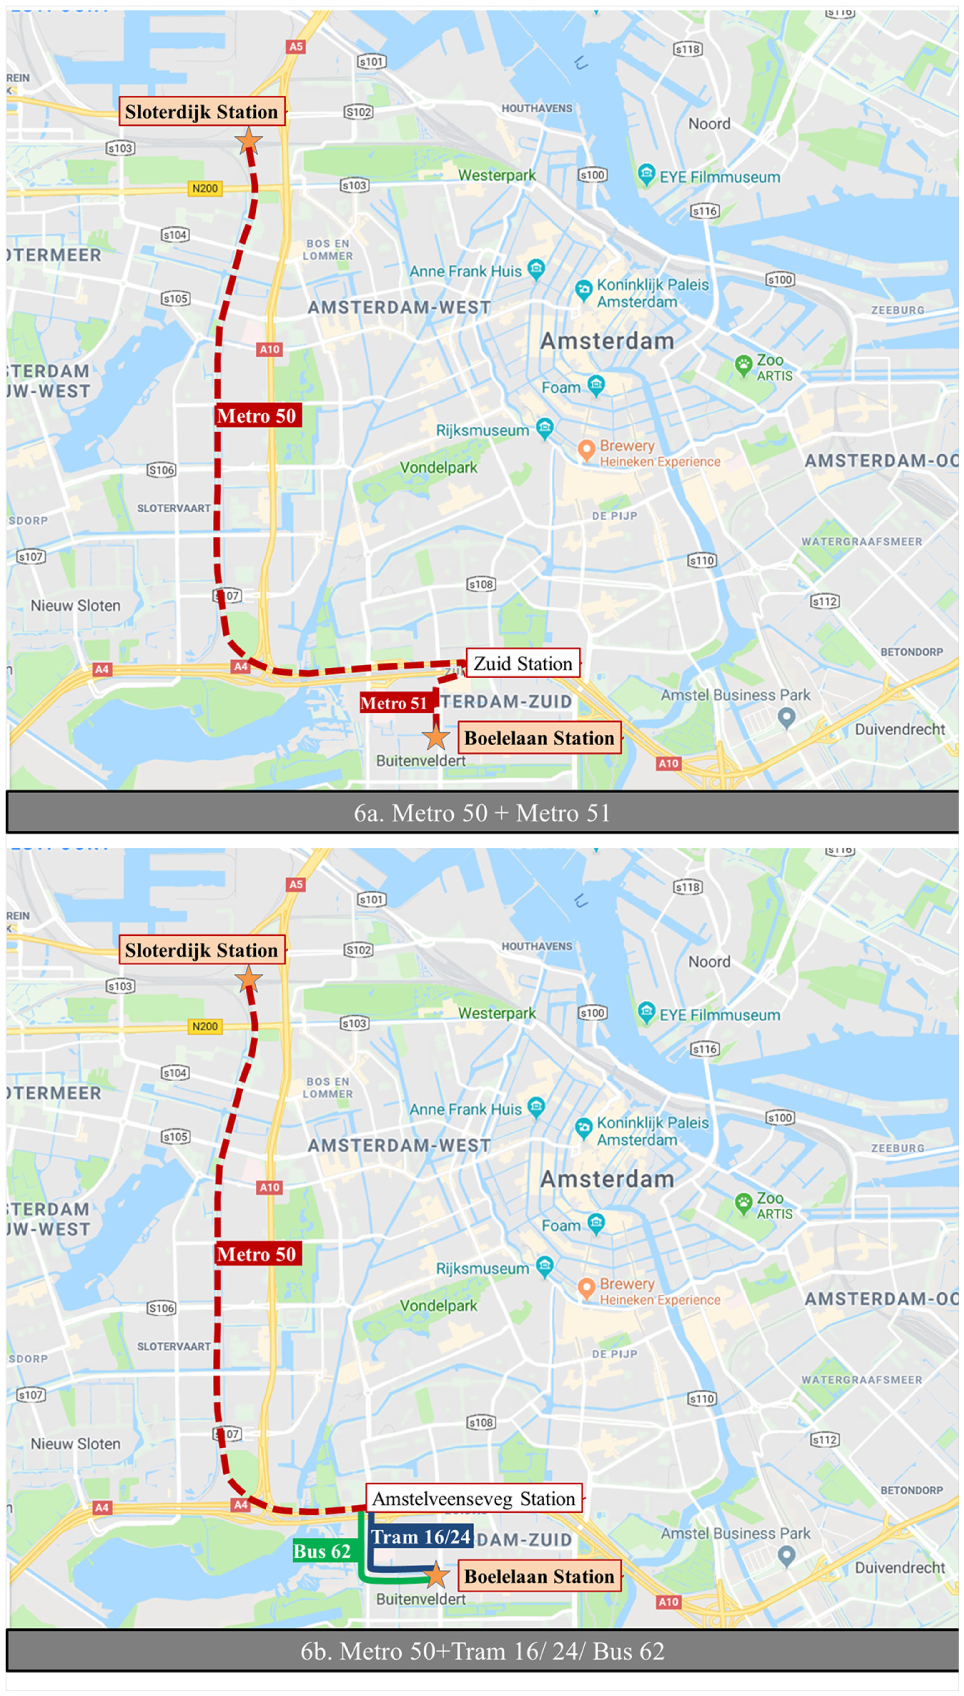
Observed passenger routes from Sloterdijk to Boelelaan Station.
Based on the data, it is seen that RBT is in this case in fact the highest for metro and lowest for the route with metro and bus together (Table 3). This example highlights that aggregating RBT across routes/modes/OD pairs ignores the variations observed between different areas and routes. Measuring RBT at a route level gives more detailed and actionable results of reliability.
RBT per Route for Station Sloterdijk to Boelelaan
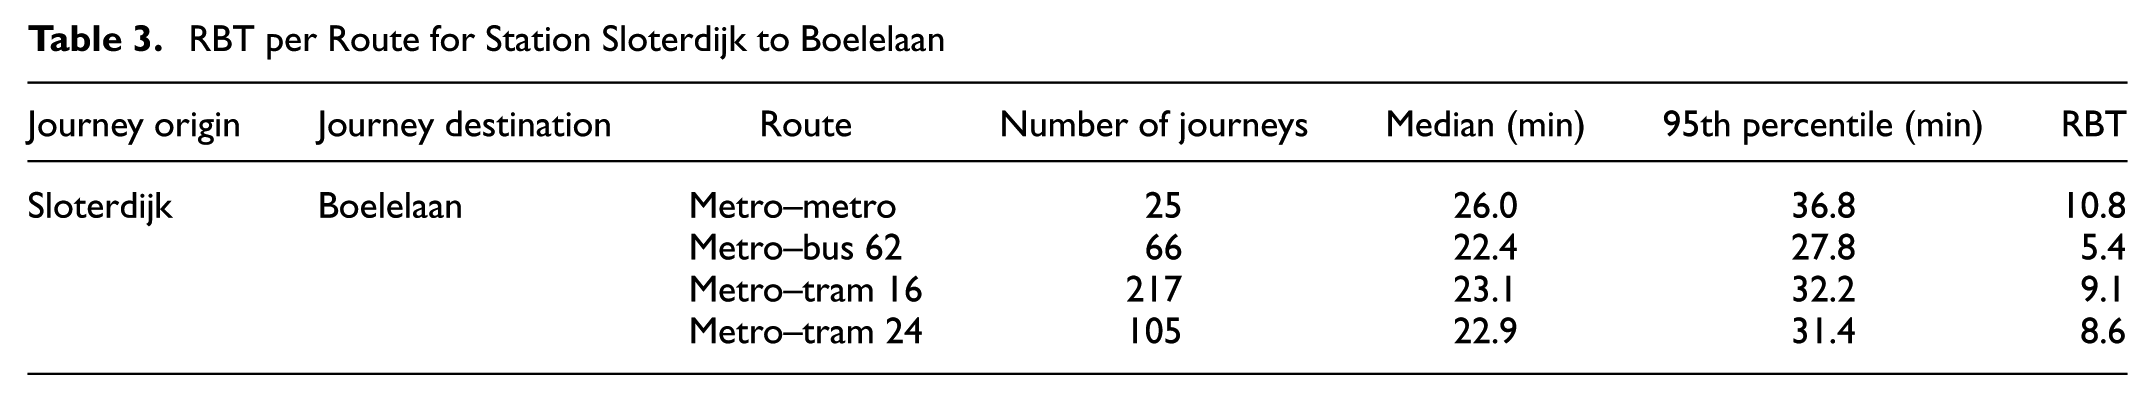
It is also noted that the number of journeys is least for the metro–metro route. This is expected as not only the RBT but the median travel time is also the highest for this route. Tram routes 16 and 24 overlap, which is also reflected in the similar travel times and RBT for these routes.
Looking at the journey time distribution for different routes (Figure 7), it is noted that the route with metro and bus services has a steep slope of travel time indicating a more reliable service. The metro route on the other hand has a jump in travel time just before the 90th percentile value—potentially because of the passengers missing the metro at the transfer station and having to wait another headway (10 min).
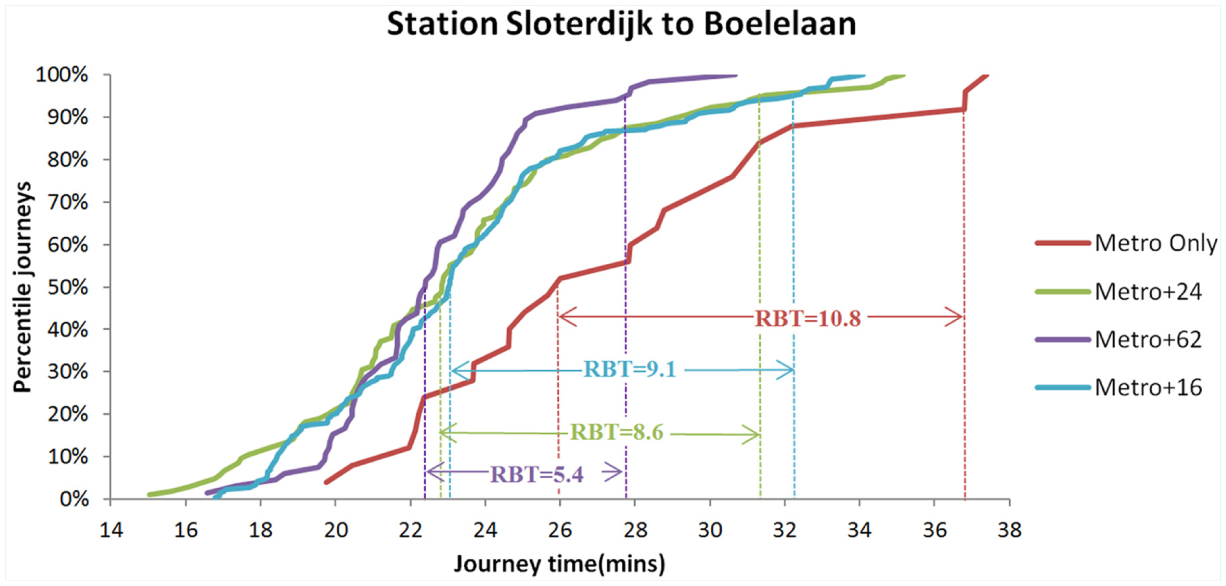
Journey time distributions and RBT for different routes from Station Sloterdijk to Boelelaan.
Conclusions
This research proposes a new metric for travel time reliability measurement, considering multimodal transit journeys, including waiting and transfer times for all legs of the journey. The developed metric can be calculated using a combination of smartcard and AVL data, which was demonstrated by applying it to the Amsterdam transit network. Because the chosen smartcard data do not measure the waiting time for bus and tram journeys, a method to estimate the waiting time for each journey starting with these modes was proposed, based on the observed headway from AVL data. Based on the semantics of the smartcard system applicable, the method can be modified and applied to other networks.
Because the reliability metric is developed at a very disaggregate level (i.e., for each OD pair/route combination), it provides flexibility of aggregation across various dimensions depending on the goal. The case study demonstrated its application by aggregating across three dimensions—mode, transit stop, and routes.
Aggregating the RBT at a larger scale such as at the mode level provides an overall picture of reliability. This can for example be used for reliability impact analysis of policies affecting one or more transit modes. In the Amsterdam case study, it was observed that for single-leg journeys, trams in the city center are the least reliable. For multiple legs however, a bus to bus transfer was found to be the least reliable of all, possibly because of the longer headways and consequently longer transfer times because of missed connections.
However, aggregating at such a large scale ignores the variations in reliability between different OD pairs and routes. For example, in the case study it was seen that for the journeys from Sloterdijk to Boelelaan station, the RBT was highest for the route with metro only compared with the other three routes consisting of metro in combination with either bus or trams. This type of information can be used to address specific unreliability issues for a particular route/OD pair. Route level RBT can also be used as a direct input to behavioral models such as route choice models.
The RBT can also be compared for different origin/destinations from a selected transit stop/hub. This can for example be used to analyze from which locations and using which modes is the unreliability largest, providing policy makers with information on urgency of reliability issues across the city.
The case study demonstrated some of the potential applications of the developed method. However, because of the low sample size (only 2 days), the analysis was undertaken for a longer time period within the day (7 a.m. to 7 p.m.). As future work, this method could be applied to a larger dataset enabling analysis at an hourly level. The RBT can then be used to compare progress in performance over time or between different time periods during the day.
Based on the available data, simplifications were made leading to some limitations of the work. First, it was assumed that the passengers boarded the first vehicle that arrived in case of bus and tram modes. In case of overcrowded vehicles (for example caused by vehicle bunching) in reality passengers may prefer to take the next arriving vehicle. However, for metro the time measured by smartcard already includes the potential delay caused by denied boardings. Additionally, this study did not consider the impacts of availability of real-time information on passenger arrivals and their waiting time distribution. Although only short headway services were considered, it is common for passengers to consult the real-time arrival information before arriving at the transit stop. Further research could focus on addressing these limitations of the analysis.
Footnotes
Acknowledgements
This research was funded by the municipality of Amsterdam, Vervoerregio Amsterdam, and the AMS Institute. The authors thank GVB for providing data for this research. The authors also thank Menno Yap for his help with the transfer inference algorithm.
Author Contributions
The authors confirm contribution to the paper as follows: study conception and design: M. Dixit, T. Brands, N. van Oort, O. Cats; data collection: T. Brands; analysis and interpretation of results: M. Dixit, T. Brands; draft manuscript preparation: M. Dixit, T. Brands. All authors reviewed the results and approved the final version of the manuscript.
The Public Transportation Group (AP000) peer-reviewed this paper (19-04568).